1. Introduction
The rise in temperature has disrupted the heat balance in urban environments by significantly increasing LST worldwide. Like other major metropolitan areas, cities across the United States have experienced substantial warming, intensifying the urban heat island (UHI) effect, meaning the phenomenon of urban regions getting notably warmer than their rural and suburban counterparts [
1,
2]. The UHI issue poses significant public health risks in U.S. cities with the prevalence of heat-related illnesses such as heat stroke, heat exhaustion, and heat cramps. It also exacerbates energy consumption, air pollution, and mortality rates [
3,
4]. The primary cause behind urban warming is the retention of heat by materials like metal, brick, and concrete. Modification of land use in urban areas with these materials disrupts urban thermal balance which consequently intensifies the UHI effect [
5,
6,
7,
8,
9,
10,
11,
12]. Despite the long recognition of the significance of UHI research, the issue has recently drawn the attention of urban planners [
13,
14]. Even though urban land use change and vegetation cover alteration have been previously identified as major physical factors affecting UHI [
15,
16,
17,
18], current research is focusing on unveiling the contribution of other urban physical, demographic and socio-economic drivers in the UHI effect. Distinct factors were found to be prevalent in the formation of UHI in unique spatial settings [
18]. This issue has been broadly acknowledged as a major urban environmental threat and has been studied in other fields of physical science, but the inauguration of UHI effect mitigation measures has recently been considered to comprehend zone-specific physical and socio-economic influencers of UHI.
This paper focuses on a Machine Learning (ML) methodology for identifying UHI mitigation strategies. This research is grounded in a practical application in an urbanized and populated city in Texas, USA, that requires immediate attention from the responsible authorities to act regarding UHI effect minimization. San Antonio highlights the growing challenge of UHI, with recent studies indicating a notable rise in temperatures within the downtown area compared to its suburban periphery. Despite various mitigation efforts, UHI remains a significant issue in the city [
19]. Effective mitigation requires identifying the most influential urban physical and demographic variables contributing to UHI formation. However, the UHI contributing factors might vary within the city with distinct spatial settings or zones [
18,
20]. The study focuses on five zones of San Antonio including residential, commercial, downtown, official, and industrial zone.
The research work aims to identify the significant urban physical and demographic factors responsible for UHI formation in different zones and examine the influence of vulnerable age groups (males and females over 65) in the UHI scenario in San Antonio. The study applies three machine learning-based algorithms: Random Forest (RF), Support Vector Machine (SVM), and Gradient Boosting Machine (GBM) to provide insights for zone-specific UHI mitigation measures. By testing the methodology on a real city experiencing rapid urbanization and increasing temperatures, this research aims to contribute to the broader understanding of UHI dynamics and climate justice in similar urban settings.
2. Literature Review
UHI research has evolved significantly over the past two decades, transitioning from observational studies to advanced data-driven approaches, particularly leveraging ML to analyze the spatial and socio-environmental dynamics of UHI. Early research emphasized the spatial distribution of heat in relation to urban land cover and impervious surfaces, while also identifying vulnerable populations exposed to heat-related risks [
21,
22]. With increasing urbanization and climate change, UHI effects have intensified, prompting cities across the U.S. to prioritize mitigation strategies. Recent advances have allowed researchers to examine both the physical characteristics of urban areas and the socio-demographic dimensions contributing to UHI formation. Lin et al. [
17] used RF models to demonstrate how green space morphology (especially the shape and continuity of vegetated patches) significantly impacts LST, offering crucial insights for heat mitigation through landscape design.
Tanoori et al. [
23] applied ensemble ML methods like support vector machines and gradient boosting to predict LST, identifying impervious surfaces, vegetation indices, and building areas as primary drivers of UHI across urban contexts. Their work confirmed that urban morphology remains a central factor in UHI formation. Yoo [
18] also emphasized this by integrating both physical and socio-economic data into a ML framework at the parcel level, finding that features like NDVI, building footprint, urban imperviousness, and tree canopy cover had a stronger influence on UHI than socio-economic indicators.
Yoo [
18] demonstrated that the relative influence of both urban and socio-economic factors varies across different spatial contexts or planning zones. Distinct zones within a city are characterized by specific human activities; for instance, urban imperviousness may be the primary factor in central business districts, whereas NDVI could be more influential in residential areas. Given that UHI contributing factors vary within a city across different spatial settings or zones, a comprehensive understanding of zone-specific physical and socio-economic influencers is essential. These insights underscore the necessity for zone or city-specific analyses of UHI drivers, as different cities may exhibit unique predominant factors contributing to urban environmental hazards.
Moreover, advanced ML methods such as XGBoost and RF have been applied to evaluate UHI intensity across spatial scales. Bushenkova et al. [
24] found that XGBoost outperformed conventional methods in capturing both surface and atmospheric UHI patterns in Madrid, showcasing the model’s adaptability across heterogeneous urban settings. These models can integrate a wide array of physical and social data such as albedo, building materials, tree cover, and socio-economic conditions, offering scalable, accurate insights into urban climate dynamics.
From a socio-environmental perspective, several recent studies underscore that lower-income neighborhoods are disproportionately affected by UHI due to factors like substandard housing and limited access to cooling infrastructure [
25,
26]. Furthermore, vulnerable age groups, particularly older adults above 65, are at heightened risk of heat-related illness and mortality during extreme events [
27]. However, their role as potential contributors to or modifiers of UHI has been less explored. If these groups do not influence UHI formation yet suffer its worst impacts, cities like San Antonio may be facing climate injustice, where the least responsible are the most affected. In this context, integrating social vulnerability into UHI modeling is essential. Li et al. [
28] demonstrated that urban green regeneration, through green roofs and reflective surfaces, reduced summer UHI intensities and improved thermal comfort in vulnerable districts. Pigliautile et al. [
29] demonstrated that high-albedo pavements significantly reduced air temperatures, while greenery had limited cooling effects at the inter-building scale due to its smaller surface coverage. Similarly, Shi et al. [
30] revealed spatial disparities in UHI intensity across the Yangtze River Delta, highlighting the need for localized, equity-focused mitigation strategies. This study, therefore, investigates the relative importance of both urban physical and socio-demographic variables influencing UHI across distinct planning zones in San Antonio, Texas. The findings will support targeted interventions and contribute to broader discourses on climate resilience and environmental equity in urban planning.
2.1. Contributions of This Work
Recent studies have increasingly adopted ML approaches to analyze UHI phenomena, yet most remain limited in scope or policy relevance. Yoo [
18] utilized RF to explore UHI drivers in Indianapolis but lacked model comparisons or zone-based insights. Bushenkova et al. [
24] applied XGBoost effectively, though it focused primarily on physical variables and did not engage with planning needs. Similarly, Lin et al. [
17] emphasized green space morphology in Shenzhen using RF but omitted social factors and stakeholder perspectives. Ghorbany et al. [
25] provided a broad review of UHI and ML research, identifying the need for integrated, planning-driven studies, yet stopped short of empirical implementation. In Shiraz, Tanoori et al. [
23] applied DNN and XGBoost to configuration metrics without addressing socioeconomic influences. Oliveira et al. [
31] offered an advanced, energy balance-guided ML model for nocturnal SUHI prediction but remained detached from policy frameworks.
This study offers a methodological contribution to the field of urban climate analysis by addressing several key limitations in existing UHI research. Unlike previous studies that often rely on a single machine learning model or overlook spatial functional distinctions, this research employs a comparative evaluation of three machine learning models Random Forest (RF), Support Vector Machine (SVM), and Gradient Boosting Machine (GBM) to predict land surface temperature (LST) patterns. It uniquely adopts a zone-based approach analyzing LST variations across five distinct urban functional zones in San Antonio. Furthermore, the proposed methodology integrates both physical and social variables, which are frequently omitted in UHI modeling, and incorporates insights developed in collaboration with city planners. This cross-sectoral and spatially nuanced methodology not only strengthens the robustness of the findings but also enhances their practical relevance for urban heat mitigation and policy planning.
From the application view, this work was developed in direct collaboration with city planners, offering zone-specific insights and mitigation strategies that bridge scientific modeling with practical urban climate resilience planning. This makes the study not only more methodologically robust but also uniquely actionable in guiding equitable, data-driven UHI mitigation efforts.
Table 1 represents the summary of the reviewed literature for research gap identification and the novel contributions of the study in the field of UHI research.
2.2. Quantifying Relative Importance of Variables
To identify the key physical and demographic factors contributing to UHI formation and to understand the role of vulnerable age groups, this study employs a ML approach. Previous studies have utilized methods such as correlation analysis, simple regression, and spatial regression for quantitative analysis of UHI factors [
32,
33,
34,
35].
However, ML models, particularly ensemble methods like RF, have demonstrated superior performance in capturing complex, non-linear relationships among variables. The RF method has been effectively used to quantify the relative significance of physical and demographic variables in UHI research [
6,
33]. In addition to RF, SVM and GBM have also been applied in UHI studies to assess variable importance [
17,
24,
31].
For instance, a study conducted in Da Nang, Vietnam, employed SVM and GBM, among other models, to analyze the spatial variation of LST. The study found that GBM outperformed other methods, achieving R
2 values up to 0.92. This underscores the efficacy of GBM in modeling complex environmental phenomena like UHI [
36]. Moreover, GBM has been utilized to analyze climate vulnerability indicators across multiple global cities. A study applied GBM to measure the importance of various variables in predicting exposure to extreme weather events. The findings highlighted that non-traditional variables were more relevant to self-reported exposure to extreme weather events than traditionally employed variables such as income or age. This suggests that GBM can effectively identify critical factors influencing climate vulnerability, which is pertinent to UHI research [
37].
While previous studies have demonstrated the utility of RF, SVM, and GBM in predicting land surface temperature and identifying physical drivers of urban heat islands (UHI), this study advances the field by situating these models within a spatially explicit and socially informed framework. By incorporating both physical and socioeconomic variables across functionally distinct urban zones in San Antonio, the research moves beyond technical application to generate context-sensitive insights. This approach enhances the interpretability and policy relevance of machine learning outputs, offering empirically grounded guidance for the development of equitable and spatially targeted UHI mitigation strategies.
3. Methodology
3.1. Study Area
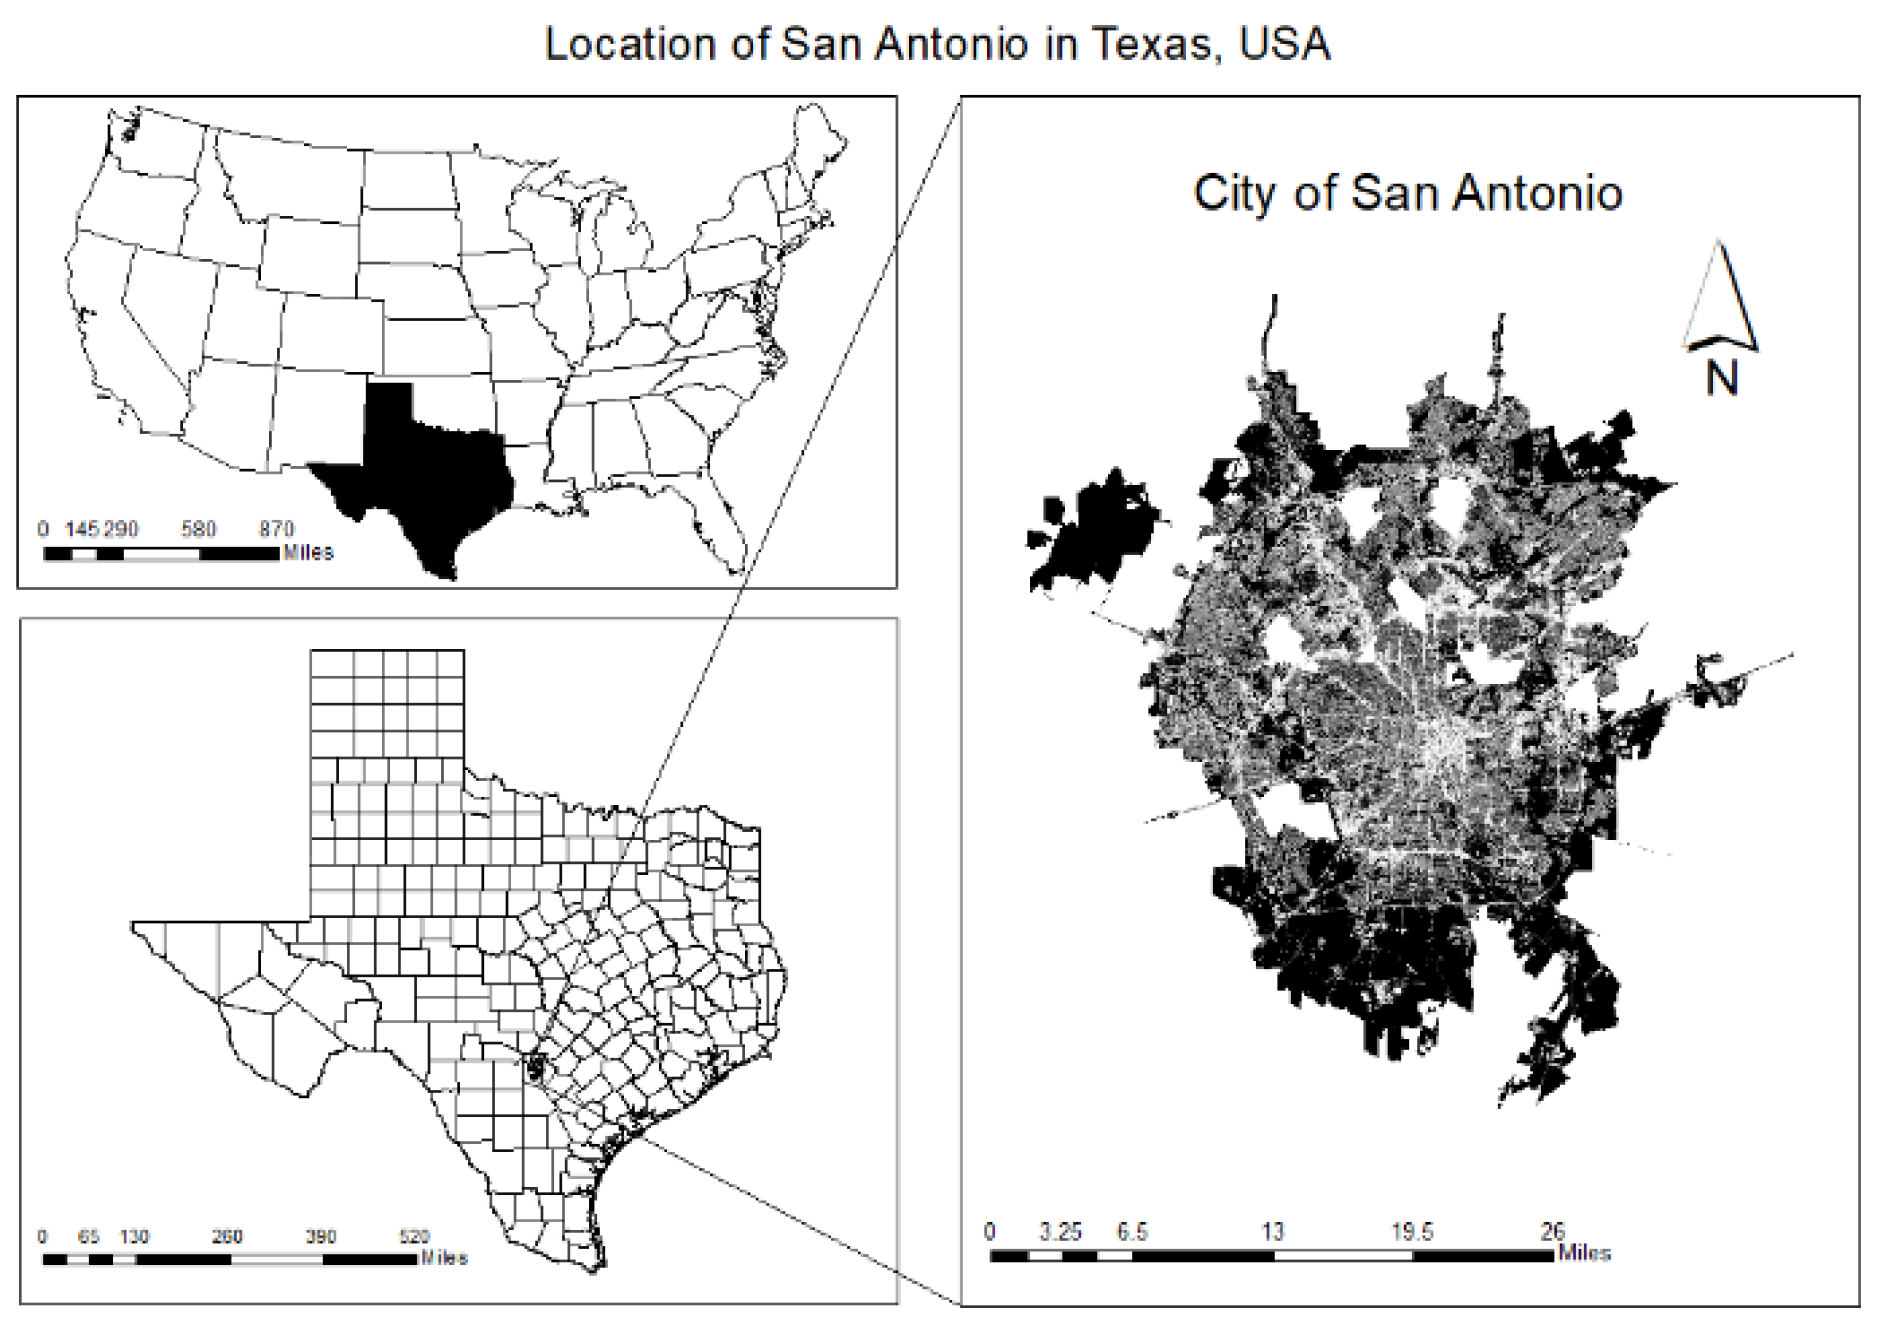
San Antonio, located in Texas (
Figure 1), is the third-largest metropolitan region in Texas and the 24th-largest in the United States, with 2.6 million population according to the 2020 U.S. Census. It is also ranked as the seventh most populous city in the U.S. Moreover, San Antonio is the second most populous in Texas after Houston [
38]. The statistics and rankings denote the highly urbanized characteristic of San Antonio city. It has undergone rapid growth, ranking second in population growth among major U.S. cities in 2019, which boosted the UHI effect in the city where the atmospheric and LST of the downtown core area was found to be warmer than its surrounding regions in previous studies and news articles [
19], making it an appropriate study area for the research.
The study area was selected due to its well-documented history of heat-related challenges [
21,
22,
39]. Moreover, the availability of high-quality satellite and demographic data facilitated the examination of the UHI drivers. Finally, the city’s ongoing efforts for UHI mitigation offer a valuable context to conduct the research.
3.2. Data Acquisition for Urban Physical and Socio-Economic Variables
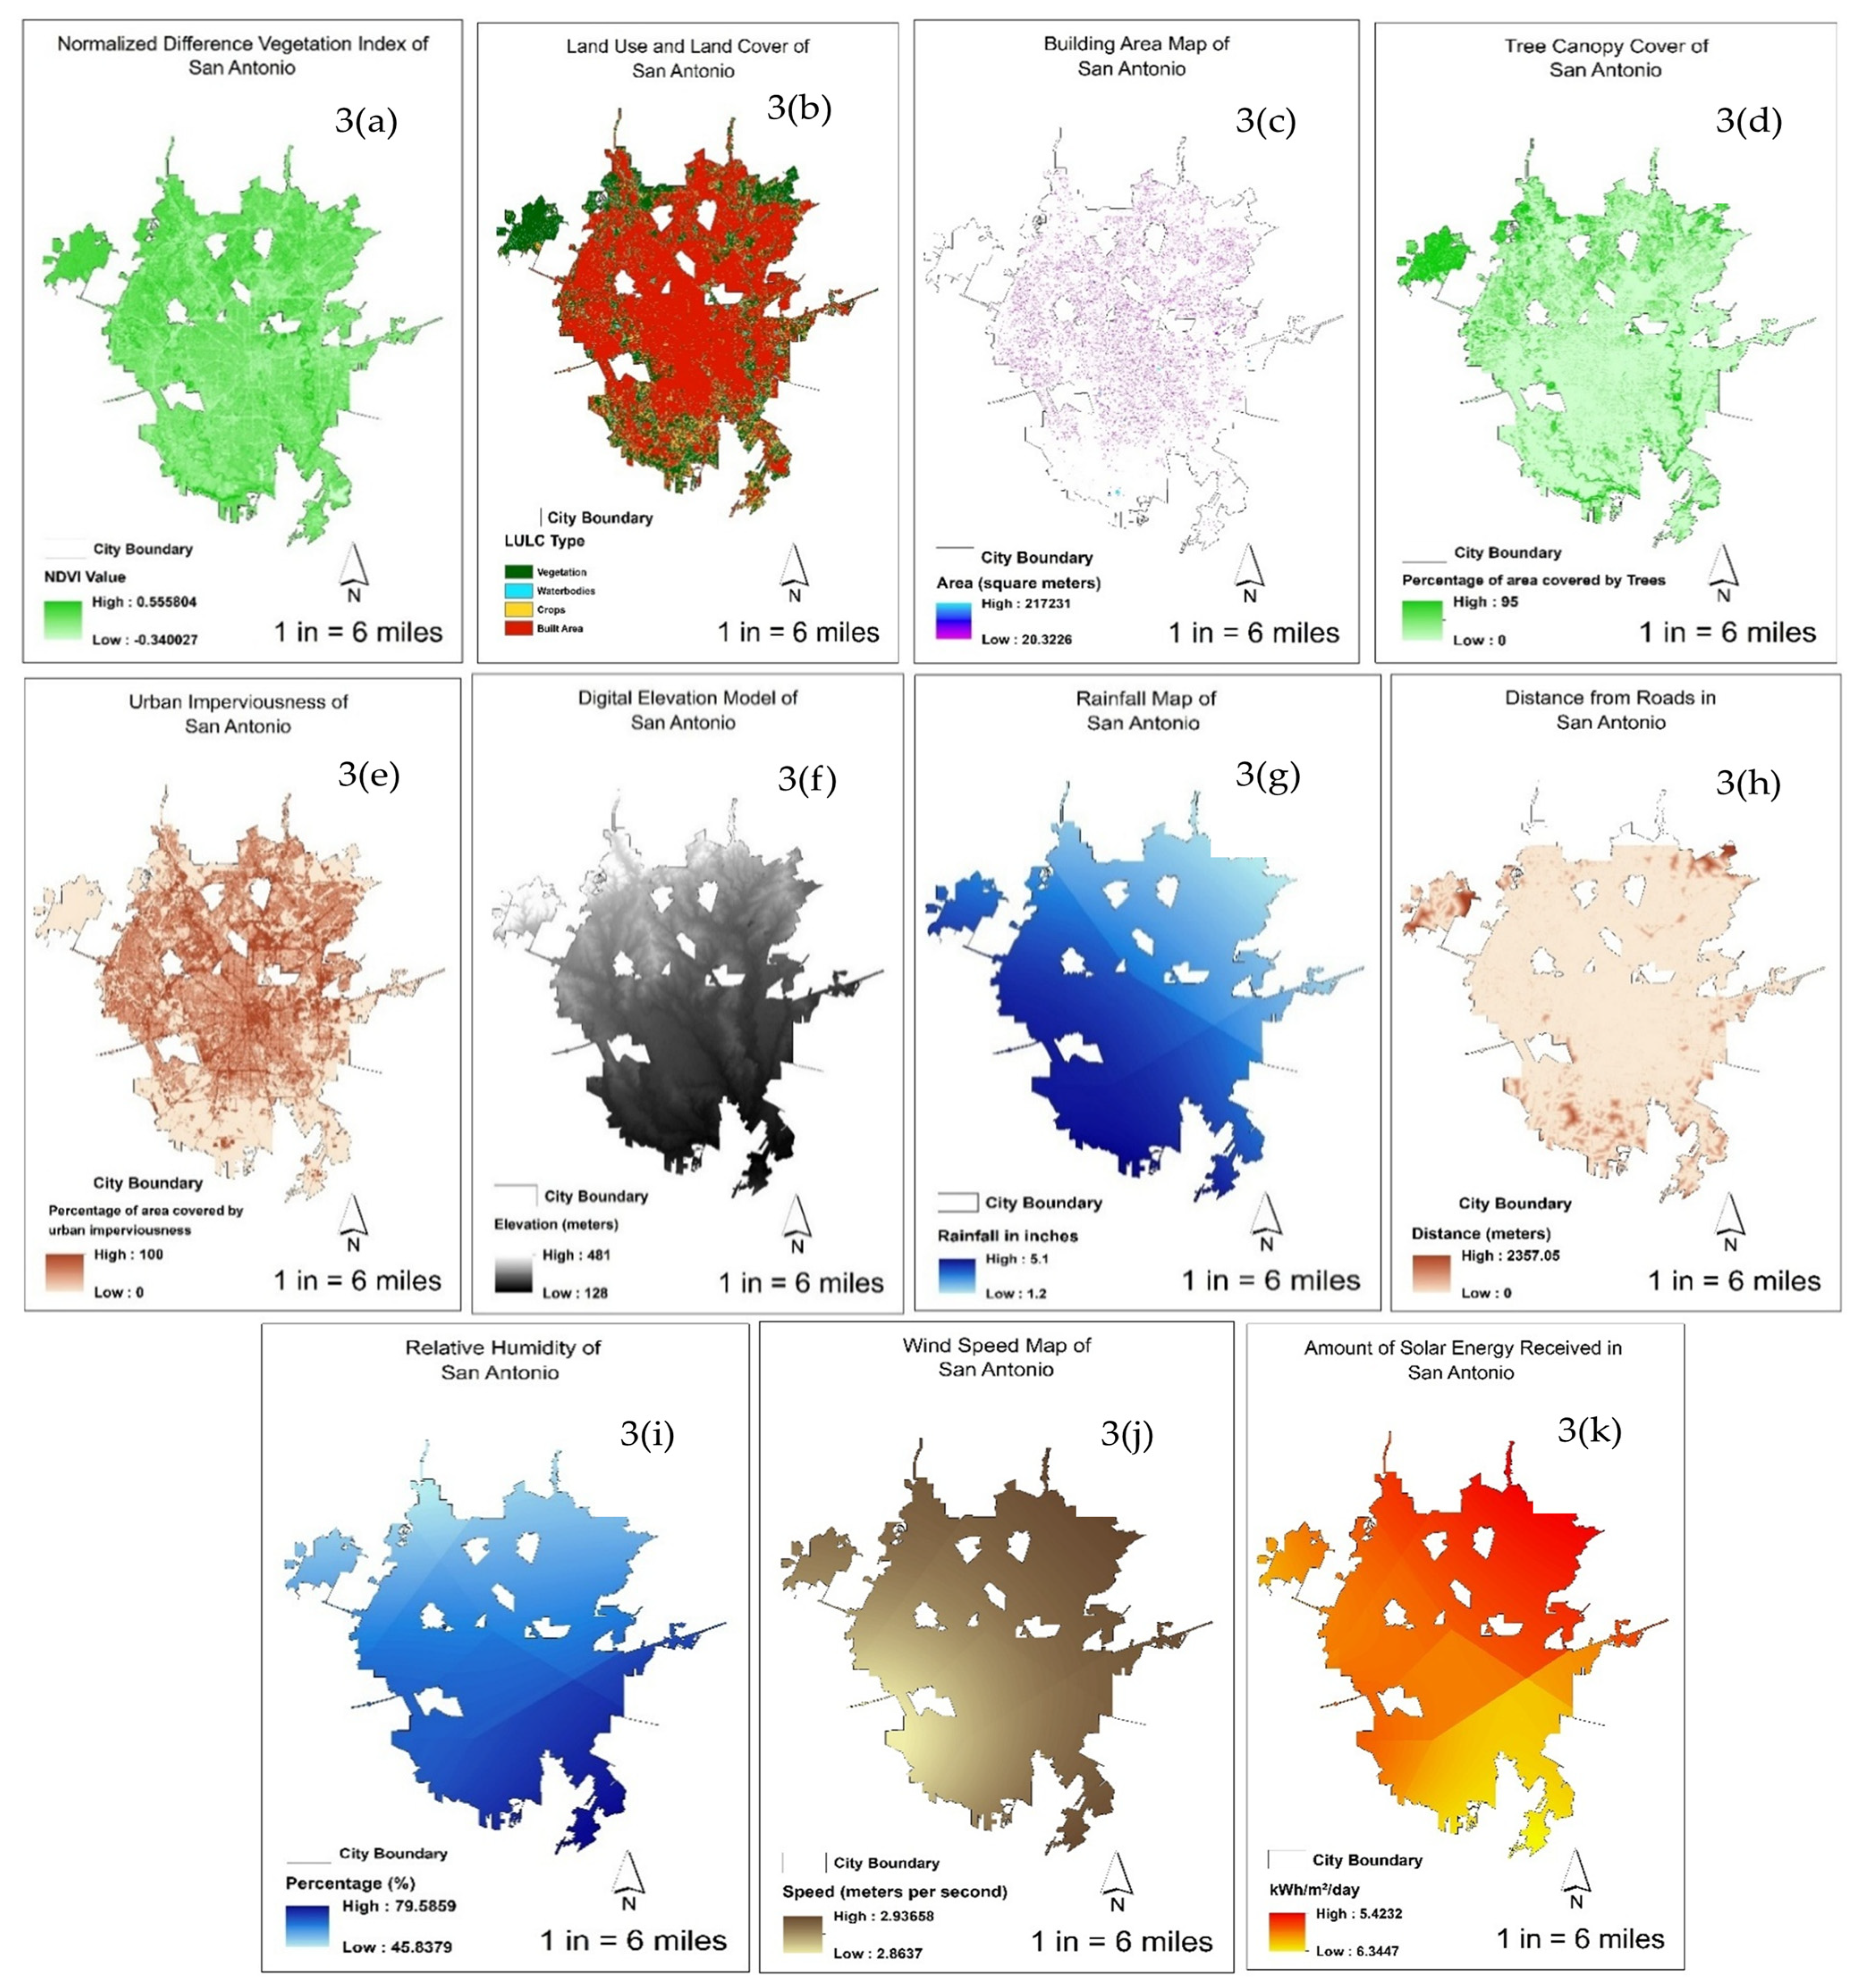
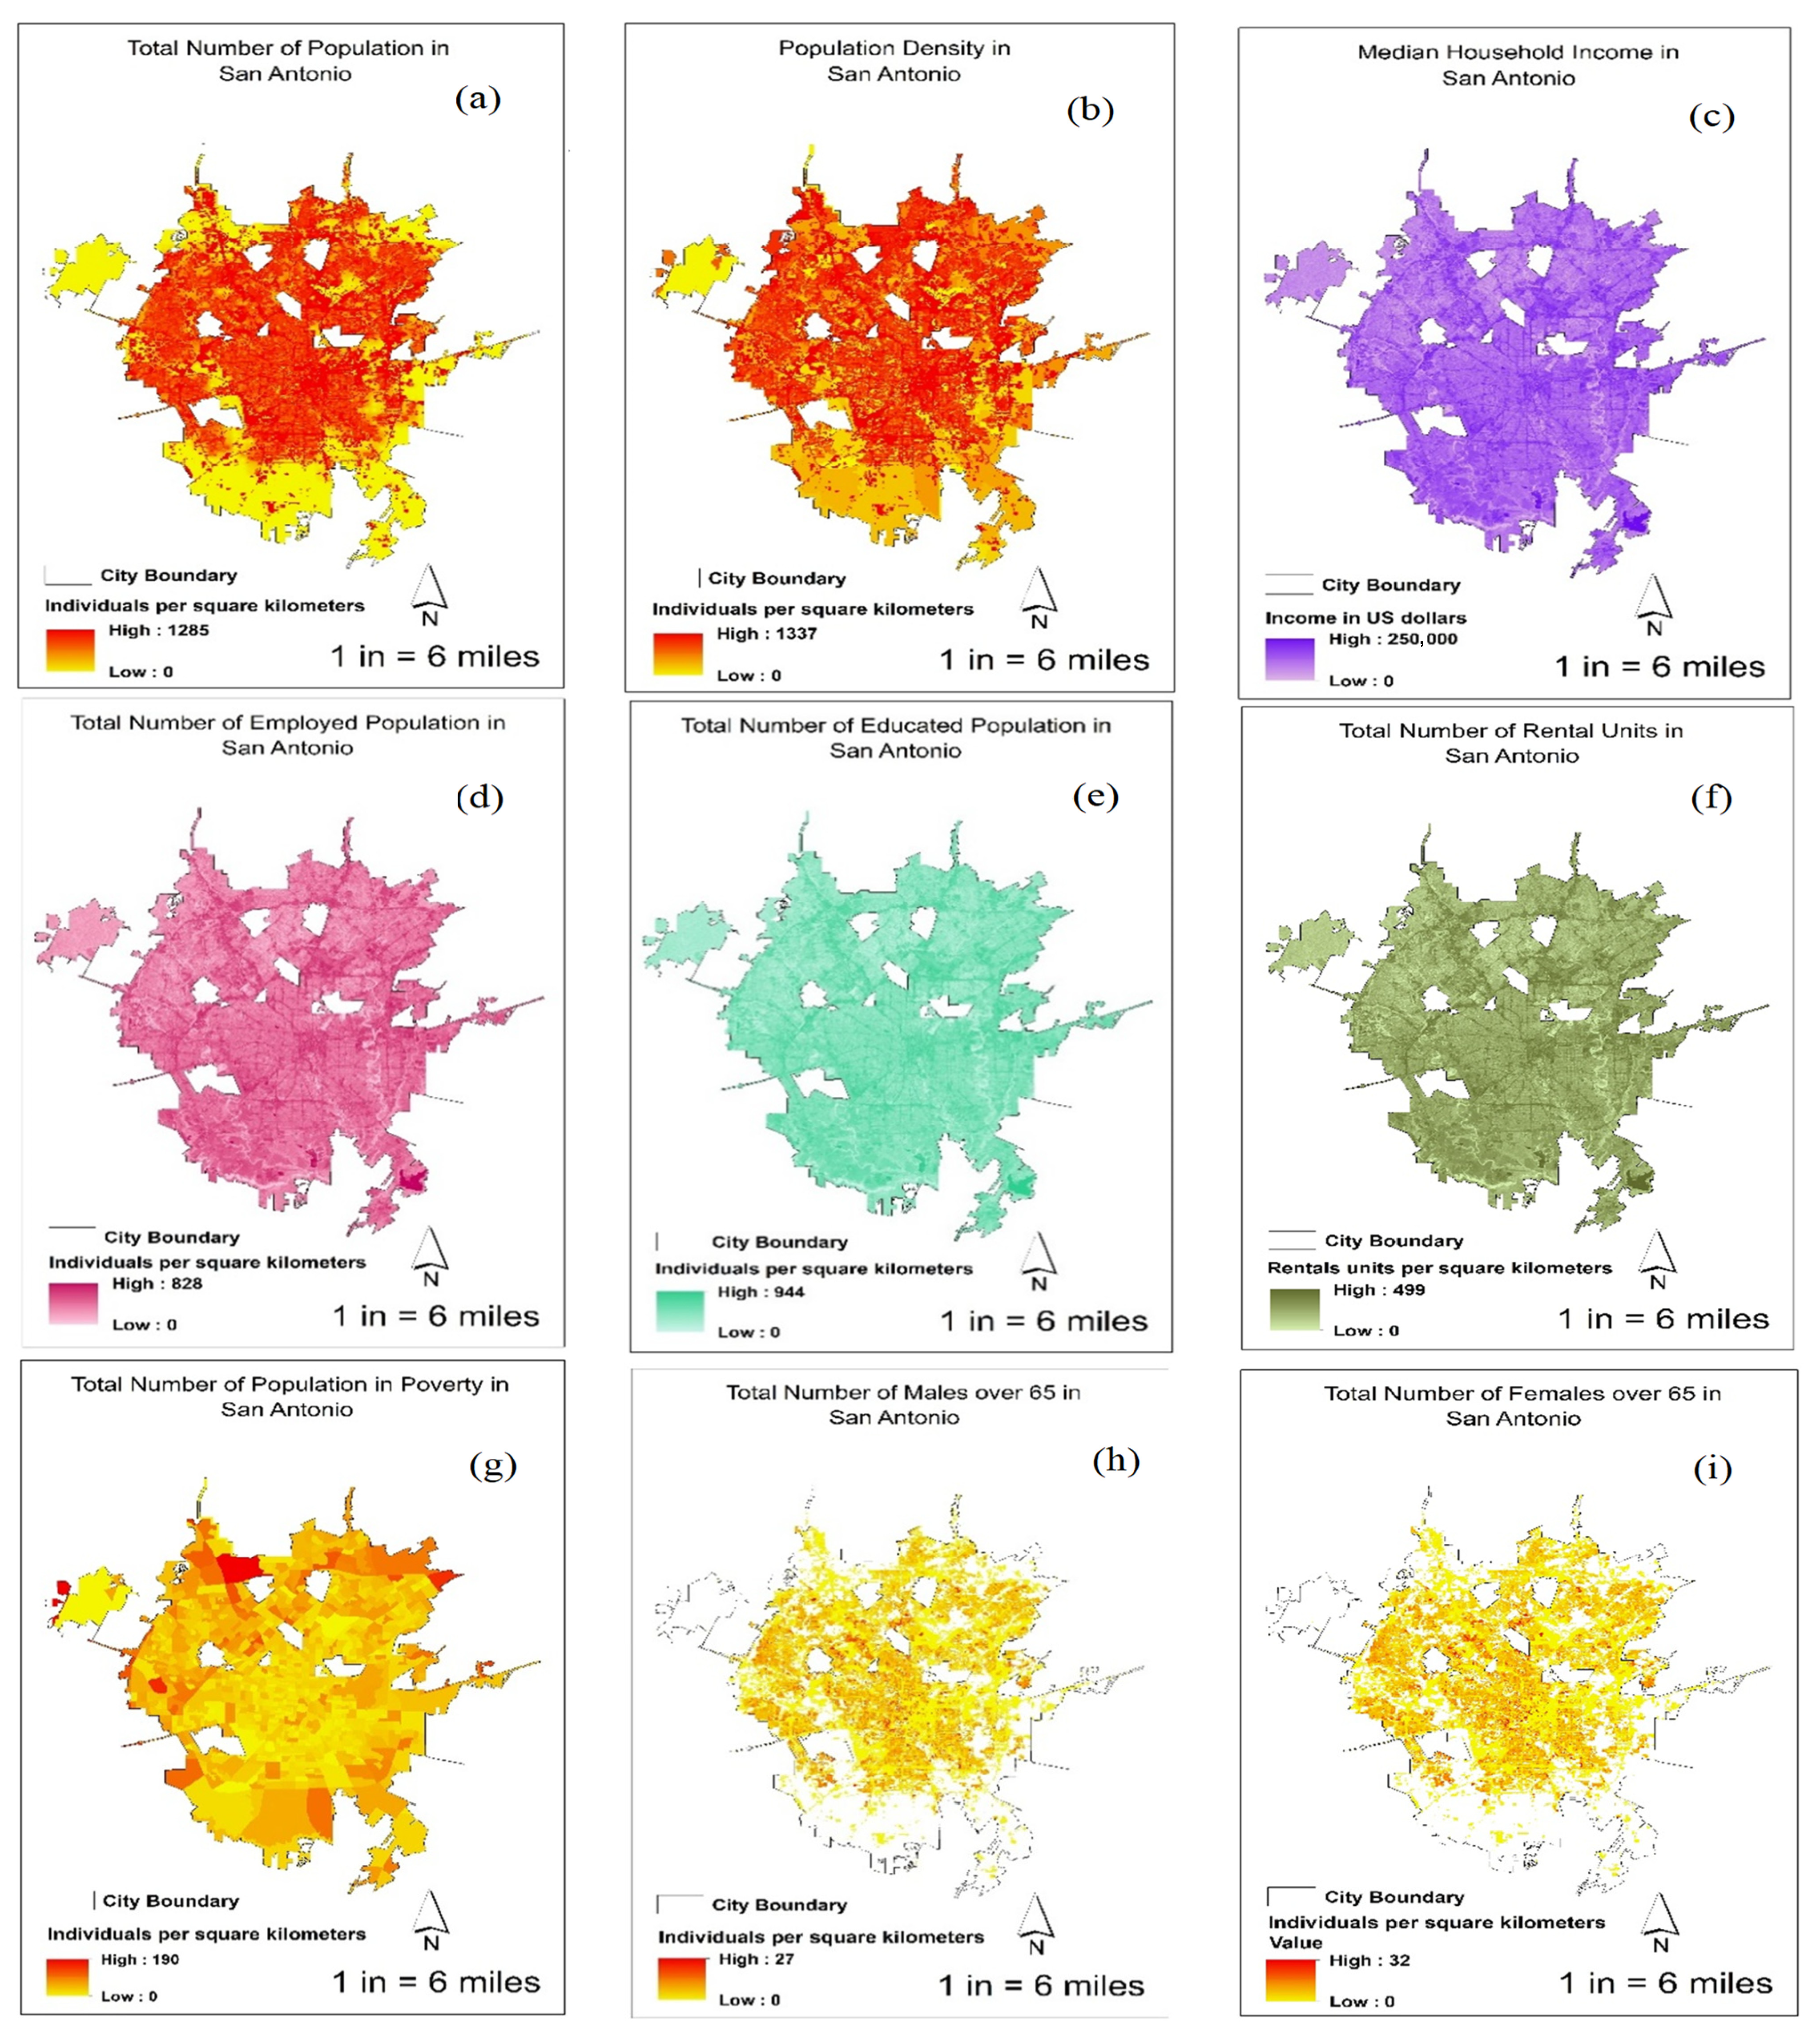
Landsat 8 collection 2 level 1 satellite image of 27 August 2023, was processed to analyze the LST and (NDVI). It was validated from several online local news articles that the day was cloud-free and a hot summer day. The selection of this date ensures the accuracy of temperature measurements and minimizes data anomalies caused by cloud cover. Additional physical and socioeconomic variables were obtained from ACS and other reliable open-access databases [
40,
41], ensuring comprehensive coverage of the factors influencing UHI. In this study, we selected variables based on their relevance in previous research where urban physical variables are: NDVI, LULC, building area, tree canopy cover, urban imperviousness, elevation, distance from roads, rainfall, relative humidity, wind speed, and solar influx, and socioeconomic factors are: total population, population density, median income, educational attainment, employment status, total rental units, poverty status, and the population of males and females over the age of 65. These selections are justified by extensive literature demonstrating their proven relationship with the UHI effect. The Landsat 8 satellite provides high-resolution imagery, allowing precise calculation of land surface temperatures and vegetation indices.
Table 2 provides a summary of the variables used in the analysis.
The thermal infrared (TIR) band from an image was transformed into surface temperature using the methodology proposed by Weng et al. [
34]. Initially, the digital number (DN) of the Landsat 8 TIR band (band 10) was converted to spectral radiance according to Equation (1). Subsequently, this spectral radiance was converted into Top of Atmosphere Brightness Temperature (°C) (BT) under the assumption of uniform emissivity using Equation (2):
In these equations, Lλ = Spectral radiance, and K1 and K2 are pre-launched calibration constants, where for Landsat 8, K1 = 774.8853 mW cm−2 sr−1μm−1 and K2 = 1321.0789 mW cm−2 sr−1μm−1.
The LST corrected for emissivity was then computed using:
λ = Wavelength of emitted radiance = 10.8
E = Land Surface Emissivity,
c = Velocity of light = 2.998 × 10⁸ m/s
s = Boltzmann’s constant = 1.380649 × 10⁻²³ J/K
h = Plank’s constant = 6.626176 × 10⁻³⁴ Js,
C2 = h × c/s = 1.4388 × 10⁻² mk = 14388 μk,
Moreover, NDVI was calculated using this formula:
where RED = DN values from the red band
NIR = DN values from near infra-red band
The (NDVI) is derived from the contrast between visible and near-infrared reflectance from plant canopies and the reflectance of these spectra from the atmosphere which assists in understanding the vegetation condition of an area [
34,
35]. The calculation of LST and NDVI was conducted using ArcMap 10.8 software.
Urban Heat Island (UHI) is commonly characterized by the temperature contrast between urban and rural environments. It can also be interpreted as a measurable indicator reflecting the influence of urban surfaces on both local and regional climate conditions. In this study, UHI was quantified using land surface temperature (LST) data as the primary metric [
42].
where T is LST and
is LST mean, and
is the standard deviation of LST.
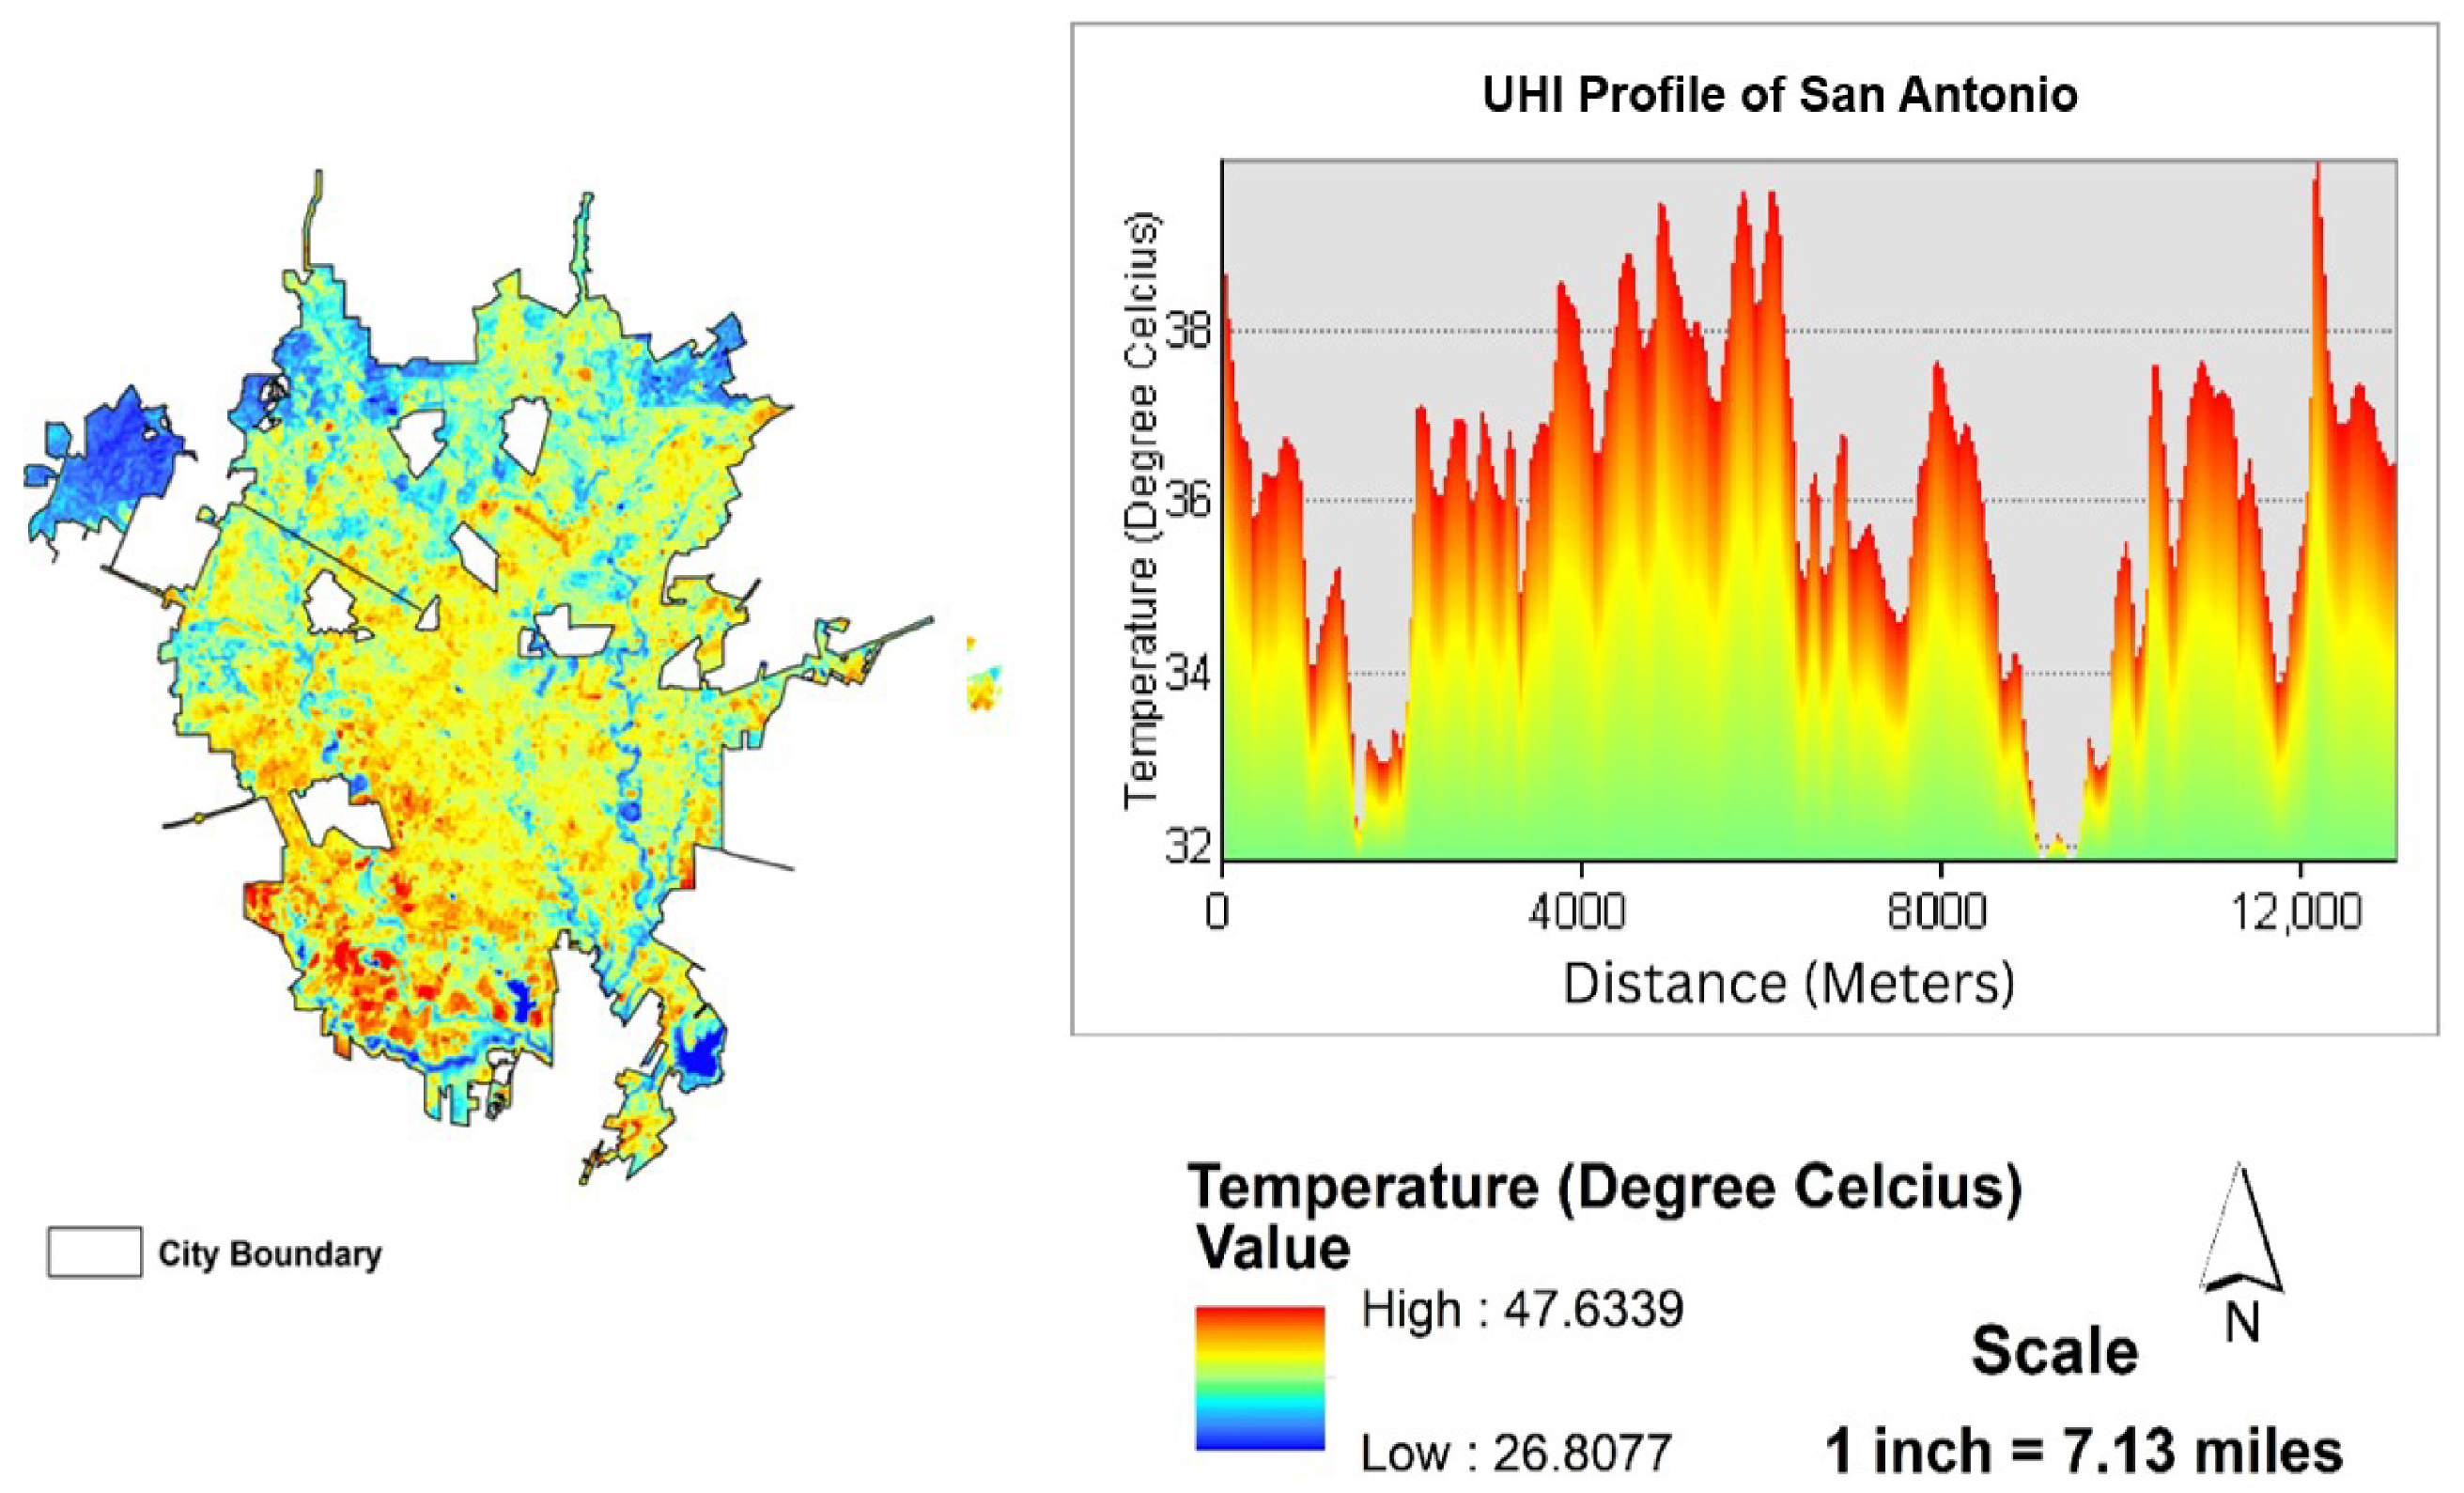
By analyzing the satellite image, an LST map was prepared and visualized (
Figure 2) which depicts the high spatial temperature distribution in the city. The left panel in
Figure 2 shows the Land Surface Temperature (LST) on the selected date, with white areas indicating regions outside the city limits. A black polyline is overlaid on the LST map to examine the LST gradient along that transect. The right panel displays the temperature profile along this line, where the x-axis denotes distance (meters) and the y-axis represents temperature (°C). The profile illustrates spatial variation in surface temperature, highlighting potential UHI characteristics along the transect.
While population density captures the concentration of individuals per unit area, reflecting urban compactness and its impact on anthropogenic heat emissions, the total population represents the absolute number of people exposed to potential heat risks within a zone. In addition, other socioeconomic factors like age-specific demographics, also play a role in modifying UHI effects.
3.3. UHI Variation Across Different Functional Zones of San Antonio
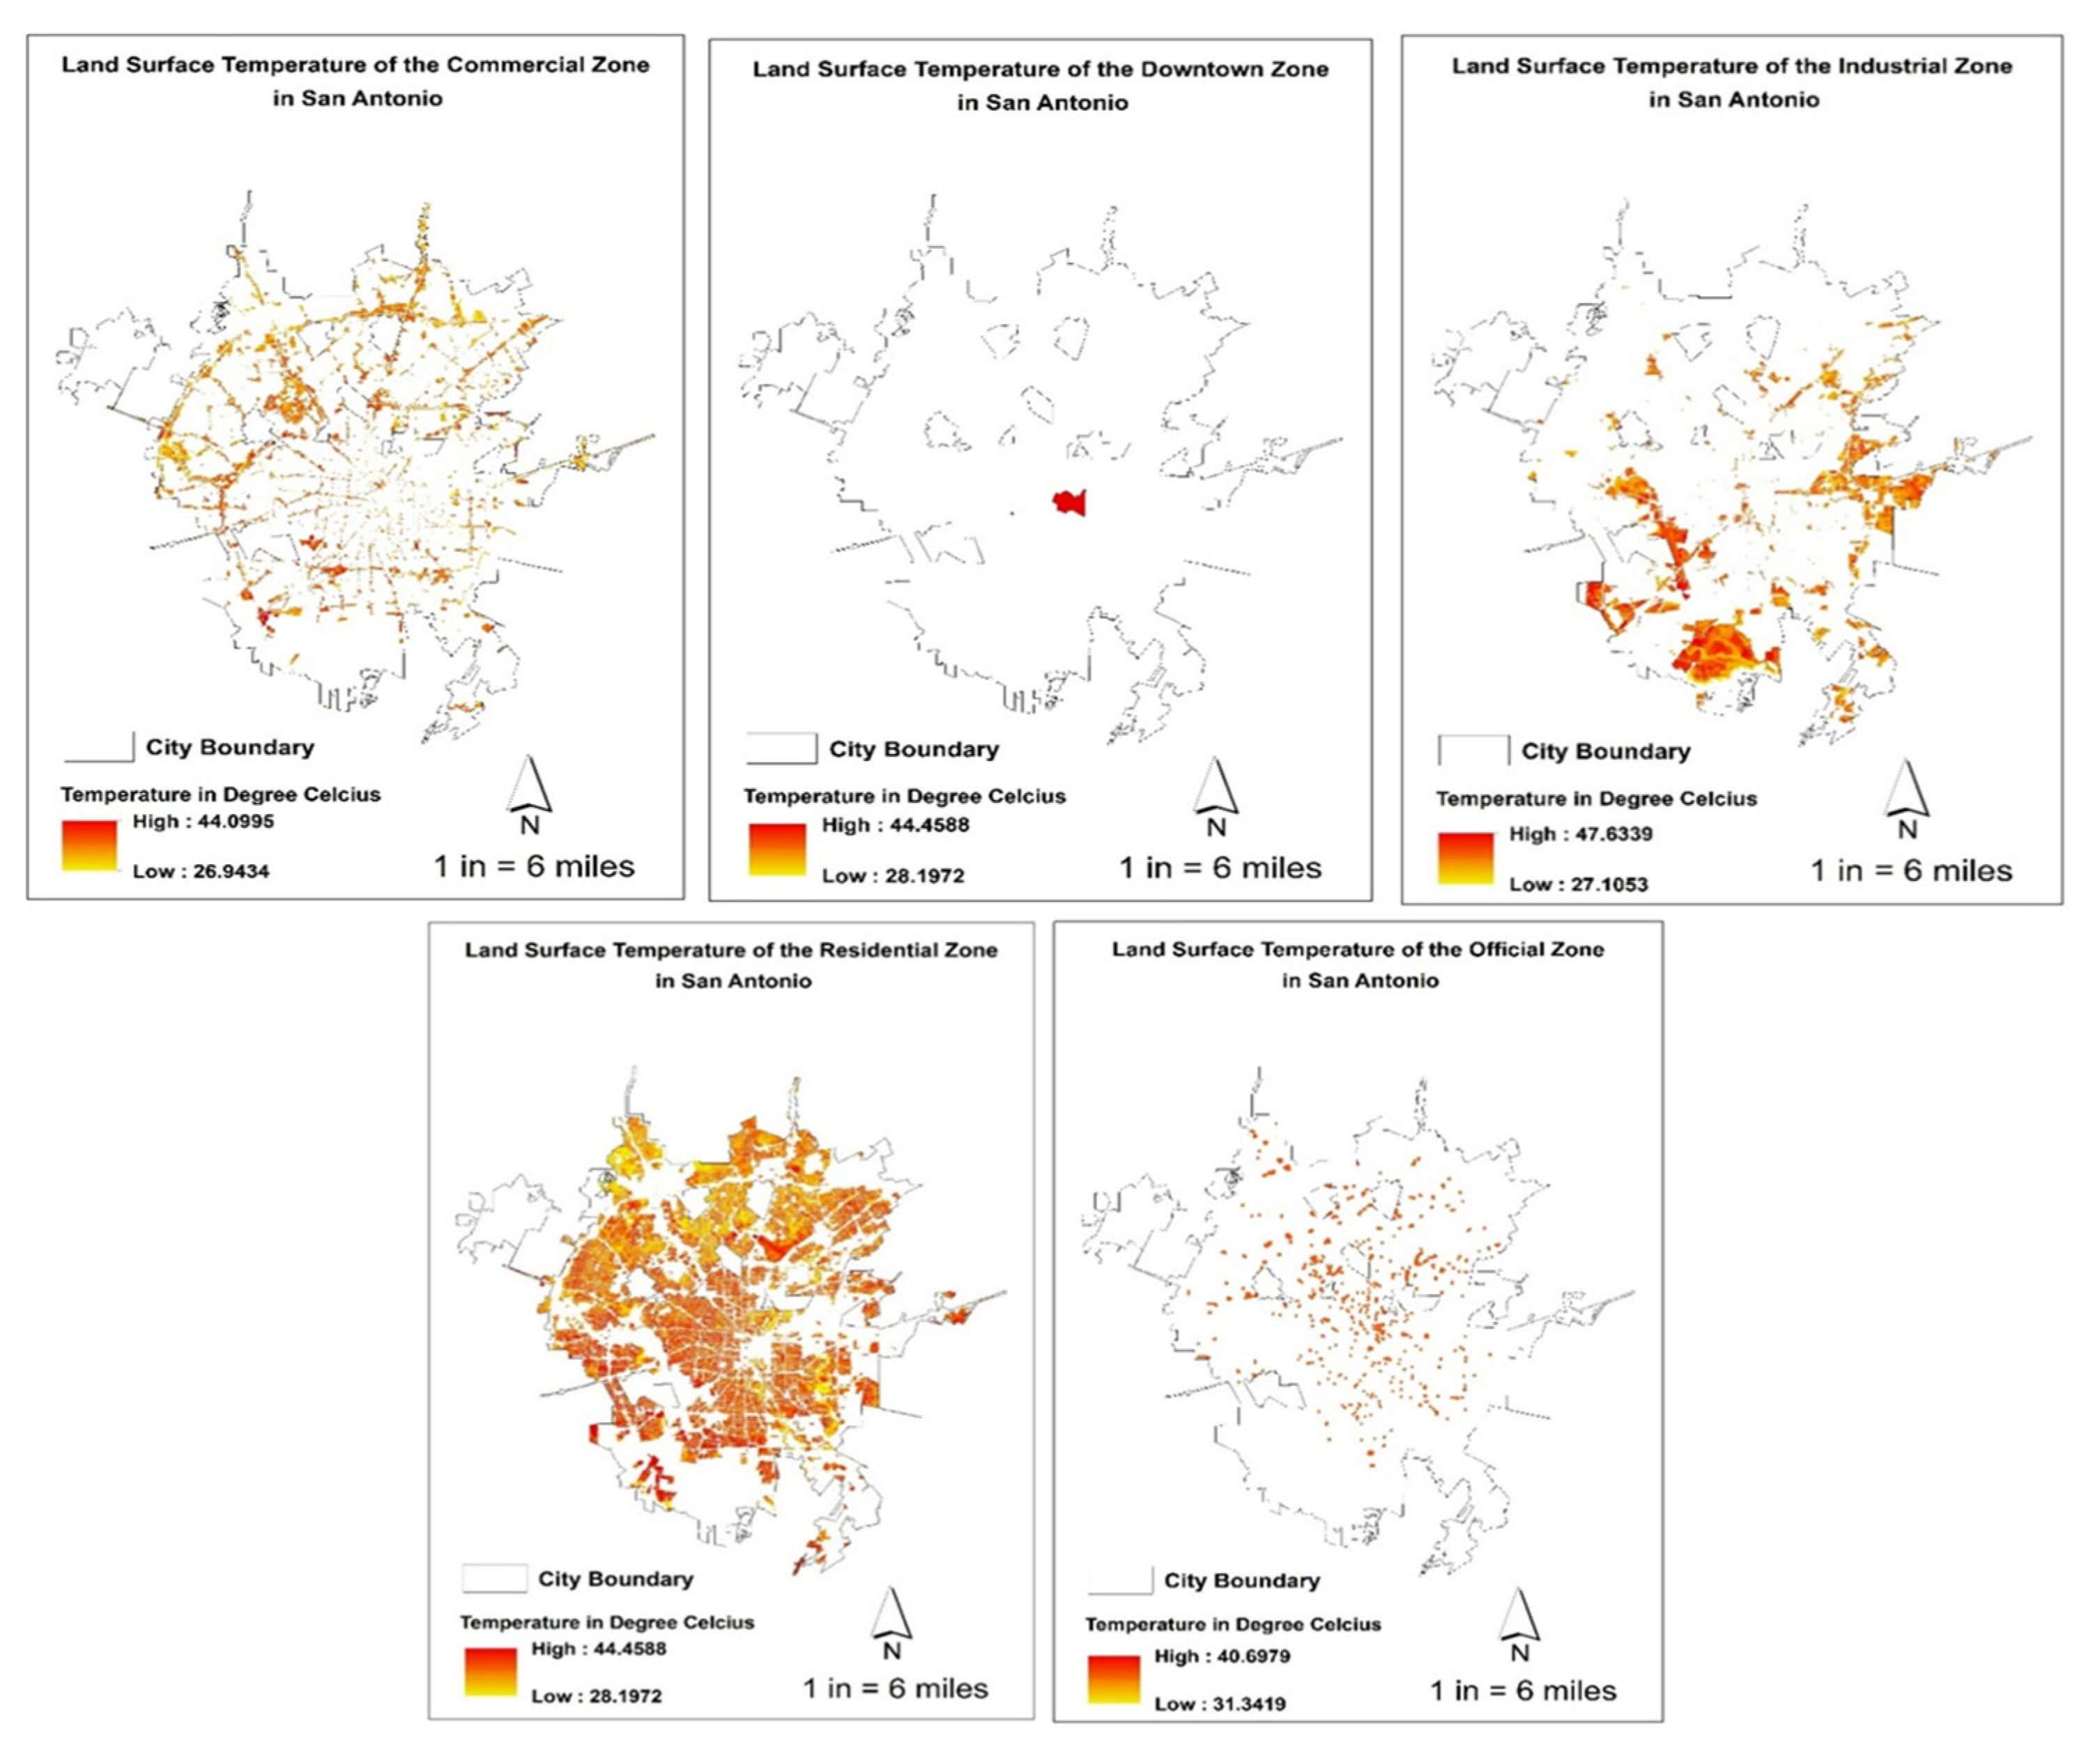
In San Antonio, zoning is administered by the City’s Development Services Department (DSD), which ensures that all properties are accurately platted and assigned appropriate zoning designations prior to any construction activities. This regulatory framework is fundamental to guiding land use, development patterns, and urban planning within the city. The spatial distribution of LST across San Antonio’s functional zones reveals notable variation in UHI intensity (
Figure 5). Each zone (commercial, residential, industrial, official, and downtown) exhibits a distinct thermal signature shaped by its unique urban morphology, vegetation cover, land use, and impervious surface extent.
The industrial zone records the highest LST (up to 47.63 °C), likely due to minimal vegetation, expansive paved areas, and high energy use typical of industrial operations.
In contrast, the official zone has the lowest peak LST (40.60 °C), potentially due to open spaces, landscaped grounds, and less compact infrastructure.
The residential zone, which spans a large portion of the city, shows moderately high LST (up to 44.45 °C), with variation driven by housing density, roofing materials, vegetation in yards, and socioeconomic differences.
Commercial areas display fragmented heat patterns, influenced by mixed land uses, asphalt surfaces, and intermittent vegetation.
Downtown San Antonio, though spatially limited, shows intense heating, attributed to high-rise buildings, limited sky exposure, and dense imperviousness, common in central business districts. These thermal differences stem from each zone’s distinct physio-environmental and anthropogenic features, including building form, vegetation structure, road density, surface reflectance, and human activity.
To ensure spatial accuracy, functional boundary shapefiles were acquired from the City of San Antonio GIS portal [
43]. This spatial variability reinforces the importance of zone-specific UHI analysis. Different zones not only exhibit distinct LST patterns but also likely possess different UHI drivers. As such, identifying these zone-specific determinants is critical for developing tailored and equitable mitigation strategies.
3.4. Machine Learning-Based Analysis
Recent studies have increasingly applied machine learning techniques to investigate the spatial drivers of UHI effects, offering valuable insights into model performance and the importance of spatial context. Yoo [
18] used a Random Forest model to identify key physical and socioeconomic factors driving UHI formation in Indianapolis, emphasizing zone specific variability and the value of parcel level analysis for urban planning. This study demonstrated the importance of integrating both physical and social characteristics at a relevant spatial scale. Tanoori et al. [
23] compared six machine learning models to predict land surface temperature (LST) across different land cover types in Shiraz, Iran, finding that XGBoost and DNN performed best. Their work highlighted how model performance depends on landscape context and modeling objectives. Building on these studies, we adopted a similar machine learning based approach to investigate the spatial drivers of UHI in our study.
3.4.1. Random Forest Model
Among ML algorithms, the RF model has gained prominence for its accuracy and strength in handling complex datasets. It has been effectively utilized in UHI research to assess the relative importance of different variables [
17,
18,
31,
44]. For instance, Breiman [
15] demonstrated that RF models could manage large datasets with high dimensionality while minimizing overfitting, making it a preferred method in environmental studies. The RF model is chosen for its capability to handle large datasets with multiple predictors and its efficiency in estimating variable importance. It operates by constructing a bunch of decision trees during training and provides results in the form of classes for classification tasks or the mean prediction for regression tasks [
15,
45]. The RF model’s ability to minimize overfitting makes it an ideal choice for this study [
6,
31,
33].
The R-Studio (version 2024.04.2+764) statistical software’s RF add-on package was used to run the model where the process involved permutation of independent variable values and prediction of the dependent variable (i.e., LST) in each shuffle, which led towards the calculation of MSE increase in percentage per independent variable. RF consists of binary rule-based tree predictors where each tree operates on a random subset of observations and partition within each tree is formed on a subset of candidate variables which determine the relationship between dependent and independent variables [
44].
In this study, the default value of ntree which is 500, was taken to be the number of trees in the forest model. Moreover, the whole data set was split into 80% and 20% for training data and testing data, respectively, and all the variables were converted to a similar coordinate system and similar spatial resolution before training the model. The RF model’s application in UHI research is well-established, with numerous studies highlighting its effectiveness in identifying key contributing factors in different urban phenomena [
6,
15,
28,
31,
33]. For example, Zhou et al. [
46] utilized RF to analyze land cover patterns and their impact on land surface temperatures, demonstrating the model’s precision in environmental analysis. In our study, the RF model is employed to calculate the Mean Square Error (MSE) increase percentage for each variable, providing insights into their relative importance in UHI formation.
3.4.2. Support Vector Machine
SVM is a supervised ML technique widely applied in environmental studies and UHI research due to its efficiency in managing high-dimensional data and complex non-linear relationships [
23]. SVM functions by identifying an optimal hyperplane that separates data points into distinct categories with the maximum possible margin, making it particularly effective for classification and regression tasks [
47].
In this study, the e1071 package in R-Studio was used to train the SVM model. The algorithm was optimized to establish an ideal hyperplane that best differentiates data points based on predictor variables. SVM maps the input features into a higher-dimensional space, allowing the construction of a decision boundary that maximizes separation between different classes or predicts continuous values in regression-based applications [
47]. The radial basis function (RBF) kernel was chosen because of its ability to effectively model non-linear associations between LST and explanatory variables. Additionally, the cost (C) parameter was fine-tuned through cross-validation to balance model complexity and error minimization. The epsilon (ε) parameter in the epsilon-SVR framework was adjusted to enhance regression precision.
Following the same procedure as RF, the dataset was divided into 80% training and 20% testing to ensure model validation, and all spatial variables were standardized to a common coordinate system and resolution before analysis. SVM has been extensively used in UHI-related research to explore the interplay between land use/land cover (LULC) changes and LST variations.
For instance, a study conducted in Dakahlia, Egypt, leveraged SVM for LULC classification using Landsat imagery, revealing a strong association between urban expansion and rising LST values, emphasizing urbanization’s contribution to UHI intensification [
28,
48].
Similarly, Lin [
8] integrated SVM with remote sensing techniques to estimate near-surface temperatures, yielding a coefficient of determination (R
2) of 0.892 and a Root Mean Square Error (RMSE) of 0.42 °C, indicating the model’s high accuracy in detecting UHI patterns. This study further demonstrated that urban core regions exhibited significantly elevated temperatures compared to peripheral areas, reinforcing SVM’s effectiveness in spatial UHI analysis.
3.4.3. Gradient Boosting Machine
GBM is an advanced ensemble learning approach that enhances predictive accuracy by iteratively combining multiple weak learners (decision trees) into a robust model [
49]. Unlike traditional ML methods, GBM sequentially builds trees, with each iteration correcting the errors of the previous one. This gradient-based optimization makes GBM particularly effective in modeling complex environmental systems, including UHI effects [
24].
For this study, the gbm package in R-Studio was used to implement the GBM model. The algorithm operates by progressively refining predictions through an additive framework that optimizes a loss function using gradient descent [
49]. The number of trees (ntree) was set to 500, ensuring sufficient iterations for stable predictions. The learning rate (shrinkage) was fine-tuned to balance computational efficiency and model performance, while the interaction depth, which governs the number of splits per tree, was adjusted to capture intricate relationships between LST and predictor variables.
Following the same procedure as RF and SVM, the dataset was split into 80% for training and 20% for testing, and all variables were preprocessed to maintain consistency in spatial resolution and coordinate reference systems. GBM has demonstrated strong predictive capability in heat-related studies [
23,
37].
For example, Hoang et al. [
36] applied GBM to model LST variations, showing that it outperformed other ML techniques, including RF and SVM, achieving R
2 values exceeding 0.90 in various urban landscapes.
Likewise, Pecharroman et al. [
37] utilized GBM to analyze climate vulnerability indicators across major global cities and found that it effectively identified key factors contributing to extreme heat exposure, reinforcing its value in environmental and urban climate research.
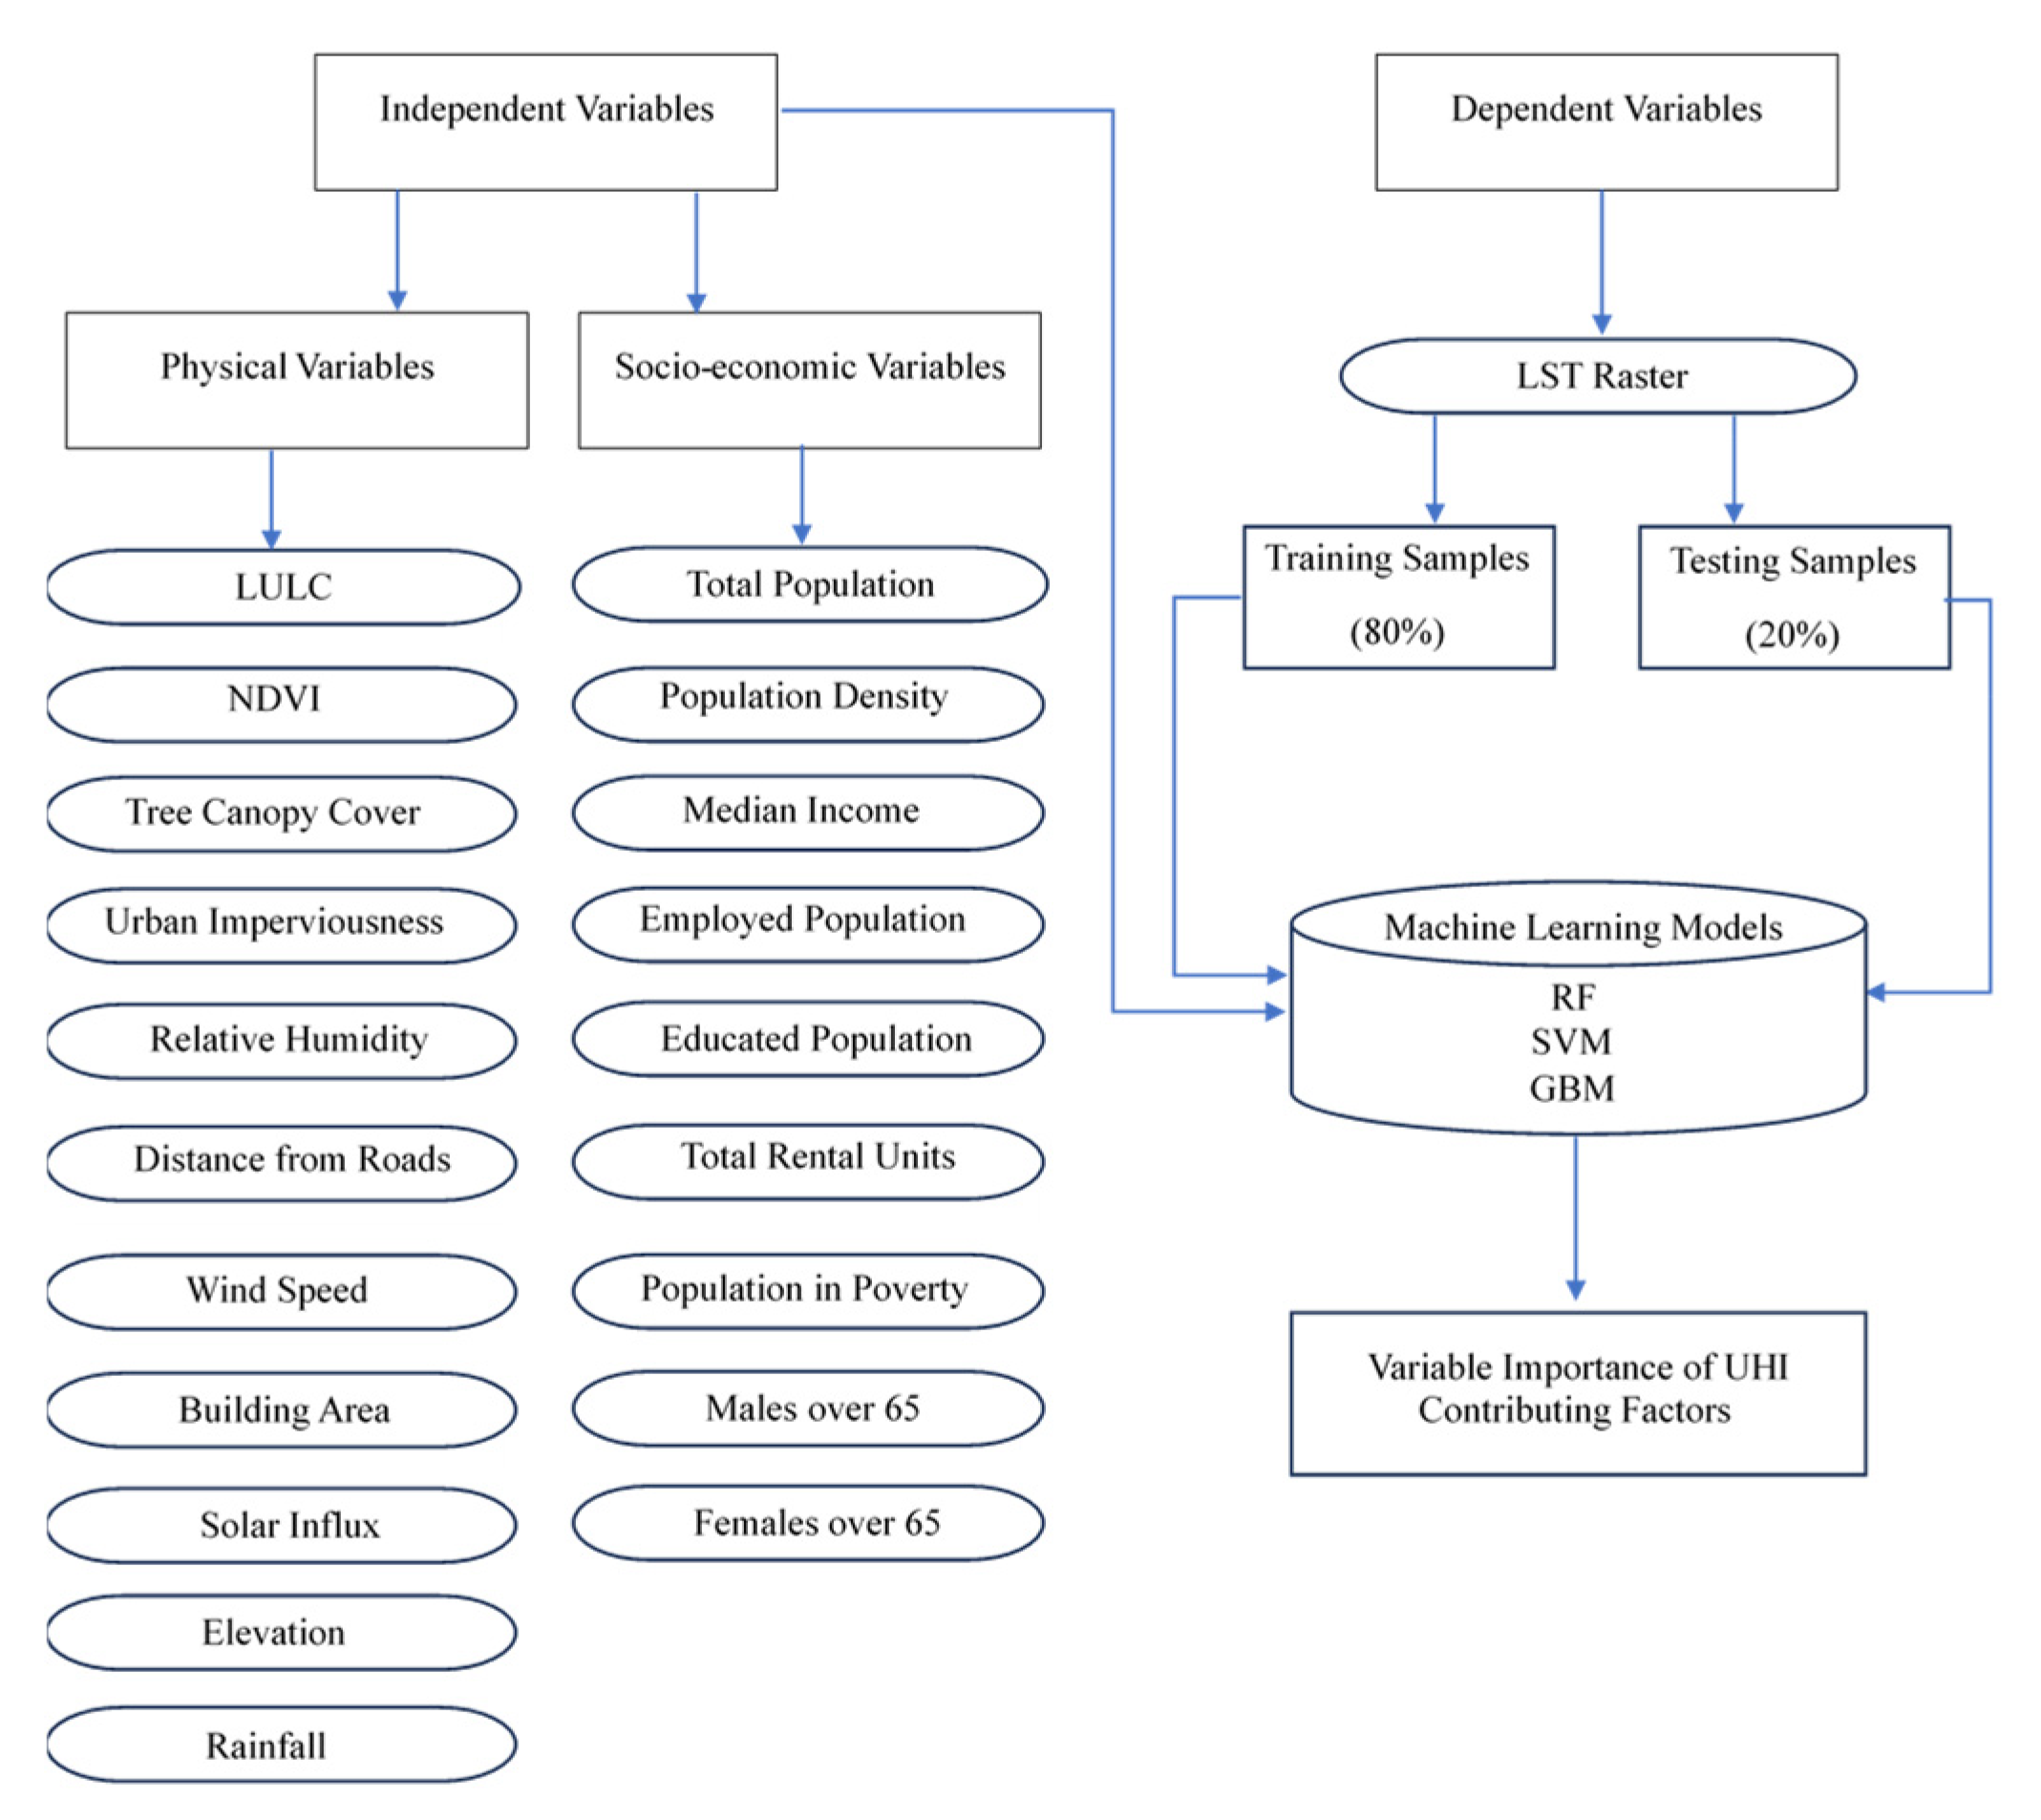
Figure 6 demonstrates the methodological workflow.
4. Results
To ensure methodological rigor and reliable prediction of land surface temperature (LST) across functionally diverse urban zones, this study compared the performance of three machine learning models, Random Forest (RF), Support Vector Machine (SVM), and Gradient Boosting Machine (GBM). Each model offers distinct algorithmic strengths in handling nonlinear relationships, high dimensional data and spatial heterogeneity, which are inherent in UHI studies. Given that urban areas vary significantly in terms of land use patterns, built environment characteristics, and vegetative cover, model performance can differ across zones. By benchmarking the models across five urban functional zones, this study aimed to identify the most robust and generalizable algorithm for each context. This comparative approach not only enhances the validity of the findings but also informs future applications of machine learning in urban climate research and policy-oriented planning.
4.1. Comparative Analysis on Model Performances
The comparative analysis of model performance across functional zones reveals that all three ML models, RF, SVM, and GBM, performed robustly (refer to
Table 3), with only subtle differences in their predictive strength.
Among them, SVM achieved the highest average variance explained (87.46%) and the highest mean R2 value (0.870), indicating slightly better generalization across all zones. However, RF closely followed, with a mean variance explained of 88.56% and a mean R2 of 0.864 and stood out by producing the lowest average RMSE (0.488 °C), suggesting it provided the most accurate temperature predictions. This trade-off between accuracy and explanatory power is important: while SVM was slightly better at capturing variance, RF was more precise in predicting actual land surface temperatures.
Zone-wise, RF was particularly strong in the downtown and industrial zones, reaching up to 91.94% and 91.63% variance explained, respectively, with R2 values as high as 0.921 and 0.911, making it the most reliable model in areas with dense and complex-built environments. GBM, on the other hand, though generally effective (mean R2 = 0.865), showed slightly higher RMSE values (mean = 0.553 °C), suggesting it may be more sensitive to noise or less capable of modeling extreme thermal variations. Still, GBM showed competitive performance in the industrial and residential zones.
These variations suggest that while all models are suitable for urban heat studies, the choice of model may depend on the specific goal, RF for minimizing prediction error, SVM for explaining variability, and GBM for capturing complex non-linear relationships in spatially diverse zones.
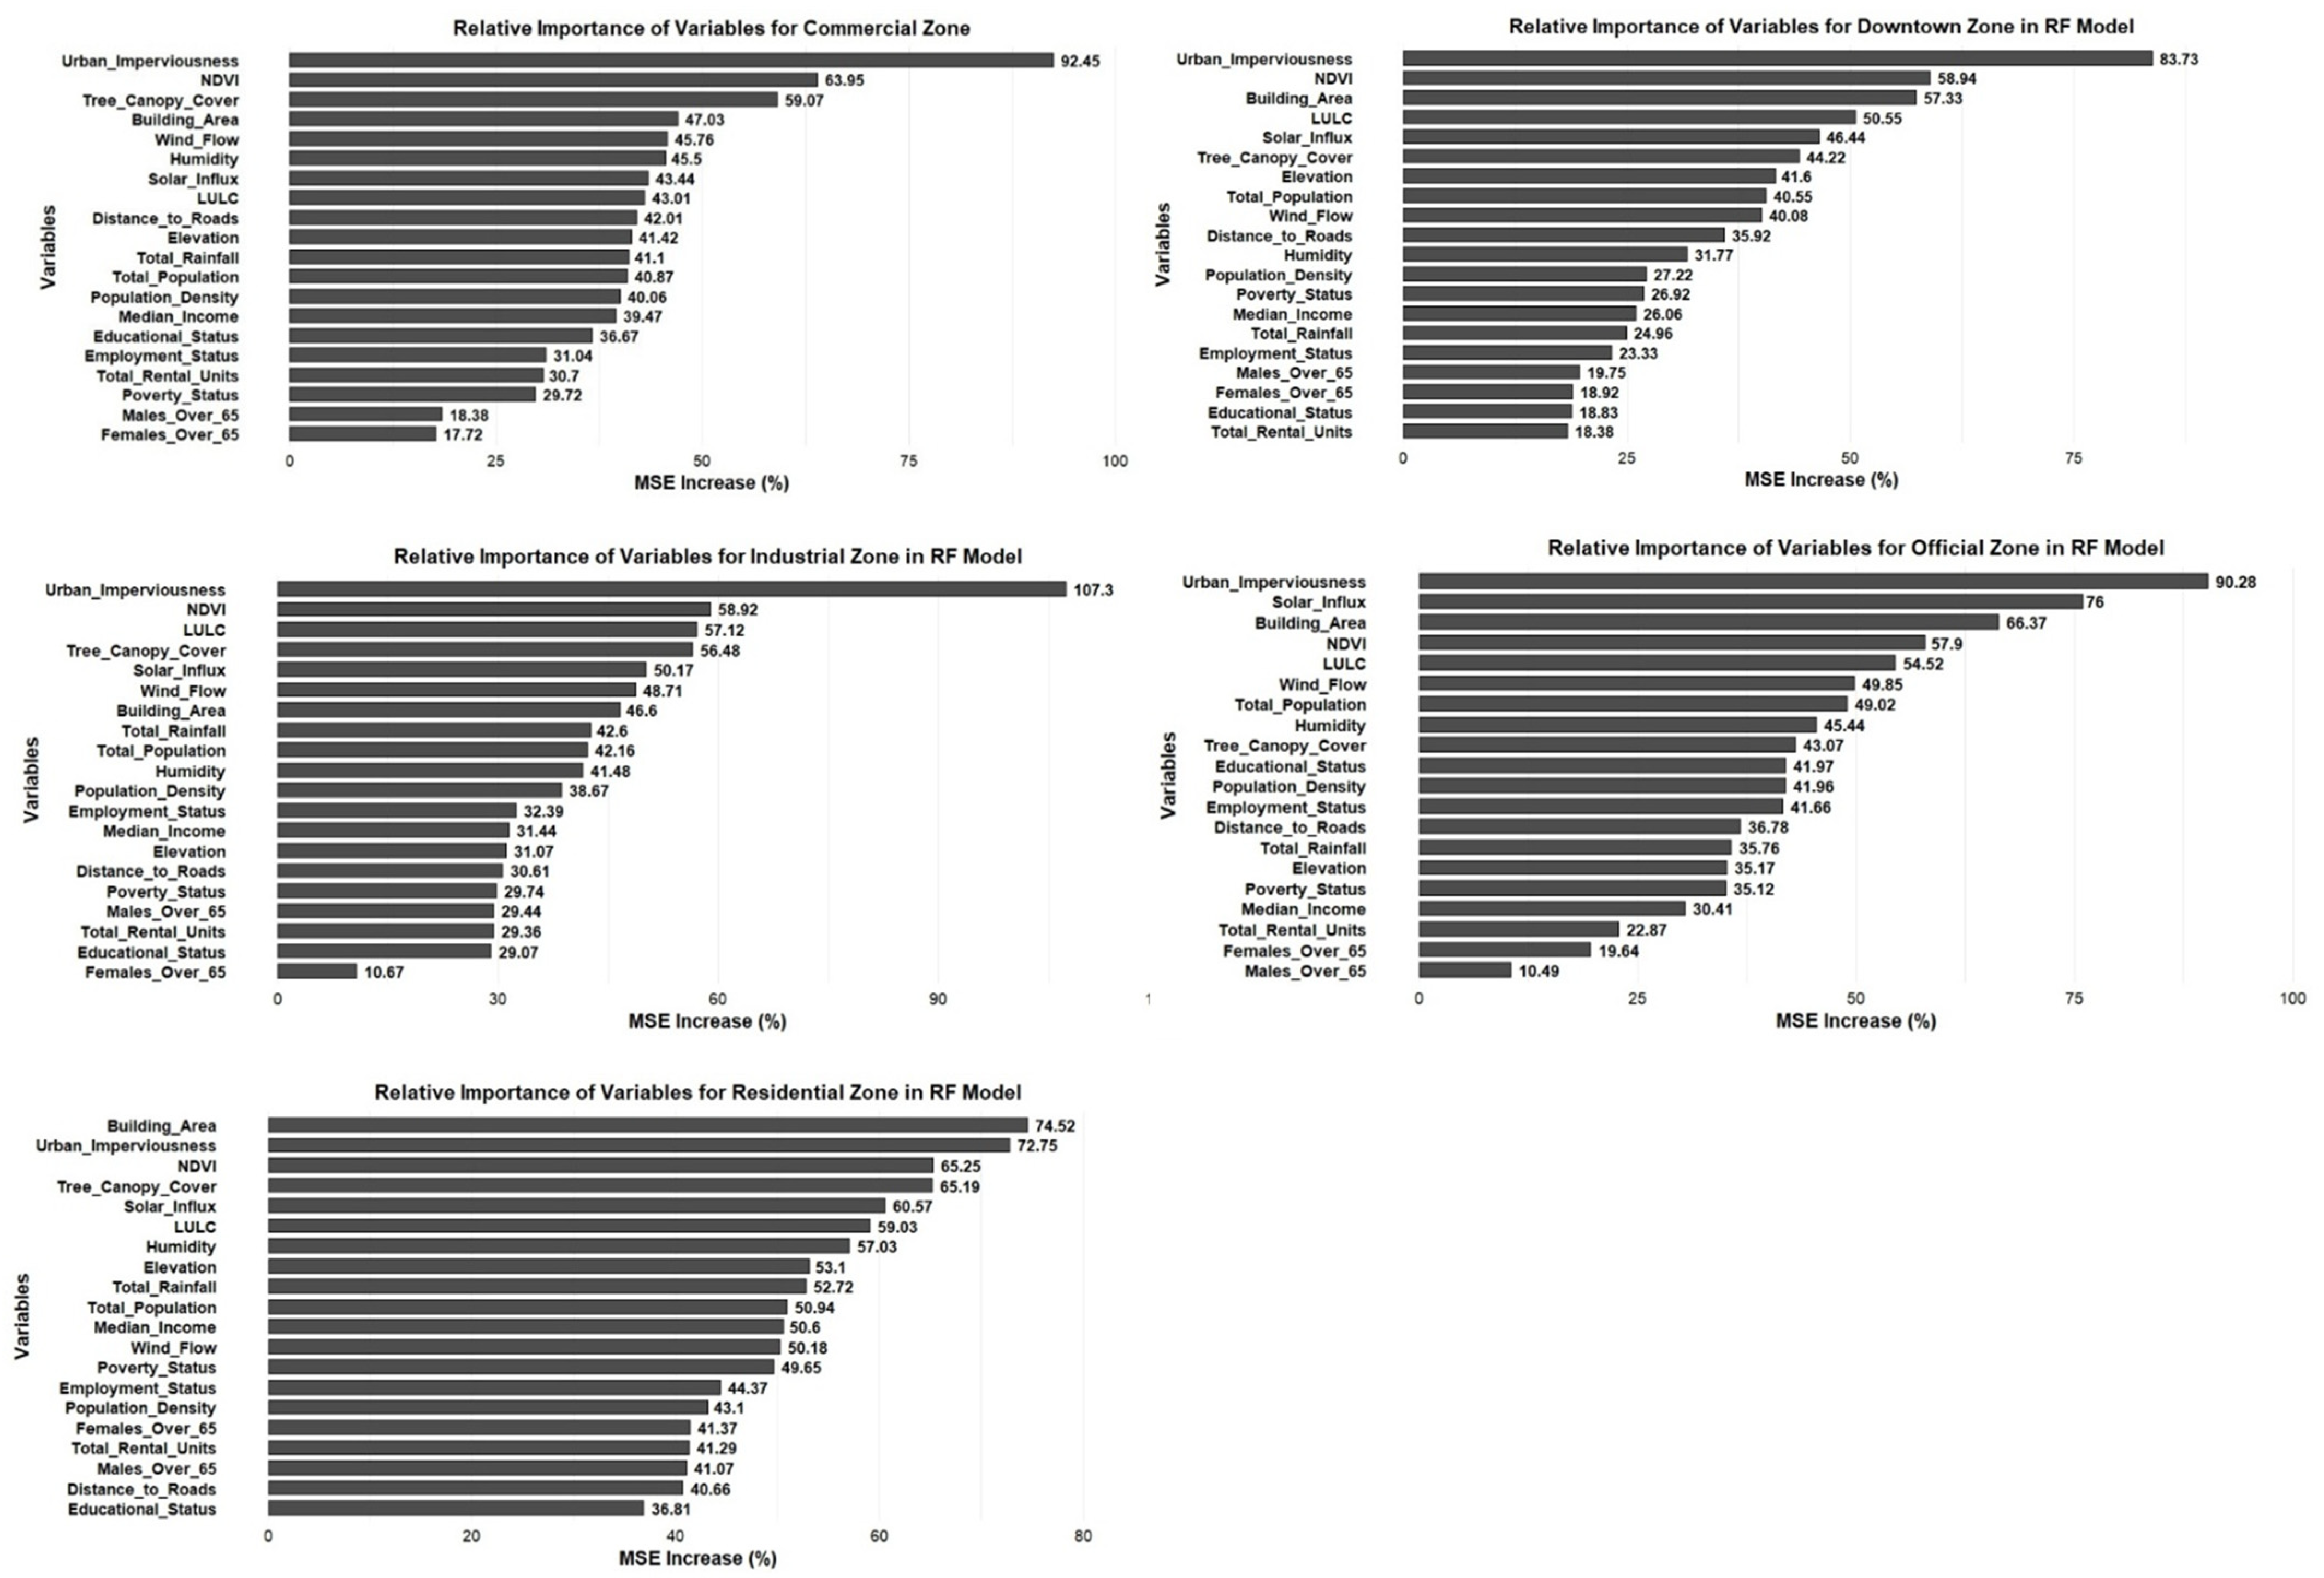
4.2. Variable Importance and Zone-Specific UHI Mitigation Strategies Based on RF Model Findings (Figure 7)
Commercial Zone: The RF model for the commercial zone identified urban imperviousness (92.45%) as the most influential factor driving UHI, followed by vegetation indicators like NDVI (63.95%) and tree canopy cover (59.07%). Built environment features such as building area (47.03%), wind flow (45.76%), and humidity (45.50%) also played significant roles. In contrast, socio-demographic variables including poverty status, educational level, and employment status had moderate to low influences. Age-related variables had minimal effects.
Recommendations: These findings highlight the dominant impact of surface characteristics and vegetation on LST, suggesting urban greening and impervious surface reduction as key heat mitigation strategies for commercial areas.
Downtown Zone: In the RF model for the downtown zone, urban imperviousness (83.73%) remained the most influential UHI driver, with NDVI (58.94%) and building area (57.33%) also showing strong impact. Unlike the commercial zone, LULC (50.55%) and solar influx (46.44%) played a more prominent role, reflecting the thermal complexity of mixed-use areas. Tree canopy cover (44.22%) showed moderate influence, likely due to limited green space. Socio-demographic variables, including population density and poverty status, had lower relevance, while age-related factors and rental units were least significant.
Recommendations: Downtown areas require integrated solutions such as reflective building materials, cool pavements, and targeted urban greening in plazas and rooftops. Zoning policies that encourage green building standards and prioritize thermal comfort in redevelopment plans are also essential.
Industrial Zone: In the industrial zone, urban imperviousness had the highest influence (107.3%) across all zones, underscoring the strong heat-retention of built surfaces. Vegetation-related variables like NDVI (58.92%), LULC (57.12%), and tree canopy cover (56.48%) also played major roles, emphasizing the value of green cover in industrial settings. Solar influx (50.17%) and wind flow (48.71%) were notable, while building area (46.60%) had less impact compared to downtown or commercial areas. Socio-demographic factors showed minimal influence, with females over 65 (10.67%) being the least significant.
Recommendations: These results stress the importance of vegetation-based strategies to reduce UHI in industrial zones. Additionally, minimizing new impervious developments and introducing permeable materials in outdoor surfaces can help reduce heat buildup.
Official Zone: In the official zone, urban imperviousness (90.28%) remained the most dominant UHI contributor, while solar influx (76.00%) showed its highest impact across all zones, pointing to high solar exposure. Building area (66.37%) and NDVI (57.90%) also had considerable influence. Unlike other zones, socio-demographic variables such as educational status (41.97%), population density (41.96%), and employment status (41.66%), played a more significant role, suggesting stronger human-environment interactions.
Recommendations: Although green cover was less prominent than in residential or downtown areas, the official zone’s UHI pattern reflects a complex relationship between built form, solar input, and demographics, warranting customized urban planning strategies for institutional settings.
Residential Zone: In the residential zone, building area (74.52%) and urban imperviousness (72.75%) were key UHI drivers, reflecting the dominance of built surfaces. Vegetation factors like NDVI (65.25%) and tree canopy cover (65.19%) had stronger influence here than in official zones, emphasizing the cooling role of green cover. Environmental variables such as humidity (57.03%), elevation (53.10%), and rainfall (52.72%), also ranked high, indicating climatic sensitivity in suburban settings. Notably, socio-economic factors such as median income (50.60%) and poverty status (49.65%) were more influential than in downtown or commercial zones, revealing disparities in heat exposure.
Recommendations: Residential areas require inclusive, equity-driven planning. Mitigation efforts should prioritize heat-vulnerable populations, using community outreach and participatory planning to ensure accessible and resilient green infrastructure.
Figure 7.
Relative importance of variables for the five zones RF model.
Figure 7.
Relative importance of variables for the five zones RF model.
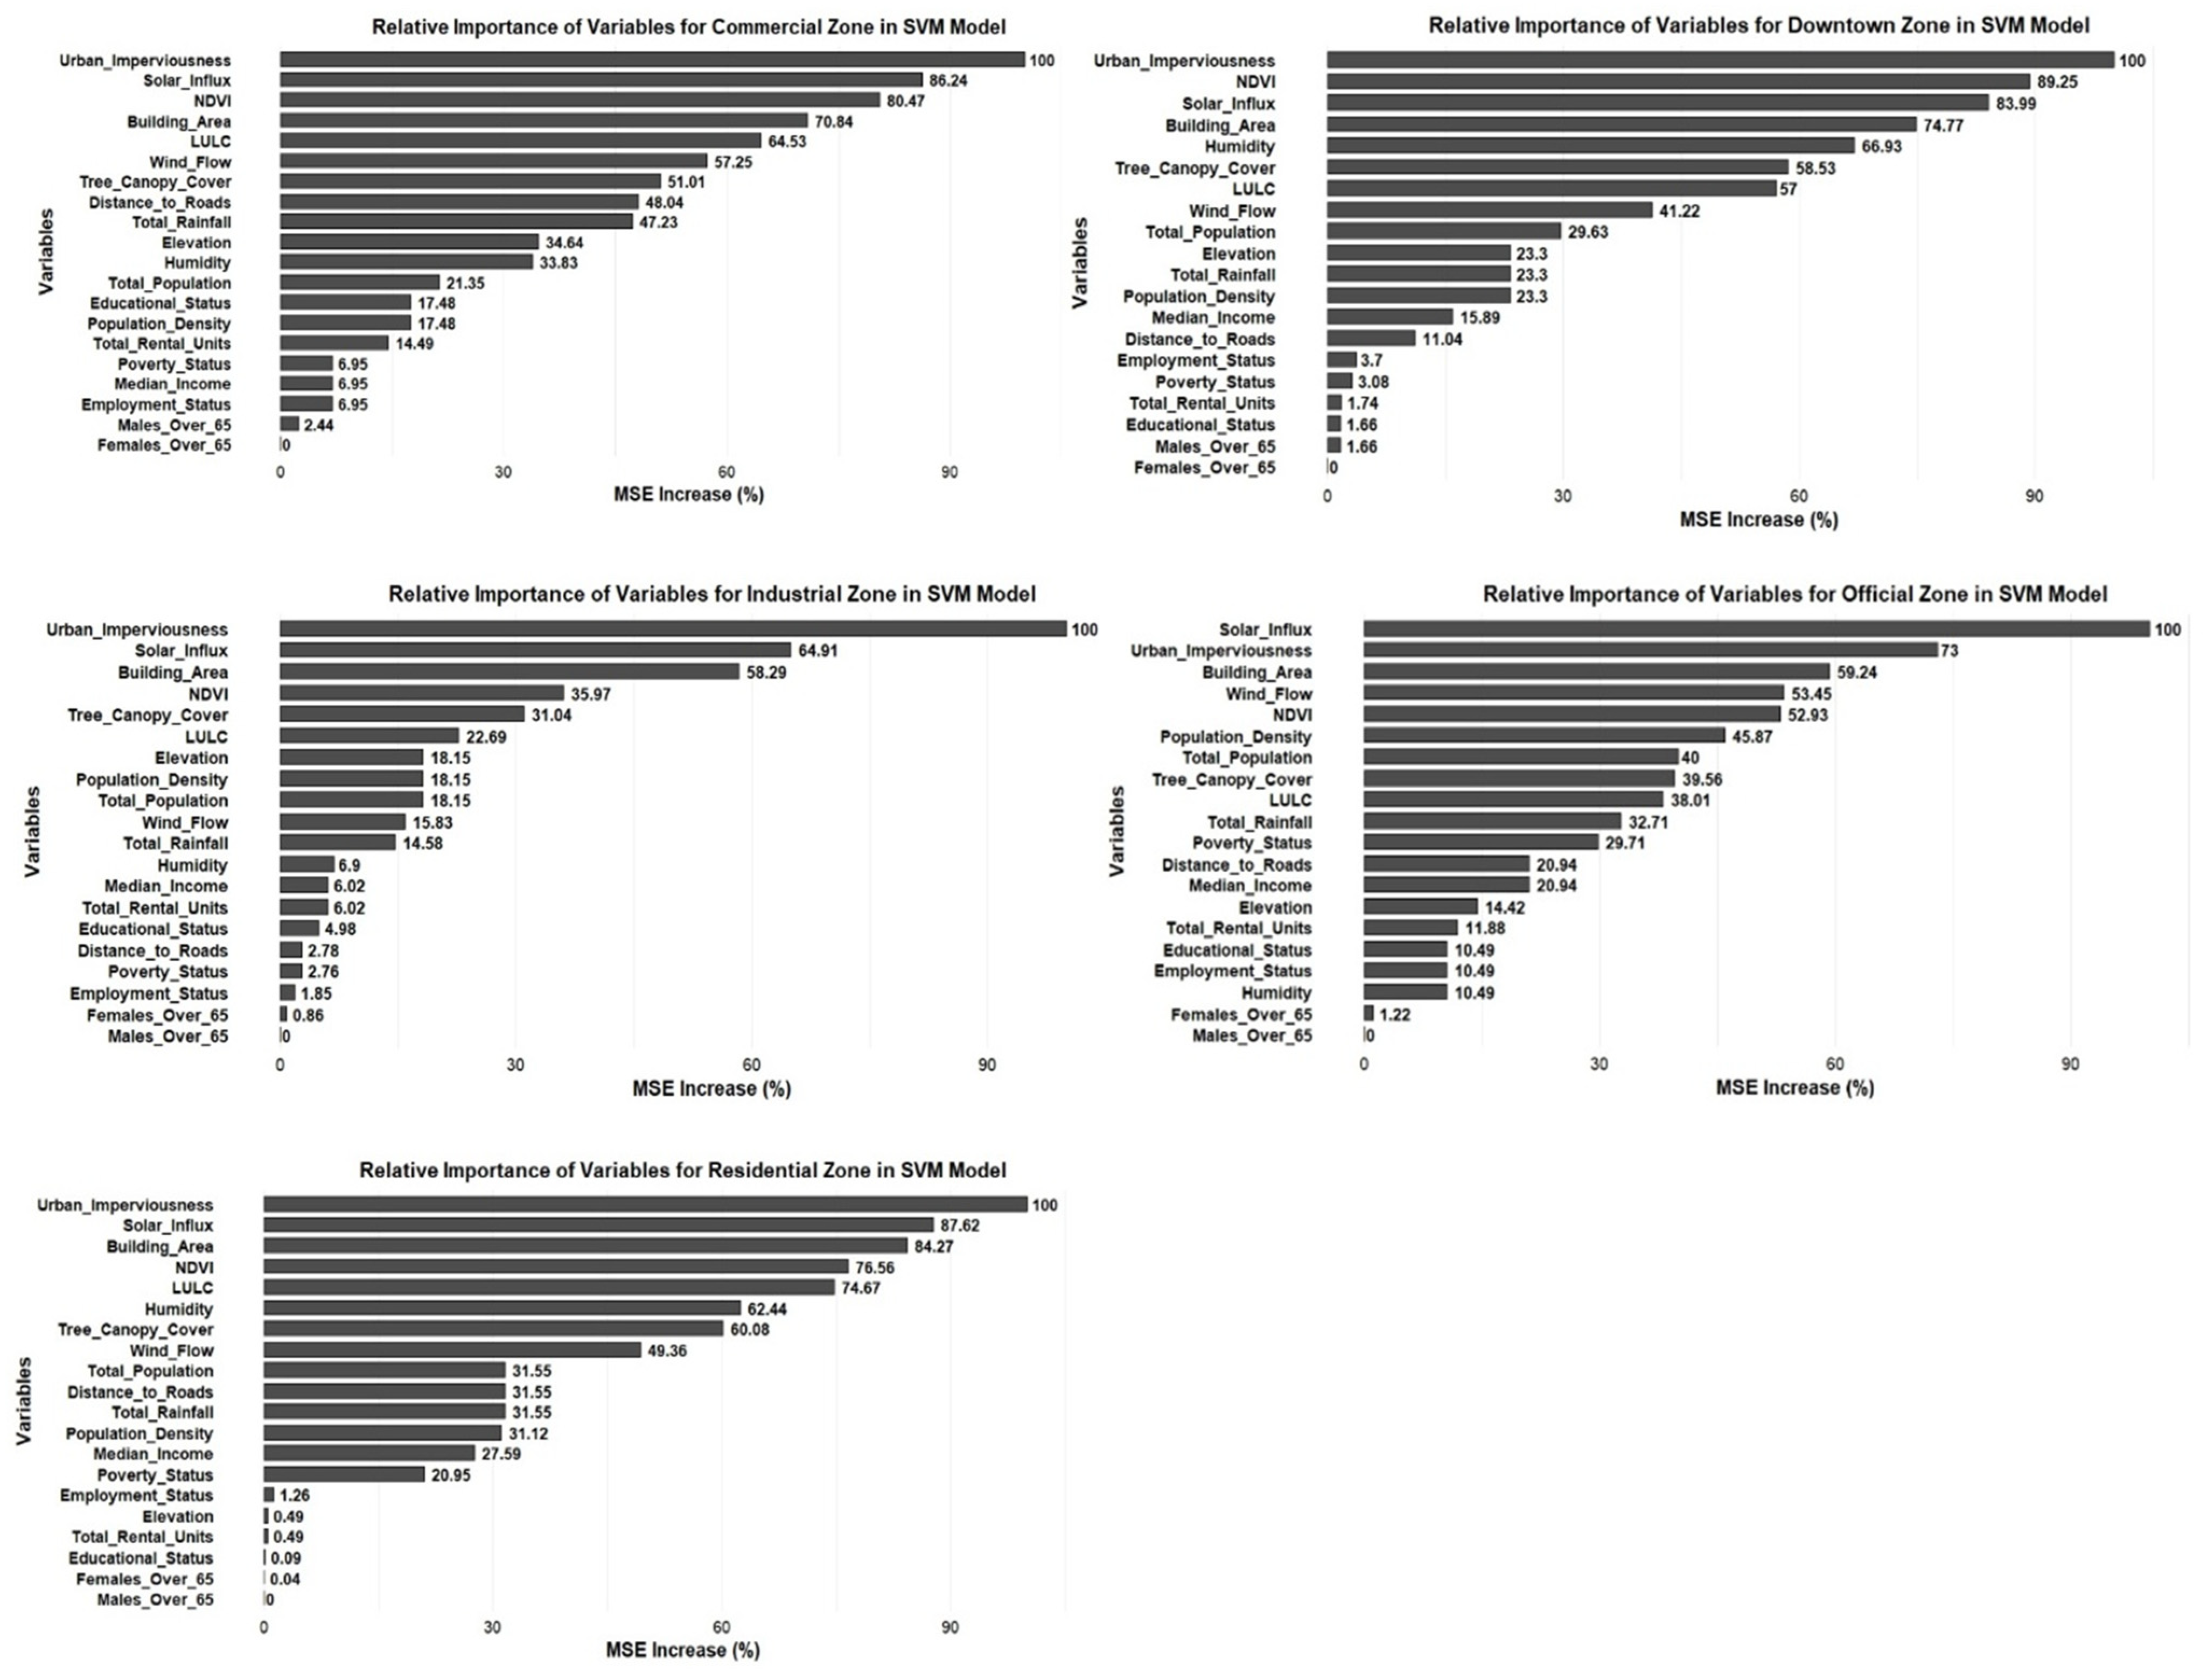
4.3. Variable Importance and Zone-Specific UHI Mitigation Strategies Based on SVM Model Findings (Figure 8)
Commercial Zone: In the commercial zone, SVM identified urban imperviousness (100%), solar influx (86.24%), and NDVI (80.47%) as the primary UHI drivers, aligning with RF results. However, the building area had slightly less influence (70.84%) than in RF, indicating a reduced emphasis on structural density in SVM’s modeling. Tree canopy cover (51.01%) and distance to roads (48.04%) showed moderate importance, reflecting the dense, built-up character of commercial zones. Socio-economic factors like employment status and poverty remained minimally influential.
Recommendations: The SVM model reaffirmed the dominant role of physical environmental variables in commercial zones, indicating that mitigation should focus on increasing vegetation and reflective surfaces while reducing impervious coverage.
Downtown Zone: In the downtown zone, SVM identified urban imperviousness (100%), NDVI (89.25%), and solar influx (83.99%) as key UHI predictors, confirming their dominant influence in dense urban areas. Compared to RF, SVM gave higher importance to humidity (66.93%) and tree canopy cover (58.53%), showing its greater sensitivity to environmental variation. Socioeconomic variables such as employment, poverty, and education had minimal impact, a consistent trend across models and zones.
Recommendations: Population-related factors and rainfall showed moderate influence, more so than in the commercial zone, reflecting the diverse urban structure of downtown where both physical and limited demographic variables shape heat patterns. The findings suggest that while built surfaces and vegetation remain critical, climate sensitive design and expanded green infrastructure are vital for managing UHI in downtown’s dense, mixed-use environment.
Industrial Zone: In the industrial zone, SVM identified urban imperviousness (100%), solar influx (64.91%), and building area (58.29%) as the primary UHI drivers, consistent with the zone’s paved and built-up nature. NDVI (35.97%) and tree canopy cover (31.04%) showed moderate influence, though lower than in greener zones like downtown. Socioeconomic factors had a minimal impact, aligning with the area’s limited residential presence. Compared to RF, SVM highlighted LULC and wind flow more strongly, likely due to its ability to model non-linear spatial patterns.
Recommendations: These findings underscore the dominance of surface characteristics and the limited cooling role of vegetation in industrial settings. Mitigation strategies in industrial areas should prioritize reducing surface sealing and enhancing air flow, with supplemental vegetation where feasible to interrupt thermal mass accumulation.
Official Zone: In the official zone, the SVM model identified solar influx (100%) as the most influential factor, likely to reflect the exposure and layout of administrative buildings. Urban imperviousness (73%) and building area (59.24%) also played key roles, aligning with the built-up nature of the zone. Wind flow (53.45%) and NDVI (52.93%) held moderate importance, suggesting environmental buffers and ventilation are relevant in institutional areas. Socioeconomic variables had more weight here than in industrial zones but less wight than downtown area.
Figure 8.
Relative importance of variables for the five zones in SVM model.
Figure 8.
Relative importance of variables for the five zones in SVM model.
Recommendations: These results highlight the need for passive cooling design, strategic vegetation, and materials with high reflectivity in administrative zones, accounting for both environmental exposure and moderate demographic influence.
Residential Zone: In the residential zone, urban imperviousness, solar influx, and building area were the top contributors, highlighting the role of built-up intensity and solar exposure. Environmental factors like NDVI, LULC, humidity, and tree canopy cover (60%) were also influential, emphasizing the microclimatic impact of land cover. Socioeconomic factors such as median income and poverty status had moderate effects, more so than in the industrial zone. Population-related variables were less significant, likely due to residential uniformity.
Recommendations: While RF performed well, the SVM model better captured nonlinear relationships, offering deeper insights into the spatial patterns shaping residential UHI dynamics. Targeted greening efforts such as expanding tree canopy in high heat low-income neighborhoods can be better prioritized. Land use optimization, including the integration of open green spaces, reflective surfaces, and zoning adjustments, can be aligned with areas where built environment intensity most contributes to UHI. Additionally, by recognizing the moderate influence of social demographic variables like poverty and income, planners can design interventions that not only reduce heat exposure but also address environmental justice, ensuring that vulnerable populations receive adequate protection and resources.
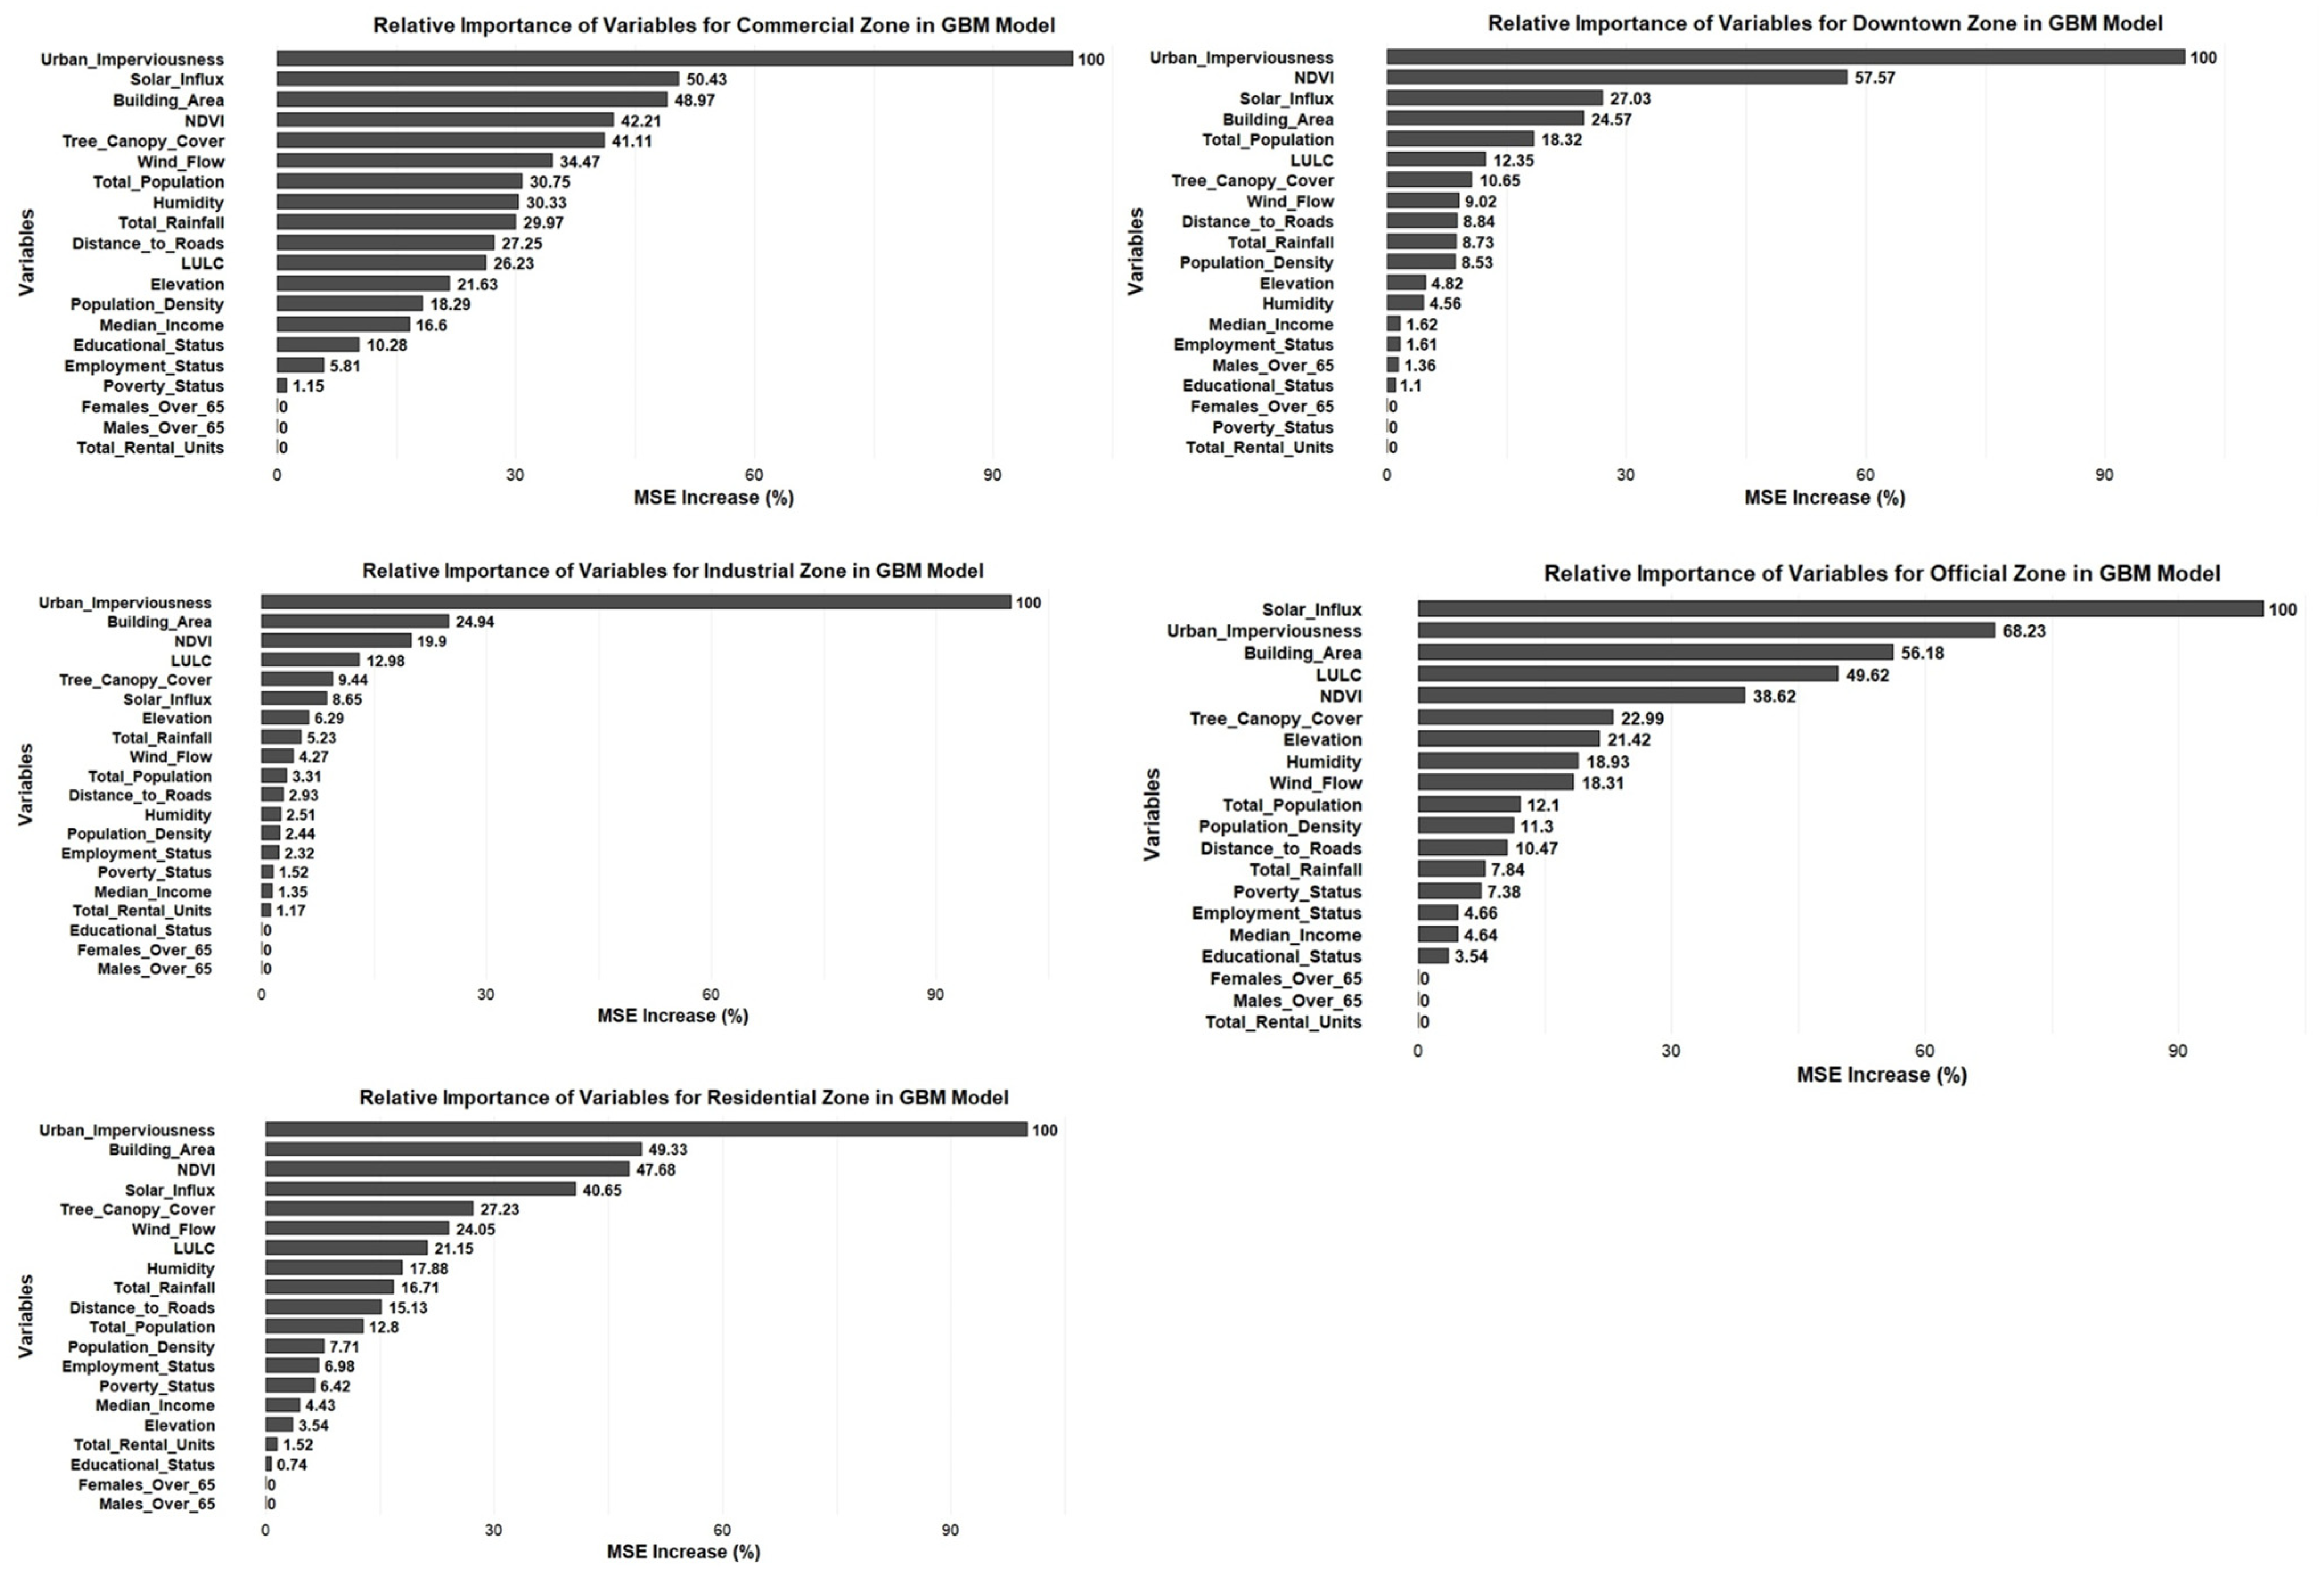
4.4. Variable Importance and Zone-Specific UHI Mitigation Strategies Based on GBM Model Findings (Figure 9)
Commercial Zone: In the GBM model for the commercial zone, urban imperviousness (100%), solar influx, and building area were top contributors, reflecting dense infrastructure and heat-retaining surfaces typical of commercial hubs. NDVI, tree canopy cover, and humidity also influenced the model, highlighting the role of microclimate and greenery. Population variables had moderate impact, while rental units and elderly population had no contribution, aligning with the zone’s non-residential nature.
Recommendations: Compared to SVM and RF, GBM offered a balanced view of environmental and infrastructural drivers but had slightly lower R2 (0.827) and higher RMSE (0.59), indicating reduced sensitivity to spatial variability. Still, its interpretability supports informed planning focused on surface material and shading interventions.
Downtown Zone: In the downtown zone, the GBM model identified urban imperviousness (100%) and NDVI (57.6%) as key predictors, highlighting the area’s dense built environment and sensitivity to vegetation loss. Solar influx and building area had moderate influence, while socio-demographic variables like poverty status, rental units, and elderly females had no contribution, reflecting the zone’s low residential presence. GBM emphasized greenness more than RF and SVM models, suggesting its strength in capturing non-linear ecological effects.
Recommendations: Though its R2 (0.865) was slightly lower than SVM, GBM effectively captured the ecological dynamics shaping urban heat, supporting greening policies and targeted vegetation restoration in high-density downtown areas.
Industrial Zone: In the industrial zone, urban imperviousness (100%) was the most influential factor in the GBM model, reflecting the dense, non-residential character of the area. Building area (24.9%) and NDVI (19.9%) also played roles, indicating spatial structure and limited vegetation mattered. Socioeconomic variables like income, education, and population density were largely insignificant. GBM showed a better fit (R2 = 0.8965) and clearer variable ranking than SVM, while RF results aligned but had a flatter spread.
Recommendations: Solar influx had lower importance here than in other zones, highlighting the dominant role of physical infrastructure over ecological or social factors in industrial settings. Given the dominance of impervious surfaces and lower ecological sensitivity, mitigation efforts should prioritize introducing vegetative buffers and permeable surfaces to offset the high thermal load in industrial zones.
Official Zone: In the official zone, solar influx (100%) was the most influential factor in the GBM model, underscoring its central role in shaping heat conditions in administrative areas. Urban imperviousness (68.2%) and building area (56.2%) followed, indicating dense infrastructure with minimal green relief. NDVI and tree canopy had moderate influence, reflecting residual vegetation’s thermal buffering. Social indicators, including income and education, were negligible, highlighting the dominance of physical and environmental features. GBM showed a sharper drop-off in variable importance than SVM or RF, making distinctions clearer.
Recommendations: This zone uniquely reflects a structured, non-residential environment where heat dynamics are governed by exposure and spatial layout. Strategies should focus on passive design, high-albedo materials, and optimized building orientation to manage solar exposure in administrative zones with limited green infrastructure.
Residential Zone: In the residential zone, urban imperviousness (100%) was the most influential factor, highlighting the impact of paved surfaces on heat buildup in densely inhabited areas. Building area (49.3%), NDVI (47.7%), and solar influx (40.7%) also played key roles, indicating a complex interaction between infrastructure, vegetation, and sunlight in shaping microclimate. Unlike the official zone where solar influx dominated, residential areas emphasized surface-related variables.
Figure 9.
Relative importance of variables for the five zones in GBM model.
Figure 9.
Relative importance of variables for the five zones in GBM model.
Recommendations: NDVI and tree canopy were notably important, reinforcing the cooling role of green cover. Sociodemographic variables had limited influence, suggesting that residential thermal patterns are primarily driven by physical-environmental factors rather than population characteristics. This underscores the importance of preserving and expanding green infrastructure in residential areas, particularly in high-density neighborhoods, to improve thermal comfort and resilience.
5. Discussion
This study evaluated the spatial drivers of urban heat across five land use zones (commercial, downtown, industrial, official, and residential) using three ML models: RF, SVM, and GBM. The comparative analysis of model performance revealed that all three models performed reliably, with SVM achieving the highest average R2 (0.870), indicating superior ability to explain variance in LST. RF, however, had the lowest average RMSE (0.488 °C), making it the most accurate in predicting temperature values. GBM offered a balanced trade-off, capturing non-linear relationships effectively, particularly in the industrial and residential zones.
Across all zones and models, urban imperviousness was the most consistent and dominant predictor of UHI. In the RF model, its influence peaked in the industrial zone (107.3%), followed by commercial (92.45%), official (90.28%), downtown (83.73%), and residential (72.75%) zones. Similarly, in the SVM and GBM models, imperviousness consistently ranked among the top variables, indicating its substantial role in heat retention due to paved and built surfaces. These findings confirm the well-established link between surface sealing and elevated urban temperatures.
Vegetation indicators, particularly NDVI and tree canopy cover, showed strong influence, especially in the residential zone where NDVI scored 65.25% and tree canopy cover 65.19% (RF). In SVM, NDVI’s importance reached 89.25% in downtown and 80.47% in commercial zones. This underscores the crucial cooling function of vegetation in mitigating UHI. Tree canopy cover was most effective in residential and commercial areas, reflecting the role of green spaces in enhancing thermal comfort in densely populated environments.
Solar influx played a particularly significant role in official and commercial areas. In the official zone, it was the top predictor in both SVM and GBM (100%), likely due to the orientation and layout of administrative buildings that expose them to higher solar radiation. In the commercial zone, solar influx was also highly ranked (86.24% in SVM), reinforcing its importance in areas with limited shading and high structural density.
Building area was another key contributor, especially in residential (74.52%) and commercial (70.84%) zones, indicating that densely built structures amplify surface temperature. Environmental variables such as humidity, wind flow, elevation, and rainfall were more influential in the residential and official zones, highlighting the role of microclimatic variation in these settings.
Socio-demographic variables, while generally less influential across all models, showed some zone-specific effects. In the official zone, RF identified moderate influence from educational status (41.97%), population density (41.96%), and employment status (41.66%), suggesting a stronger interaction between institutional land use and demographic characteristics. The residential zone also exhibited relatively higher influence from median income (50.60%) and poverty status (49.65%), pointing to social disparities in heat exposure. In contrast, industrial and downtown zones showed negligible effects from socio-economic or age-related variables, reflecting their limited residential character. When comparing model performance across zones, RF stood out in the downtown (R2 = 0.921) and industrial (R2 = 0.911) zones due to its stability in highly built environments. SVM captured more nuanced relationships between variables, particularly in zones with mixed land use and varied vegetation. GBM, while slightly more sensitive to outliers (higher RMSE), provided a clear ranking of variable importance and performed well in spatially heterogeneous areas like residential and industrial zones.
This study confirms that UHI is driven by surface characteristics like imperviousness, vegetation, and solar exposure, while sociodemographic factors have localized context-specific effects. The strong impact of impervious surfaces in industrial and commercial zones highlights the need for permeable materials and development limits. Vegetation, especially NDVI and tree canopy, is vital for cooling in residential and downtown areas, supporting targeted greening efforts like urban forestry and green roofs. High solar influx in official and commercial zones underscores the value of reflective materials, passive design and updated codes. Though less dominant, socio-demographic factors in residential and official zones point to the need for equity-focused planning in heat vulnerable communities.
Overall, effective UHI mitigation requires zone specific strategies aligned with each area’s unique conditions. Residential zones should prioritize vegetation expansion and support for vulnerable communities. Commercial and downtown areas need reduced impervious surfaces and use of cool, reflective materials. Industrial zones benefit from limiting surface sealing and adding vegetated buffers. In official zones, building design should minimize solar exposure while considering socio-environmental dynamics. A targeted, context driven approach is key to equitable and sustainable heat mitigation.
6. Managerial Insights
The study highlights the critical need for zone-specific strategies to effectively mitigate UHI effects. Across all land use types, surface characteristics, particularly urban imperviousness, vegetation cover, and building density, emerged as the dominant drivers of elevated land surface temperature. Strategies such as reducing impervious surfaces, expanding tree canopy, and promoting reflective or green roofing must be tailored to the distinct spatial characteristics of each zone. Implementing these approaches requires integrating high-resolution spatial data, engaging community stakeholders, and incorporating zoning regulations or incentive programs. This underscores the need for localized UHI assessments to support targeted, equitable, and practical mitigation planning.
Additionally, the influence of socio-demographic factors in residential and official zones underscores the importance of integrating equity-focused planning, ensuring that interventions address the needs of heat-vulnerable populations. Municipal policies should support these efforts through zoning reforms and public investment in sustainable infrastructure.
In their study on Shiraz, Iran, Tanoori et al. [
23] demonstrated the strong performance of machine learning models in predicting LST and analyzing UHI dynamics, highlighting their usefulness for urban planning and climate mitigation. They also emphasize the value of exploring vegetation types and citizen science for LST data collection, with the goal of informing actionable urban planning policies for a cooler, more climate-resilient city.
In the case of San Antonio, however, this study offers a methodological contribution by providing zone-specific insights using a comparative machine learning framework across five distinct land use types. This granularity allows for more actionable, spatially tailored recommendations rather than generalized city wide strategies. These insights provide specific guidance for San Antonio’s planners and policymakers to implement targeted interventions that align with the city’s unique urban structure, demographic distribution, and environmental conditions, making the study both supportive of global findings and distinctly relevant to the local context.
