Article

Study on the Spatial Distribution Characteristics and Influencing Factors of Intangible Cultural Heritage Along the Great Wall of Hebei Province

1
School of Arts and Design, Yanshan University, Qinhuangdao 066000, China
2
China Great Wall Culture Research & Communication Center, Yanshan University, Qinhuangdao 066000, China
3
School of Public Administration, Yanshan University, Qinhuangdao 066000, China
*
Author to whom correspondence should be addressed.
Sustainability 2025, 17(15), 6962; https://doi.org/10.3390/su17156962 (registering DOI)
Submission received: 30 April 2025 / Revised: 26 July 2025 / Accepted: 28 July 2025 / Published: 31 July 2025
(This article belongs to the Collection Sustainable Conservation of Urban and Cultural Heritage)

Abstract

The development of the Great Wall National Cultural Park has unleashed the potential for integrating cultural and tourism development along the Great Wall. However, ICH along the Great Wall, a key part of its cultural identity, suffers from low recognition and a mismatch between protection and development efforts. This study analyzes provincial-level and above ICH along Hebei’s Great Wall using geospatial tools and the Geographical Detector model to explore distribution patterns and influencing factors, while Geographically Weighted Regression is utilized to reveal spatial heterogeneity. It tests two hypotheses: (H1) ICH shows a clustered pattern; (H2) economic factors have a greater impact than cultural and natural factors. Key findings show: (1) ICH distribution is numerically balanced north–south but spatially uneven, with dense clusters in the south and scattered patterns in the north. (2) ICH and crafts cluster significantly, while dramatic balladry spreads evenly, and other categories are random. (3) Average annual temperature and precipitation have the greatest impact on ICH distribution, with the factors ranked as: natural > cultural > economic. Multidimensional interactions show significant enhancement effects. (4) Influencing factors vary spatially. Population density, transport, temperature, and traditional villages are positively related to ICH. Elevation, precipitation, tourism, and cultural institutions show mixed effects across regions. These insights support targeted ICH conservation and sustainable development in the Great Wall cultural corridor.

1. Introduction

In 2003, UNESCO adopted the Convention for the Safeguarding of Intangible Cultural Heritage, marking a global consensus on intangible cultural heritage (ICH) protection and providing institutional and methodological support for national frameworks and community participation. Since then, ICH has been increasingly valued by both academia and policymakers as a key expression of cultural diversity and identity. Academic research has evolved from early discussions on definitions, classifications, and protection principles to more in-depth theoretical exploration [1].
As one of the Seven Wonders of the World, the Great Wall represents humanity’s most enduring defensive architecture in scale and construction duration, serving as China’s largest and most extensively distributed linear cultural heritage site. With a history spanning over 2700 years, the Great Wall of China not only fulfilled a vital military defense role but also embodied the evolution of political systems, ethnic relations, and cultural traditions across various historical periods. The widespread remains along the Great Wall—such as passes, beacon towers, fortresses, and postal stations—witness the dynamic processes of ethnic integration and frontier life transformation. As a transregional linear cultural heritage site, the Great Wall played multiple roles in historical migration, military strategy, ethnic exchange, and interaction in agricultural trade. These functions have shaped a unique cultural context that underpins the development of ICH and provides essential spatial and cultural foundations for its geographic distribution [2].
Recent studies of ICH have focused on the safeguarding systems [3,4], management practices [5], socioeconomic impacts [6,7], and digital preservation and innovation ICH [8,9,10]. Research scales range from individual ICH elements [11] to specific categories [12] and regional clusters [13,14]. ICH studies have progressively evolved into a multidimensional and interdisciplinary field. However, quantitative modeling approaches in this domain remain relatively underdeveloped. Research on the Great Wall primarily focuses on archaeological history, architecture, geography, and cultural dissemination, including its historical evolution and excavation work [15,16], the architecture and craftsmanship of the Great Wall sites [17], the geography of the Great Wall [18], the preservation and development of the Great Wall [19,20,21], and the study of culture and semiotics [22] among others. Against the backdrop of actively constructing the Great Wall Cultural Corridor and advancing the Great Wall National Cultural Park in China, research has expanded to areas such as tourism development models and cultural value studies [23]. Recent studies have increasingly emphasized ICH protection and development along the Great Wall, highlighting the importance of integrating the Great Wall heritage with ICH. Scholars have explored inheritance pathways, innovation strategies, and the integration of cultural tourism [24]. Notable contributions include Wang’s analysis of ICH types along Eastern Hebei’s Great Wall Cultural Belt and proposed tourism integration strategies [25] as well as another Wang’s case study on “Da Shuhua” ICH, examining its dissemination challenges and integration along the Great Wall [26]. Quantitative approaches have also emerged, such as Lin’s spatial distribution analysis of the Ming Great Wall county-level ICH, utilizing the Minimum Cumulative Resistance (MCR) method to assess heritage corridor construction [27]. Currently, research on ICH along the Great Wall is still relatively weak, mainly focusing on the paths and strategies for heritage transmission and innovation, as well as empirical studies on individual cases of ICH. There is little research on the overall quantitative aspects.
The main objectives of this study are as follows: (1) to reveal the spatial distribution patterns of ICH along the Great Wall in Hebei Province; (2) to quantitatively assess the explanatory power of natural, economic, and cultural factors on ICH distribution, identify the dominant drivers and their interactions, and uncover the spatial heterogeneity of their impacts across different geographic regions, thereby clarifying the coupled multi-factor driving mechanisms underlying ICH distribution; (3) based on the spatial patterns of ICH and its influencing factors, to propose protection strategies for the Great Wall cultural corridor and explore spatial integration and activation pathways for ICH oriented toward sustainable development, thus providing a basis for the overall conservation and coordinated governance of the Great Wall cultural heritage belt.

Literature Review

Due to its intangible characteristics, ICH is more fragile than tangible cultural heritage. As early as 2001, UNESCO recognized the model of combining ICH with physical space, designating Dejima Square as a “Masterpiece of the Oral and ICH of Humanity.” Many scholars realized the importance of tangible entities in the protection of ICH and began to deepen the research on the interaction between ICH and geographical environments [28]. For instance, Liu argues that ICH is the result of human interaction with the material world in daily life, with different geographical and social environments giving rise to unique ICH characteristics [29]. Influenced by environmental factors, ICH possesses regional and communal characteristics; therefore, a geographical indication protection model should be established to enhance public awareness and brand effect [30,31]. Falcade, through empirical research on French wine-making techniques, argues that ICH skills can be supported by industry and tourism, fostering their collaborative development and creating a unique geographical indication [32]. At this stage, both theoretical and empirical research found that the protection of ICH shifted from the heritage itself to the concept of cultural ecological protection, combining ICH with natural environments and tangible cultural heritage for integrated preservation.
Along with the transformation of conservation concepts, research on the geographical environment of ICH has gradually shifted to spatial quantitative analysis, combining the protection and transmission of ICH with geography. This approach explores the spatiotemporal distribution and driving factors of ICH, offering support for protection and development strategies at the regional level. The influencing factors of ICH exhibit regional, typological, and temporal differences, which give rise to different dissemination models, pathways, and protection measures. In terms of study area, the current study includes different scopes such as national [33,34], provincial [35], multi-provincial [36,37], and specific regions. At present, there is limited research on ICH within the broader system of linear heritage areas, and the strong correlations and interactions have not been thoroughly examined. The combination of linear cultural heritage and ICH along the route is more beneficial for the protection and continuation of ICH.
Research on the spatial distribution of ICH has seen continuous methodological advancement, evolving from early static mapping to spatial modeling and multi-factor driving mechanism analysis. In terms of spatial pattern identification, GIS techniques have been widely applied for ICH visualization and spatial structure analysis. Cheng et al. utilized the nearest neighbor index to detect the overall distribution patterns of ICH and employed kernel density estimation to generate heat maps for visualizing clustering areas [38]. However, both methods have clear limitations: the nearest neighbor index only reflects overall clustering without identifying multi-scale or regional variations; kernel density estimation does not account for area differences among regions, potentially leading to biased interpretations, and it lacks a built-in mechanism for statistical significance testing. Subsequent studies introduced spatial autocorrelation analysis to examine regional spatial relationships of ICH [39]. Nevertheless, spatial autocorrelation itself does not infer causality and must be integrated with other models to identify underlying driving mechanisms. In terms of factor identification and driving mechanism analysis, existing studies can be broadly divided into two methodological approaches. The first approach involves the spatial proximity of influencing factors through spatial overlay and buffer zone analysis. For example, Zhang used buffer zone comparisons to examine differences in ICH quantity [40], while Liu employed location entropy to measure the clustering intensity of various ICH types [41]. However, such methods are often limited to single-factor analyses, lack consideration of interaction effects and statistical significance, and exhibit limited robustness. The second approach tends to adopt the Geodetector model to assess the influence of multiple natural, socioeconomic, and cultural variables on ICH spatial distribution. The Geodetector model is capable of identifying the explanatory power of each factor as well as pairwise interactions, without requiring linear assumptions, and is applicable to both categorical and continuous variables [42]. Nonetheless, this method cannot capture spatial heterogeneity in factor influence—specifically, it cannot determine whether a factor exerts uniform effects across different regions.
Previous studies have pointed out that the overall spatial pattern of ICH in China typically exhibits a “clustered distribution with core hotspots” [38], a feature that is particularly evident along linear heritage corridors such as the Ming Great Wall [27] and the Yellow River [39]. The distribution of ICH is influenced by multiple factors, including natural, social, and cultural elements, among which socioeconomic variables generally demonstrate stronger explanatory power. Studies on the spatial distribution of ICH in the Beijing–Tianjin–Hebei region—which partially overlaps with the current study area—also indicate that socioeconomic factors are the dominant drivers [37]. County-level studies on ICH spatial distribution have shown that tangible cultural heritage is closely linked with ICH resources and that the natural environment is the most significant cultural–ecological factor aside from tangible heritage [43].
Based on the above, two hypotheses are proposed:
H1. 
The distribution of ICH along the Great Wall in Hebei Province follows a clustering pattern.
H2. 
Socioeconomic factors have the greatest influence on the distribution of ICH along the Great Wall in Hebei Province, followed by cultural factors and, finally, by natural factors.
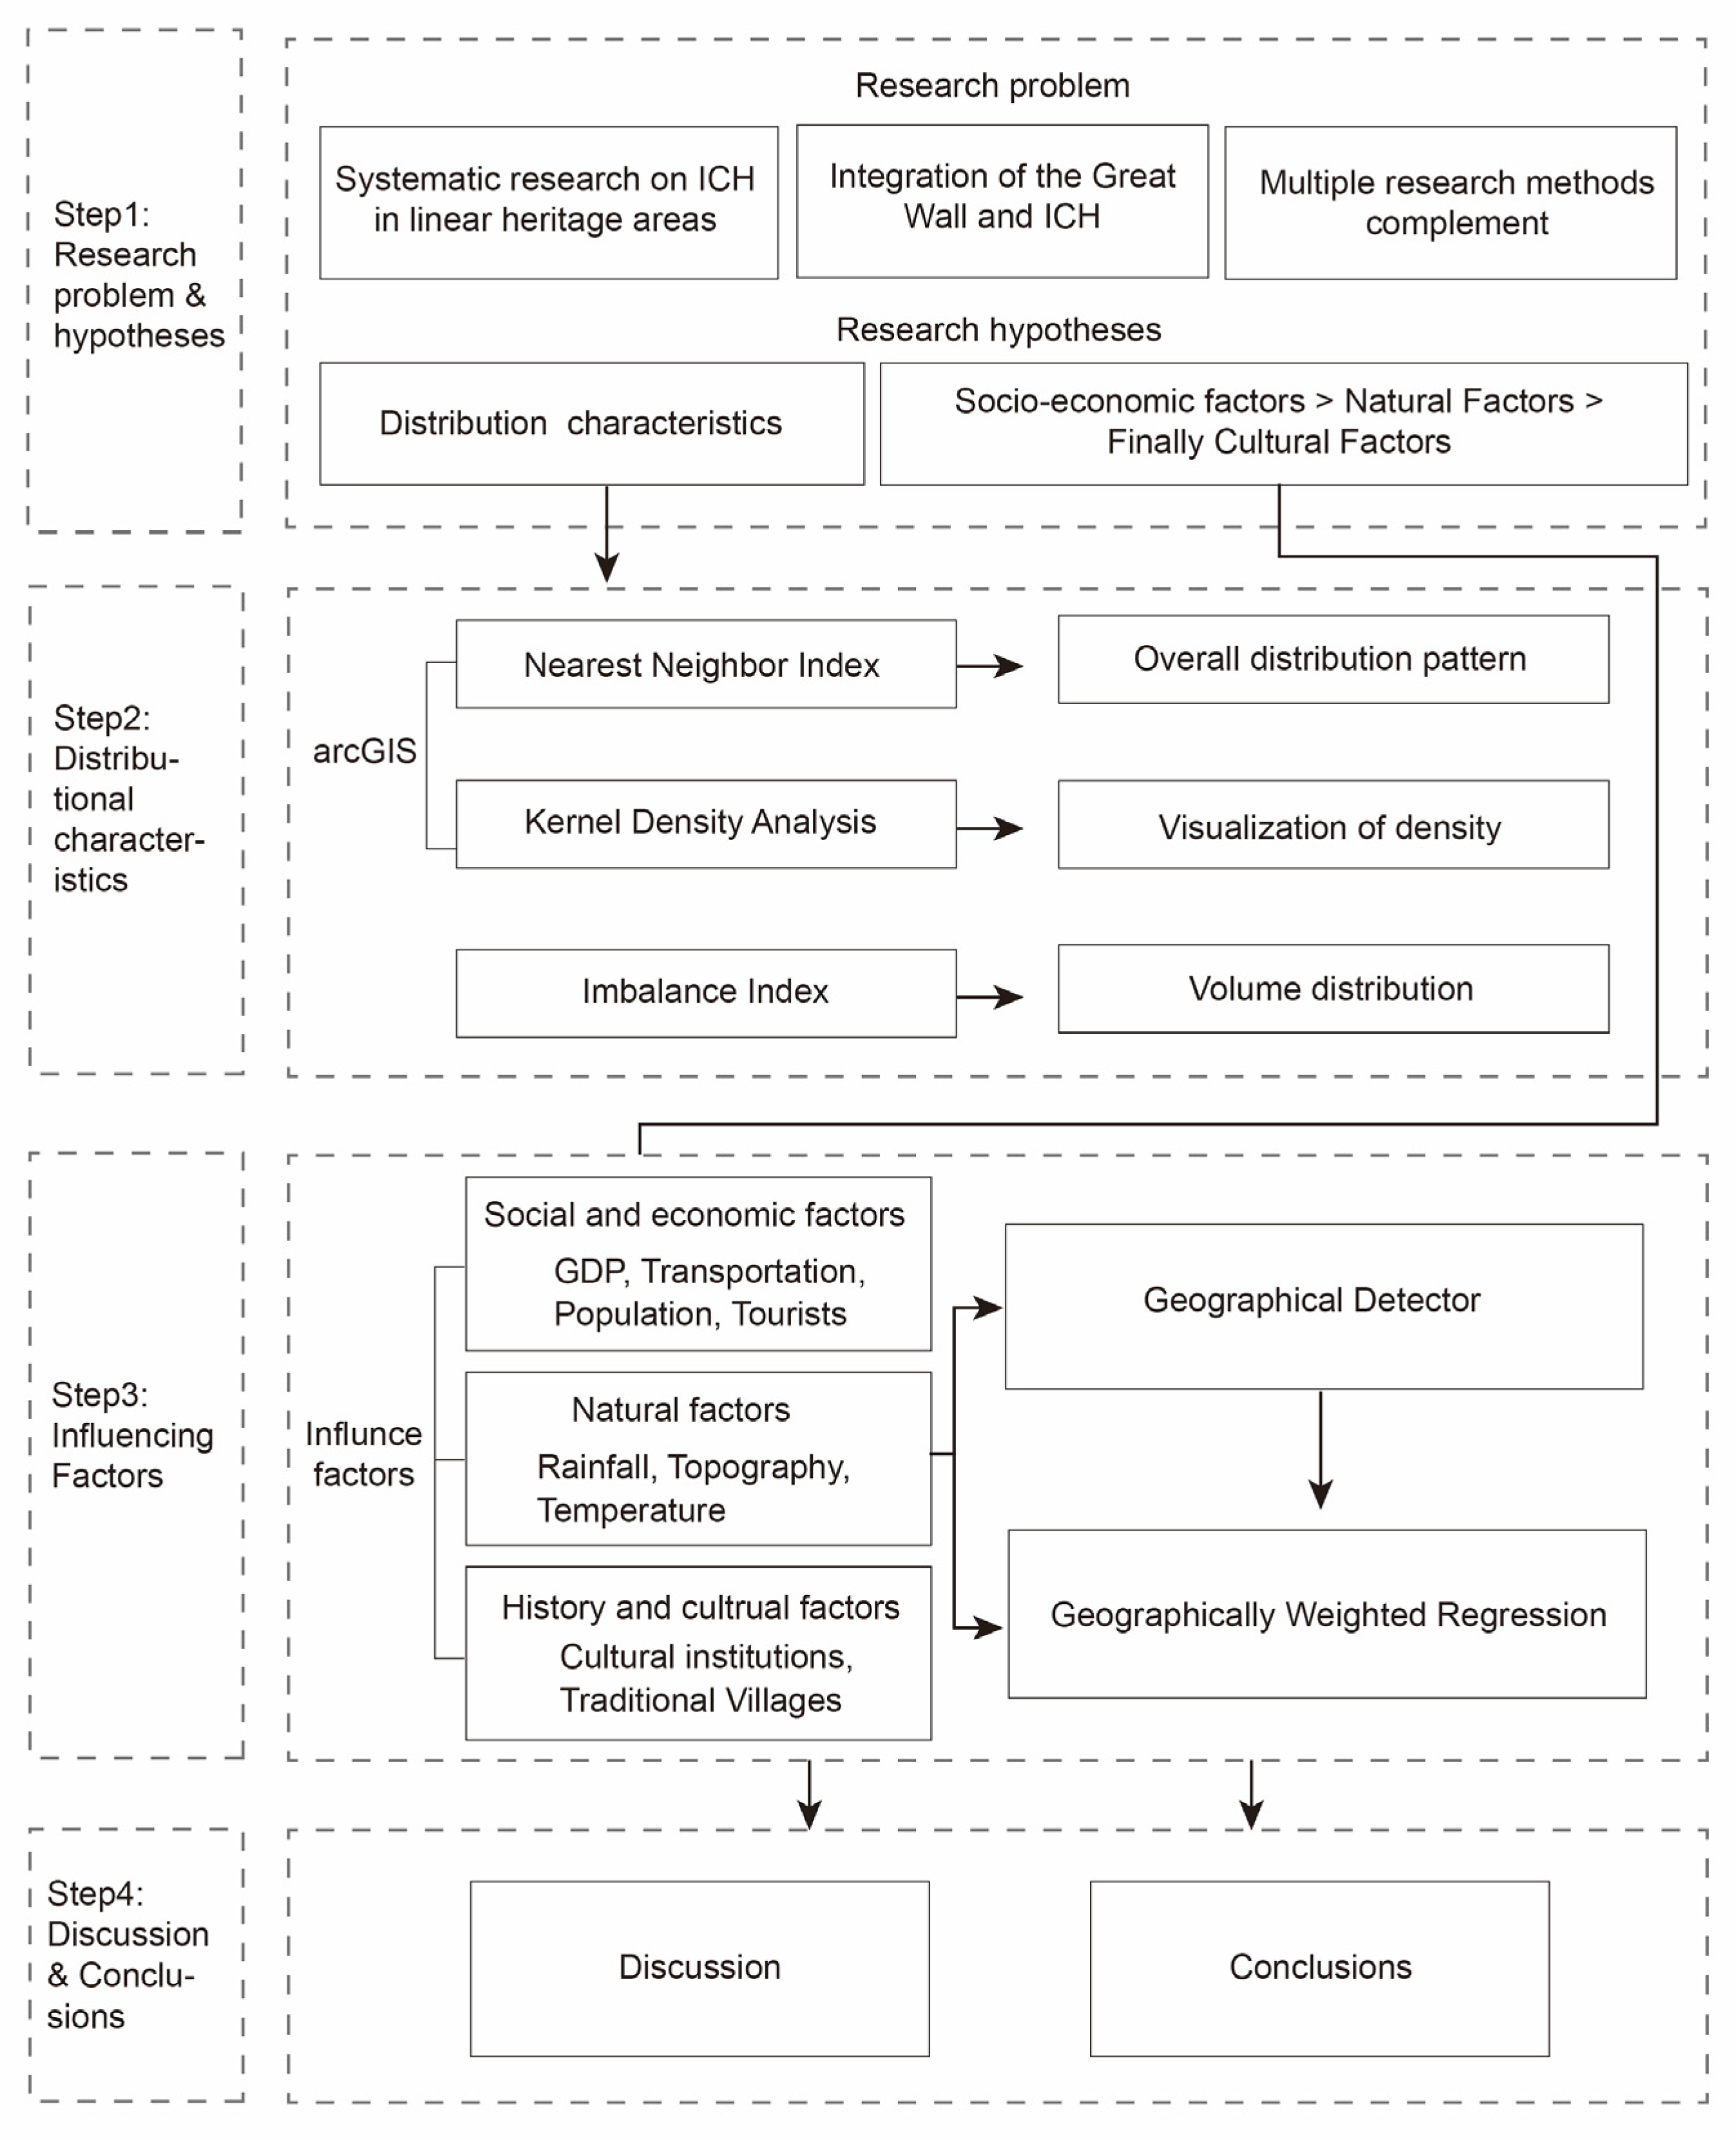
Overall, existing research on the spatial distribution of ICH lacks sufficient explanatory power for underlying mechanisms and fails to provide a systematic integration of spatial patterns with their driving forces. To address these limitations and test the proposed hypotheses, this study focuses on provincial-level and above ICH items within 58 county-level regions along the Great Wall in Hebei Province. A three-stage analytical framework is proposed, consisting of: spatial clustering identification, driving mechanism detection, and spatial heterogeneity modeling. This hierarchical and complementary structure aims to comprehensively reveal the spatial pattern and influencing mechanisms of ICH along the Great Wall in Hebei. The nearest neighbor index analysis is applied to detect the overall spatial distribution pattern of ICH points and to preliminarily assess clustering trends. Kernel density estimation is used to identify core clusters of ICH resources in a geographic space, providing a visual complement to spatial density patterns. The imbalance index and the Lorenz curve are employed to quantify the degree of resource concentration across different counties. The Geodetector model is applied to analyze the driving mechanisms behind ICH spatial distribution, identifying key influencing factors and capturing their interactive and synergistic effects. A Geographically Weighted Regression (GWR) model is introduced to examine the spatial heterogeneity of the driving factors’ local influences. The integration of the Geodetector and the GWR models enables both the identification of overall explanatory power and the mapping of spatial heterogeneity, achieving a coherent combination of causal inference and mechanism modeling.
2. Materials and Methods

2.1. Study Area and Data Sources

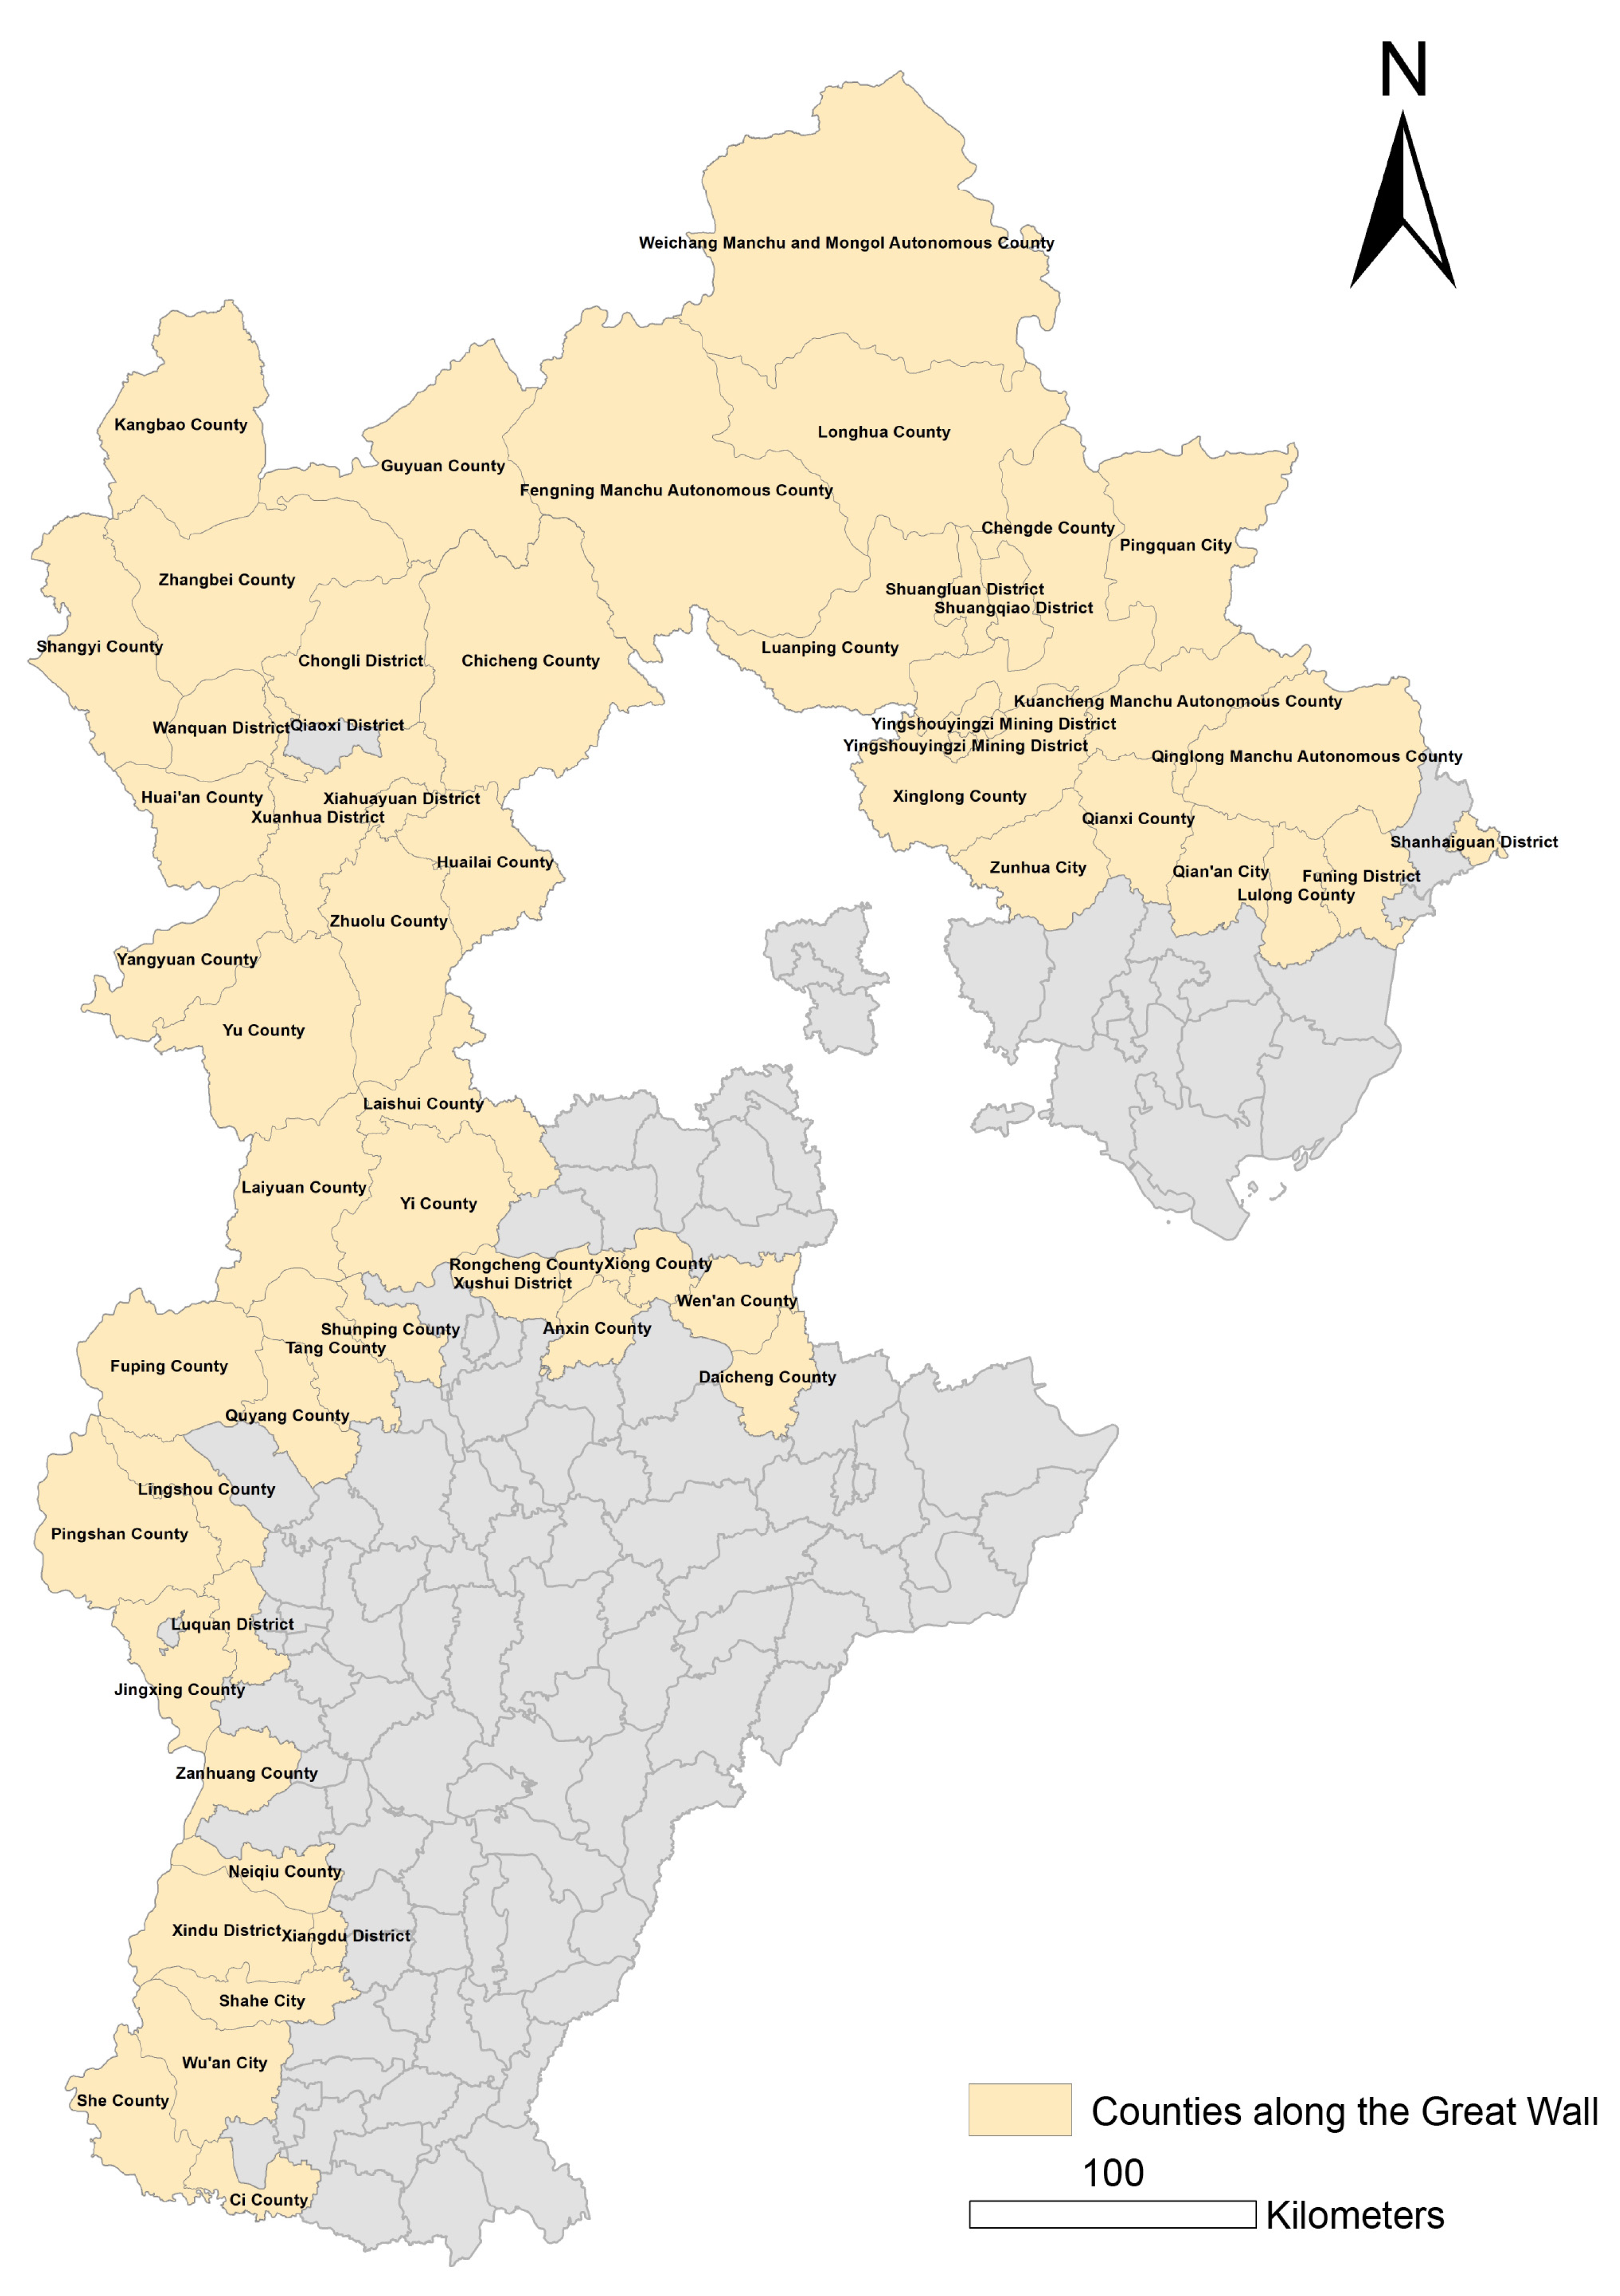
The Great Wall in Hebei Province is primarily located in the northern regions, including the mountainous areas in northern Hebei Province, the Inner Mongolia Plateau, and the Yan Mountains–Taihang Mountains area. Hebei Province hosts a substantial portion of the Great Wall, stretching 2498.54 km and accounting for 11.79% of the total Great Wall in China. This includes 1338.63 km of the Ming Great Wall with 1153 sections, 5388 standalone buildings, and 302 fortresses; the section from the Warring States to the early Jin dynasty measures 1159.9 km, including 915 standalone buildings and 70 fortresses [44]. Based on the “Reply from the National Cultural Heritage Administration on the Recognition of the Great Wall in Hebei Province” [45], as shown in Figure 1, the Great Wall in Hebei Province spans 58 counties (county-level city, districts), including the areas where Xingtai City’s Xingtai County, Qiaodong District, and Qiaoxi District have been reclassified as Xiangdu District and Xindu District. It includes the walls and auxiliary facilities built or used during historical periods such as the Warring States, Han, Northern Wei, Northern Qi, Tang, Jin, and Ming dynasties. Given that municipal divisions cover a vast area, that the township/village scale is insufficient to capture the cross-community transmission of ICH, and that the National Cultural Heritage Administration recognizes the Great Wall resources and ICH listing units at the county level, this study retains the full county-level administrative units along the Great Wall.
The distribution of the Great Wall across different dynasties is derived from the “China Great Wall Chronicle” [46]. The information on the number, types, and application locations of national and provincial ICH items (including sub-items) is sourced from the first to seventh batch of lists published on the China ICH website (www.ihchina.cn, accessed on 7 October 2024) and the official website of the Hebei Provincial People’s Government (www.hebei.gov.cn, accessed on 7 October 2024). The addresses within the ICH application areas are converted into coordinates using Amap V15.20.0 software. Information on airports, railways (including high-speed rail), highways, and provincial roads is sourced from Google Earth; data on GDP per capita, tourist numbers, and other indicators come from the 2023 National Economic and Social Development Statistical Bulletins of each county; and county-level population data are derived from the Seventh National Population Census of China (2020). The data on national historical and cultural towns (batches 1–7), national historical and cultural villages (batches 1–7), and traditional Chinese villages (batches 1–6) are sourced from the official website of the Ministry of Housing and Urban-Rural Development of China (www.mohurd.gov.cn, accessed on 24 October 2024). DEM elevation data, annual average temperature, and annual precipitation were sourced from Chinese Academy of Sciences Spatial Geographic Data Cloud (www.gscloud.cn, accessed on 23 October 2024).

2.2. Methods

2.2.1. Nearest Neighbor Index

This method uses ArcGIS 10.8 software tools to calculate the average distance between each ICH point and its nearest neighbor and compares it with the theoretical distance of random distribution to determine the distribution pattern, which helps to assess the overall distribution trend of ICH along the Great Wall in Hebei Province. Ripley’s K fits continuous distance analysis but not overall clustering; the nearest neighbor index is simpler and better for macro-level trends. The Z value represents the number of standard deviations from the mean, and the p value indicates statistical significance probability. The calculation formula is as follows:
R = r ¯ 1 r ¯ E
r ¯ E = 1 2 n / A
The R represents the nearest neighbor index; r ¯ 1 indicates the actual average nearest neighbor distance of ICH sites; r ¯ E represents the theoretical average distance of a random distribution of ICH sites; n is the number of ICH sites; and A is the area of the region. Set A as the area of the study area. When the R value is 1, it indicates that the distribution of ICH sites tends to be random; when R > 1 the sites tend to be uniformly distributed, with a higher R value indicating a higher degree of uniform distribution; when R < 1, the sites tend to be clustered, with a smaller R value indicating a higher degree of clustering.

2.2.2. Kernel Density Analysis

Kernel density analysis is employed to evaluate the spatial clustering of ICH resources, calculating the distribution density of ICH points and their surrounding areas within a unit region to quickly identify the core zones, dense belts, and blank areas in the distribution of ICH. The adoption of kernel density estimation over hotspot analysis is justified by the latter’s limitation of statistically significant cluster identification, whereas the former provides superior functionality in detecting both density gradients and spatial voids. The formula for the nearest neighbor index is as follows [40]:
f ( x ) = 1 n h i = 1 n k x X i h
The k () represents the kernel function; h > 0 is the bandwidth, and the h is set to 25 km; the output cell size is 100; and ( x X i ) represents the distance from the estimation point x to X i .

2.2.3. Imbalance Index and Lorenz Curve

The imbalance index (S) can be used to quantify the concentration of ICH in counties (districts and county-level cities) along the Great Wall in Hebei, providing a clear representation of which counties have the highest concentration of ICH resources and the degree of concentration. To enhance the scientific reliability of the research conclusions, this study introduces the Lorenz curve as a supplementary analysis method. Originally used to reflect income distribution equality in a country, its application has become increasingly widespread across various fields in recent years [47]. The imbalance index was chosen over the Theil index because the latter is more suitable for analyzing multi-level hierarchical structures and is not appropriate for small-sample county-level data. The imbalance index formula is as follows:
S = i = 1 n Y i 50 n + 1 100 n 50 n + 1
The n represents the total number of counties in the study area, and the Y i is the cumulative percentage of ICH quantity in each county, ranked in descending order. The S value ranges from [0, 1], where a value closer to 1 suggests a highly uneven distribution of ICH among counties, while a value closer to 0 indicates a more uniform distribution. The Lorenz curve visually demonstrates the unevenness of the distribution of ICH across counties. The greater the curvature of the curve, the more uneven the distribution of ICH resources, while the closer the curve is to the diagonal line, the more evenly distributed the resources are.

2.2.4. Geographical Detector

The Geographical Detector model is a multi-factor analysis method based on spatial stratified heterogeneity. The rationale for employing the Geodetector framework rather than multiple linear regression lies in the latter’s primary suitability for global trend modeling and explanatory factor analysis, coupled with its limited capability in detecting multi-factor interaction effects. Its core functions include two modules: Factor Detection and Interaction Detection. This study focuses on examining the influence of multidimensional factors—namely natural geography, socioeconomic conditions, and historical–cultural heritage—on the spatial differentiation of ICH along the Great Wall in Hebei Province. Furthermore, by employing interaction detection methods within the Geodetector framework, the study explores the coupling relationships and spatial interaction mechanisms among these factors, providing both theoretical insights and empirical evidence for understanding the multi-factorial drivers of ICH distribution [42]:
q = 1 h 1 L N h σ h 2 N σ 2 = 1 S W W S S T
The q represents the explanatory power of a certain influencing factor on the spatial distribution of ICH, with a range of [0, 1], where a larger value indicates stronger explanatory power.

2.2.5. Geographically Weighted Regression

Geographically Weighted Regression (GWR) is a regression analysis method that accounts for spatial heterogeneity, enabling the exploration of local variations in the influence of explanatory variables on ICH distribution. Unlike ordinary least squares (OLS) regression, GWR not only estimates the varying strength of each explanatory factor across regions but also visualizes local influence mechanisms spatially. The model is expressed as:
y i = β 0 μ i , v i + k = 1 n β k μ i , v i x i k + ε i
The y i represents the global dependent variable; x i k denotes the observed value of the k independent variable at the i spatial unit; μ i , v i indicates the geographical coordinates of the i spatial unit; β 0 μ i , v i is the local intercept term; β k μ i , v i represents the spatially varying coefficient for the k independent variable; and ε i stands for the random error term.
The methodological framework and its components are visually summarized in Figure 2.

3. Results

3.1. Structural Distribution Characteristics of ICH

Within 58 counties along the Great Wall in Hebei Province, there are 347 ICH items of provincial level or higher, constituting 35.69% of all such heritage items in the province. With the municipal boundary between Zhangjiakou and Baoding City marking the division between north and south, the disparity in numbers is minimal, with 160 ICH items in the north accounting for 46.1% and 187 in the south accounting for 53.9%. According to the classification into ten categories from the Chinese Directory of ICH (Table 1), the types of ICH items and their proportions from highest to lowest are: traditional techniques 69 sites (20.46%); folkways 57 sites (16.44%); traditional drama 41 sites (11.82%); traditional music 41 sites (11.82%); traditional dance 35 sites (10.08%); traditional sports, amusement, and acrobatics 31 sites (8.94%); art 28 sites (8.08%); folk literature 21 sites (6.06%); dramatic balladry 17 sites (4.90%); and traditional medicine 5 sites (1.44%).

3.2. Analysis of the Spatial Distribution Characteristics of ICH

3.2.1. Overall Distribution Characteristics

This paper uses the ArcGIS 10.8 nearest neighbor index analysis tool to analyze the coordinates of ICH sites (Table 2), revealing that the nearest neighbor index value (R) of ICH sites along the Great Wall in Hebei Province is 0.63, indicating a clustering pattern. Among all types of ICH items, traditional techniques exhibit a clearly clustered distribution, with an R value of 0.61. For the other types, arts (0.88), folk literature (0.88), folkways (0.90), traditional dance (0.94), traditional drama (0.95), traditional medicine (1.02), traditional music (1.06), and traditional sports, amusement, and acrobatics (1.07), with dramatic balladry at (1.23). Besides dramatic balladry, which shows a uniform distribution, the remaining eight types are randomly distributed.

3.2.2. Density Distribution of ICH

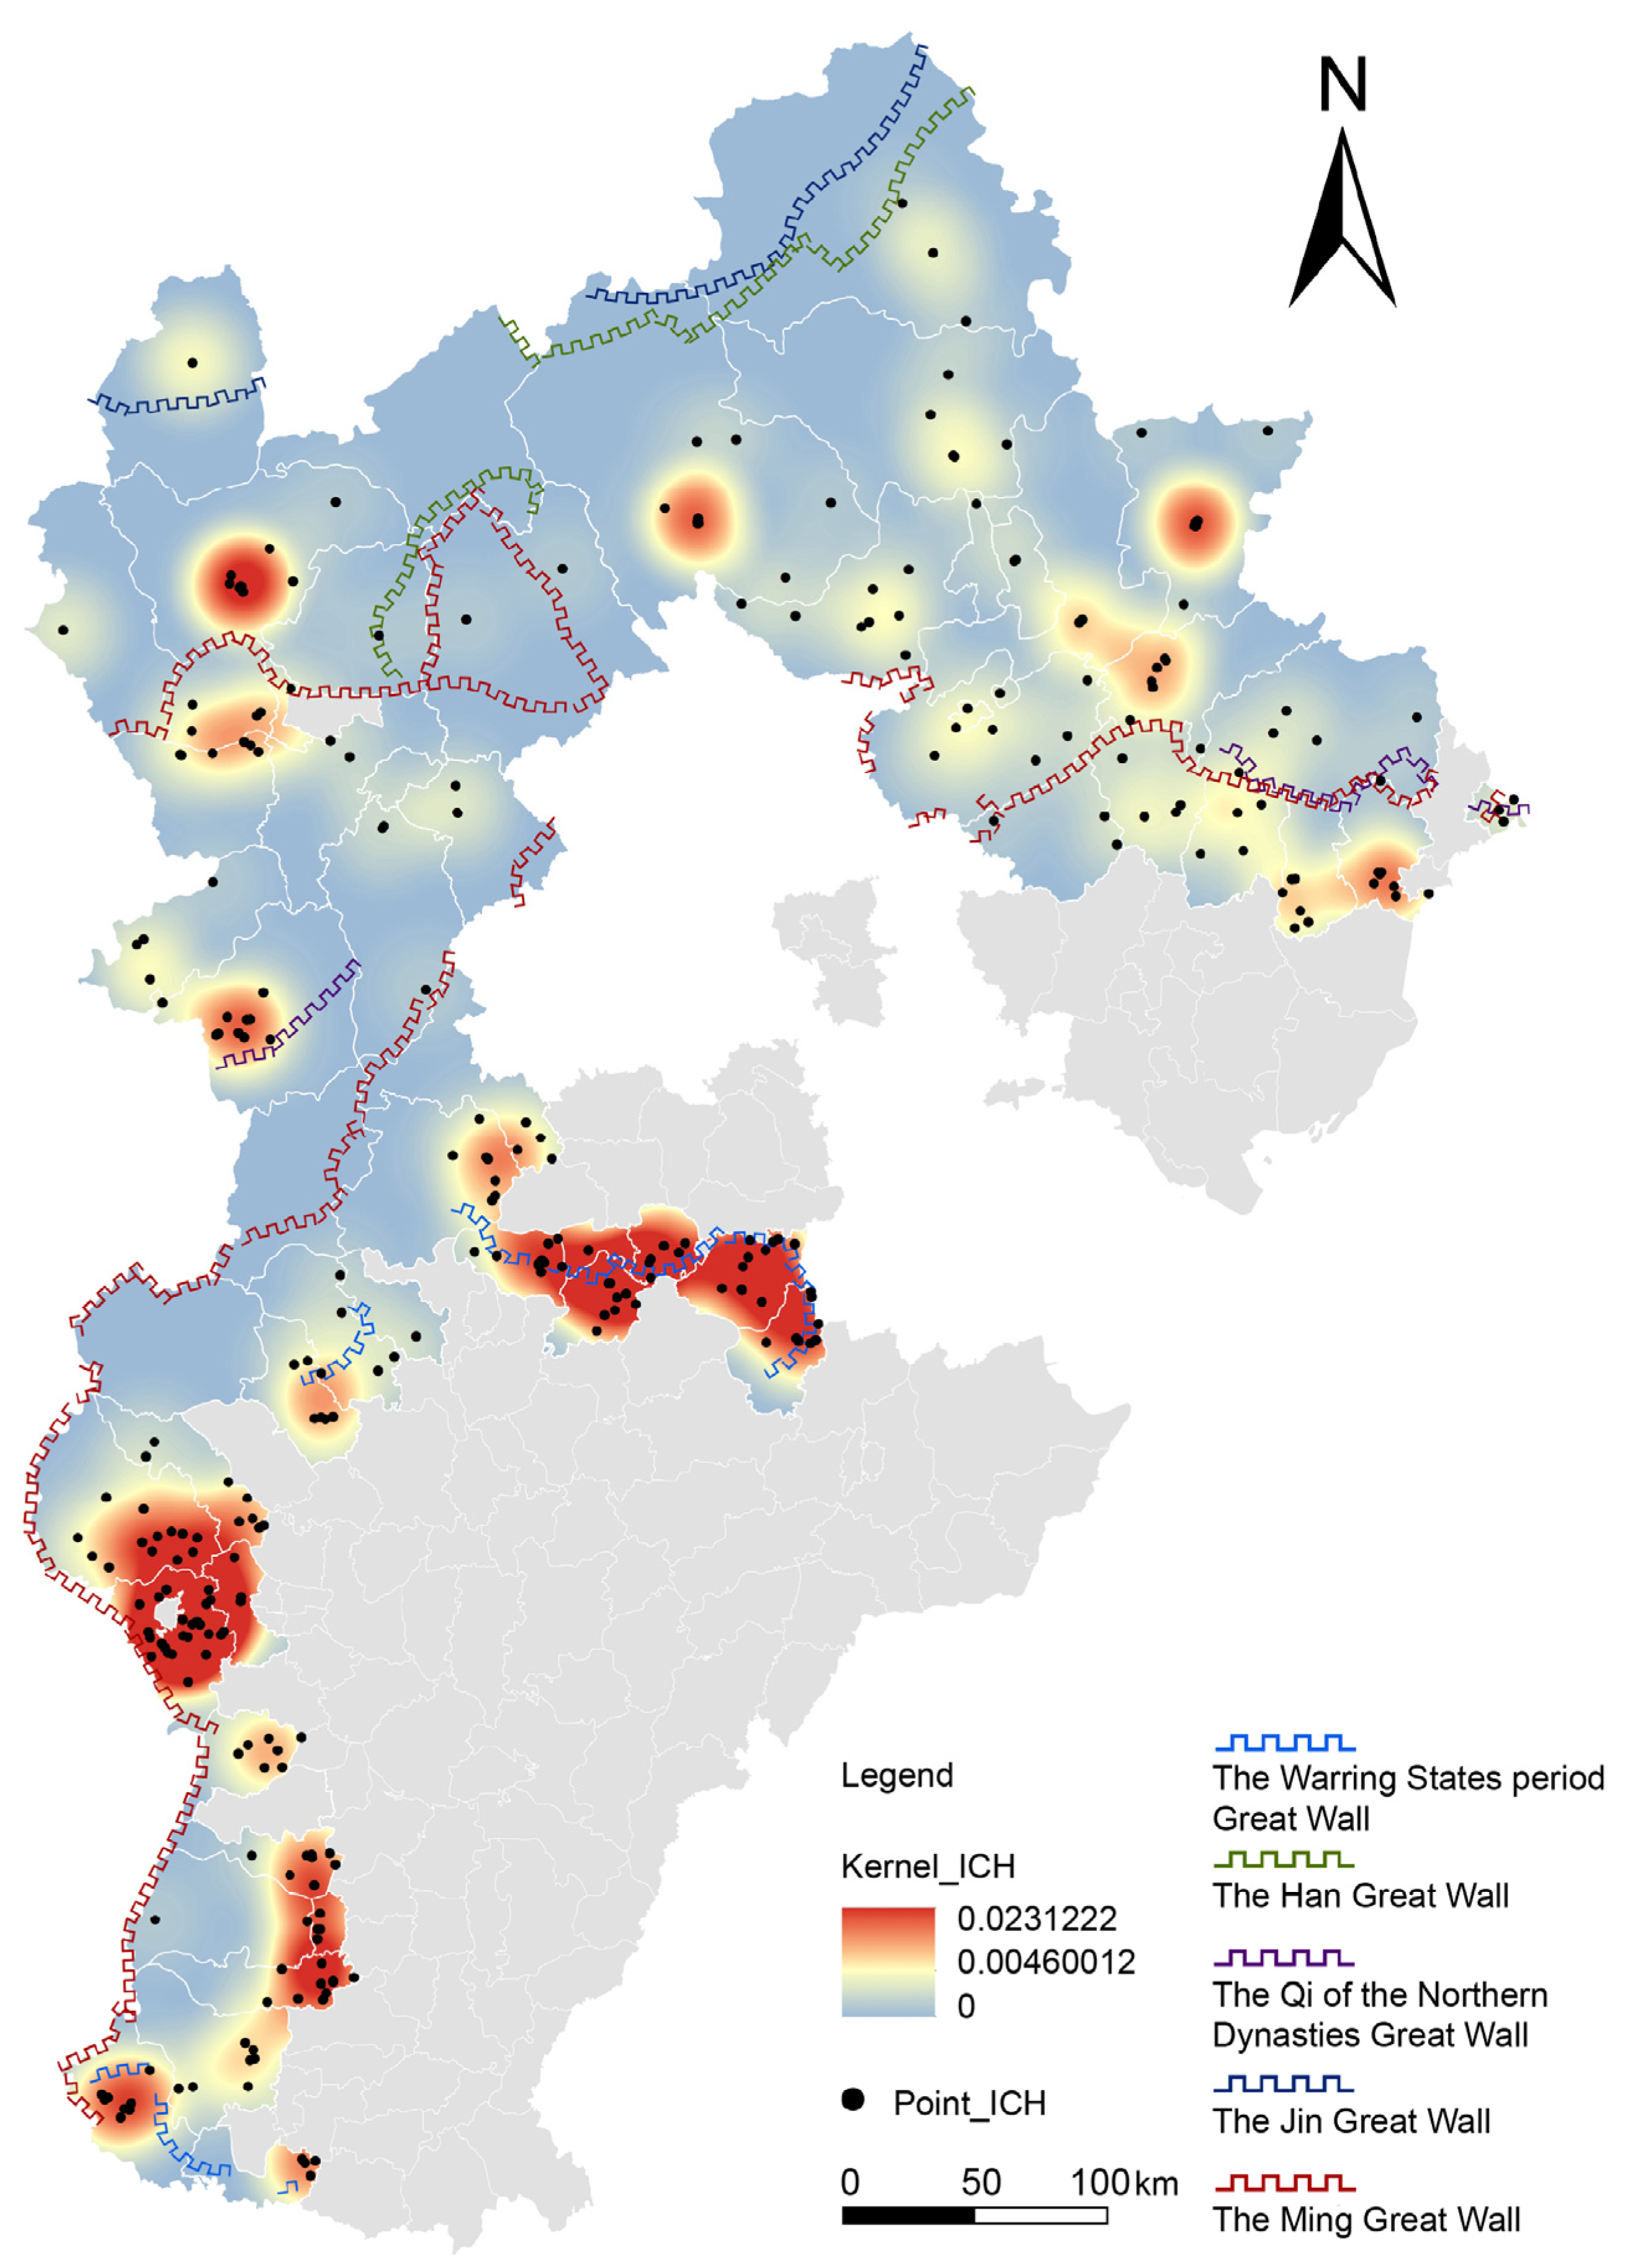
A total map of ICH density distribution along the Great Wall in Hebei Province counties was created using the kernel density analysis tool. As shown in Figure 3, there is a significant difference in the clustering of ICH between the north and south parts, influenced by county spatial distribution patterns, population density differences, and the distribution of the Great Wall resources. The southern sites are more densely arranged in bands, while the northern sites are more scattered. Along the Great Wall in Hebei Province, the ICH sites form two high-density core areas and one sub-high-density core area. The two high-density core areas are located around Jingxing-Pingshan-Lingshou County–Luquan City and Yi-Xushui-Rongcheng-Xiong-Wen’an County; the sub-high-density core area encompasses Neiqiu County–Xindu-Xiangdu District–eastern part of Shahe City. The remaining point-based distributions are also noteworthy, with counties such as Fengning Manchu Autonomous County, Yu County, Zhangbei County, and Pingquan County forming localized clusters. To improve the credibility of the findings and examine whether ICH points are significantly clustered in high-density areas, this study applies a chi-square test to assess their distribution across different kernel density categories (low, medium, high). The results show: χ2 = 55.83, df = 2, and p < 0.001, indicating a significant difference between the observed distribution and the uniform hypothesis. This suggests a statistically significant spatial clustering trend of ICH points, mainly concentrated in medium- and high-density areas.
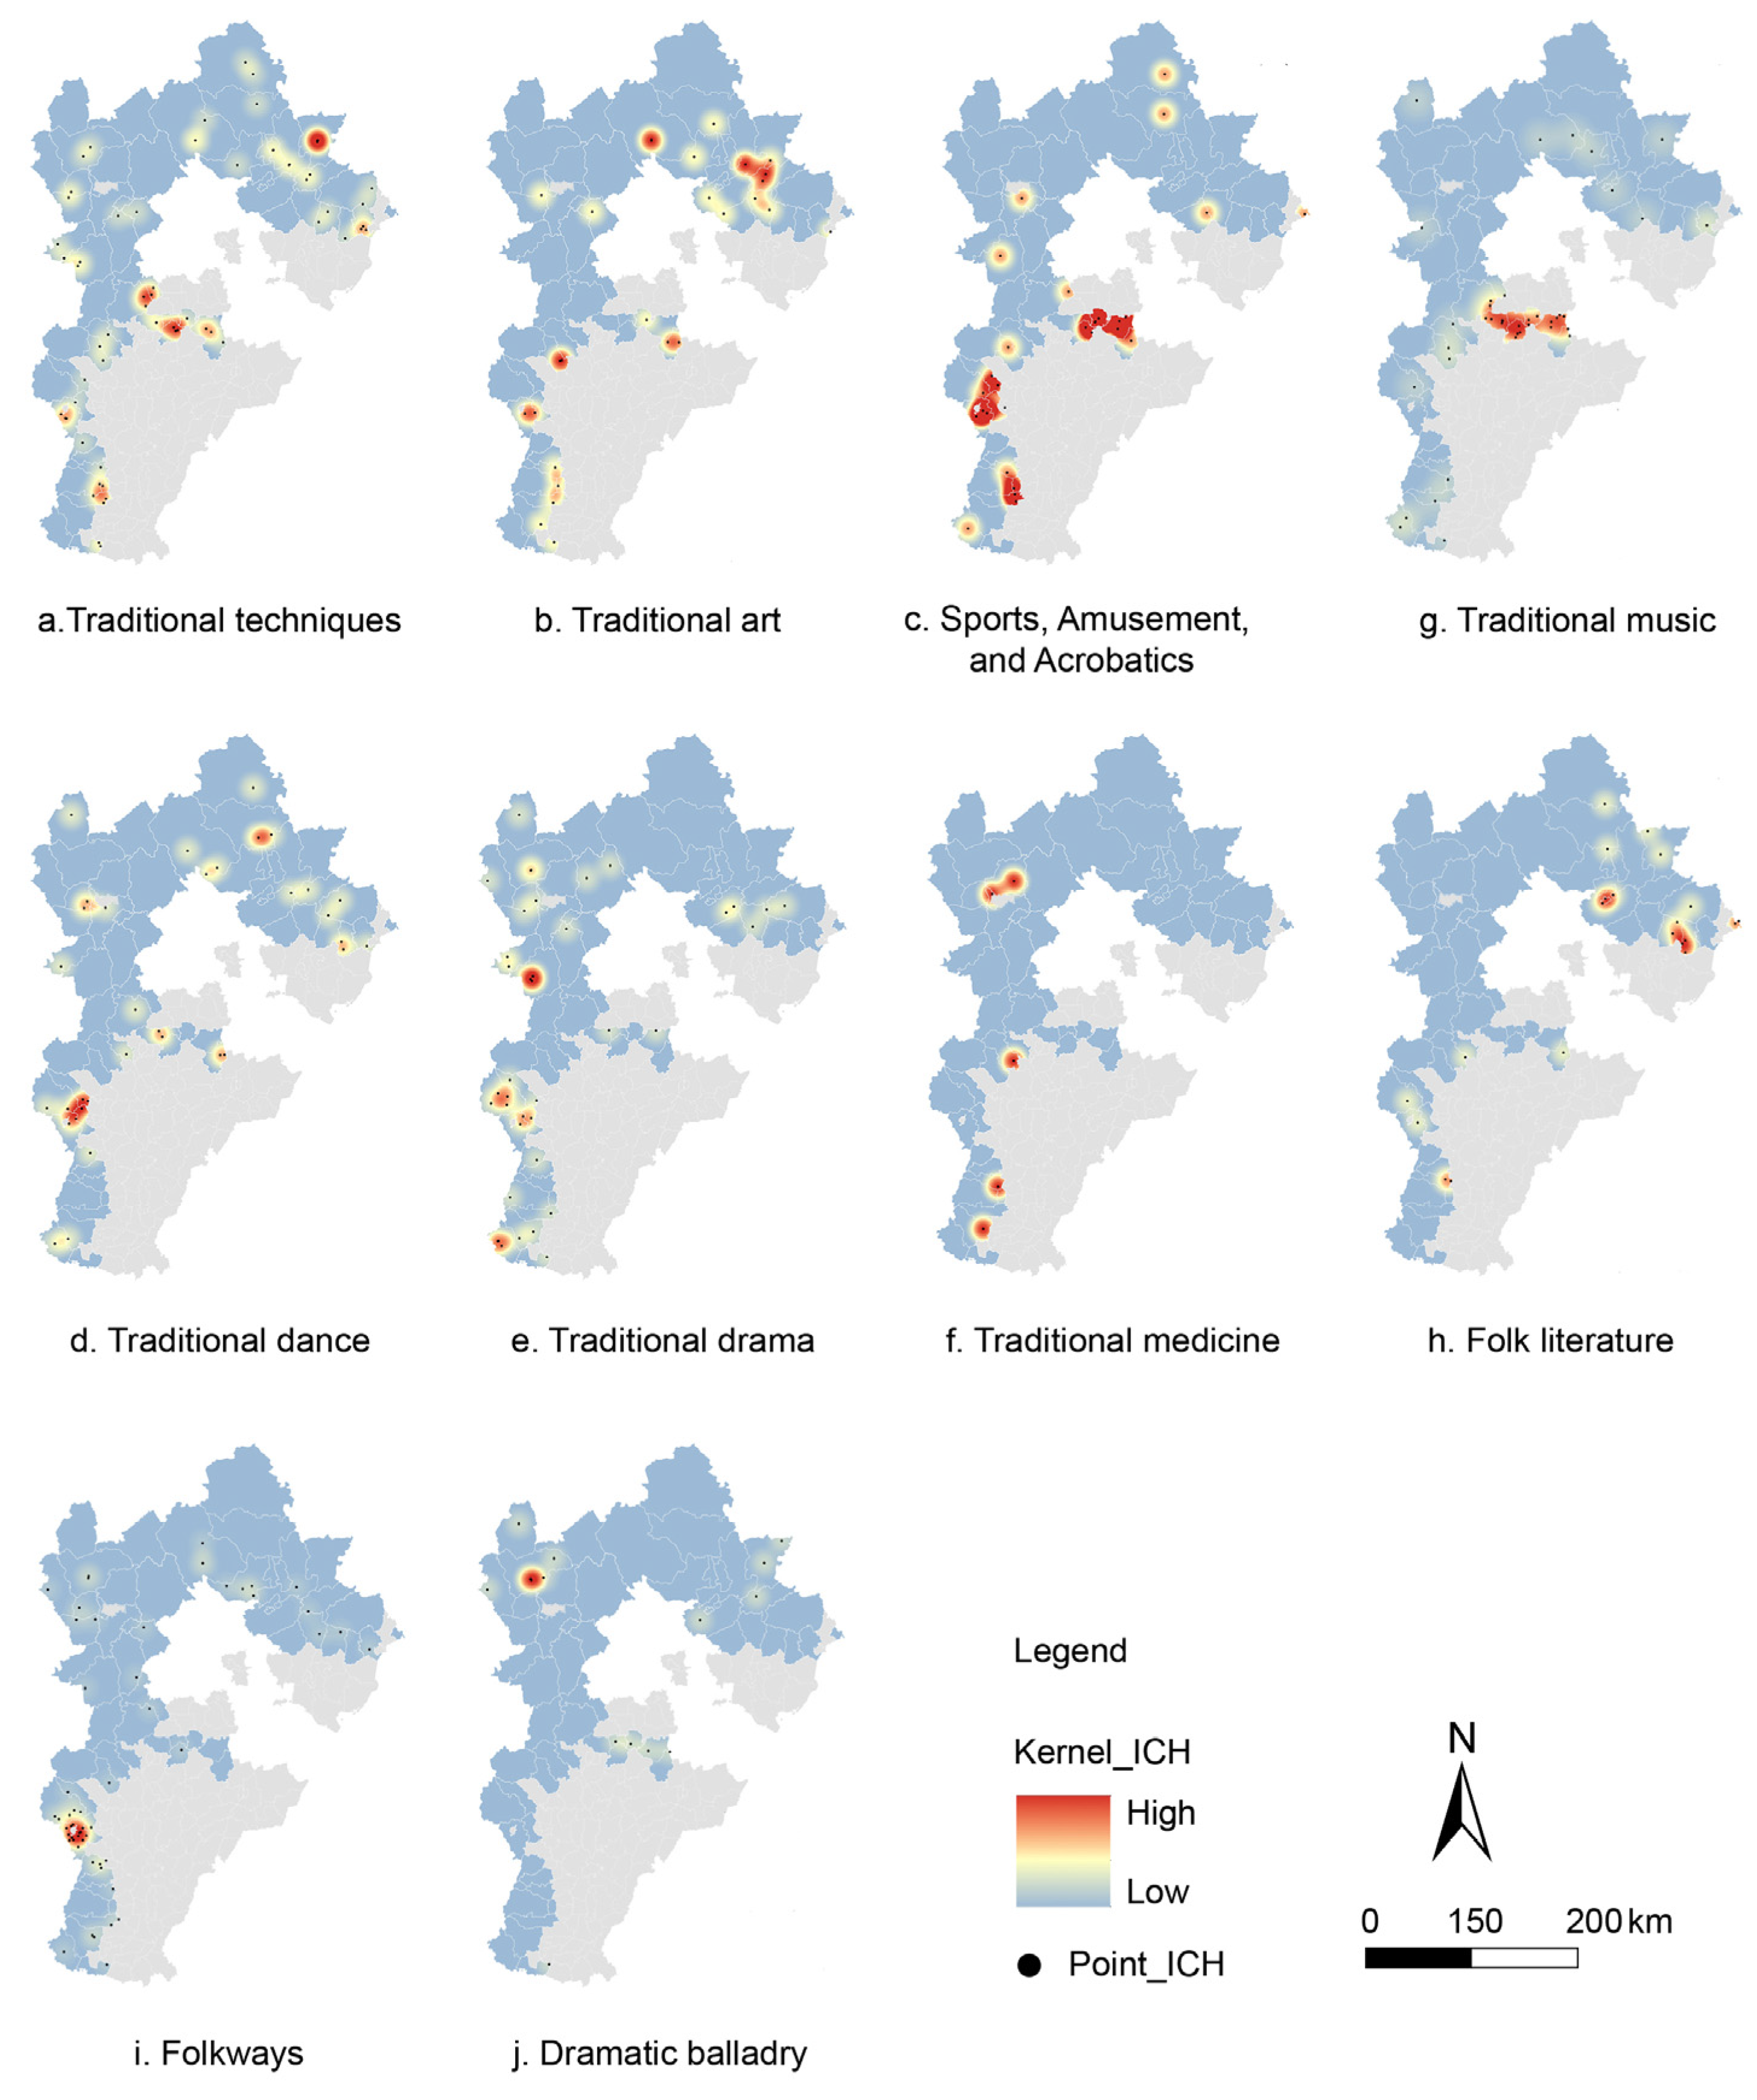
The differences in the distribution of concentrations of different types of ICH items are highly significant (Figure 4). Four types—folkways; traditional music; traditional sports, amusement, and acrobatics; and dramatic balladry—demonstrate prominent high-density core areas in Baoding City. The traditional sports, amusement, and acrobatics type is distributed across Anxin County, Xiong County, Wen’an County in Baoding, Jingxing County, Pingxiang County, Lingshou County in Shijiazhuang, and Shahe City and Xiangyang District in Xingtai. The other six types exhibit a scattered distribution.

3.2.3. Imbalance Index

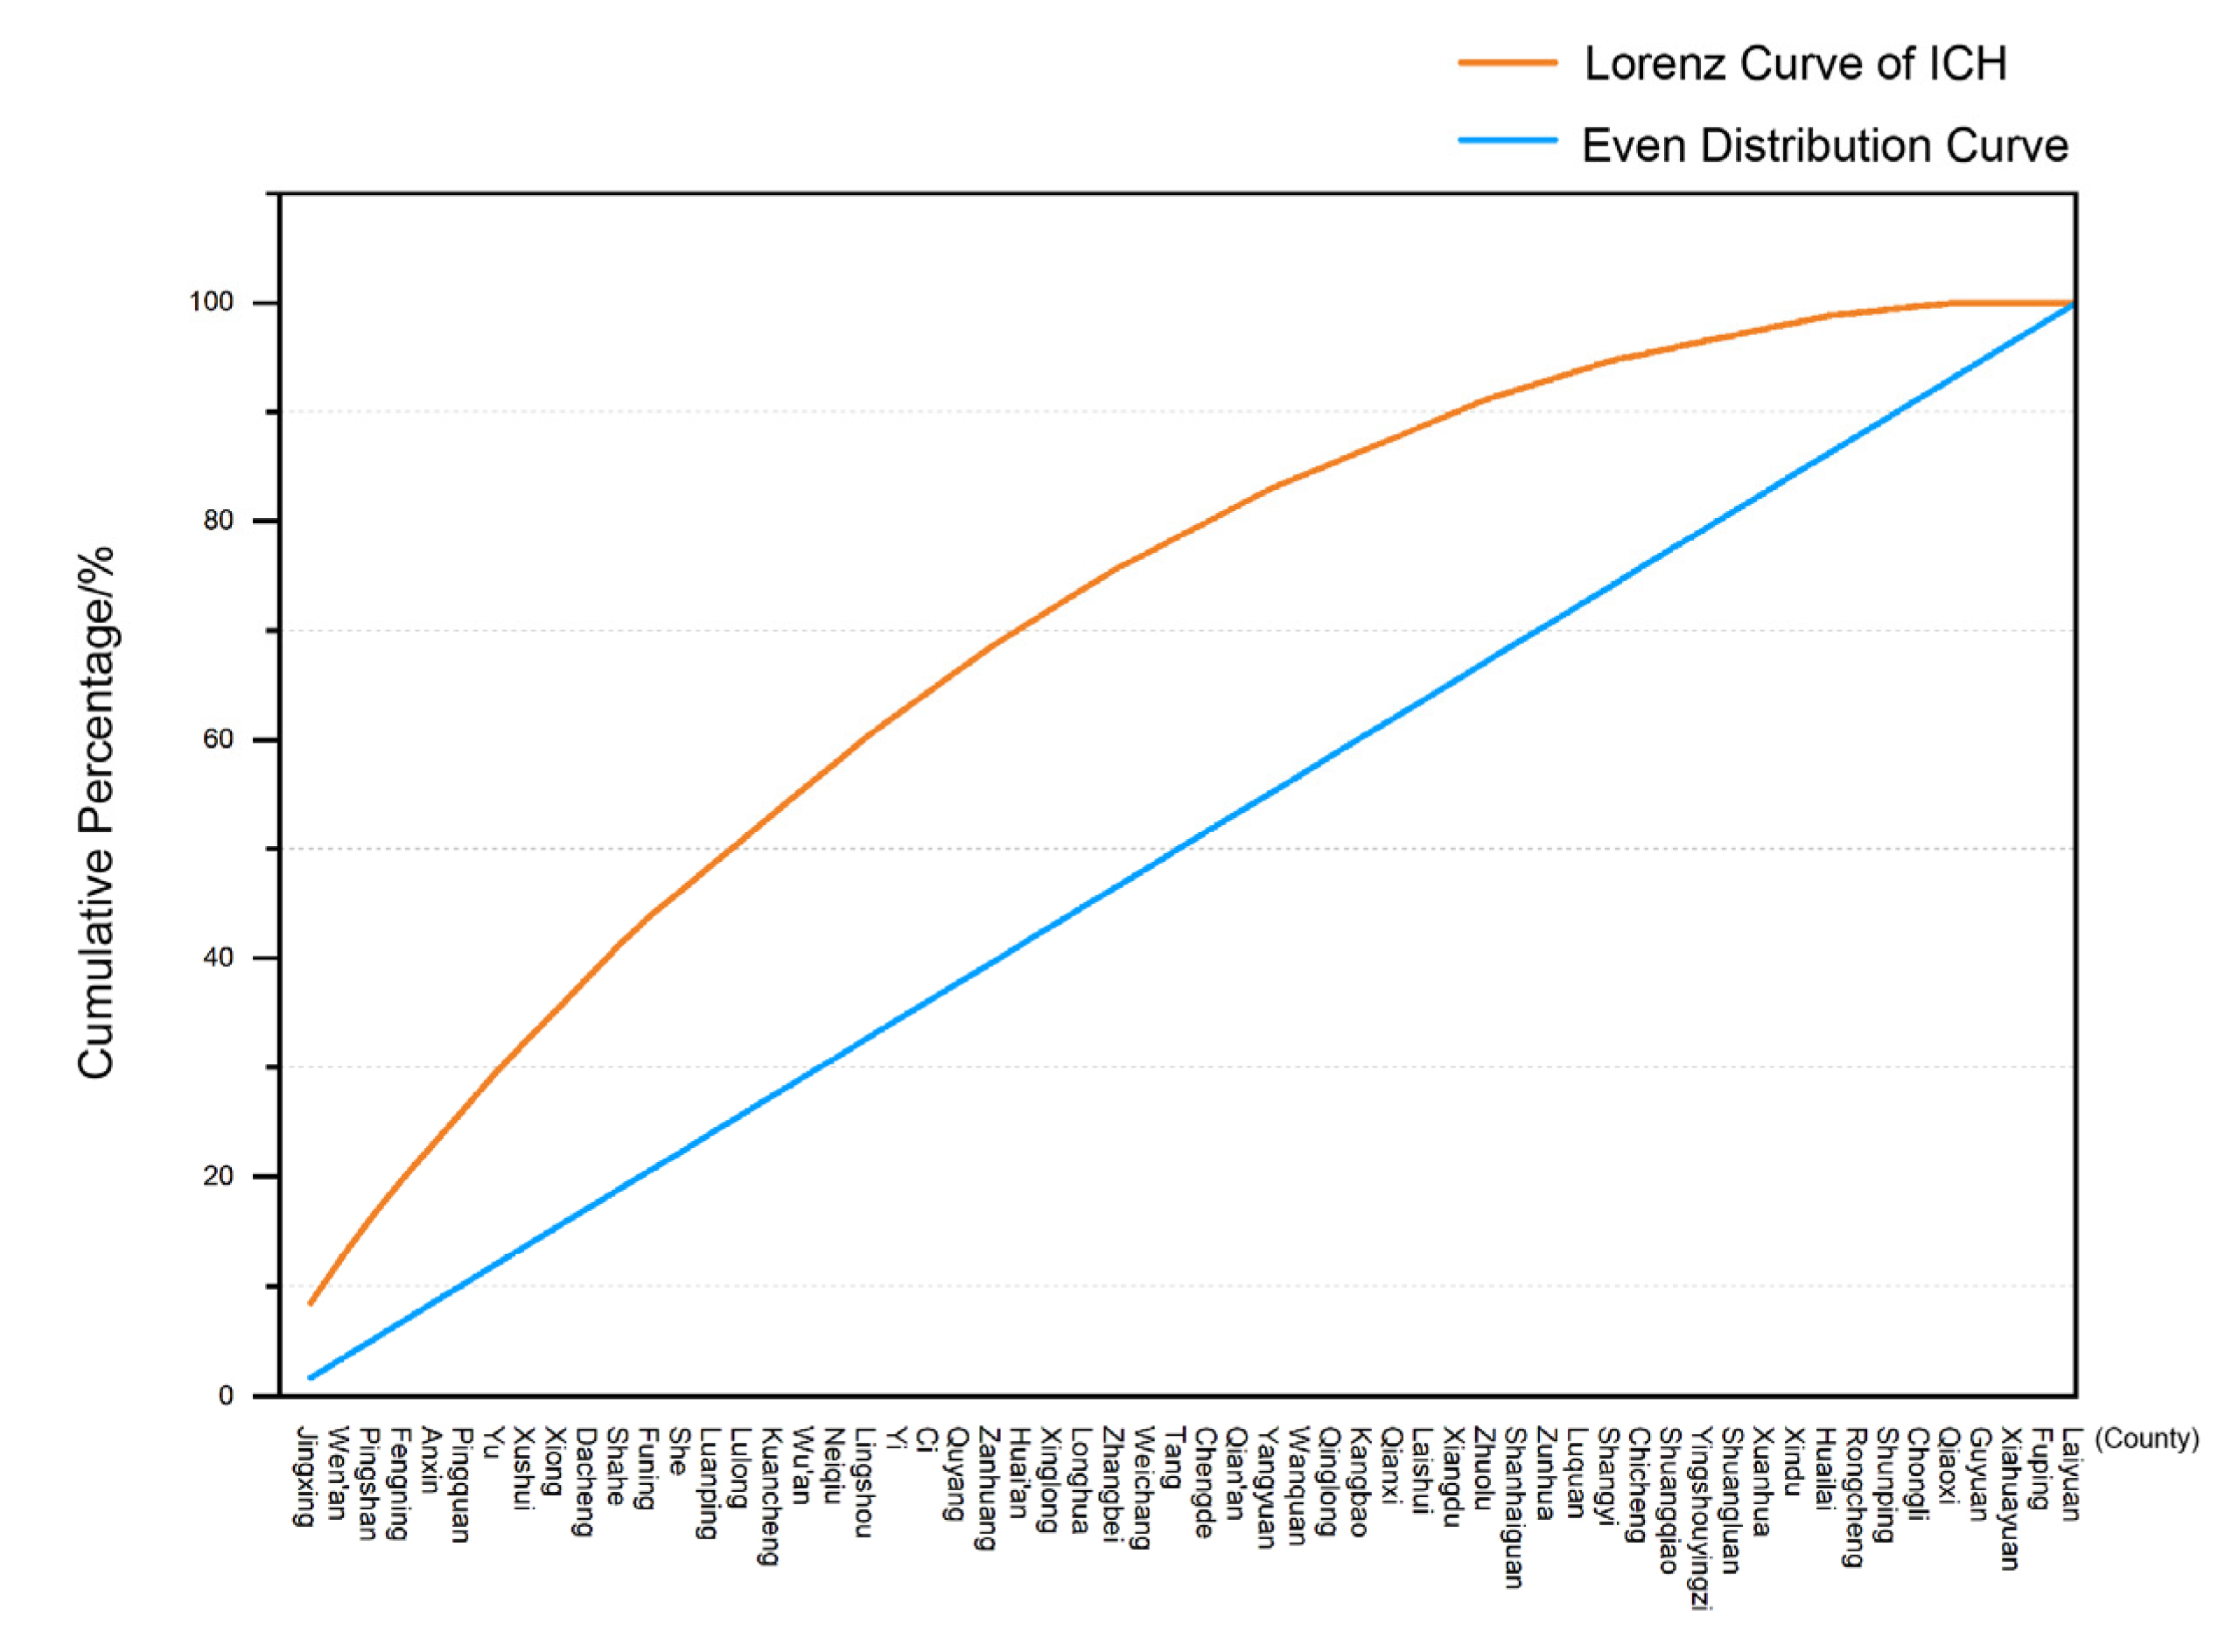
The imbalance index was calculated as S = 0.365, indicating that there is a certain degree of distribution disparity in ICH resources among counties. The Lorenz curve plot based on county-level ICH quantity data (Figure 5) uses the x-axis to represent counties ranked by ICH quantity from highest to lowest and the y-axis to show the cumulative percentage of ICH resources. The curve deviates significantly from the line of perfect equality (diagonal), forming a clearly convex shape. Of all the ICH resources, 50% are concentrated in the top 15 counties with the most ICH items, accounting for 25% of the total number of counties. Jingxing County, which has the highest number, holds 29 ICH items, representing 8% of the total. Among them, Xiahuayuan District, Fuping County, and Laiyuan County reported the lowest number of ICH items, with no provincial-level or higher ICH items officially registered. This finding is consistent with the results of the imbalance index, further confirming the uneven distribution of ICH items in the study area.

3.3. The Influencing Factors of ICH Spatial Distribution

3.3.1. Indicator Selection

As an important component of human cultural heritage, the formation and development of ICH is closely related to people’s production and daily life, influenced by a combination of economic, social, natural, and cultural development factors. Based on the previous literature [36,37,38,39,40,48] and expert recommendations, nine indicators were selected as factors: DEM elevation data; annual average precipitation; annual average temperature; total GDP; transportation accessibility; number of tourists; population density; number of cultural venues; and number of traditional villages (Table 3). To mitigate potential multicollinearity among independent variables, we conducted collinearity diagnostics and tolerance analysis using SPSS 29. The results indicated no significant multicollinearity concerns, as all nine variables exhibited variance inflation factor (VIF) values ranging from 1.198 to 3.920 (well below the threshold of 5) and tolerance values between 0.255 and 0.835 (exceeding the critical value of 0.1).

3.3.2. Analysis of Influencing Factors

The results of the Geographical Detector model show that the p-values for total GDP, transportation accessibility, population density, DEM elevation data, annual average precipitation, annual average temperature, and the number of tourists, cultural venues, and traditional villages are all less than 0.05, passing the significance level test. The influence of various factors on the distribution pattern of ICH along the Great Wall in Hebei Province is ranked as follows (Table 3): annual average temperature (0.4526) > annual average precipitation (0.4364) > traditional villages (0.3458) > cultural venues (0.2818) > number of tourists (0.2784) > transportation accessibility (0.2673) > DEM elevation data (0.2212) > population density (0.1921) > total GDP (0.1383). Natural factors have the greatest impact on the spatial distribution of ICH within counties along the Great Wall, followed by sociocultural factors, while economic factors have a relatively smaller influence.

3.3.3. Analysis of Interaction of Influencing Factors

The interaction detection results based on the Geographical Detector model indicate that the spatial distribution pattern of ICH along the Great Wall in Hebei Province is significantly influenced by the synergistic effects of multiple factors. This study classifies interaction effects into two types: Bivariate Enhancement and Nonlinear Enhancement.
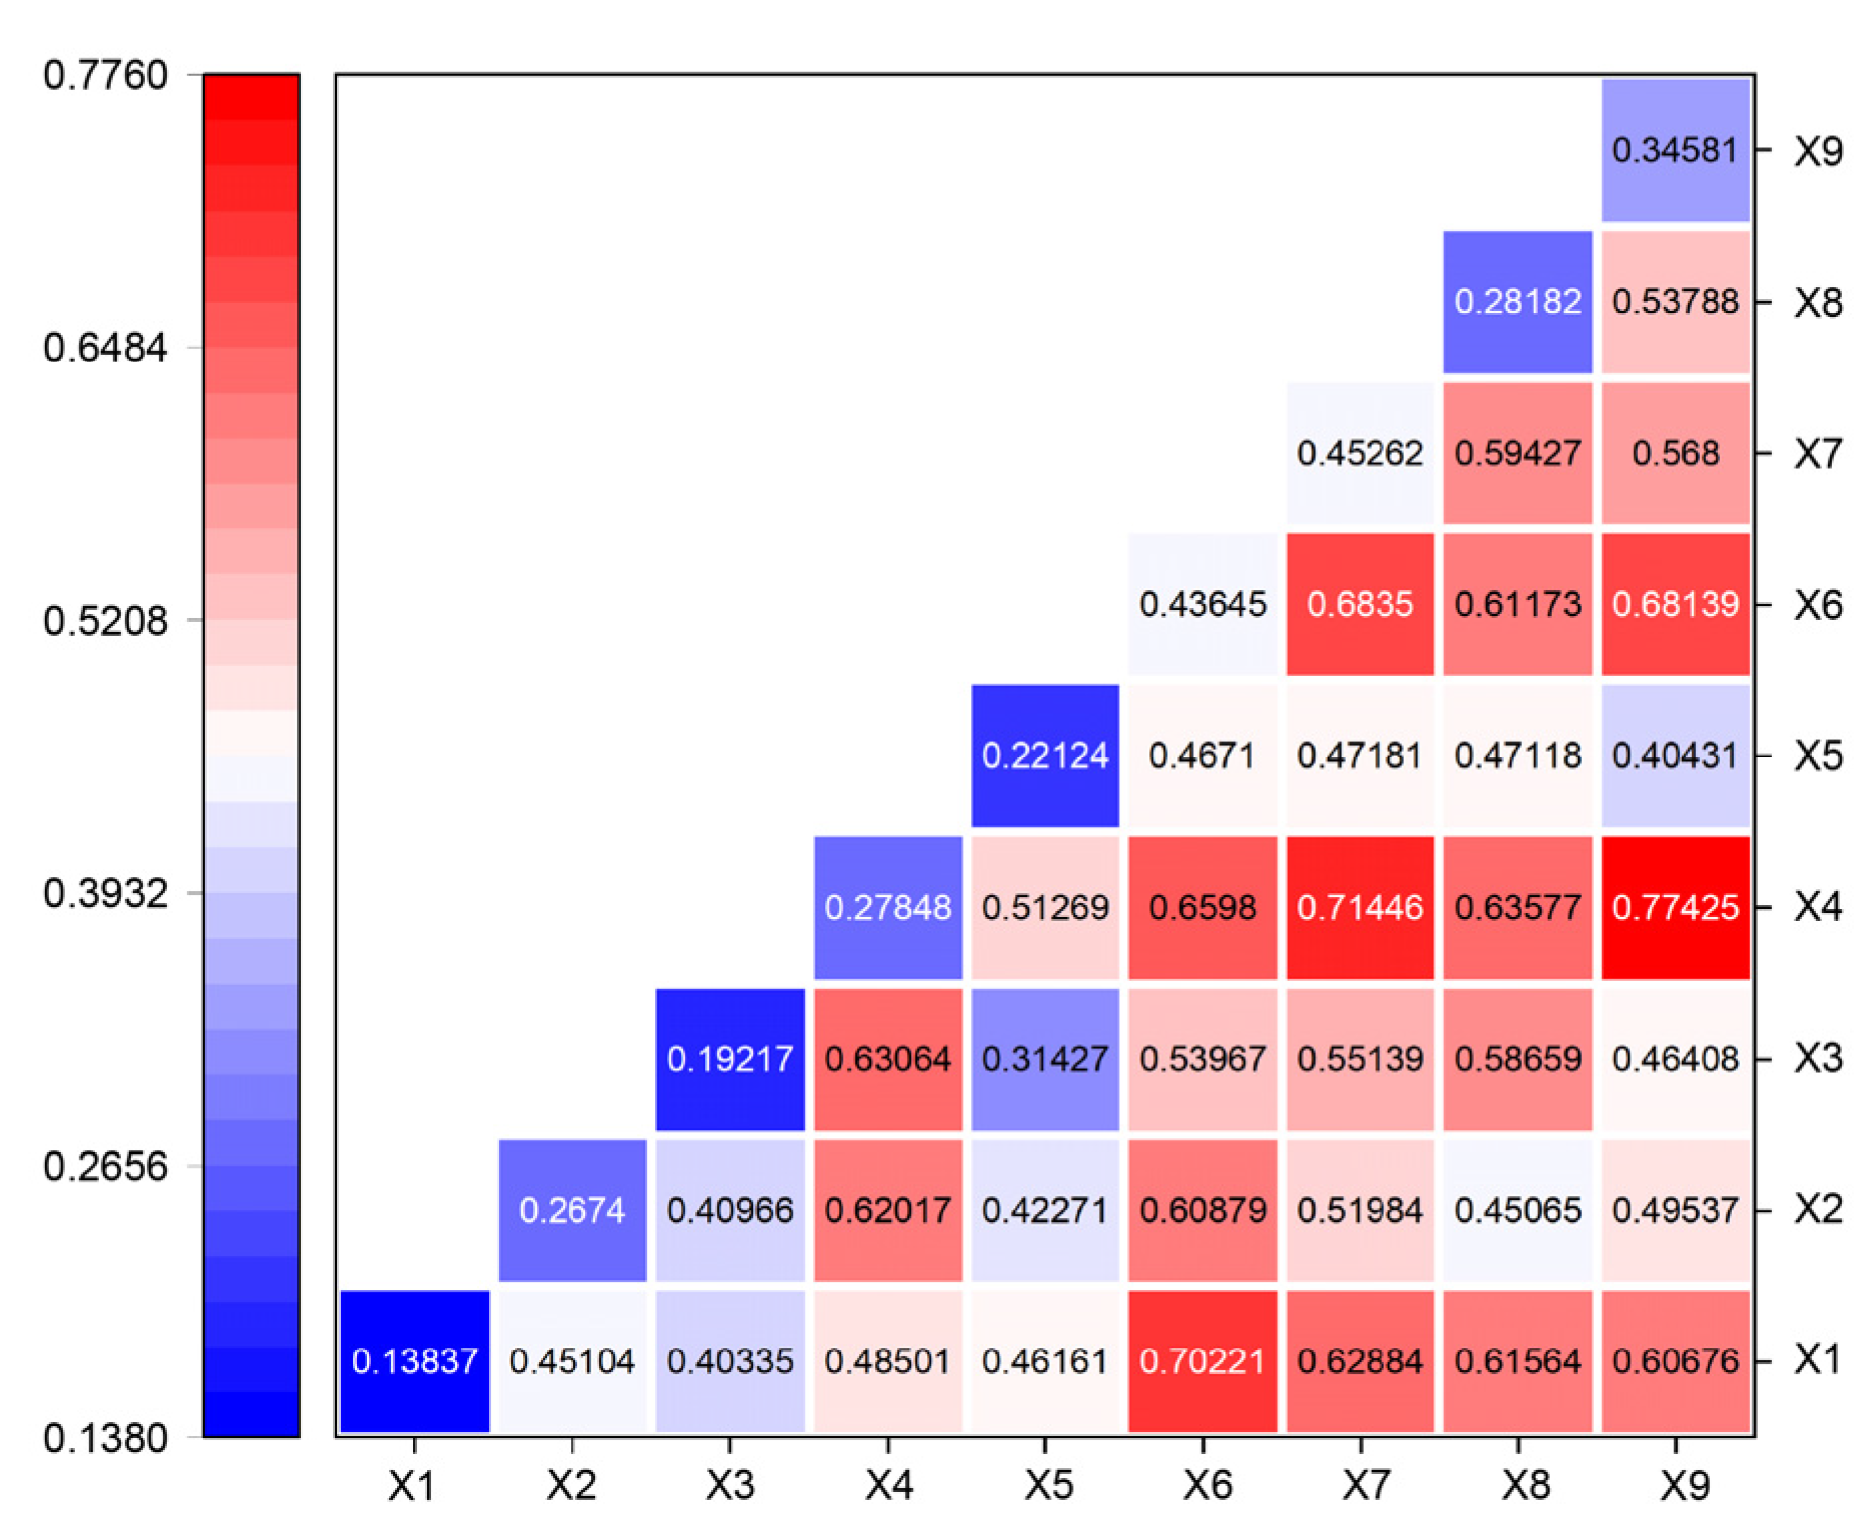
According to the classification criteria for interaction detection types in Table 4, all interacting factor combinations show significantly higher explanatory power for spatial heterogeneity than individual factors, and no factor exhibits a standalone effect. This finding confirms the multidimensional driving characteristics of ICH distribution. As shown in Figure 6, the interaction between tourist numbers and traditional villages is the most pronounced (0.7742) and belongs to the category of interaction enhancement. According to [42], the joint influence of these two factors explains up to 77.42% of the distribution of ICH. The interaction effects of tourist numbers with annual average temperature (0.7144), annual average precipitation (0.6597), and cultural venues (0.6357) were statistically significant. These results demonstrate that tourism development coupled with favorable ecological conditions and well-established cultural infrastructure collectively foster an enabling environment for ICH preservation and transmission.

3.4. The Spatial Mechanism of Influencing Factors for ICH

The Global Spatial Autocorrelation Analysis in ArcGIS was employed to assess the clustering and dispersion characteristics of ICH spatial distribution. The results show a Moran’s I value of 0.19 and a p-value of 0.018, indicating a statistically significant positive spatial autocorrelation (Table 5). This suggests that ICH resources exhibit spatial clustering and are suitable for further analysis using GWR.
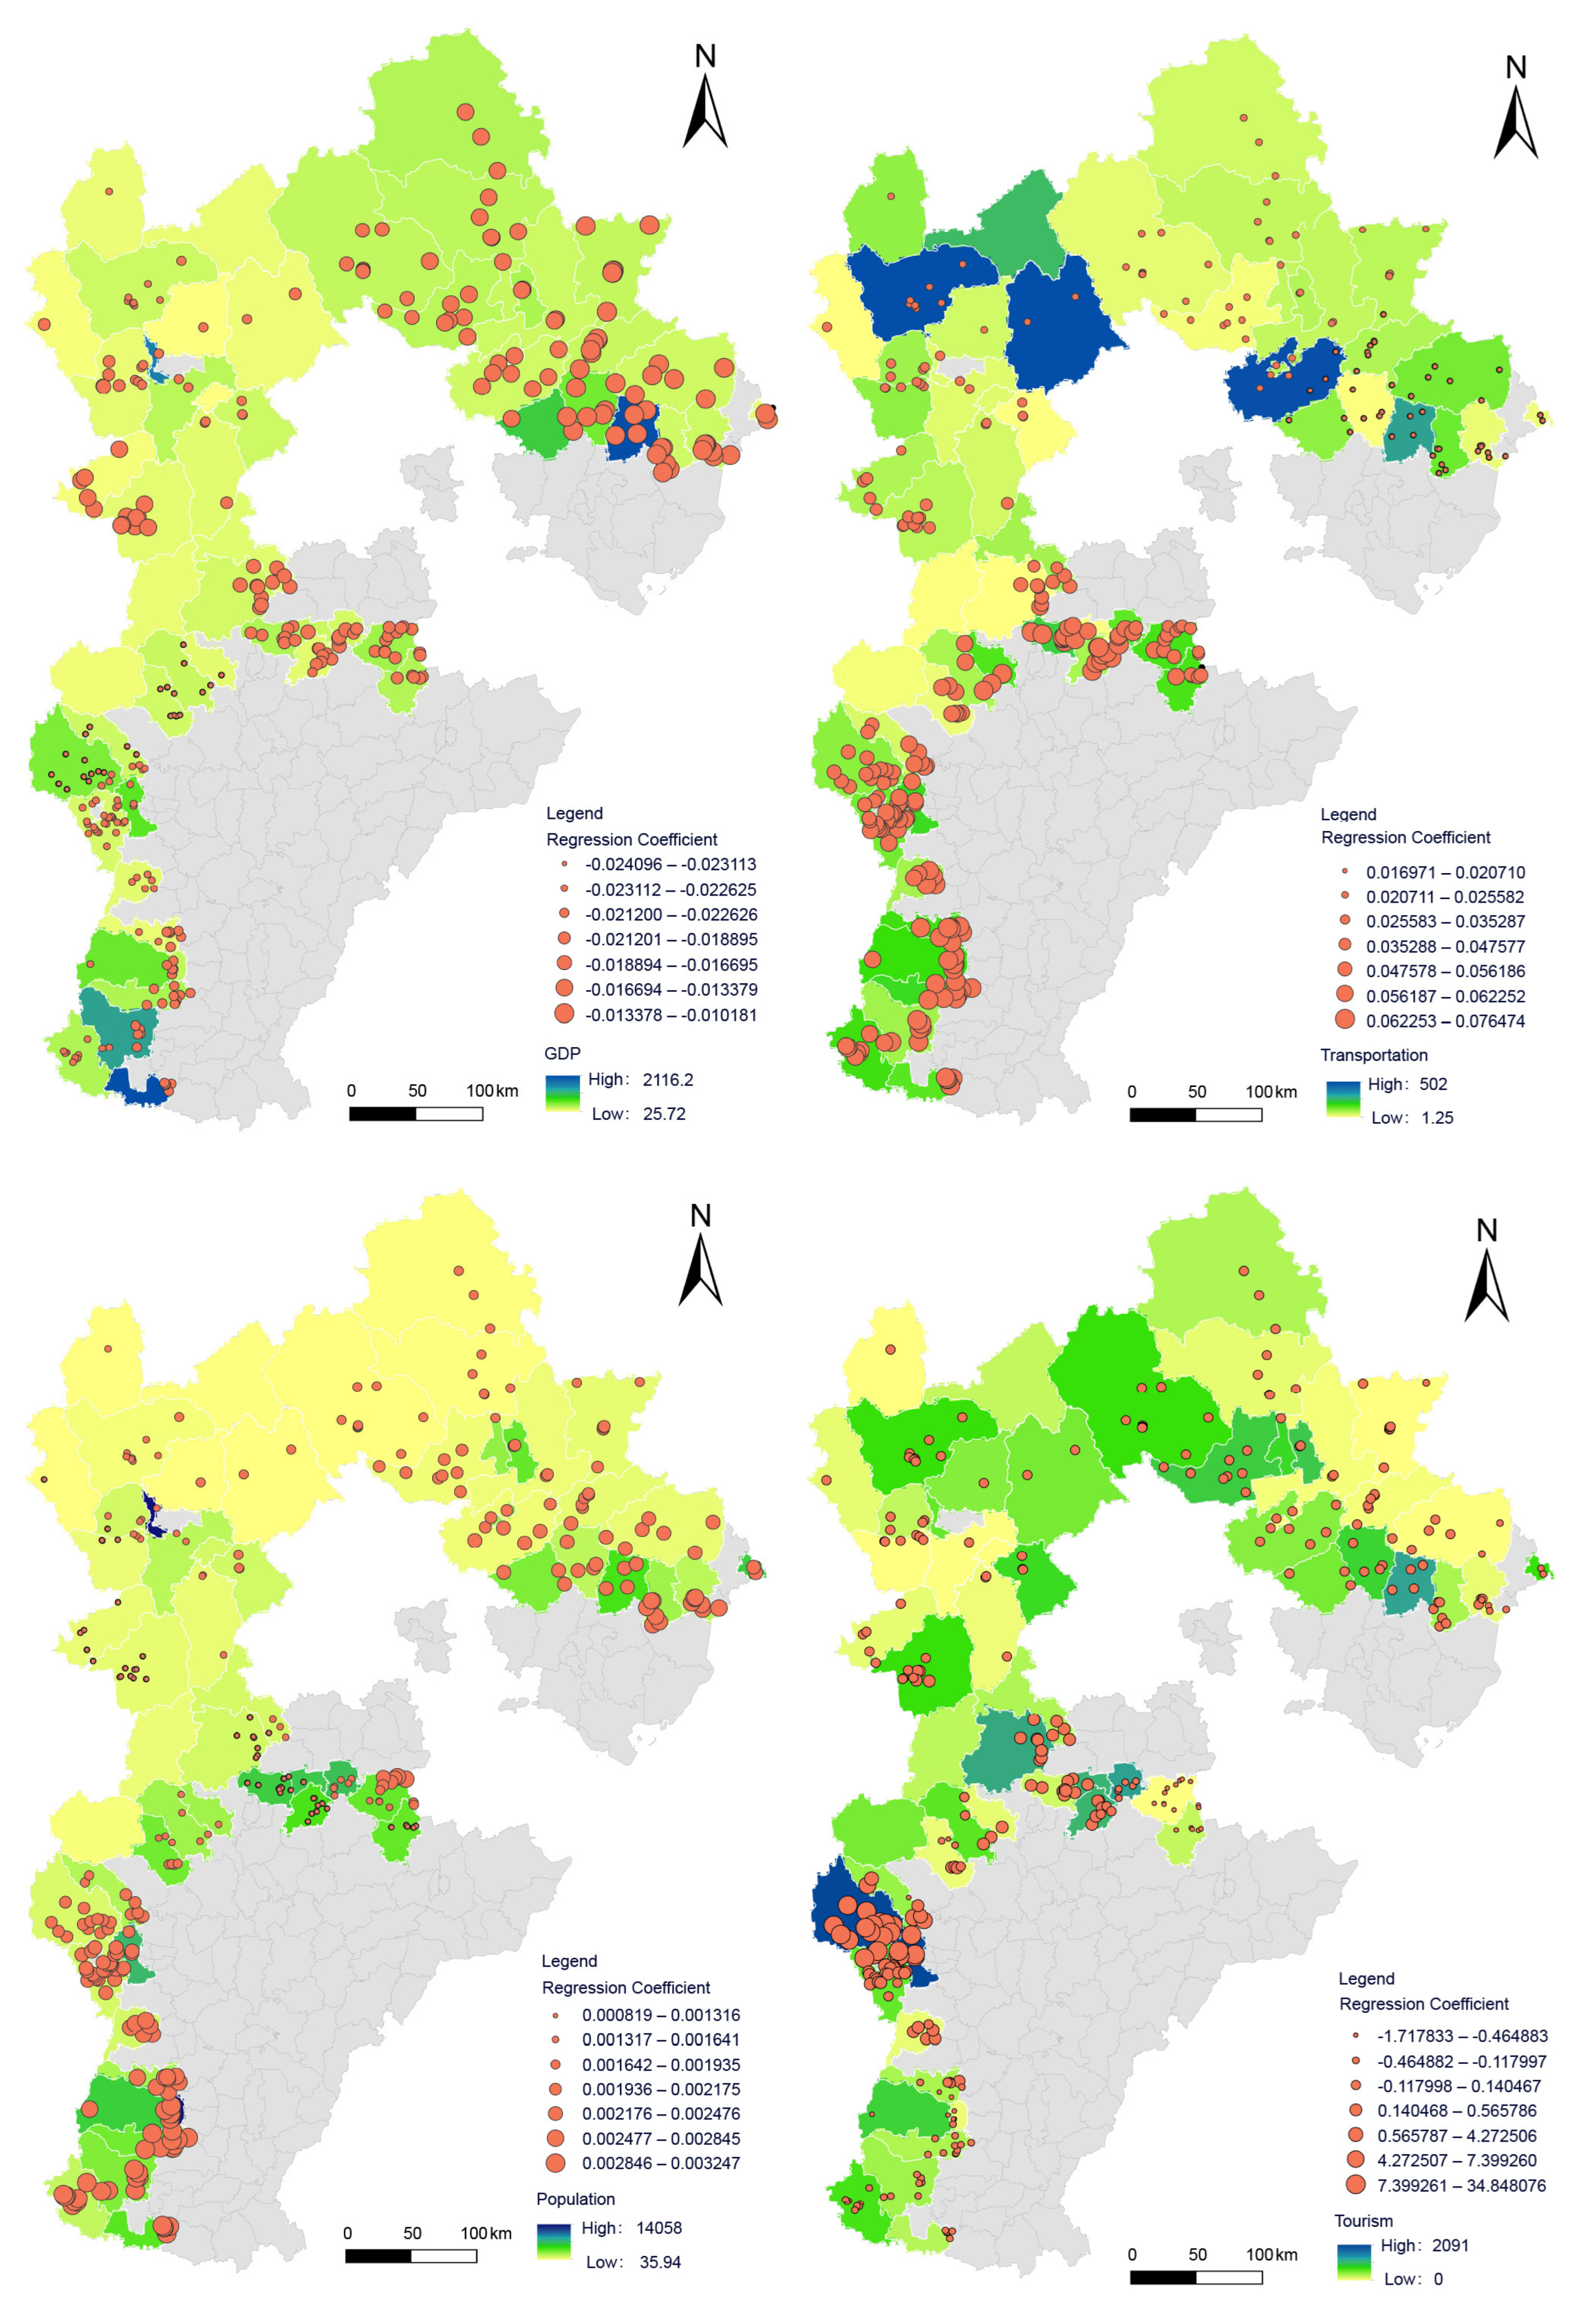
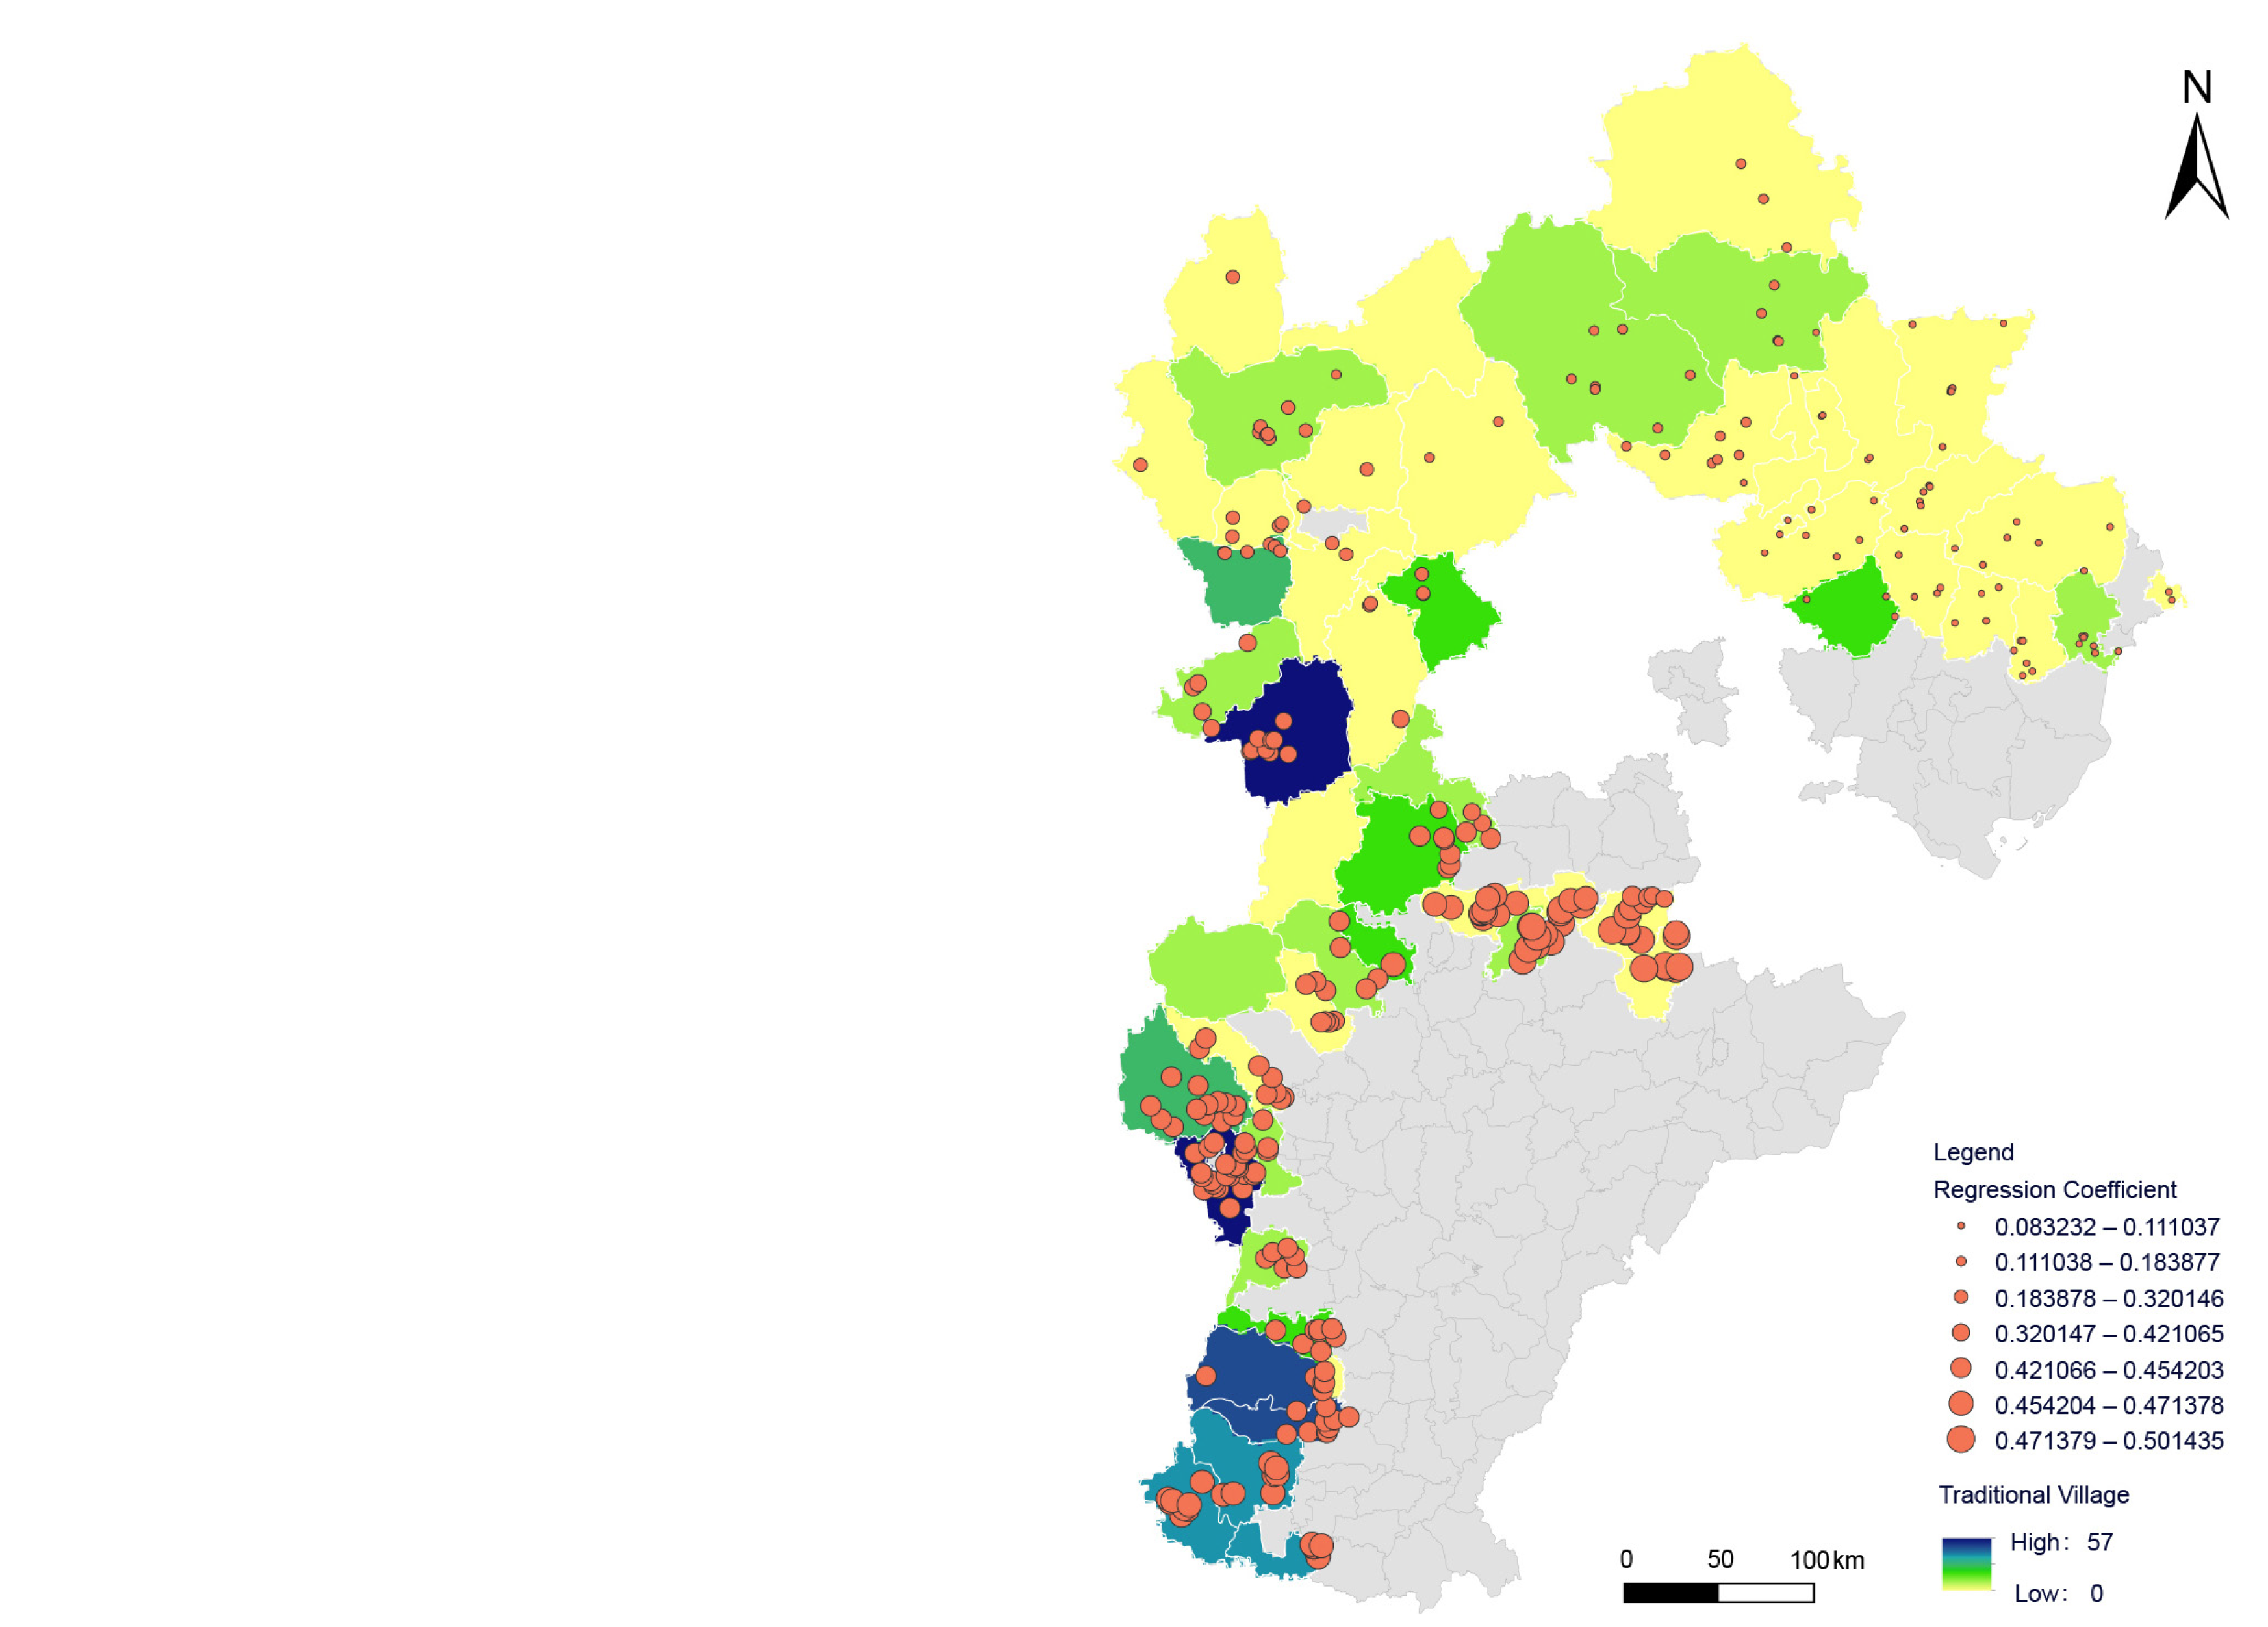
This study employed the GWR method to quantitatively analyze the spatial correlations between various influencing factors and ICH, thereby revealing the spatial heterogeneity of their mechanisms of influence. In GWR4, a Gaussian kernel function model was selected, with the optimal bandwidth determined using the Golden Section Search method. A fixed Gaussian kernel was applied, and geographic variables were tested accordingly. The GWR results indicate that the model has an R2 of 0.768 and an adjusted R2 of 0.754, suggesting that the nine dominant factors can explain approximately 76% of the spatial heterogeneity in traditional villages across the southwestern region. Significant spatial variations were observed in both the strength and direction of the influence exerted by each factor across different areas. Figure 7 visualizes the regression coefficients of the nine variables. A higher regression coefficient indicates a stronger local driving effect of the factor, while a lower coefficient suggests a weaker impact. The sign of the coefficient reflects the direction of influence: a positive value indicates a promoting effect on the spatial distribution of traditional villages, while a negative value suggests an inhibiting effect. Table 6 presents the proportion of positive and negative regression coefficients for the nine factors. Population density, transportation, and average annual temperature are positively correlated with traditional villages across all areas. In contrast, GDP exhibits a uniformly negative relationship. For elevation, 95% of the coefficients are negative while 5% are positive; for annual precipitation, 50% are positive and 50% are negative; for the number of cultural institutions, 52% are positive and 48% are negative. Tourist numbers showed a balanced distribution, with 50% positive and 50% negative values.

4. Discussion

The spatial distribution of ICH along the Great Wall in Hebei Province exhibits significant regional differences. This study innovatively focuses on the county-level scale, examining the structural characteristics, spatial patterns, and formation mechanisms of ICH resources in the counties along the Great Wall. Differences between research findings and hypotheses are discussed in depth, and suggestions are proposed for the protection and development of ICH in the Great Wall region of Hebei.

4.1. Pattern of ICH Distribution

In terms of spatial distribution, the characteristics of ICH along the Great Wall in Hebei Province support Hypothesis 1 (H1), revealing a complex pattern characterized by “overall agglomeration, internal imbalance, north–south differentiation, and typological disparity.” The nearest neighbor index clearly indicates a clustered distribution pattern, while the imbalance index demonstrates a highly uneven distribution of ICH resources at the county level, with a small number of counties accounting for nearly half of all ICH items. Kernel density analysis shows that the southern region has formed a “dual-high and secondary-high” core area, whereas the northern region exhibits a more scattered distribution, highlighting a marked spatial differentiation between the south and the north.
The formation mechanisms underlying this spatial pattern are diverse. From the perspective of natural factors, elevation has a significant inhibiting effect on ICH distribution: heritage items are predominantly concentrated in the southern plains; in the northern mountainous and hilly areas, they are more dispersed. Culturally, the number of traditional villages demonstrates a distinct north–south explanatory power, with the southern region’s abundance of traditional villages providing essential carriers for ICH preservation and transmission. Administratively, smaller county sizes in the south objectively increase ICH distribution density, whereas larger county areas in the north dilute this intensity. These findings are consistent with previous studies [41], which also suggest that mountainous terrain hinders the development of ICH while favorable natural conditions contribute to its growth and dissemination.

4.2. Mechanisms of Influencing Factors

The Geodetector framework results indicate that the spatial distribution of ICH along the Great Wall in Hebei Province is primarily influenced by natural factors, followed by historical and cultural factors, while socioeconomic factors exert the least influence. Among the natural variables, average annual temperature and precipitation are the key determinants of spatial differentiation in ICH. High-density ICH clusters are mainly located in the southern region, where heat and moisture conditions are favorable—particularly around Jingxing County and the sub-high-density core area extending from Neiqiu County to the eastern part of Shahe County. Precipitation and temperature exhibit the strongest explanatory power for ICH distribution. Combined with the negative effect of elevation, the findings suggest that warm, humid climates and flat terrain are more conducive to agricultural production and daily life, which in turn support the emergence and development of ICH along the Great Wall. These conclusions are consistent with prior studies [41], such as Liu’s research on the driving forces behind ICH distribution along linear heritage routes, which also found that climatic factors had strong positive explanatory power while elevation had a suppressive effect [49]. Other studies have noted that the spatial and temporal distribution of the Great Wall is closely related to temperature and precipitation, as the wall structure was historically constructed by agrarian societies as a military defense line against nomadic groups to the north. The Great Wall, as a boundary between agrarian and nomadic civilizations, largely aligns with major geographical demarcations such as the 400 mm precipitation isohyet and the agro-pastoral ecotone [50]. Historical records indicate a strong correlation between the north–south shifts of the wall structure and climatic fluctuations, underscoring how environmental conditions shape patterns of human activity [51]. The favorable climatic conditions in the southern region provided agricultural support for military settlements along the Great Wall [52], and sustained human habitation has nurtured rich ICH resources.
Sociocultural factors also play a crucial role in determining ICH spatial patterns. Traditional villages and cultural institutions are more concentrated in the southern counties and socially and culturally rich counties in the northwest, which exhibit stronger explanatory power for ICH distribution. Traditional villages serve as vital carriers of ICH, preserving living styles, craftsmanship, and folk practices. Examples include Nuanquan Town in Yu County and Laojunshan Town in Huai’an County, where architectural techniques, traditional crafts, and folk customs are well preserved. Cultural institutions, through their integrated functions of “protection–exhibition–research,” enhance the spatial cohesion of ICH and provide professional platforms for its safeguarding [53]. However, in the northeastern region, a significant negative correlation is observed between the number of cultural institutions and ICH distribution, possibly due to the high level of urbanization and a mismatch with traditional cultural resources.
Socioeconomic factors have a relatively minor impact and display marked regional variations: (1) traditional sports, amusement, and acrobatics are distributed across Anxin County, Xiong County, Wen’an County in Baoding, Jingxing County, Pingxiang County, Lingshou County in Shijiazhuang, and Shahe City and Xiangyang District in Xingtai. (2) Improvements in transportation infrastructure show significant positive effects in the southern region. However, in northern areas such as Zhangbei and Chicheng—despite well-developed transportation—ICH development remains weak, indicating that infrastructure must synergize with cultural resources to be effective. (3) Population density shows strong explanatory power in northeastern and southwestern counties with larger populations, supporting the “cultural ecology” theory that population agglomeration is key to cultural sustainability. GDP, by contrast, demonstrates weak explanatory power, and its regression coefficient reveals a generally negative correlation with ICH distribution. Since many sections of the Great Wall in Hebei traverse mountainous areas with low levels of economic development, the distribution of ICH is more dependent on historical and environmental conditions than on economic support, thus limiting GDP’s overall spatial explanatory capacity.
The findings contradict Hypothesis 2 (H2), revealing that socioeconomic factors exert the weakest influence on the spatial distribution of ICH along the Great Wall in Hebei. This contrasts sharply with conclusions drawn from macro-scale studies in regions such as Beijing–Tianjin–Hebei and the Yellow River Basin, where economic development is often identified as the dominant driver of ICH distribution. Although the research scales and subjects differ, studies conducted at the county level along linear heritage corridors have also found that economic variables are less explanatory than natural and historical factors [54]. This discrepancy may stem from scale effects. For instance, Hou constructed cultural ecological influence models for ICH resources at the provincial, municipal, and county levels and found that the explanatory power of socioeconomic factors varied significantly across scales [43]. County-level economies are generally underdeveloped, whereas economic disparities are more pronounced at provincial and national levels, resulting in different explanatory capacities. These findings indicate a clear scale dependency in the driving mechanisms behind ICH distribution.
In two-factor interaction analysis, the interaction between tourist numbers and traditional villages shows the highest explanatory power. Similarly, interactions between tourism and natural factors also demonstrate strong explanatory effects on ICH distribution. In recent years, numerous empirical studies have highlighted tourism’s role in promoting the dissemination of ICH in traditional villages. For example, in a village in southern Italy, local industries were integrated with culinary heritage and oral history to create tourism products that attract visitor participation [55]. In China, the “eco-museum” project in a region of Hainan has developed a distinctive cultural tourism area by integrating Li ethnic minority settlements with ecological and ICH elements [56]. Tourism thus serves as a platform integrating cultural and natural ecology, and the synergy between resource endowments and tourism development significantly enhances the sustainability of ICH protection and development.

4.3. Suggestion

The Great Wall—as a linear cultural landscape—and the role of ICH were constructed through the painstaking efforts of generations of artisans. The Great Wall exemplifies the evolution of ancient Chinese architectural techniques and stands as a profound spiritual symbol of the Chinese nation. With its extensive longitudinal reach, clustered nodes, and integration with surrounding ecological systems, the Great Wall represents a quintessential linear cultural landscape. In response to the growing prominence of the cultural corridor concept, scholars increasingly advocate for protection strategies that simultaneously fulfill the functions of heritage conservation, ecological recreation, and cultural transmission, emphasizing the need for integrated protection of regional cultural landscapes [57]. Scholars recognize that the heritage along the Great Wall encompasses more than the wall itself. It also includes interacting elements such as historical settlements, ecological environments, and traditional culture—forming what has been described as a “cultural symbiotic system.” [27]. As an essential component of the Great Wall culture, ICH should be actively incorporated into the development of the Great Wall cultural heritage corridors, thereby contributing to the construction of a comprehensive protection system. ICH transmission cannot rely solely on static preservation. According to the concept of living heritage [58], ICH must be passed down within its cultural environment. Its core value lies in enabling participatory cultural experiences that facilitate value transmission and enable the reconstruction of traditional cultural spirit in contemporary contexts [59]. This characteristic of living heritage transmission enables ICH to promote the dynamic expression and everyday revitalization of historical traditions within modern society [60].
Integrating the living protection of ICH into the construction of the Great Wall cultural corridor can overcome the current limitations of point-based ICH conservation and facilitate a systematic protection mechanism characterized by “corridor–nodes–cultural fields.” Based on both the theoretical foundation and the spatial distribution patterns of ICH along the Great Wall in Hebei Province, this study proposes the construction of a spatially coupled governance framework: the “Great Wall Cultural Heritage Corridor + ICH System.” This framework aims to promote a shift in the conservation of linear cultural heritage from static display to dynamic transmission. On one hand, the integrative function of the corridor should be fully utilized to link scattered ICH sites into connected cultural chains, forming a tripartite development model of “Cultural heritage–ICH integrated industrial clusters”. For instance, the creation of diversified cultural experience projects—such as ICH items integrated with the Great Wall tourism and educational tours and hands-on intangible heritage workshops at the Great Wall attractions—can not only enrich the cultural content of the Great Wall tourism but also inject vitality into the living transmission of ICH. These efforts are expected to enhance visitor engagement, increase cultural consumption conversion rates, and contribute to the formation of culture-centered industrial clusters [61]. On the other hand, ICH protection should be adapted to local ecological conditions, establishing an integrated development path of “ecology + Great Wall + ICH.” In the grassland and hilly areas of northern Hebei, for example, unique ICH resources such as steppe folk traditions and borderland culture can serve as the foundation for “Grassland Great Wall Cultural Experience” themed routes, creating hybrid tourism scenarios that combine ecological preservation, ethnic culture, and military heritage [62]. In regions like Zhangjiakou, where the average annual temperature is relatively low, ICH projects can be integrated with summer tourism and the ice-and-snow economy, achieving a dual driving force for both heritage transmission and regional economic development. Through spatial integration and industrial coordination, ICH can not only function as an integral part of cultural heritage in the Great Wall corridor but can also, through its living nature, actively enrich and reinforce the expression and dissemination of the Great Wall culture. Ultimately, this will contribute to the construction of an integrated development model featuring a protection–transformation–utilization framework.
The study reveals that the driving mechanisms influencing the distribution of ICH vary significantly across different spatial scales, particularly highlighting the relatively weak support of economic factors at the county level. This underscores the need for future ICH policy frameworks to enhance cross-scalar governance capacity and promote effective coordination and resource allocation within the provincial–municipal–county management system. To address these challenges, it is recommended that a collaborative mechanism for the protection and revitalization of ICH across regions along the Great Wall corridor be established. One potential strategy is the creation of a “Collaborative Center for the Protection of ICH along the Great Wall Cultural Belt” to serve as a central coordination platform. This center would facilitate communication and linkage among various geographic and cultural ecological zones along the Great Wall. In response to the observed spatial imbalance in ICH distribution, counties with abundant ICH resources could be encouraged to form “ICH Cooperation Zones” with resource-scarce counties. These zones could implement cooperative mechanisms such as reciprocal visits for craft exchange, joint celebration of traditional festivals, and rotating performances. To promote infrastructure and resource synergy, it is also proposed that shared platforms, including regional ICH performance centers, digital museums, and mobile educational camps along the Great Wall axis, be developed. These platforms would support shared use of exhibition facilities, expert teams, and educational resources, thereby enhancing the dynamic preservation and sustainable development of ICH throughout the region.

5. Conclusions

(1)
The distribution of ICH across the 58 counties along the Great Wall in Hebei Province is relatively balanced between the north and south, with a slight predominance in the south. However, there are significant differences in the structure and quantity of ICH types across counties. Among the ten types, traditional crafts have the highest representation, while traditional medicine has the least. Traditional drama, traditional music, and traditional dance fall within the average range. Among the 58 counties, Jingxing County has the highest number of ICH items, with 29, whereas three counties have not yet been included in the provincial-level ICH list, reflecting significant regional disparities in ICH resource reserves.
(2)
The distribution characteristics align with Hypothesis 1. ICH resources exhibit a spatial clustering pattern, with an uneven yet somewhat aggregated distribution across counties. There is a significant density difference between the northern and southern regions, with two high-density core areas and one sub-high-density core area, all located in the south, while the north displays scattered point-like dense distributions. The dispersal patterns of different ICH types vary considerably: traditional crafts are concentrated; dramatic balladry is evenly distributed; and the other eight categories exhibit random distribution.
(3)
In terms of spatial trends, contrary to the ranking of influencing factors proposed in Hypothesis 2, the distribution of ICH resources along the Great Wall in Hebei Province shows a strong correlation with the natural environment and historical–cultural resources. Among these, annual average temperature and precipitation exert the greatest influence on ICH distribution, consistent with the climatic and environmental characteristics reflected in the spatiotemporal distribution of the Great Wall. This suggests that favorable natural conditions and rich historical and cultural heritage are essential foundations for ICH transmission. In contrast, socioeconomic factors have relatively weak explanatory power. This finding significantly differs from those of macro-scale studies and may be attributed to differences in spatial scale. The spatial distribution of ICH resources is influenced by the synergy of multiple factors. Interaction detection results indicate that multi-factor coupling has a stronger explanatory power for ICH distribution patterns. The most significant interactions include the synergy between the number of tourists and traditional village numbers, as well as average annual temperature.
(4)
The distribution of ICH along the Great Wall in Hebei Province exhibits significant spatial heterogeneity, with various influencing factors demonstrating distinct mechanisms. Population, transportation, temperature, and traditional villages all exert consistently positive effects on ICH distribution. In contrast, precipitation, tourist numbers, and cultural venues show nearly balanced positive and negative effects—generally positive in the southwest and negative in the northeast. GDP shows a consistently negative association.
These research findings contribute to a deeper theoretical understanding of how ecological and geographical factors shape the spatial continuity of ICH, particularly within linear heritage corridors such as the Great Wall. The results demonstrate that ICH spatial patterns vary significantly across regions due to the intertwined influences of natural conditions and social systems, reinforcing the integrated conservation perspective that links ICH with the natural environment, tangible heritage, and socioeconomic context. Moreover, the proposed three-tier analytical framework—comprising cluster identification, mechanism detection, and spatial heterogeneity modeling—offers a replicable paradigm for examining the relationship between ICH and regional environments and provides theoretical and methodological guidance for ICH conservation strategies in other types of linear cultural heritage.
This study investigates the overall influencing factors of ICH distribution along the Great Wall in Hebei Province, but it does not explore whether different types of ICH items are influenced by different factors. Additionally, although the selected influencing factors include socioeconomic, natural, and historical–cultural variables, other relevant factors such as preservation policies, ethnicity, hydrological networks have not been included. The data on influencing factors primarily rely on publicly available sources and online platforms, which may involve certain time lags. As this study represents an interim research stage, and given the current limitations in data, more advanced statistical modeling approaches—such as spatial regression and hierarchical modeling—have not yet been applied. Future research will incorporate these methods to enhance analytical precision and explanatory power as data availability improves. Furthermore, while the discussion section notes an apparent overlap between the influencing factors of ICH and the Great Wall’s distribution of ICH items, this has not been rigorously quantified. Although a variety of methods were applied, further research could consider incorporating additional approaches to enhance the depth and robustness of factor detection and validation. Future research will explore the differences in the influencing factors across various types of ICH items and will examine the specific relationships between ICH items and their spatial distribution along the Great Wall area, providing more detailed and targeted recommendations for the integrated development of the Great Wall and its associated ICH.

Author Contributions

Conceptualization, Y.C. and J.Z.; methodology, Y.C. and J.Z.; software, J.Z.; validation, Z.W.; formal analysis, J.Z. and Z.W.; resources, S.L.; data curation, J.Z. and X.Z.; writing—original draft preparation, Y.C., J.Z. and X.Z.; writing—review and editing, W.L.; visualization, S.L. and Z.X.; supervision, Y.C.; project administration, W.L. All authors have read and agreed to the published version of the manuscript.

Funding

This research was funded by the Chinese Folk Literature and Art Association Intangible Cultural Heritage Research Institute, grant number FYY20242D01, and the Science Research Project of Hebei Education, grant number BJS2024013.

Institutional Review Board Statement

Not applicable.

Informed Consent Statement

Not applicable.

Data Availability Statement

The datasets used and analyzed during the current study are available from the corresponding author upon reasonable request.

Conflicts of Interest

The authors declare no conflicts of interest.

Abbreviations

The following abbreviations are used in this manuscript:
ICHintangible cultural heritage

References

  1. Kurin, R. Safeguarding Intangible Cultural Heritage in the 2003 UNESCO Convention: A critical appraisal. Mus. Int. 2004, 56, 66–77. [Google Scholar] [CrossRef]
  2. Dong, Y.H. Study on the Construction of the Great Wall Cultural and Economic Belt; Chen, Y., Ed.; Yanshan University Press: Qingdao, China, 2021; pp. 5–6. [Google Scholar]
  3. Huang, Y.L. Establishing and improving coordination mechanisms and regulatory systems for intangible cultural heritage protection. People’s Trib. 2024, 22, 99–102. [Google Scholar]
  4. Huang, Y.L.; Li, Y.Y. The development logic and future orientation of China’s intangible cultural heritage protection policies since the new century. Folk. Stud. 2023, 1, 5. [Google Scholar]
  5. Kong, Q.F.; Jin, Y. The theoretical narrative of improving the representative inheritor system of intangible cultural heritage—Observations based on individuals, groups, and communities. Folk. Stud. 2025, 1, 15. [Google Scholar]
  6. Tan, M. Interaction and sharing: The practical direction of “Intangible Cultural Heritage in Communities". J. Hubei Minzu Univ. (Philos. Soc. Sci. Ed.) 2024, 42, 147–157. [Google Scholar]
  7. Luo, Y.Y.; Liu, W.N. The construction of local knowledge in Shanghai’s intangible cultural heritage documentaries. China Telev. 2023, 8, 53–59. [Google Scholar]
  8. Sun, L.; Li, J.; Wang, Z.; Liu, W.; Zhang, S.; Wu, J. Research on the Redesign of China’s Intangible Cultural Heritage Based on Sustainable Livelihood—The Case of Luanzhou Shadow Play Empowering Its Rural Development. Sustainability 2024, 16, 4555. [Google Scholar] [CrossRef]
  9. Li, M.; Xu, S.; Tang, J.; Chen, W. Design and research of digital twin platform for handicraft intangible cultural heritage—Yangxin Cloth Paste. Herit. Sci 2024, 12, 43. [Google Scholar] [CrossRef]
  10. Wang, Y.; Zhou, Y. Artificial Intelligence-Driven Interactive Experience for Intangible Cultural Heritage: Sustainable Innovation of Blue Clamp-Resist Dyeing. Sustainability 2025, 17, 898. [Google Scholar] [CrossRef]
  11. Zhang, P.F.; Tu, M.Q. The obscuring of specificity in the systematic protection of intangible cultural heritage—A case study on the bottlenecks of Fuzhou bodiless lacquerware decoration techniques. Art. Des. 2024, 12, 44–49. [Google Scholar]
  12. Cai, Z.; Cai, K.; Huang, T.; Zhang, G.; Chen, R. Spatial Distribution Characteristics and Sustainable Inheritance Strategies of National Traditional Fine Arts Intangible Cultural Heritage in China. Sustainability 2024, 16, 4488. [Google Scholar] [CrossRef]
  13. Wu, L.; Yang, G.; Chen, X.; Yang, G.; Chen, X. Spatial Distribution Characteristics and Influencing Factors of Intangible Cultural Heritage in the Yunnan, Guangxi, and Guizhou Rocky Desertification Area. Sustainability 2024, 16, 4722. [Google Scholar] [CrossRef]
  14. Liu, H.; Zhou, Y.L. Participatory co-construction: Digital memory construction models and implementation strategies for ethnic minorities. Arch. Stud. Res. 2022, 3, 60–67. [Google Scholar]
  15. Wang, X.Y.; Yao, Y.; Luo, L. A preliminary spatial archaeological study on the early Yumen Pass city of the Han Great Wall at Huanghuaying—With a discussion on Stein’s speculation regarding T.XLII.d beacon tower as a pass location. J. Northwest Univ. (Philos. Soc. Sci. Ed.) 2021, 51, 16–26. [Google Scholar]
  16. Deng, T. Examining the “five outstanding characteristics” of Chinese civilization through historical changes in the Great Wall region during the early Qing dynasty. Ningxia Soc. Sci. 2024, 3, 183–192. [Google Scholar]
  17. Li, Z.; Chen, Z.X.; Tuo, X.L.; Zhang, Y.K.; Li, Y. A study on the beacon signaling system of hollow enemy towers along the Great Wall under Qi Jiguang’s administration. Archit. J. 2023, S1, 68–73. [Google Scholar]
  18. Patalano, R.; Hu, J.; Leng, Q.; Liu, W.; Wang, H.; Roberts, P.; Storozum, M.; Yang, L.; Yang, H. Ancient Great Wall building materials reveal environmental changes associated with oases in northwestern China. Sci. Rep. 2022, 12, 22517. [Google Scholar] [CrossRef]
  19. Xu, L.Y.; Li, Y.; Yang, H. Discussion on protection and restoration methods of Ming Great Wall fortifications—A case study of the Xuliukou Great Wall in Hebei. Archit. J. 2019, S1, 188–193. [Google Scholar]
  20. Zhang, Z.; Dang, A.R.; Chen, Y.; Li, X.Y.; Yu, J.G. Research on the protection and inheritance of Great Wall cultural heritage based on digital twins. Chin. Landsc. Archit. 2024, 40, 35–41. [Google Scholar]
  21. Sun, Z.; Liu, Y.J.; Zhang, J.; Wang, S.S.; He, D. Landscape protection and utilization planning of cultural heritage sites based on LCA—A case study of Gubeikou Town in the Beijing Great Wall Cultural Belt. Urban. Dev. Res. 2022, 29, 107–115+2+41. [Google Scholar]
  22. Zhao, X.H. The historical role of the Great Wall in ancient China. J. Historiogr. 2021, 1, 92–101. [Google Scholar]
  23. Cheng, R.F.; Xu, C.C. Structural characteristics of Great Wall cultural and tourism resources and strategies for enhancing tourism utilization—A case study of the Hebei section of the Great Wall. Hebei Acad. J. 2023, 43, 212–217. [Google Scholar]
  24. Yuan, X.B. Research on the inheritance, protection, and development of intangible cultural heritage in the construction of the Great Wall National Cultural Park (Hebei section). Tour. Overv. 2021, 2, 134–136. [Google Scholar]
  25. Wang, Y.; Cui, L. Research on the integration and development of intangible cultural heritage and tourism in the Jidong Great Wall cultural belt. West. Tour. 2023, 9, 6–8. [Google Scholar]
  26. Wang, Y.K.; Xi, Y.P.; Liu, B.H. The inheritance dilemmas and mitigation pathways of the traditional Great Wall craft “Dashuhua” along the Great Wall. Front. Econ. Cult. 2024, 2, 76–79. [Google Scholar]
  27. Lin, F.; Zhang, X.; Ma, Z.; Zhang, Y. Spatial Structure and Corridor Construction of Intangible Cultural Heritage: A Case Study of the Ming Great Wall. Land 2022, 11, 1478. [Google Scholar] [CrossRef]
  28. Rodzi, N.I.M.; Zaki, S.A.; Subli, S.M.H.S. Between Tourism and Intangible Cultural Heritage. Procedia Soc. Behav. Sci. 2013, 85, 411–420. [Google Scholar] [CrossRef]
  29. Liu, S.J.; Wu, B.H. Genetic differences of intangible cultural heritage and its tourism development transformation. Areal Res. Dev. 2015, 34, 76–80. [Google Scholar]
  30. Xiao, H. Geographical indication protection model of intangible cultural heritage. Seeker 2008, 2, 53–55. [Google Scholar]
  31. Yang, Y. Research on geographical indication protection of intangible cultural heritage. Cult. Herit. 2020, 5, 24–34. [Google Scholar]
  32. Falcade, I. The geography of vine and wine industry in Brazil: Territory, culture and heritage. BIO Web Conf. 2016, 7, 03028. [Google Scholar] [CrossRef]
  33. Zhang, Z.; Cui, Z.; Fan, T.; Ruan, S.; Wu, J. Spatial distribution of intangible cultural heritage resources in China and its influencing factors. Sci. Rep. 2024, 14, 4960. [Google Scholar] [CrossRef] [PubMed]
  34. Shen, W.; Chen, Y.; Cao, W.; Yu, R.; Rong, P.; Cheng, J. Spatial pattern and its influencing factors of national-level cultural heritage in China. Herit. Sci. 2024, 12, 384. [Google Scholar] [CrossRef]
  35. Han, Q.; Tao, F.; Hong, Z.; Qin, G.; Wei, Y.; Chen, Y.; Zhou, T. Research on the spatiotemporal distribution and factors influencing intangible cultural heritage in Fujian Province from a multiscale perspective. Herit. Sci. 2024, 12, 239. [Google Scholar] [CrossRef]
  36. Li, C.; Qian, Y.; Li, Z.; Tong, T. Identifying factors influencing the spatial distribution of minority cultural heritage in Southwest China. Herit. Sci. 2024, 12, 117. [Google Scholar] [CrossRef]
  37. Pang, L.; Wu, L. Distribution characteristics and influencing factors of Intangible Cultural Heritage in Beijing-Tianjin-Hebei. Herit. Sci. 2023, 11, 19. [Google Scholar] [CrossRef]
  38. Cheng, Q.; Ling, S.P. Spatial distribution characteristics and influencing factors of intangible cultural heritage in China. Sci. Geogr. Sin. 2013, 33, 1166–1172. [Google Scholar]
  39. Zhang, Z.; Li, Q.; Hu, S. Intangible Cultural Heritage in the Yellow River Basin: Its Spatial–Temporal Distribution Characteristics and Differentiation Causes. Sustainability 2022, 14, 11073. [Google Scholar] [CrossRef]
  40. Zhang, Z.; Wang, Z.Z.; Lin, B.Q. Spatial distribution characteristics and influencing factors of national-level intangible cultural heritage in China. Resour. Dev. Mark. 2023, 39, 949–956. [Google Scholar]
  41. Liu, Y.; Chen, M.; Tian, Y. Temporal and spatial patterns and influencing factors of intangible cultural heritage: Ancient Qin-Shu roads, Western China. Herit. Sci. 2022, 10, 201. [Google Scholar] [CrossRef]
  42. Wang, J.F.; Xu, C.D. Geodetector: Principles and prospects. Acta Geogr. Sin. 2017, 72, 116–134. [Google Scholar]
  43. Hou, T.; Wang, Y.H. Cultural ecological factors influencing county-level intangible cultural heritage spatial distribution: Based on social-ecological systems (SES) framework. J. Cent. China Norm. Univ. (Humanit. Soc. Sci.) 2022, 61, 75–85. [Google Scholar]
  44. Dong, Y.H. Research on the Construction of the Great Wall National Cultural Park; Fan, C., Ed.; Yanshan University Press: Qingdao, China, 2022; pp. 75–77. [Google Scholar]
  45. Reply to the Approval of the State Administration of Cultural Heritage on the Recognition of the Great Wall of Hebei Province. In The Dictionary of Policy; People’s Government of the People’s Republic of China: Beijing, China, 2012. Available online: http://www.ncha.gov.cn/art/2012/6/18/art_2237_23500.html (accessed on 8 October 2024).
  46. Li, X.C. Atlas of the Great Wall of China; Chen, J., Ed.; Jiangsu Phoenix Science and Technology Press: Nanjing, China, 2016; pp. 448–449. [Google Scholar]
  47. Lee, S.; Aigbekaen, I.; Huang, J. Geographic maldistribution of pediatric dermatologists in relation to pediatric and family medicine residency programs. Acad. Pediatr. 2025, 25, 102835. [Google Scholar] [CrossRef]
  48. He, Y.C.; Shi, X.L.; Zeng, B.D. Spatial distribution characteristics and influencing factors of intangible cultural heritage in Southwest China. J. Zhejiang Univ. (Sci. Ed.) 2023, 50, 628–650. [Google Scholar]
  49. Liu, W.Y. Challenges and responses—The protection of the Great Wall under the impact of climate change. J. Nat. Cult. Herit. 2022, 7, 24–34. [Google Scholar]
  50. Tong, Y.Y. The Great Wall and grassland threats—The relationship between Ming Dynasty agro-pastoral wars, Great Wall construction, and climate fluctuations. Qinghai J. Ethnol. Stud. 2019, 30, 141–148. [Google Scholar]
  51. Guo, D.Z.; Yang, S.Y. Ecological investigation of the Great Wall in northern China. Environ. Prot. 2005, 1, 46–48+53. [Google Scholar]
  52. Sun, R.Q.; Luo, L.; Wang, X.Y. Geographical factors in the site selection of Han Dynasty beacon towers: A case study of Yumen City. J. Univ. Chin. Acad. Sci. 2023, 40, 50–58. [Google Scholar]
  53. Liu, Y.Q.; Xu, H. Authenticity protection of intangible cultural heritage and tourism development as drivers of rural cultural revitalization. Soc. Sci. 2022, 10, 69–75. [Google Scholar]
  54. Liang, Z.R.; Ren, S.; Liu, Y.M. Spatial structure and protection-development strategies of intangible cultural heritage in the Nanling Corridor. Ethn. Forum 2023, 2, 93–103. [Google Scholar]
  55. Cerquetti, M.; Ferrara, C.; Romagnoli, A.; Vagnarelli, G. Enhancing Intangible Cultural Heritage for Sustainable Tourism Development in Rural Areas: The Case of the “Marche Food and Wine Memories” Project (Italy). Sustainability 2022, 14, 16893. [Google Scholar] [CrossRef]
  56. Zhang, Y.; He, L. From “traditional settlements” to “eco-museums”: A case study of regenerative design in Hainan Baoting Betelnut Valley Li-Miao cultural tourism area. Art. Des. 2024, 7, 97–102. [Google Scholar]
  57. Chen, Y.; Dang, A.; Peng, X. Building a Cultural Heritage Corridor Based on Geodesign Theory and Methodology. J. Urban. Manag. 2014, 3, 97–112. [Google Scholar] [CrossRef]
  58. Lenzerini, F. Intangible cultural heritage: The living culture of peoples. Eur. J. Int. Law 2011, 22, 101–120. [Google Scholar] [CrossRef]
  59. Cai, F.M. Cultural characteristics and contemporary value of China’s intangible cultural heritage. J. Shanghai Jiaotong Univ. (Philos. Soc. Sci.) 2006, 4, 64–80. [Google Scholar]
  60. Nettlefoed, R. Migration, Transmission and Maintenance of the Intangible Heritage; Museum International: Paris, France, 2004; Volume 56, pp. 78–83. [Google Scholar]
  61. Tian, L.; Zhang, Z.B.; Sun, F.Z. Research on the integration of rural intangible cultural heritage and tourism industry. Shandong Soc. Sci. 2021, 5, 123–128. [Google Scholar]
  62. Gui, S.; Sun, Z.Y.; Li, X.Z. Cultural space reconstruction and pathways of minority “ICH poverty alleviation”—Based on field research in Enshi City, Western Hubei. J. Southwest Minzu Univ. (Humanit. Soc. Sci. Ed.) 2019, 40, 29–35. [Google Scholar]
Figure 1. Counties along the Great Wall.
Sustainability 17 06962 g001
Figure 2. Research framework diagram.
Sustainability 17 06962 g002
Figure 3. ICH density distribution along the Great Wall in Hebei Province counties.
Sustainability 17 06962 g003
Figure 4. Various types of ICH density distribution along the Great Wall in Hebei Province counties.
Sustainability 17 06962 g004
Figure 5. Lorenz curve of ICH distribution along the Great Wall in Hebei Province.
Sustainability 17 06962 g005
Figure 6. Interaction detection results of influencing factors on ICH resources along the Great Wall in Hebei Province.
Sustainability 17 06962 g006
Figure 7. Spatial distribution of GWR regression coefficients for explanatory variables.
Sustainability 17 06962 g007aSustainability 17 06962 g007bSustainability 17 06962 g007c
Table 1. Ten types of ICH along the Great Wall in Hebei Province.
TypologyQuantityPercent
Techniques7120.46%
Folkways5716.44%
Drama4111.82%
Music4111.82%
Dance3510.08%
Sports, Amusement, and Acrobatics318.94%
Art288.08%
Folk Literature216.06%
Dramatic Balladry174.90%
Medicine51.44%
Total347100%
Table 2. Summary of average nearest neighbor values for ICH along the Great Wall in Hebei Province.
Typologyp-ValueZ ValueANN
Techniques0−6.1510.61
Folkways0.178−1.3430.90
Drama0.598−0.5260.95
Music0.4600.7371.06
Dance0.514−0.6510.94
Sports, Amusement, and Acrobatics0.3970.8451.07
Art0.230−1.2000.88
Folk Literature0.334−0.9650.88
Dramatic Balladry0.0601.8801.23
Medicine0.0900.1131.02
Total012.960.63
Table 3. Explanation of the influencing factors of ICH along the Great Wall in Hebei Province.
DimensionIndicator FactorsqpIndicator Explanation
SocioeconomicGDP (X1)0.000.1383Total GDP of Counties (2023 County-Level National Economic Bulletins)
Transportation (X2)0.000.2673Railway and Highway Density
Population (X3)0.000.1921Population Density (The Seventh National Population Census)
Tourism (X4)0.000.2784Tourist Numbers (2023 County-Level National Economic Bulletins)
Physical GeographyTopography (X5)0.000.2212DEM Elevation Data
Rainfall (X6)0.000.4364Annual Average Precipitation
Temperature (X7)0.000.4526Annual Average Temperature
SocioculturalCultural Institutions (X8)0.000.2818Number of Cultural Venues, Including Museums, Cultural Centers, and Memorial Halls
Traditional Villages (X9)0.000.3458Tourist Numbers
Table 4. The Classification Criteria for Interaction Detection Types.
Interactive Relationship Criteria for Determination
Nonlinear Enhancement q(X1∩X2) > q(X1) + q(X2)
Bivariate Enhancement q(X1∩X2) > max(q(X1), q(X2))
One-Factor Nonlinear Attenuation q(X1∩X2) < q(X1) + q(X2)
Factor Independence q(X1∩X2) = q(X1) + q(X2)
Table 5. Spatial autocorrelation data table of ICH resources along the Great Wall in Hebei Province.
Moran’sZ Valuep-ValueGlobal Distribution
0.192.350.018Clustering trends
Table 6. GWR coefficients.
FactorGWR BandwidthGWR Analysis Parameters and Results
PositiveNegative
GDP (X1)620%100%
Transportation (X2)100%0%
Population (X3)100%0%
Tourism (X4)50%50%
Topography (X5)5%95%
Rainfall (X6)50%50%
Temperature (X7)100%0%
Cultural Institutions (X8)52%48%
Traditional Villages (X9)100%0%
Disclaimer/Publisher’s Note: The statements, opinions and data contained in all publications are solely those of the individual author(s) and contributor(s) and not of MDPI and/or the editor(s). MDPI and/or the editor(s) disclaim responsibility for any injury to people or property resulting from any ideas, methods, instructions or products referred to in the content.