Abstract
In the context of growing global climate change awareness and intensifying environmental degradation, technological innovation in renewable energy has become a key realization method for sustainable development. This paper uses data samples from 30 provinces, municipalities, and autonomous regions in China (excluding Tibet, Hong Kong, Macao, and Taiwan due to data availability) from 2007–2022, constructs an SFA model to measure carbon emission efficiency, and innovatively investigates the U-shaped impact of technological innovation in renewable energy on carbon emission efficiency along with the moderating effects of informatization level and fiscal decentralization. The empirical findings reveal the following: (1) Technological innovation in renewable energy demonstrates a U-shaped impact on carbon emission efficiency, with a negative impact before inflection point 2.596605 and a positive impact after the inflection point. (2) The informatization level plays a positive regulating role in the impact of technological innovation in renewable energy toward carbon emission efficiency, while fiscal decentralization exerts a negative regulating effect. (3) The impact of technological innovation in renewable energy concerning carbon emission efficiency varies depending on regional differences, industrial structure levels, and technological innovation levels in renewable energy. The conclusions of this paper are helpful for promoting the development of technological innovation in renewable energy, improving carbon emission efficiency, and advancing sustainable socio-economic development.
1. Introduction
With the rapid economic and social development of recent years, global climate change has become increasingly severe, evolving into a major challenge for the international community and diverse organizations that gradually threatens human survival and sustainable development [1]. According to the International Panel on Climate Change (IPCC) report, global greenhouse gas (GHG) emissions have continued to increase over recent decades. Additionally, a series of ecological and environmental problems, including global temperature rises and environmental pollution, have occurred. Many countries are faced with challenges in reducing GHG emissions and have committed to reducing carbon emissions and formulated corresponding policies and targets [2]. In September 2020, at the 75th UN General Assembly, Chinese President Xi Jinping announced that China would enhance its nationally determined contributions to strive to peak carbon emissions before 2030 and achieve carbon neutrality before 2060, which is a significant measure for China’s sustainable development.
Based on China’s current situation, energy consumption will continue to increase alongside economic growth in the present and for a long period to come. How to protect the environment and reduce carbon emissions while maintaining economic growth, thus achieving “carbon peak, carbon neutrality” goals and realizing sustainable development, has become a key focus for government departments, enterprises, research institutions, and scholars. The key to the synergistic advancement of economic growth, energy conservation, and carbon reduction lies in improving carbon emission efficiency. It is defined as the carbon emissions per unit of energy consumption or economic output, reflecting the carbon intensity of energy use or economic development [3].
According to the International Energy Agency’s 2024 global CO2 emissions report, energy-related carbon dioxide emissions increased by 1.1% in 2023, adding 410 million tons to reach 37.4 billion tons, which is a record high value, with coal combustion accounting for over 65% of the emissions increase. Therefore, promoting the development and application of renewable energy is particularly crucial. Renewable energy sources, including solar, wind, hydro, biomass, and geothermal, possess clean and renewable characteristics. They can effectively reduce reliance on fossil fuels. In recent years, China has actively promoted renewable energy development, with hydropower, wind, and solar installations and generation capacity ranking first globally. China has also achieved economic growth while reducing carbon emissions and improving carbon efficiency. However, renewable energy development faces challenges, including uneven resource distribution, significant temporal–spatial fluctuations, limited grid absorption capacity, and relatively high costs. Therefore, accelerating technological innovation in renewable energy, breaking through key technical bottlenecks, reducing costs, and enhancing technical efficiency are crucial measures for large-scale renewable adoption, improving carbon efficiency and promoting sustainable development.
This paper aims to scientifically evaluate the U-shaped impact of technological innovation in renewable energy on carbon emission efficiency and investigate potential mechanisms, as most existing studies focus on linear impact, but few test nonlinearities. This paper also proposes policy recommendations to promote technological innovation in renewable energy, enhance carbon efficiency, and advance sustainable development. The remaining structure of this paper is as follows: Section 2 presents a literature review, Section 3 outlines the research hypotheses, Section 4 describes model construction and variable selection, Section 5 provides the empirical analysis, and Section 6 presents conclusions and policy recommendations.
2. Literature Review
Technological innovation in renewable energy has become a hot topic in academia. The existing literature mainly measures technological innovation in renewable energy by constructing a multidimensional indicator system based on patent data and forms differentiated methods at the data acquisition and processing levels. Studies often use the absolute values of patent applications or authorizations to represent the level of innovation. For example, Ma Limei and Si Lu (2022) manually searched the database of the State Intellectual Property Office of China using international patent classification (IPC) and constructed a patent authorization dataset covering 285 cities from 2010 to 2019 [4]. Wang Jianlong et al. (2024) further refined the technology classification and constructed a comprehensive patent index by integrating five types of IPC codes, such as hydropower and wind power, highlighting the heterogeneous characteristics of technological innovation in renewable energy [5]. Li Fan et al. (2021) [6] compared China with other countries concerning technological innovation in renewable energy. In 2020, the number of patents for renewable energy technologies in China was 3.1 times that of the United States and 4.2 times that of Japan. Nevertheless, China’s R&D expenditure still trails that of developed countries. In 2020, China’s public R&D expenditure on renewable energy amounted to USD 450 million, whereas the public R&D expenditures of the United States and the Netherlands reached as high as USD 4 billion and 4.5 billion, respectively. It is worth noting that some scholars have begun to pay attention to patent quality and knowledge flow effects. For example, Qi Shaozhou and Zhang Zhenyuan (2019) selected high-value patents of the European Patent Office (EPO) as proxy variables [7]. Liu Juan et al. (2023) innovatively introduced the knowledge diffusion rate and decay rate, using the dynamic adjustment function to measure the knowledge stock [8]. These methods complement each other in terms of spatial coverage (national and city levels), data sources (international institutions and domestic databases), and indicator attributes (quantitative and qualitative), providing methodological support for revealing technological innovation in renewable energy [9]. Existing studies have conducted in-depth discussions on the influencing factors of technological innovation in renewable energy. For example, Nepal et al. (2024) confirmed that the policy of the green finance reform pilot zone improves innovation capabilities by improving the financing efficiency of green projects [10]. Chen et al. (2025) further found that green credit would promote technological breakthroughs in clean energy enterprises through debt structure adjustments and enterprise innovation intermediary effects [11]. As an emerging tool, Wei et al. (2024) demonstrated that digital finance can generate differentiated incentives for qualitative and quantitative innovation by easing financing constraints and information disclosure mechanisms [12]. Existing studies have also conducted specific research on the role of technological innovation in renewable energy. Luo et al. (2024) verified the driving role of technological innovation in renewable energy on GDP growth from the perspective of macroeconomic growth, emphasizing that it is a key path for the coordinated development of the economy and the environment [13]. At the industrial structure level, Zheng et al. (2023) found that technological innovation in renewable energy promotes the upgrading of green industrial structures by increasing the penetration rate of green technology [14]. Wang and Chen (2024) [15] further revealed the nonlinear mechanism of technological innovation on carbon productivity. Its direct effect and spatial spillover effect together constitute the driving force of regional low-carbon transformation, and the indirect effect even exceeds the local impact. Yang et al. (2024) emphasized the nonlinear characteristics of technological innovation and revealed the regulatory role of R&D investment and the industrial development level threshold of industrial green transformation [16]. In addition, Huang et al. (2024) [17] expanded the research boundaries from the perspective of corporate governance. They found that technological innovation strengthens environmental governance effectiveness by reducing ESG “greenwashing” risks, particularly in the context of diversified board experience and strengthened media supervision.
In the context of green and low-carbon transformation and development, carbon emission efficiency has always been a hot topic of research. At present, scholars have carried out in-depth and detailed research on carbon emission efficiency, mainly relying on parametric and non-parametric methods. The parametric method is represented by stochastic frontier analysis (SFA). For example, Zhang and Chen used the SFA model to measure the overall carbon emission efficiency of provinces in the Yangtze River Economic Belt [18]. Wang et al. used the SFA model to calculate the green technology efficiency, whcih can be used to measure carbon emission efficiency [19]. Zhu and Lan used the SFA model of carbon emissions to calculate the carbon rebound effect under the digital economy [20]. Zhang et al. used the SFA model to measure the shadow price of sulfur dioxide and COD emissions from industrial enterprises [21]. Chen et al. used the DEA model to measure the carbon emission efficiency of sewage treatment plants [22]. Cai et al. calculated the carbon emission efficiency of 280 cities in China and found that the SFA method solved the problem of underestimating carbon emission efficiency [23]. In general, the existing literature on the SFA model for measuring carbon emission efficiency is mainly based on Battese et al.’s research settings [24]. The non-parametric method is represented by data envelopment analysis (DEA). Chen Xiaohong et al. (2017) proposed a three-stage SBM-DEA model [25], and Yue Li and Han Liang (2022) introduced the information and communication technology (ICT) capital and human capital biased technology perspective to construct a super-SBM model [26]. Liu Kang et al. (2022) and Cheng Yuan et al. (2022), respectively, calculated the carbon emission efficiency of provinces across China and prefecture-level cities in Zhejiang Province through the three-stage super-efficiency SBM-DEA model [27,28]. Bi Doudou et al. (2018) combined the exploratory spatiotemporal data analysis framework with traditional DEA, focusing on the spatiotemporal transition law of carbon emission efficiency in the tourism industry [29]. Hu Jianbo et al. (2021) innovatively combined the non-competitive input–output model with the three-stage DEA model [30]. The academic community has also conducted extensive discussions on the factors that may affect carbon emission efficiency. Jiang Jinhe (2011) believes that economic factors are the most important reason affecting carbon emissions [31]. Chen Biqiong (2014) found that China’s carbon emission intensity will be affected by a series of factors, such as financial efficiency and financial scale [32]. Antonietti et al. (2019) and Ren Xiaosong (2020) found that improving energy efficiency can promote the reduction of carbon emission intensity; meanwhile, the level of economic agglomeration is negatively correlated with carbon emission intensity [33,34]. Sun Yanlin et al. (2016) empirically demonstrated that the optimization of industrial structure and the implementation of energy target constraint policies can promote the improvement of carbon emission efficiency [35]. Song Jiekun et al. (2018) and Pan et al. (2019) found that the degree of opening up, population size, and industrialization can also affect the level of carbon emission efficiency [36,37].
Technological innovation in renewable energy belongs to the category of technological innovation. At present, scholars have conducted some research on the carbon emission reduction effects of technological innovation and its sub-sectors. The research on the emission reduction effect of technological innovation originated from the “Porter hypothesis” [38]. Currently, scholars hold different views on the “Porter hypothesis”. Some scholars agree with the “Porter hypothesis”, while some scholars conduct research from the perspective of empirical analysis and do not support the “Porter hypothesis”. They believe that strict environmental policies are not conducive to technological innovation and carbon emission reduction. However, most scholars believe that the hypothesis needs to meet certain threshold conditions for it to be established [39]. At present, research on the sub-fields of technological innovation mainly focuses on green technological innovation. Some studies believe that green technological innovation can significantly reduce carbon emissions. For example, Xu et al. found that green technological innovation has a significant inhibitory effect on carbon emissions [40]. Some scholars also found that this phenomenon is universal around the world. For example, in N-11 countries [41], G7 countries [42], Singapore [43], and BRICS countries [44], green technological innovation has been proven to significantly reduce carbon emissions. Others believe that this effect requires certain additional conditions. For example, contrary to Xu et al.’s universal reduction, Razzaq et al. [45] pointed out that the carbon reduction effect of green technological innovation needs to meet certain conditions. To be specific, it can only reduce carbon emissions when the regional carbon emission level is high. Shan et al. used the ARDL model to analyze and point out that green technological innovation will significantly reduce carbon emissions in the long and short term, but the short-term impact effect is weak [46]. Xu Bin et al. pointed out that the carbon reduction effect of green technological innovation needs to meet the small scale of clean energy and the rapid growth of energy consumption [47]. There are few studies on the technological innovation in renewable energy. As far as technological innovation in renewable energy is concerned, income is an important factor that causes regional differences in emission reduction effects. Only when income reaches a certain level can technological innovation in renewable energy achieve carbon emission reduction effects, and its marginal emission reduction effect increases with income growth [48,49]. Ma Limei and Si Lu (2022) found that regional differences affect the impact of technological innovation in renewable energy concerning carbon emissions [4].
In summary, domestic and foreign scholars have conducted some research on technological innovation in renewable energy and carbon emission efficiency. But, unfortunately, existing studies mainly focus on the linear impact of technological innovation on carbon emission efficiency, while ignoring the possible nonlinear relationship between the two and the possible influencing mechanism. The marginal contribution of this paper is to establish an SFA model with an inefficiency term to measure carbon emission efficiency, and explore the nonlinear relationship and influencing mechanism between technological innovation in renewable energy and carbon emission efficiency. It is meaningful for promoting the advancement of renewable energy technology in China to improve carbon emission efficiency, thus promoting the realization of sustainable development.
3. Research Hypotheses
3.1. Analysis on the Impact of Technological Innovation in Renewable Energy Concerning Carbon Emission Efficiency
Technological innovation in renewable energy will increase the supply and use of renewable energy, thereby reducing dependence on fossil fuels and decreasing the total amount of carbon emissions. It is beneficial for improving carbon emission efficiency. However, technological innovation in renewable energy will also bring some negative effects. For example, it may increase the cost and energy consumption of production and transportation, causing instability and intermittency in renewable energy. Meanwhile, more energy storage and regulation equipment would be required. These effects will reduce the efficiency and reliability of renewable energy and increase the intensity of carbon emissions. This is not conducive to improving carbon emission efficiency. Therefore, determining the impact of technological innovation in renewable energy for carbon emission efficiency is a dynamic process. It depends on the speed and level of technological innovation in renewable energy, as well as the substitution and complementary effects between renewable energy and fossil energy [50,51]. Based on the environmental Kuznets curve (EKC) theory and learning-by-doing effects [52], this paper proposes that there is a U-shaped relationship between technological innovation in renewable energy and carbon emission efficiency. To be specific, technological innovation in renewable energy will lead to a decrease in carbon emission efficiency in the beginning. But, when technological innovation in renewable energy reaches a certain level, carbon emission efficiency will increase accordingly. In the early stage of technological innovation in renewable energy, the negative impact may exceed the positive impact, resulting in a decrease in carbon emission efficiency. In the later stages of technological innovation in renewable energy, the positive impact may outweigh the negative impact, leading to an increase in carbon emission efficiency.
The U-shaped relationship between technological innovation in renewable energy and carbon emission efficiency can be explained by the following factors. The first factor is economic growth. Technological innovation in renewable energy can promote economic growth. According to the EKC theory, economic growth will also increase energy consumption and carbon emissions, thereby reducing carbon emission efficiency. Only when economic growth reaches a certain level can technological innovation in renewable energy significantly improve carbon emission efficiency. The second factor is high upfront R&D costs. The early stage of the development of technological innovation in renewable energy requires substantial costs. Meanwhile, the issue of resource misallocation may occur. According to learning-by-doing effects, when the development of technological innovation in renewable energy reaches maturity, the cost can be significantly reduced. Additionally, new technology can be extensively applied. Moreover, the problem of resource misallocation can be mitigated, thereby enhancing the efficiency of carbon emissions. The third factor is energy structure transformation. Technological innovation in renewable energy can promote energy structure transformation. According to the EKC theory, the early stage of energy structure transformation will lead to pollution and other environmental issues, thereby delaying the improvement of carbon emission efficiency. Only when the energy structure transformation reaches a certain level can technological innovation in renewable energy significantly improve the energy structure, thereby improving carbon emission efficiency [53,54].
Therefore, hypothesis H1 is proposed:
Hypothesis 1 (H1).
The impact of technological innovation in renewable energy concerning carbon emission efficiency has a U-shaped curve characteristic.
3.2. Analysis on the Moderating Effect of the Informatization Level
The informatization level refers to the application and prevalence of information technology in a country or region, encompassing aspects such as data management, information sharing, and intelligent decision-making. This paper calculates the ratio of the total amount of post and telecommunications services to the regional GDP. High levels of informatization facilitate rapid information flow and processing, thereby enhancing the accuracy of the decision-making process, as well as reshaping the impact of technological innovation on carbon emission efficiency [55]. Regions with advanced informatization are often more capable of absorbing and applying new technologies. For instance, the application of smart grids and Internet of Things (IoT) technologies can optimize the production and distribution of renewable energy, thus improving energy use efficiency. Additionally, informatization promotes interactions between consumers and producers, advancing the implementation of demand-side management. However, improving informatization requires substantial infrastructure development, including communication and energy equipment. In the short term, these infrastructures not only generate almost no revenue during their initial construction phase, but also consume a large amount of energy and lead to a decline in carbon emission efficiency, thereby causing a rightward shift in the inflection point of the U-shaped curve describing the impact of technological innovation in renewable energy concerning carbon emission efficiency.
In the initial stage of technological innovation in renewable energy, carbon emission efficiency may decline due to technological immaturity. In the long term, as infrastructure projects begin to generate returns, informatization can mitigate the negative impacts caused by technological innovation due to its time-lagged effect. At this phase, advanced informatization can mitigate the negative impacts of technological innovation by optimizing resource allocation and accelerating information circulation. For example, through informatization platforms, enterprises can promptly access market information and technical support, thereby reducing uncertainties in technology implementation and accelerating the recovery of carbon emission efficiency. When informatization reaches a high level, improvements in informatization will significantly amplify the positive effects of innovation. Mature technologies, supported by informatization, can achieve higher economic and environmental benefits. Informatization facilitates big data analysis and intelligent decision-making, enabling enterprises to better predict market demand and energy consumption, thereby enhancing their carbon emission efficiency. For instance, big data analytics can help enterprises optimize production processes, reduce energy consumption, and lower carbon emissions.
In summary, the enhancement of informatization levels leads to a rightward shift in the inflection point of the U-shaped curve characterizing the impact of technological innovation in renewable energy concerning carbon emission efficiency. Concurrently, informatization plays a crucial positive moderating role in this relationship. Therefore, advancing informatization infrastructure and elevating its level are of great significance for fostering a synergistic interaction between technological innovation in renewable energy and carbon emission efficiency.
Based on the above, hypothesis H2 is proposed:
Hypothesis 2 (H2).
The level of informatization induces a rightward shift in the inflection point of the U-shaped curve effect of technological innovation in renewable energy concerning carbon emission efficiency, while simultaneously exerting a positive moderating role.
3.3. Analysis on the Moderating Effect of Fiscal Decentralization
Fiscal decentralization refers to the transfer of taxation, expenditure, and fiscal management authority from central to local governments, aiming to increase local autonomy and accountability, thereby improving the efficiency and quality of public services. This paper uses the per capita fiscal expenditure of each region/(per capita fiscal expenditure of each region + per capita fiscal expenditure of the central government) to calculate it. Theoretically, fiscal decentralization enables local governments to formulate more targeted policies based on regional economic, social, and environmental conditions, thereby driving technological innovation in renewable energy more effectively [56]. Consequently, fiscal decentralization may induce a leftward shift in the inflection point of the U-shaped relationship between technological innovation in renewable energy and carbon emission efficiency. The following four aspects could support this phenomenon.
Firstly, fiscal decentralization grants local governments greater autonomy in taxation and expenditure, which may motivate them to take proactive measures toward technological innovation in renewable energy. Local governments can design tailored incentive policies based on their economic conditions and environmental needs to promote renewable energy projects. Secondly, fiscal decentralization allows local governments to allocate resources more flexibly, selecting the most suitable renewable energy technologies based on regional environmental and economic conditions. This flexibility reduces resource waste and enhances carbon emission efficiency. Thirdly, under fiscal decentralization, local governments are closer to markets and communities, enabling them to acquire timely information on renewable energy innovation and carbon emission efficiency. Such feedback mechanisms empower local governments to adjust policies and resource allocation in response to market demands and technological advancements, thereby improving the adaptability of renewable energy technologies and strengthening their positive impact on carbon emission efficiency. Finally, fiscal decentralization may trigger intergovernmental competition, prompting local governments to engage in active benchmarking and learning in renewable energy innovation. This competitive dynamic incentivizes continuous optimization of policies and measures, driving technological innovation and enhancing carbon emission efficiency.
The moderating role of fiscal decentralization lies in its ability to reshape the implementation pathways of technological innovation by altering the incentive structures of local governments. While greater autonomy enables local governments to accelerate technology commercialization through targeted subsidies, tax incentives, and local experimentation (e.g., pilot zones), excessive decentralization may lead to local protectionism and redundant construction, dispersing innovation resources and causing efficiency losses, thereby exerting a negative moderating effect on the relationship between renewable energy innovation and carbon emission efficiency [57]. The specific mechanisms can be explained through the following three aspects.
Firstly, fiscal decentralization exhibits threshold effects. When the degree of decentralization exceeds a critical value (e.g., a local fiscal autonomy rate exceeding 69.65% [58]), local governments transition from “policy implementers” to “interest entities”, leading to “tournament competition” that prioritizes expanding the scale of new energy investments while neglecting technological quality. Secondly, fiscal decentralization initially demonstrates synergistic effects, promoting the development of region-specific technologies (e.g., coastal areas focusing on offshore wind power and inland regions developing photovoltaic systems). However, it subsequently induces fragmentation effects, such as increased system integration costs due to inconsistent cross-regional technical standards and reduced long-term R&D investments under local debt pressures. Thirdly, fiscal decentralization encourages provincial governments to make use of local experimentation (e.g., pilot zones), which intitially speeds up technological innovation in renewable energy adoption but leads to inefficiencies later on.
Based on this, hypothesis H3 is proposed:
Hypothesis 3 (H3).
Fiscal decentralization induces a leftward shift in the inflection point of the U-shaped curve effect of technological innovation in renewable energy concerning carbon emission efficiency, while simultaneously exerting a negative moderating role.
4. Materials and Methods
4.1. Methods
4.1.1. Measurement of Carbon Emission Efficiency via the SFA Model
Compared with non-parametric methods such as DEA, SFA boasts several merits. It can effectively distinguish between random errors and efficiency losses, enabling a more accurate assessment of efficiency. It also supports statistical inference and can verify the reliability of the results through hypothesis testing. Moreover, it is applicable to diverse production datasets, particularly when data are subject to significant noise. This paper calculates carbon emission efficiency by constructing an SFA model. Taking capital, labor, and carbon emissions as inputs and gross domestic product as output, this paper assumes that the optimal relationship between the input and output is as follows:
Among them, represents the economic output under the optimal production state, represents the capital stock, represents the number of laborers, represents carbon emissions, and is a random interference term. In order to use the trans-log production function to construct the carbon emission efficiency index, this paper subtracts from both sides to obtain the following formula:
The left side shows the economic output per unit of carbon emission. Under the same carbon emissions, the larger the economic output, the higher the output efficiency. In the actual production process, improper management can occur, and workers may be late for work or leave early, so the production process is not ideal. Structural defects lead to various restrictions in the production process, so the input–output relationship in actual situations can be set as follows:
Among them represents the part of that is reduced due to various restrictions in the production process; thus, . represents the various restrictive factors faced in the actual production process, such as immature production technology.
The economic meaning of this formula is that when production faces restrictions, the actual economic output per unit of carbon emissions is either lower than or equal to the actual output per unit of carbon emissions in the optimal situation. The difference between the optimal economic output per unit of carbon emissions and the actual output represents the efficiency loss in the production process, which is represented by , and .
When the inputs of factors such as capital and labor are fixed, the greater the economic output corresponding to unit carbon emissions, the higher the carbon emission efficiency. Therefore, the carbon emission efficiency can be set as the ratio of the actual output per unit carbon emissions to the optimal output, which is shown in the following formula:
The output variable, gross domestic product (lnGDP), is measured by the natural logarithm of the annual gross domestic product of each province. The capital stock (lnK) in the input variable is measured by the natural logarithm of the annual fixed asset stock of each province. The number of labor (lnL) is measured by the natural logarithm of the sum of urban and rural employment in each province each year. Total carbon emissions (lnC) are expressed by the natural logarithm of the sum of carbon emissions of eight energy sources: coal, coke, crude oil, gasoline, kerosene, diesel, fuel oil, and natural gas. The specific calculation formula is as follows:
Among them, E represents fossil energy consumption, SCC represents the standard coal conversion coefficient of fossil energy, CEC represents the carbon emission coefficient of fossil energy, and 44/12 represents the molecular ratio of carbon dioxide to carbon.
In addition, the influencing factors of the inefficiency term are also an innovative point of this paper. In order to ensure the accuracy of the SFA model, this paper selects five important factors as the inefficiency term. This paper converts foreign direct investment denominated in USD into foreign direct investment denominated in RMB according to the exchange rate. Additionally, this paper uses the proportion of converted foreign direct investment in GDP to measure the level of openness. The method for measuring the energy consumption structure is to use the ratio of coal consumption to total energy consumption. The method for measuring technological advancement is to use the proportion of internal R&D expenditure to regional GDP. The method for measuring environmental regulation involves using Python 3.9 to count the frequency of keywords related to environmental regulation in the provincial government work report [59,60]. The policy variable is divided by 2016, the starting year of the 13th Five-Year Plan, with 0 before 2016 and 1 after 2016.
In summary, the output variables, input variables, and inefficiency term of the SFA model used in this paper to measure carbon emission efficiency are shown in Table 1.

Table 1.
Variable definitions for the SFA model.
4.1.2. Fixed Effects Model and Mechanism Method
In order to verify the nonlinear relationship between renewable energy technology innovation and carbon emission efficiency, this paper introduces the linear and squared terms of technological innovation in renewable energy in turn for regression and constructs the benchmark regression model shown below.
The linear term is added first:
Additionally, the squared term is added:
Among them, subscript i, t represents the province and time, respectively. Dependent variable is the carbon emission efficiency; and represent the linear and squared terms of the independent variable for technological innovation in renewable energy; represents the control variable; is a random disturbance term.
Further exploring the possible moderating effects of technological innovation in renewable energy for carbon emission efficiency will help provide targeted strategies for improving China’s carbon emission efficiency. This paper focuses on the moderating effects of the informatization level and fiscal decentralization. In order to verify whether the above two variables play an important moderating role, moderating effect models are constructed based on the benchmark regression model.
The moderating effect model of the informatization level:
The moderating effect model of fiscal decentralization:
4.2. Data and Variables
This paper selected the panel data of 30 provinces, municipalities, and autonomous regions in China (excluding Tibet, Hong Kong, Macao, and Taiwan due to data availability) from 2007 to 2022 as the research samples. Based on the research content, this paper used carbon emission efficiency as the explained variable and technological innovation in renewable energy as the explanatory variable. At the same time, the informatization level and fiscal decentralization were introduced as moderating variables. In addition, this paper selected a series of control variables, including urbanization rate, transportation infrastructure, financial development, economic level, and population density, considering the influencing factors affecting carbon emission efficiency.
- (1)
- Dependent variable
Carbon emission efficiency (CEE): This paper uses the SFA model to measure carbon emission efficiency, and the specific model has been shown in the previous section.
- (2)
- Independent variable
Technological innovation in renewable energy (lnRETI): This paper uses renewable energy-related patent data to construct the renewable energy technology innovation knowledge stock index. This calculation method includes the knowledge diffusion rate and the decline rate. It comprehensively considers the time required for new regional technology to be generated and applied, as well as the substitution of the original technology, which has been widely used in related studies [8]. The specific calculation method is as follows:
where REPAT is the number of renewable energy patents granted, i represents the province, t represents the year, and η1 and η2 are the depreciation rate (0.22) and diffusion rate (0.03), respectively. The patent data of renewable energy comes from the Patent Search and Analysis System in the China National Intellectual Property Administration. In this paper, the international patent classification code (IPC), date, and region corresponding to renewable energy technology are used as keywords for retreival, and the panel data of renewable energy patents of 30 provinces, municipalities, and autonomous regions (excluding Hong Kong, Macao, Taiwan, and Tibet) from 2007 to 2022 are manually sorted.
- (3)
- Moderating variables
This paper innovatively introduces the informatization level and fiscal decentralization as moderating variables. The informatization level (Info) is expressed as the ratio of the total amount of post and telecommunications services to the regional GDP. Fiscal decentralization (Find) is expressed as the per capita fiscal expenditure of each region/(per capita fiscal expenditure of each region + per capita fiscal expenditure of the central government).
- (4)
- Control variables
In order to eliminate the influence of other factors on carbon emission efficiency, this paper selects five control variables: urbanization rate, transportation infrastructure, financial development, economic level, and population density. The urbanization rate (urb) is expressed as the urban population/total population. The transportation infrastructure level (tra) is expressed as the natural logarithm of the total freight volume. Financial development (fd) is expressed as the ratio of the loan balance of financial institutions to the GDP. The economic level (lnpgdp) is expressed as the GDP/total population. The population density (pd) is expressed as the year-end resident population (ten thousand)/land area (ten thousand square kilometers).
To sum up, the definitions of variables and their measurement methods are shown in Table 2.
Table 2.
Variable definitions for the empirical analysis.
5. Results and Discussion
5.1. Calculation Results of Carbon Emission Efficiency
Before calculating the stochastic frontier analysis model, this paper conducted a suitability test. The suitability test of the SFA model is used to test whether there are inefficiency terms. According to the parameterization method of Battese and Corra (1995) [24], the null hypothesis of the model is H0: γ = 0. If the null hypothesis is rejected, there are inefficiency terms in the model, and the SFA model is applicable. Otherwise, the OLS estimation method can be used.
This paper uses Stata17.0 for MLE estimation, and the LR statistic obtained is 610.07, which is greater than the critical value of the mixed chi-square distribution. The null hypothesis should be rejected, indicating an inefficiency term in the model, and the SFA model can be used for parameter estimation. This paper uses the BC95 model, and the results of the SFA model are shown in Table 3.
Table 3.
Calculation results of the SFA model for carbon emission efficiency.
5.2. Descriptive Analysis
Before conducting a benchmark regression analysis, this paper first conducted a descriptive analysis. The specific results are shown in Table 4.
Table 4.
Results of the descriptive statistical analysis.
As can be seen from Table 4, this paper studies a total of 480 sample data, with a mean explained variable carbon emission efficiency of 0.701 and a median of 0.678, indicating that there are more samples of carbon emission efficiency lower than the mean value. The maximum value is 0.992, the minimum value is 0.471, and the standard deviation is 0.131, indicating that there is a certain gap in carbon emission efficiency among provinces. The explanatory variable, technological innovation in renewable energy, has a mean of 4.069 and a median of 4.190, which is a similar situation to carbon emission efficiency. The maximum value is 7.458, and the minimum value is only −0.335, indicating that there is a large gap in the level of technological innovation in renewable energy among provinces. Regarding the moderating variable informatization level, its mean value of 0.064 is much greater than the median value of 0.044, indicating that there are many provinces with informatization levels below the mean value, while the informatization level of a few provinces has reached a relatively high level. The mean value of fiscal decentralization is 0.846, and the median value is 0.849, indicating that the fiscal decentralization level of each province is relatively stable.
This paper used VIF analysis to test the independent variables, dependent variables, and control variables. The specific results are shown in Table 5. The VIF value of each variable is less than 10, indicating that there is no multicollinearity, which further proves the reliability of this empirical study.
Table 5.
Results of the VIF test.
5.3. Benchmark Regression
In order to examine the direct impact of technological innovation in renewable energy on carbon emission efficiency, this paper selected a two-way fixed-effect model. The specific results are shown in Table 6. Column (1) shows the result of adding only the linear term, and column (2) shows the result of adding both the linear term and the square term. It can be seen that the goodness of fit is better after adding the square term. The linear term coefficient changes from significantly positive to significantly negative, while the square term coefficient is significantly positive. Therefore, there may be a U-shaped relationship between technological innovation in renewable energy and carbon emission efficiency, which needs to be confirmed by a further U-shaped relationship test. In terms of control variables, the regression coefficients for the urbanization rate, transportation infrastructure, financial development, economic level, and population density are all significantly positive, indicating that they all play a positive role in promoting the improvement of carbon emission efficiency.
Table 6.
Results of baseline regression.
Merely observing the coefficient of technological innovation in renewable energy and its square term cannot prove the U-shaped relationship between technological innovation in renewable energy and carbon emission efficiency. So, this paper conducted a U-shape test, and the results are shown in Table 7. The extreme point in the U-shaped relationship test is 2.596605, which falls within the interval [−0.3345057, 7.457608]. The left-side slope is −0.0363128, and the right-side slope is 0.0602218, which are both significant. Therefore, it is proven that the U-shaped relationship between the impact of technological innovation in renewable energy and carbon emission efficiency does exist.
Table 7.
Results of the U-shaped relationship test.
5.4. Moderating the Effects of the Informatization Level and Fiscal Decentralization
Based on the baseline regression analysis, this paper introduces the informatization level and fiscal decentralization to analyze their moderating effects on the impact of technological innovation in renewable energy concerning carbon emission efficiency. The specific results are shown in Table 8.
Table 8.
Results of the moderating effect.
- (1)
- Moderating effects of the informatization level
The moderating effect of the information level is shown in column (1) of Table 8. The coefficient of the cross-product of information level and the square term of technological innovation in renewable energy is significantly positive. It can be seen that the informatization level shifts the inflection point to the right in the U-shaped curve of technological innovation in renewable energy, influencing carbon emission efficiency, and has a positive moderating effect. In the short term, the enhancement of informatization relies heavily on large-scale infrastructure construction, which cannot generate returns but requires substantial energy consumption. This leads to a decline in carbon emission efficiency, delaying the inflection point of the U-shaped curve. In the long term, as infrastructure projects begin to generate returns and informatization reaches a high level, digital tools such as smart grids will amplify the positive effects of technological innovation. So, hypothesis H2, outlined in the previous section, is verified.
- (2)
- Moderating effect of fiscal decentralization
The moderating effect of fiscal decentralization is shown in column (2) of Table 8. The coefficient of the cross-product of fiscal decentralization and the square term of technological innovation in renewable energy is significantly negative. It can be seen that fiscal decentralization shifts the inflection point to the left in the U-shaped curve of technological innovation in renewable energy, influencing carbon emission efficiency, and has a negative moderating effect. Specifically, fiscal decentralization reshapes the implementation path of technological innovation by altering the incentive structure of local governments, thereby granting them greater autonomy. Through policies such as targeted subsidies and tax incentives, it accelerates the commercialization of technology, leading to an earlier attainment of the turning point in the U-shaped curve. However, with increasing fiscal decentralization, excessive decentralization arises. This promotes local protectionism and redundant construction, dispersing innovation resources and causing efficiency losses, thereby resulting in an adverse moderating effect. So, hypothesis H3 in the previous section is verified.
5.5. Heterogeneity Analysis
In order to more carefully characterize the possible differences in the effects of technological innovation in renewable energy concerning carbon emission efficiency under different conditions, this paper conducted a heterogeneity analysis of different regions, different industrial structure levels, and different levels of technological innovation in renewable energy. The results are shown in Table 9.
Table 9.
Results of heterogeneity analysis.
Columns (1)–(3) in Table 9 are samples of provinces in the eastern region, provinces in the central region, and provinces in the western region. Specifically, in terms of regional heterogeneity, the carbon emission efficiency and levels of technological innovation in renewable energy in the eastern region are already at a leading level. Therefore, the role of technological innovation in renewable energy for improving carbon emission efficiency is relatively limited; however, after the new technology matures, it can significantly improve carbon emission efficiency. The central region has a relatively good infrastructure construction, and technological innovation in renewable energy has a large development space, which can be implemented quickly and significantly improve carbon emission efficiency. The economy and infrastructure in the western region are relatively backward, and they need to wait for technology to mature before they can play a role in improving carbon emission efficiency. Columns (4) and (5) in Table 9 are samples of provinces with high and low levels of industrial structure upgrading. In terms of industrial structure heterogeneity, in regions with faster industrial structure upgrading, the time when the effect of technological innovation in renewable energy concerning carbon emission efficiency reaches the inflection point is slightly later than that in regions with slower industrial structure upgrading. Columns (6) and (7) in Table 9 are samples of provinces with high and low levels of technological innovation in renewable energy. It can be seen that the time when regions with higher levels of technological innovation in renewable energy reach the inflection point is also later than that of regions with lower levels.
5.6. Endogeneity Test and Robustness Test
Technological innovation in renewable energy lagging by one period is usually significantly correlated with the current level, which meets the correlation requirements between instrumental variables and endogenous variables. From the exogeneity condition, the lagged variable is ahead of the current error term in time and theoretically will not be adversely affected by current or future unobservables, thus satisfying the exogeneity condition. Therefore, this paper selected the first-order lag of technological innovation in renewable energy and its square term for the instrumental variable test. The results are shown in Table 10. Columns (1) and (2) show that the Sanderson–Windmeijer test is passed, which means the instrument variables are effective. Additionally, column (3) indicates the U-shaped impact. So, the two-stage instrumental variable method test is passed successfully.
Table 10.
Results of the endogeneity test.
Then, this paper conducted robustness tests, including winsorizing the samples by 1%, excluding the samples from municipalities, adding the cubic term of renewable energy technological innovation, and a semi-parametric test.
The test result of adding the cubic term of technological innovation in renewable energy is shown in column (1) of Table 11. Compared with the baseline regression, the coefficient of technological innovation in renewable energy is still significantly negative, the coefficient of the square term is still significantly positive, and the coefficient of the cubic term is not significant, which proves the robustness of the U-shaped relationship observed in the baseline regression. The regression result of winsorizing the samples by 1% is shown in column (2). Compared to the baseline regression, the coefficient of technological innovation in renewable energy is still significantly negative, and the coefficient of the square term of technological innovation in renewable energy is still significantly positive, which confirms the robustness of the baseline regression results. The results of excluding the samples of municipalities are shown in column (3), which also verifies the robustness of the baseline regression results. Additionally, the results of the semi-parametric test are shown in Figure 1, indicating a clear U-shaped curve that verifies the U-shaped relationship between technological innovation in renewable energy and carbon emission efficiency.
Table 11.
Results of robustness tests.
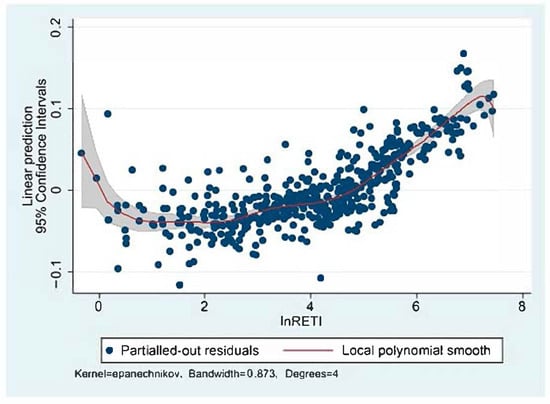
Figure 1.
Result of the semi-parametric test.
6. Conclusions and Policy Suggestions
6.1. Conclusions
This study selected data from 30 provinces, municipalities, and autonomous regions in China from 2007 to 2022 as research samples to empirically analyze the impact of technological innovation in renewable energy concerning carbon emission efficiency. The main conclusions are as follows:
- (1)
- The impact of technological innovation in renewable energy toward carbon emission efficiency exhibits a U-shaped pattern. By conducting a regression analysis between technological innovation in renewable energy (along with its square term) and carbon emission efficiency, it is revealed that before reaching the inflection point of technological innovation in renewable energy, there exists a negative effect on carbon emission efficiency. After surpassing the inflection point, the influence shifts to positive. This indicates that technological innovation in renewable energy constitutes a long-term investment process. To be specific, technological innovation in renewable energy would adversely affect carbon emission efficiency in the initial stage, and after surpassing the inflection point, which is 2.596605 (as calculated in the U-shape test above), positive impacts would emerge, and technological innovation in renewable energy would significantly promote improvement in carbon emission efficiency.
- (2)
- The informatization level exerts a positive moderating effect on the U-shaped curve relationship between technological innovation in renewable energy and carbon emission efficiency. In the short term, the enhancement of informatization relies heavily on large-scale infrastructure construction. In the initial phase of such infrastructure development, these projects cannot generate returns but require substantial energy consumption, leading to a decline in carbon emission efficiency and delaying the inflection point of the U-shaped curve. In the long term, as infrastructure projects begin to generate returns, informatization can mitigate the negative impacts caused by technological innovation. When informatization reaches a high level, digital tools such as smart grids will amplify the positive effects of technological innovation. Therefore, elevating the informatization level holds significant importance for achieving a positive interaction between technological innovation in renewable energy and carbon emission efficiency.
- (3)
- Fiscal decentralization exerts a negative moderating effect on the U-shaped curve relationship between technological innovation in renewable energy and carbon emission efficiency. Specifically, fiscal decentralization reshapes the implementation path of technological innovation by altering the incentive structure of local governments, thereby granting them greater autonomy. Through policies such as targeted subsidies and tax incentives, it accelerates the commercialization of technology, leading to an earlier attainment of the turning point in the U-shaped curve. Meanwhile, with the continuous increase in fiscal decentralization, excessive decentralization would foster local protectionism and redundant construction, thereby causing efficiency losses and resulting in a negative moderating effect. Therefore, a moderate level of fiscal decentralization is essential for realizing the positive effects of technological innovation in renewable energy for enhancing carbon emission efficiency.
- (4)
- The impact of technological innovation in renewable energy on carbon emission efficiency varies depending on regional heterogeneity, industrial structure levels, and heterogeneity concerning technological innovation capabilities in renewable energy. Specifically, the enhancement effect of technological innovation in renewable energy on carbon emission efficiency is more pronounced in eastern and central China. For instance, Shanghai, Jiangsu, Zhejiang, and Guangdong all passed the inflection point in 2007. In western regions, where economic development and infrastructure are relatively underdeveloped, realizing this enhancement effect requires waiting until technological maturity is achieved. For instance, Qinghai did not surpass the U-curve’s inflection point until 2019, and Ningxia surpassed the point in 2017. Regions with faster industrial structure upgrading exhibit slightly later inflection points for the efficiency-enhancing effects of technological innovation in renewable energy compared to regions with slower industrial upgrading. Similarly, regions with higher levels of technological innovation in renewable energy reach inflection points later than those with lower innovation levels.
6.2. Policy Suggestions and Future Research Recommendations
6.2.1. Policy Suggestions
Based on the conclusions of this paper, the following policy recommendations are proposed on how to improve the level of innovation in renewable energy technology, improve carbon emission efficiency, and promote sustainable economic and social development.
- (1)
- The government needs to formulate a long-term strategy for technological innovation in renewable energy.
The government should set long-term goals for technological innovation in renewable energy and formulate specific technological innovation goals based on resource endowment, industrial structure, and foundation of renewable energy technology in different regions. Specifically, provinces in the eastern area have low traditional energy reserves, a good technological foundation, and convenient external communication. They have the natural advantages of developing technological innovation in renewable energy and should make full use of advanced science to vigorously develop marine energy technology, wind energy technology, etc. However, the central and western regions have a weak foundation for technological innovation in renewable energy and are heavily dependent on traditional energy. By undertaking technology transfer from the eastern region, a series of renewable energy technologies, such as solar energy technology, can be developed according to local conditions. In the process of promoting technological innovation in renewable energy, the government also needs to pay attention to international cooperation. Global climate change is a transnational issue. By participating in international research projects and technology transfer, the government can introduce advanced technology and management expertise, enhance the innovation capacity of domestic renewable energy technologies, and thereby improve carbon emission efficiency and promote sustainable development.
- (2)
- The government needs to promote the integration of informatization development and technological innovation in renewable energy.
First, the government should strengthen the construction of basic information platforms and integrate various data resources, including data on energy production, consumption, storage, and management. By establishing a national information-sharing platform, governments, research institutions, and enterprises can obtain the latest market trends, technological progress, and policy orientations in real-time. Secondly, the government should promote information sharing and exchange. Regional governments could encourage cooperation between enterprises, research institutions, and universities. Industry alliances and technical cooperation platforms could also be established to promote the integration and sharing of information. Finally, the government could also actively organize various technical exchange activities related to imformatization and renewable energy technology. With the help of necessary training and technical support, enterprises could improve their information application capabilities and promote the innovation of renewable energy technologies.
- (3)
- The government needs to improve the rationality of the level of fiscal decentralization.
Firstly, in the early stages of fiscal decentralization, regional governments would obtain autonomy over renewable energy projects. This will not only encourage regional governments to actively participate in the development and utilization of renewable energy, but also enable them to flexibly adjust policies according to actual local conditions. Secondly, controlling the excessive degree of fiscal decentralization is another important aspect. Although fiscal decentralization can enhance the flexibility and autonomy of local governments, excessive decentralization may lead to the rise of local protectionism. Finally, regional governments should also strengthen coordination and communication with the central government to make full use of fiscal resources. In the process of fiscal decentralization, regional governments can obtain more financial resources and independent decision-making power; however, they also need to assume corresponding responsibilities and obligations. In order to achieve the goals of sustainable development, regional governments must align with the central government in resource allocation, project selection, and fiscal expenditure to ensure policy coordination and consistency.
6.2.2. Future Research Recommendations
This paper provides an extensive and in-depth analysis of the impact of technological innovation in renewable energy concerning carbon emission efficiency. However, there are also some aspects that can be discussed in future research on this topic. Whether cross-regional collaboration accelerates the positive phase of technological innovation in renewable energy could be studied. The specific technological innovations in renewable energy that have contributed most to carbon emissions efficiency improvements in China, together with regional differences in economic development and infrastructure, are also of research value. Furthermore, the integration of renewable energy technologies into existing energy infrastructures and the relationship between the cost of renewable energy technologies and their adoption rates could also be discussed.
Author Contributions
Conceptualization, R.Y. and H.P.; methodology, R.Y.; software, R.Y.; validation, R.Y., H.P. and Y.L.; formal analysis, R.Y.; investigation, R.Y.; resources, H.P.; data curation, Y.L.; writing—original draft preparation, R.Y. and Y.L.; writing—review and editing, H.P.; visualization, R.Y.; supervision, H.P.; project administration, R.Y.; funding acquisition, Y.L. All authors have read and agreed to the published version of the manuscript.
Funding
This research was funded by the Postgraduate Research & Practice Innovation Program of Jiangsu Province (grant number KYCX24_0797).
Institutional Review Board Statement
Not applicable.
Informed Consent Statement
Not applicable.
Data Availability Statement
The basic data used in this paper can be found on the websites of the Patent Search and Analysis System of the China National Intellectual Property Administration, National Bureau of Statistics, Statistical Yearbooks, and other relevant databases.
Conflicts of Interest
The authors declare no conflicts of interest.
References
- Zhang, H.; Khan, K.A.; Eweade, B.S.; Adebayo, T.S. Role of eco-innovation and financial globalization on ecological quality in China: A wavelet analysis. Energy Environ. 2024, 0958305X241228518. [Google Scholar] [CrossRef]
- Yan, Y.; Khan, K.A.; Adebayo, T.S.; Olanrewaju, V.O. Unveiling energy efficiency and renewable electricity’s role in achieving sustainable development goals 7 and 13 policies. Int. J. Sustain. Dev. World Ecol. 2024, 31, 497–522. [Google Scholar] [CrossRef]
- Zhang, W.; Zhu, Q.; Li, H. Energy use, carbon emission and China’s total factor carbon emission reduction efficiency. Econ. Res. J. 2013, 48, 138–150. (In Chinese) [Google Scholar]
- Ma, L.; Si, L. Low-carbon cities and renewable energy technology innovation. China Popul. Resour. Environ. 2022, 32, 81–90. (In Chinese) [Google Scholar]
- Wang, J.; Wang, W.; Liu, Y. How can new energy vehicles drive renewable energy technology innovation? A test based on the difference-in-differences model. Ind. Econ. Res. 2024, 02, 115–129. (In Chinese) [Google Scholar]
- Li, F.; Zhu, B.; Sun, Y. Environmental policy, institutional quality and renewable energy technology innovation: An empirical analysis of 32 countries. Resour. Sci. 2021, 43, 2514–2525. (In Chinese) [Google Scholar] [CrossRef]
- Qi, S.; Zhang, Z. EU ETS, EUA Allocation and Renewable Energy Technological Innovation. World Econ. Stud. 2019, 09, 119–133+136. (In Chinese) [Google Scholar]
- Liu, J.; Ma, L.; Feng, W. Renewable Energy Technology Innovation and Industry Carbon Emission Reduction: An Empirical Test Based on China’s Provincial Panel Data. Sci. Technol. Prog. Policy 2023, 40, 83–93. (In Chinese) [Google Scholar]
- Sun, X.; Zhao, K.; Zhang, H. Can the Low-carbon City Pilot Policy Effectively Promote Renewable Energy Technology Innovation? J. Shandong Univ. Technol. (Soc. Sci. Ed.) 2024, 40, 5–12. (In Chinese) [Google Scholar]
- Nepal, R.; Liu, Y.; Wang, J.; Dong, K. How does green finance promote renewable energy technology innovation? A quasi-natural experiment perspective. Energy Econ. 2024, 134, 107576. [Google Scholar] [CrossRef]
- Chen, G.; Wang, J.; Kane, J. What is the impact of green credit on technical innovation in renewable energy? The policy-accommodating practices of businesses. Energy Strategy Rev. 2025, 58, 101665. [Google Scholar] [CrossRef]
- Wei, D.; Ahmad, F.; Chandio, A.A.; Khan, I. Digital financial inclusion role to promote renewable energy technology innovation in Chinese prefectural cities: Moderating role of environmental governance. Renew. Energy 2024, 237, 121704. [Google Scholar] [CrossRef]
- Luo, Z.; Wang, C.; Tang, Q.; Tian, W. Renewable Energy Technology Innovation Effect on the Economics Growth. Chem. Technol. Fuels Oils 2024, 59, 1271–1278. [Google Scholar] [CrossRef]
- Zheng, Z.; Lin, B.; Ye, N.; Zheng, C.; Xie, Y. Impact of renewable energy technology innovation on green industrial structure upgrading: Evidence from 284 cities in China. Environ. Res. Commun. 2023, 5, 115020. [Google Scholar] [CrossRef]
- Wang, Y.; Chen, X. Impact Mechanism of Renewable Energy Technology Innovation on Carbon Productivity Based on Spatial Durbin Model. Sustainability 2024, 16, 2100. [Google Scholar] [CrossRef]
- Yang, X.; Khan, H.; Khan, I.; Razzaq, A. Assessing the Impact Mechanism of Renewable Energy Technology Innovation on Industrial Green Transformation in China. J. Knowl. Econ. 2024, 1–23. [Google Scholar] [CrossRef]
- Huang, Y.; Xiong, N.; Liu, C. Renewable energy technology innovation and ESG greenwashing: Evidence from supervised machine learning methods using patent text. J. Environ. Manag. 2024, 370, 122833. [Google Scholar] [CrossRef]
- Zhang, C.; Chen, P. Industrialization, urbanization, and carbon emission efficiency of Yangtze River Economic Belt—Empirical analysis based on stochastic frontier model. Environ. Sci. Pollut. Res. 2021, 28, 66914–66929. [Google Scholar] [CrossRef] [PubMed]
- Wang, J.; Sun, K.; Ni, J.; Xie, D. Evaluation and Factor Analysis of Industrial Carbon Emission Efficiency Based on “Green-Technology Efficiency”—The Case of Yangtze River Basin, China. Land 2021, 10, 1408. [Google Scholar] [CrossRef]
- Zhu, Y.; Lan, M. Digital economy and carbon rebound effect: Evidence from Chinese cities. Energy Econ. 2023, 126, 106957. [Google Scholar] [CrossRef]
- Zhang, N.; Huang, X.; Qi, C. The effect of environmental regulation on the marginal abatement cost of industrial firms: Evidence from the 11th Five-Year Plan in China. Energy Econ. 2022, 112, 106147. [Google Scholar] [CrossRef]
- Chen, H.; Zheng, Y.; Zhou, K.; Cheng, R.; Zheng, X.; Ma, Z.; Shi, L. Carbon emission efficiency evaluation of wastewater treatment plants: Evidence from China. Environ. Sci. Pollut. Res. 2023, 30, 76606–76616. [Google Scholar] [CrossRef]
- Cai, B.; Guo, H.; Ma, Z.; Wang, Z.; Dhakal, S.; Cao, L. Benchmarking carbon emissions efficiency in Chinese cities: A comparative study based on high-resolution gridded data. Appl. Energy 2019, 242, 994–1009. [Google Scholar] [CrossRef]
- Battese, G.E.; Coelli, T.J. A model for technical inefficiency effects in a stochastic frontier production function for panel data. Empir. Econ. 1995, 20, 325–332. [Google Scholar] [CrossRef]
- Cheng, X.; Yi, G.; Liu, X. Analysis of the Low Carbon Economy Efficiency in China: Based on a Method of Three Stage SBM-DEA Model with Undesirable Outputs. Oper. Res. Manag. Sci. 2017, 26, 115–122. (In Chinese) [Google Scholar]
- Yue, L.; Han, L. Impact of Biased Technological Advances in Different Types of Capital Technologies on Carbon Emission Efficiency. Sci. Technol. Manag. Res. 2022, 42, 211–218. (In Chinese) [Google Scholar]
- Liu, K.; Yuan, M.; Shen, S. Measurement of Regional Carbon Emission Efficiency and Analysis of Regional Differences in China—Based on a three-stage Super-SBM-DEA model. J. Lanzhou Univ. Financ. Econ. 2022, 38, 44–59. (In Chinese) [Google Scholar]
- Cheng, Y.; Qiao, G.M.; Mei, S.Y.; Ning, A.F. Spatial-temporal Differences of Carbon Emission Efficiency in Zhejiang Province Based on SBM-DEA Model. Resour. Dev. Mark. 2022, 38, 272–279. (In Chinese) [Google Scholar]
- Bi, D.; Lai, Y.; Wang, L.; Meng, Y. Carbon Emission Efficiency of Tourism and Its Spatial-Time Transition in China. J. South China Univ. Technol. (Soc. Sci. Ed.) 2018, 20, 25–35. (In Chinese) [Google Scholar]
- Hu, J.; Yan, Y.; Han, J. Study on the Carbon Emissions Efficiency Embodied in China’s Industrial Sector—Empirical Analysis Based on Three-stage DEA Model and Non-competitive I-O Model. Stat. Res. 2021, 38, 30–43. (In Chinese) [Google Scholar]
- Jiang, J. An evaluation and decomposition analysis of carbon emissions in China. Resour. Sci. 2011, 33, 597–604. (In Chinese) [Google Scholar]
- Chen, B.; Zhang, L. The Impact of Financial Development to Carbon Emissions from the Perspective of Dynamic Spatial. Soft Sci. 2014, 28, 140–144. (In Chinese) [Google Scholar]
- Antonietti, R.; Fontini, F. Does energy price affect energy efficiency? Cross-country panel evidence. Energy Policy 2019, 129, 896–906. [Google Scholar] [CrossRef]
- Ren, X.S.; Liu, Y.J.; Zhao, G.H. Impact Transm. Mech. Econ. Agglom. Carbon intensity. China Popul. Resour. Env. 2020, 30, 95–106. (In Chinese) [Google Scholar]
- Sun, Y.L.; He, L.; Wen, H.W. Research on inter-provincial carbon emissions efficiency and its determinants in China based on provincial heterogeneity perspective. J. Ind. Technol. Econ. 2016, 35, 117–123. (In Chinese) [Google Scholar]
- Song, J.K.; Liang, L.L.; Niu, D.P.; Cao, Z.J.; Zhang, K.X. Evaluation, Influencing Factors and Promotion Countermeasures of Cities’ Carbon Emissions Efficiencies in Shandong Province. J. China Univ. Pet. (Ed. Soc. Sci.) 2018, 34, 15–21. (In Chinese) [Google Scholar]
- Pan, X.; Uddin, M.K.; Ai, B.; Pan, X.; Saima, U. Influential factors of carbon emissions intensity in OECD countries: Evidence from symbolic regression. J. Clean. Prod. 2019, 220, 1194–1201. [Google Scholar] [CrossRef]
- Porter, M. America’s green strategy. Sci. Am. 1991, 33, 11–16. [Google Scholar]
- Boyd, G.A.; Mc Clelland, J.D. The impact of environmental constraints on productivity improvement in integrated paper plants. J. Environ. Econ. Manag. 1999, 38, 121–142. [Google Scholar] [CrossRef]
- Xu, L.; Fan, M.; Yang, L.; Shao, S. Heterogeneous green innovations and carbon emission performance: Evidence at China’s city level. Energy Econ. 2021, 99, 105269. [Google Scholar] [CrossRef]
- Wang, R.; Mirza, N.; Vasbieva, D.G.; Abbas, Q.; Xiong, D. The nexus of carbon emissions, financial development, renewable energy consumption, and technological innovation: What should be the priorities in light of COP 21 Agreements. J. Environ. Manag. 2020, 271, 111027. [Google Scholar] [CrossRef] [PubMed]
- Ding, Q.; Khattak, S.I.; Ahmad, M. Towards sustainable production and consumption: Assessing the impact of energy productivity and eco-innovation on consumption based carbon dioxide emissions(CO2)in G-7 nations. Sustain. Prod. Consum. 2021, 27, 254–268. [Google Scholar] [CrossRef]
- Meirun, T.; Mihardjo, L.W.; Haseeb, M.; Khan, S.A.R.; Jermsittiparsert, K. The dynamics effect of green technology innovation on economic growth and CO2 emission in Singapore: New evidence from bootstrap ARDL approach. Environ. Sci. Pollut. Res. 2021, 28, 4184–4194. [Google Scholar] [CrossRef]
- Jiang, Q.; Rahman, Z.U.; Zhang, X.; Islam, M.S. An assessment of the effect of green innovation, income, and energy use on consumption-based CO2 emissions: Empirical evidence from emerging nations BRICS. J. Clean. Prod. 2022, 365, 132636. [Google Scholar] [CrossRef]
- Razzaq, A.; Wang, Y.; Chupradit, S.; Suksatan, W.; Shahzad, F. A symmetric inter-linkages between green technology innovation and consumption-based carbon emissions in BRICS countries using quantile-on-quantile framework. Technol. Soc. 2021, 66, 101656. [Google Scholar] [CrossRef]
- Shan, S.; Genç, S.Y.; Kamran, H.W.; Dinca, G. Role of green technology innovation and renewable energy in carbonneutrality: A sustainable investigation from Turkey. J. Environ. Manag. 2021, 294, 113004. [Google Scholar] [CrossRef] [PubMed]
- Xu, B.; Chen, Y.; Shen, X. Clean Energy Development, Carbon Dioxide Emission Reduction and Regional Economic Growth. Econ. Res. J. 2019, 54, 188–202. (In Chinese) [Google Scholar]
- Hu, Y. The Impact of Renewable Energy Development on Carbon Emissions, Economic Growth and Employment in China; Central University of Economics and Finance: Beijing, China, 2022. (In Chinese) [Google Scholar]
- Wang, B.; Wu, Y.; Liu, P.; Chen, S. Regional Heterogeneity Governing Renewable Energy Development—From the Perspective of Industrial Chain of Production, Transportation and Consumption. J. Beijing Inst. Technol. (Soc. Sci. Ed.) 2022, 24, 39–50. (In Chinese) [Google Scholar]
- An, K.; Liu, M.; Fan, S.; Wang, C. Impact of transition from the energy consumption “dual control” to the carbon “dual control”: A CGE-based case study of Anhui. China Environ. Sci. 2024, 44, 1795–1804. (In Chinese) [Google Scholar]
- Li, Y.M.; Yang, C.; Ren, H.J. Stochastic evolutionary game between governments and enterprises in renewable energy investment in view of dynamic carbon price perspective. China Environ. Sci. 2024, 44, 567–580. (In Chinese) [Google Scholar]
- Gaynor, M.; Seider, H.; Vogt, W.B. The Volume-Outcome Effect, Scale Economies, and Learning-by-Doing. Am. Econ. Rev. 2005, 95, 243–247. [Google Scholar] [CrossRef]
- Lin, Y.; Xu, J.; Yang, Z.; Zhang, Y. Disciplinary Foundation and Analytical Framework of New Structural Financial Economics. China Econ. Q. 2023, 23, 1653–1667. (In Chinese) [Google Scholar]
- Lin, Y.; Fu, C. Comparative Advantage and Competitive Advantage: A Perspective of New Structural Economics. Econ. Res. J. 2022, 57, 23–33. (In Chinese) [Google Scholar]
- Liu, M.; Yang, X.; Ping, W.; Li, J. Digital Technology Innovation, Informatization Level, and Digital Platform Development: Based on a Fintech Platform Perspective. J. Syst. Manag. 2024, 33, 1181–1193. [Google Scholar]
- Gong, Q.; Wang, J.; Jia, S. A survey of research on local government debts and fiscal decentralization. Econ. Res. J. 2011, 46, 144–156. (In Chinese) [Google Scholar]
- Koethenbuerger, M. Revisiting the “decentralization theorem”—On the role of externalities. J. Urban Econ. 2008, 64, 116–122. [Google Scholar] [CrossRef]
- Chu, D.; Zhao, F. Fiscal Decentralization, Government Transfer Payments and Rural Poverty: Analysis of Threshold Effect Based on Dual Dimensions of Revenue and Expenditure outside and inside Budget. J. Financ. Econ. 2013, 39, 4–18. (In Chinese) [Google Scholar]
- Chen, S.Y.; Chen, D.K. Air pollution, government regulations and high-quality economic development. Econ. Res. J. 2018, 53, 20–34. (In Chinese) [Google Scholar]
- Deng, H.; Yang, L. Haze Governance, Local Competition and Industrial Green Transformation. China Ind. Econ. 2019, 10, 118–136. (In Chinese) [Google Scholar]
Disclaimer/Publisher’s Note: The statements, opinions and data contained in all publications are solely those of the individual author(s) and contributor(s) and not of MDPI and/or the editor(s). MDPI and/or the editor(s) disclaim responsibility for any injury to people or property resulting from any ideas, methods, instructions or products referred to in the content. |
© 2025 by the authors. Licensee MDPI, Basel, Switzerland. This article is an open access article distributed under the terms and conditions of the Creative Commons Attribution (CC BY) license (https://creativecommons.org/licenses/by/4.0/).