
Land Consolidation Potential Assessment by Using the Production–Living–Ecological Space Framework in the Guanzhong Plain, China

 , ,
, ,  and
and
Abstract
1. Introduction
- (1)
- Developing an LC potential evaluation system that integrates both subjective perceptions and objective indicators based on PLE functions;
- (2)
- Analyzing the spatial differentiation of LC potential and establishing priority levels within the study area;
- (3)
- Identifying the key constraints across different potential zones and proposing targeted consolidation strategies.
2. Study Area and Research Data
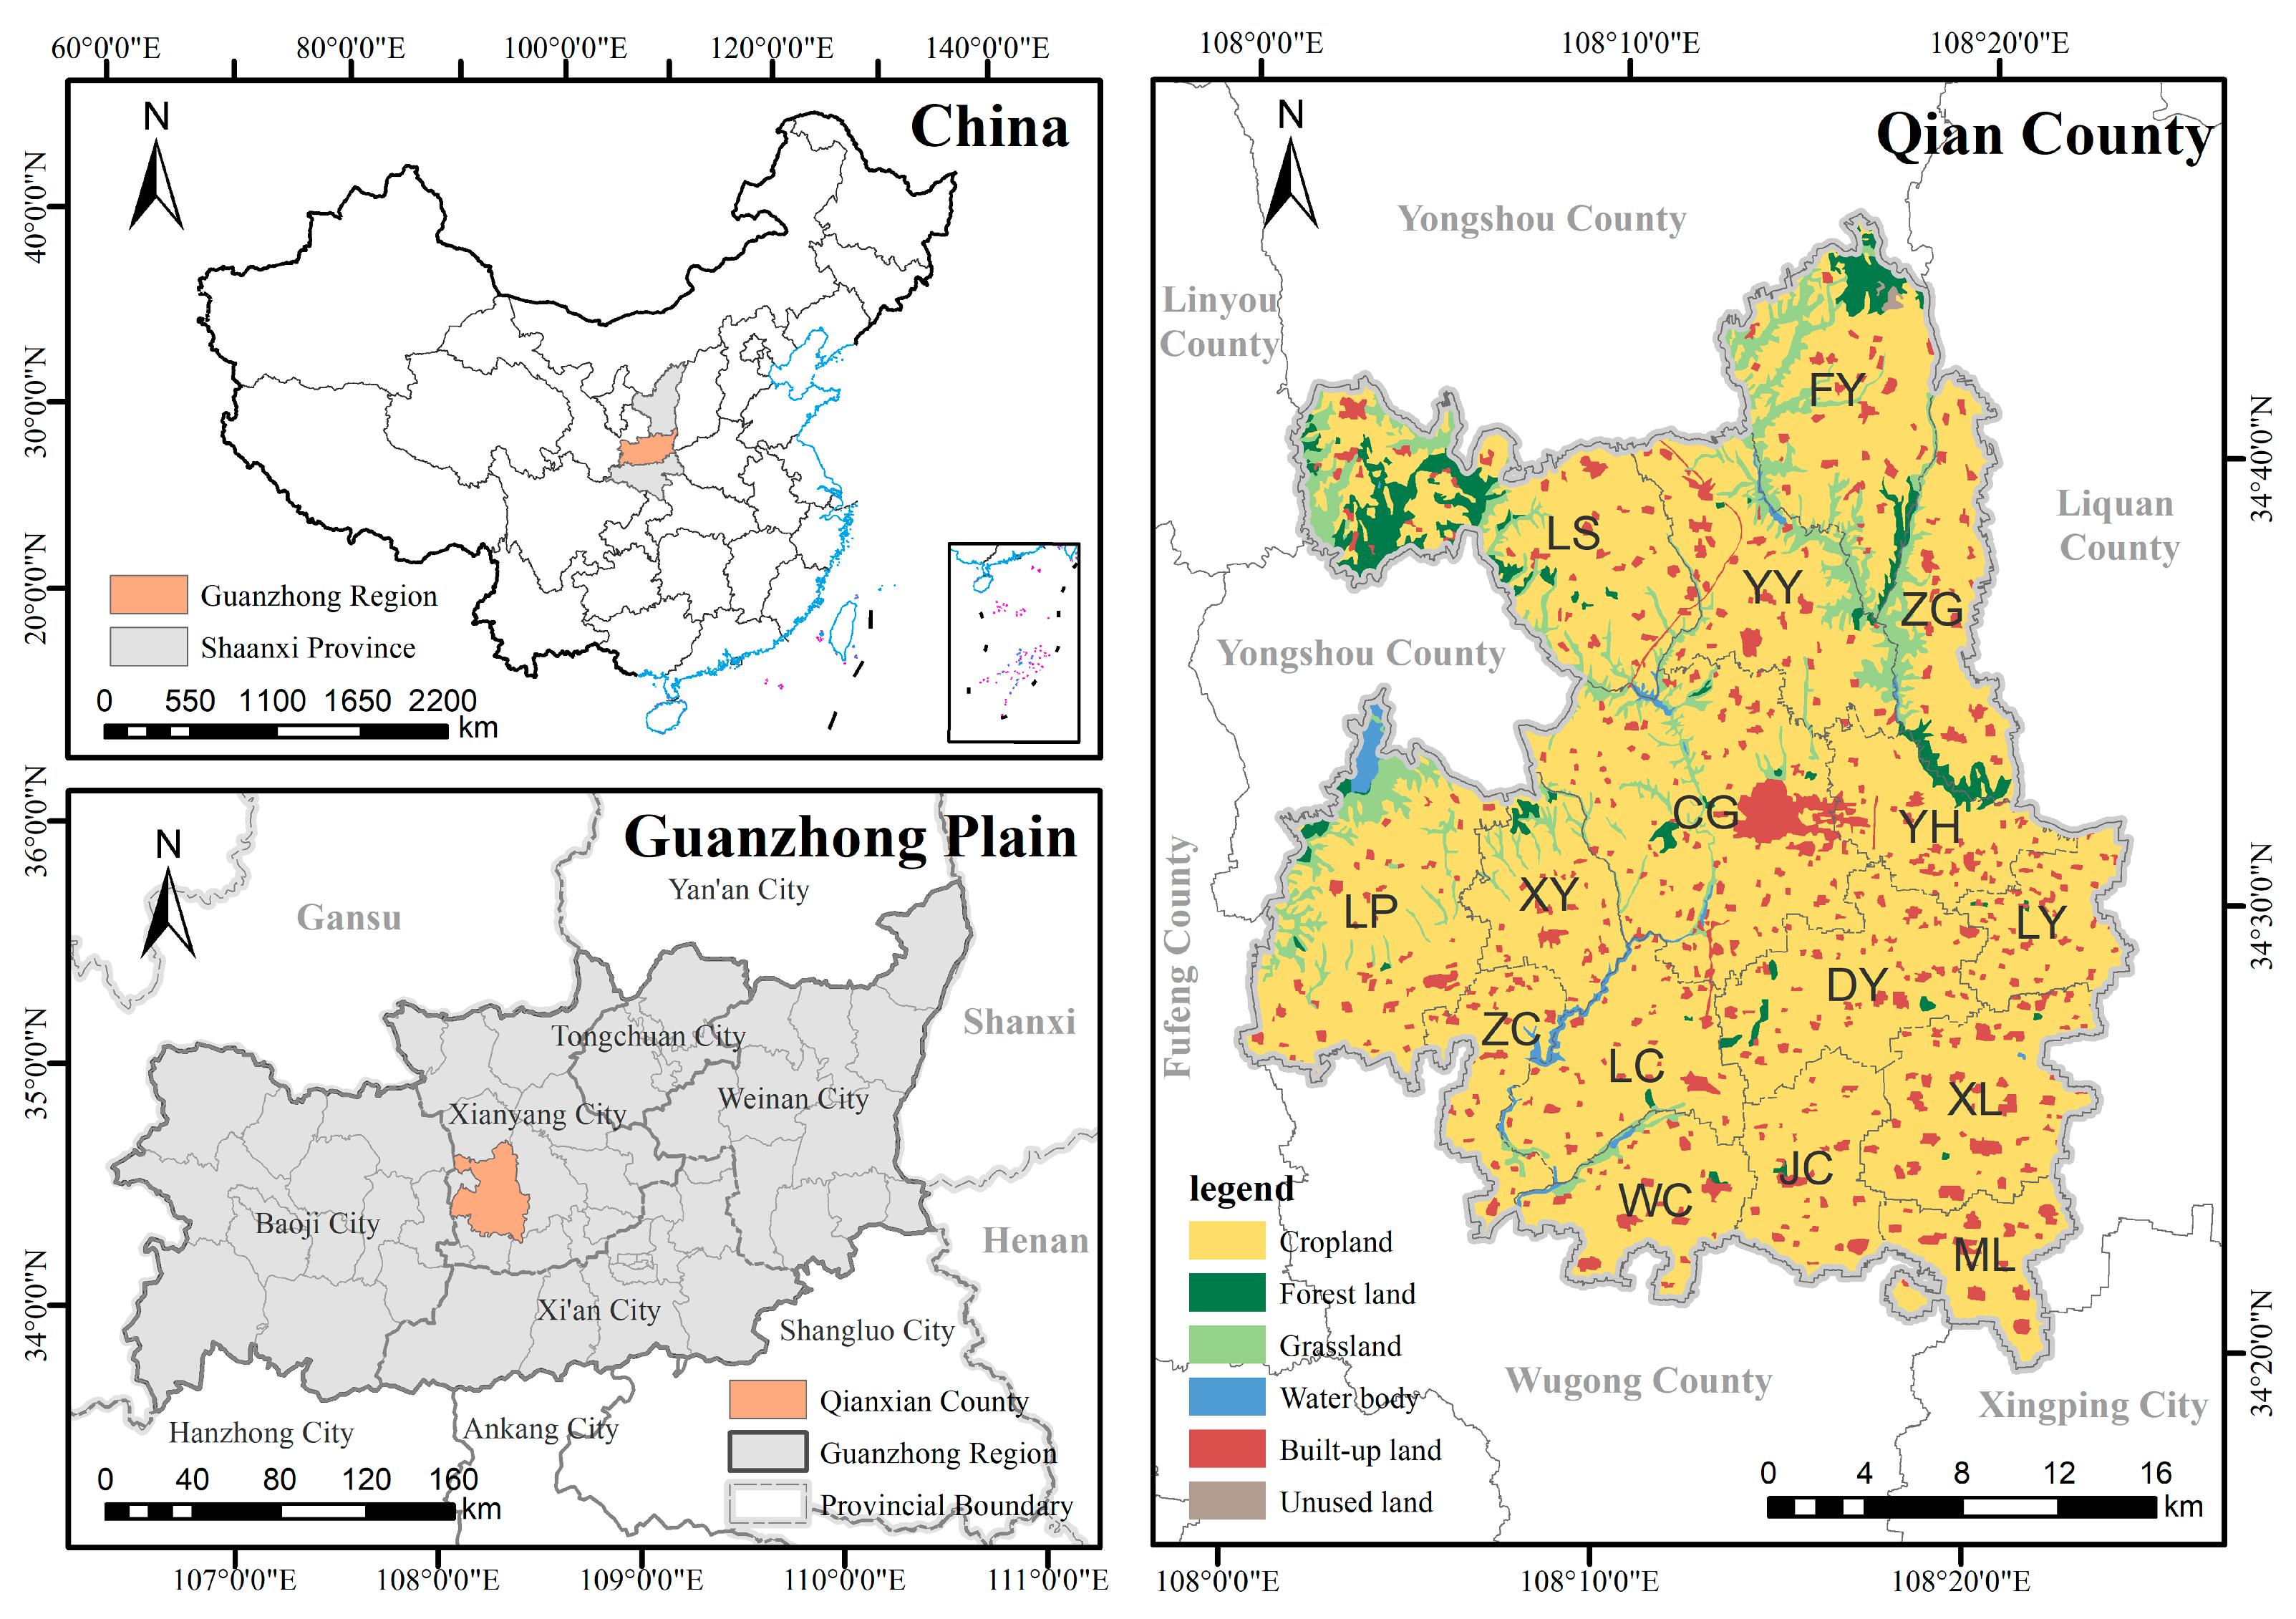
2.1. Study Area
2.2. Data Resources
3. Methodology
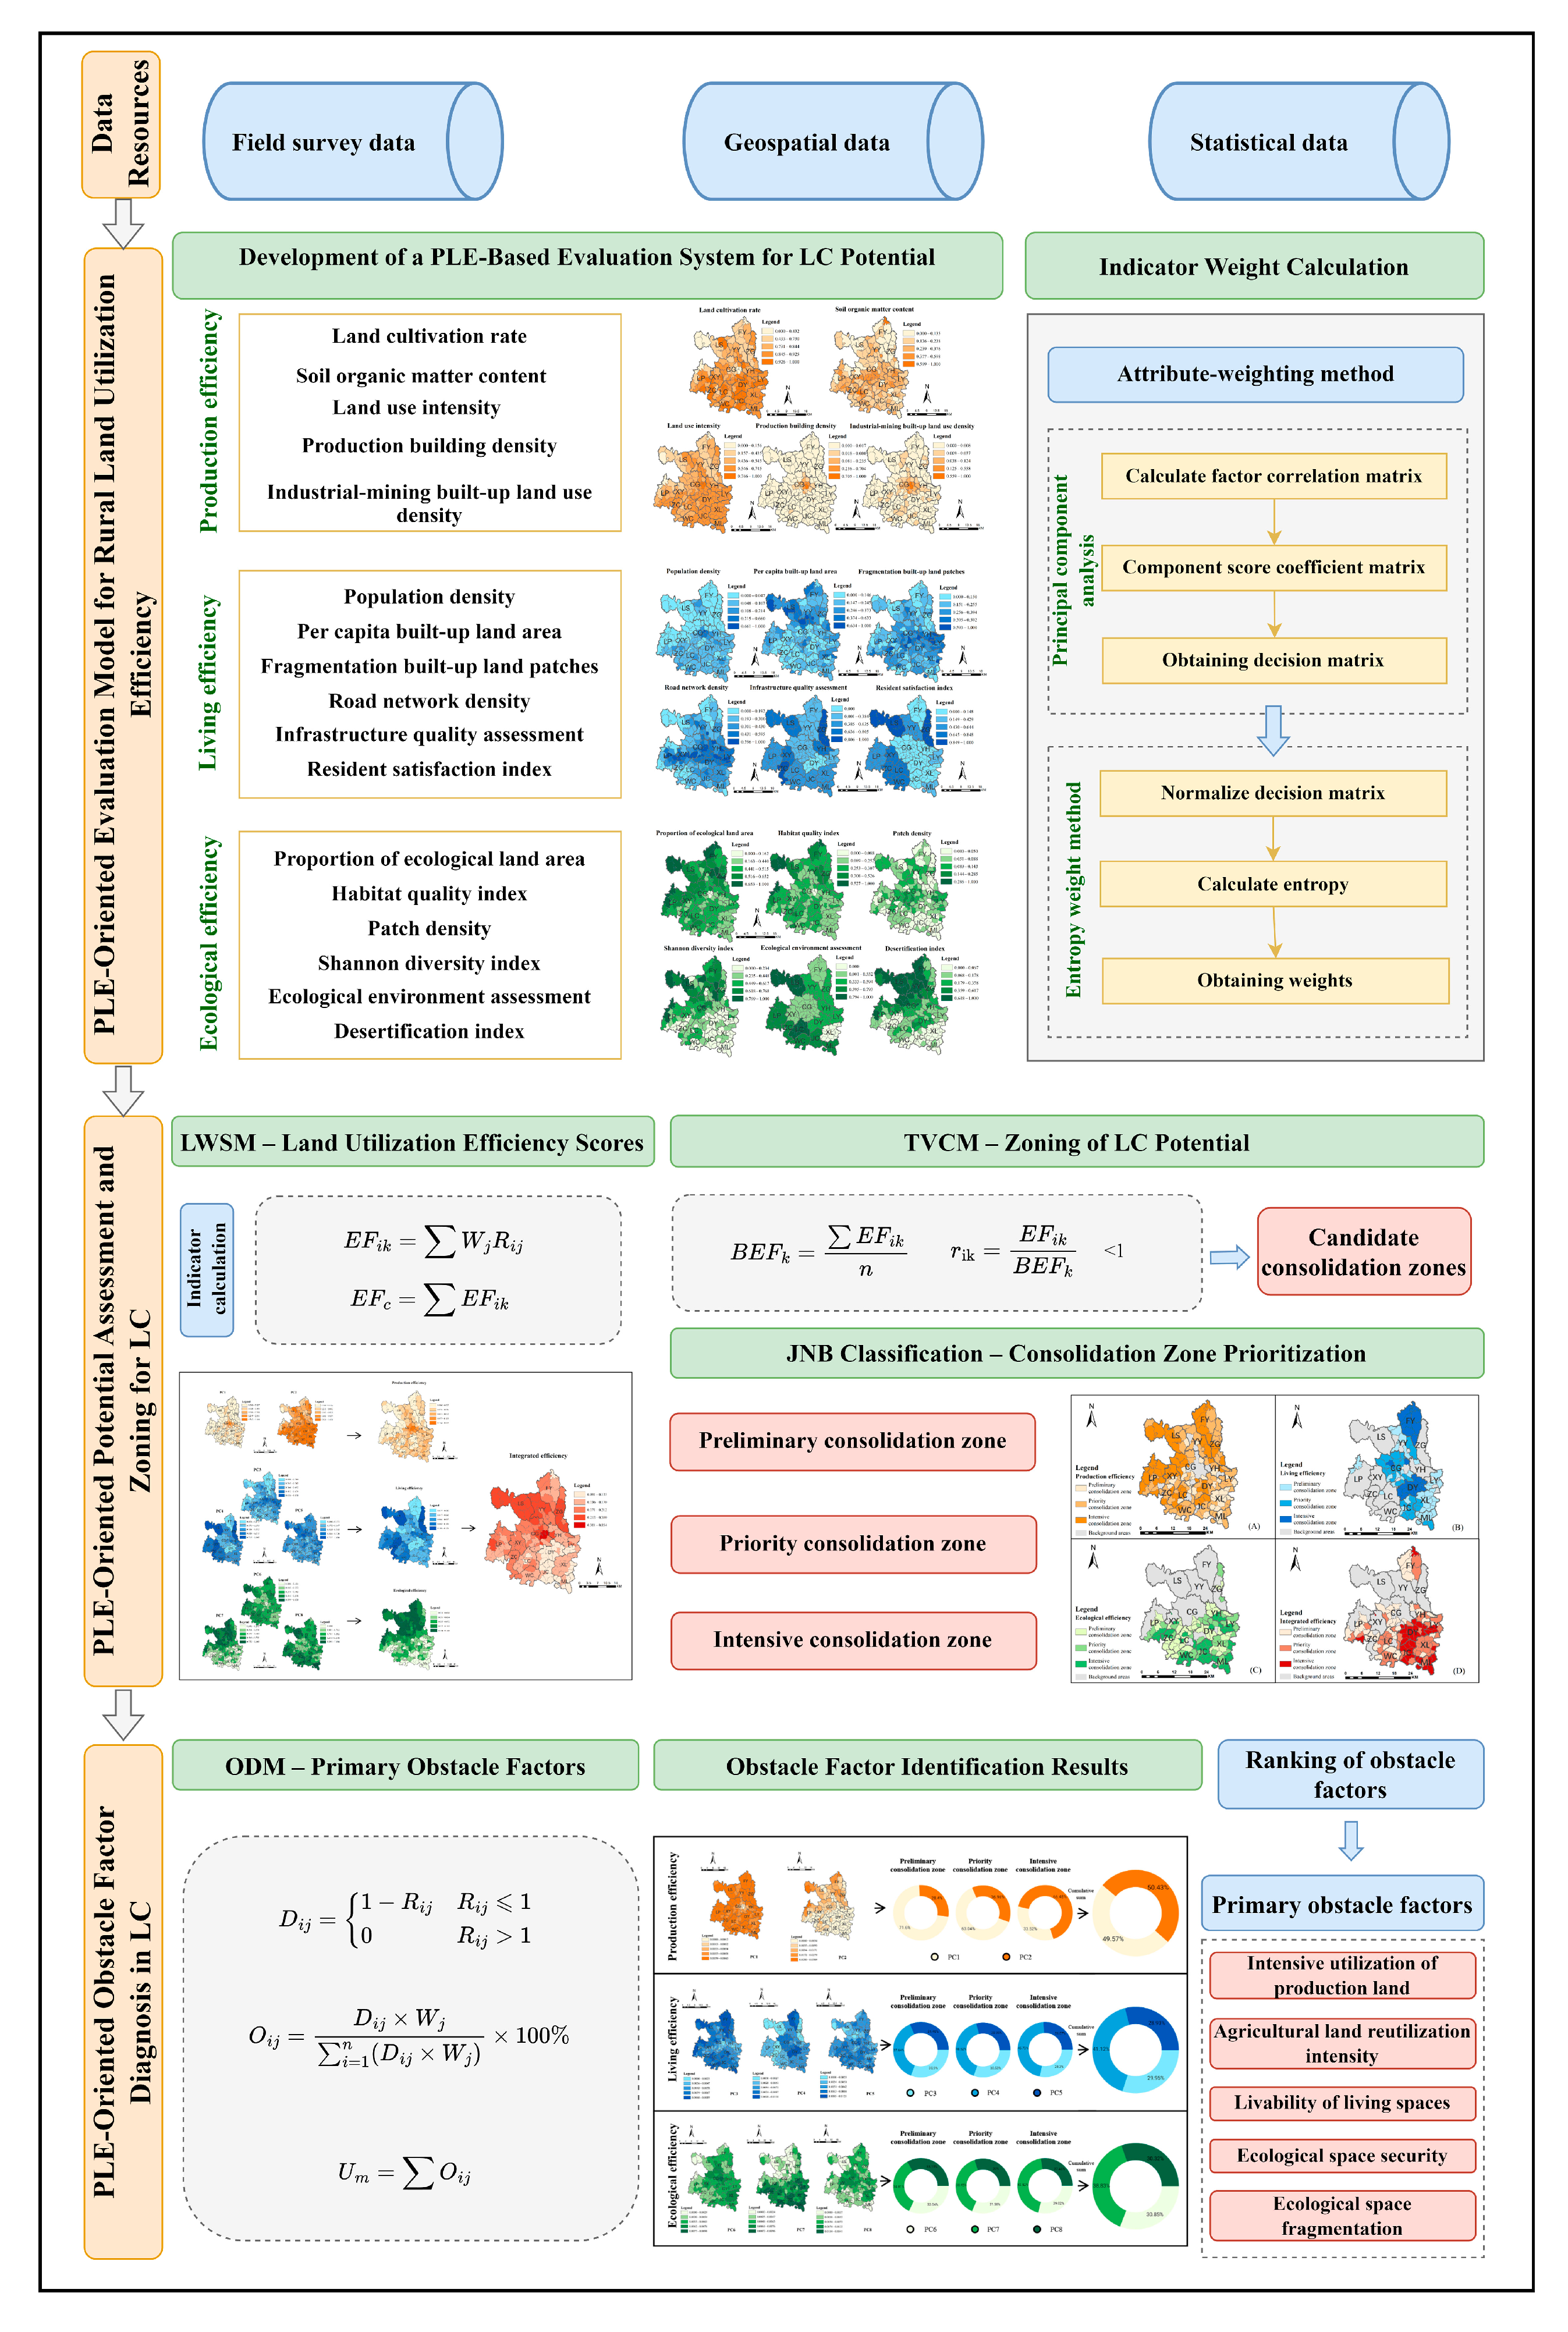
3.1. PLE-Oriented Evaluation Model for Rural Land Utilization Efficiency
3.1.1. Development of a PLE-Based Evaluation System for LC Potential
3.1.2. Indicator Weight Calculation
3.2. PLE-Oriented Potential Assessment and Zoning for LC
3.2.1. LWSM and TVCM
3.2.2. JNB Classification
3.3. PLE-Oriented Obstacle Factor Diagnosis in LC
4. Results
4.1. Results of the PLE Utilization Efficiency Evaluation
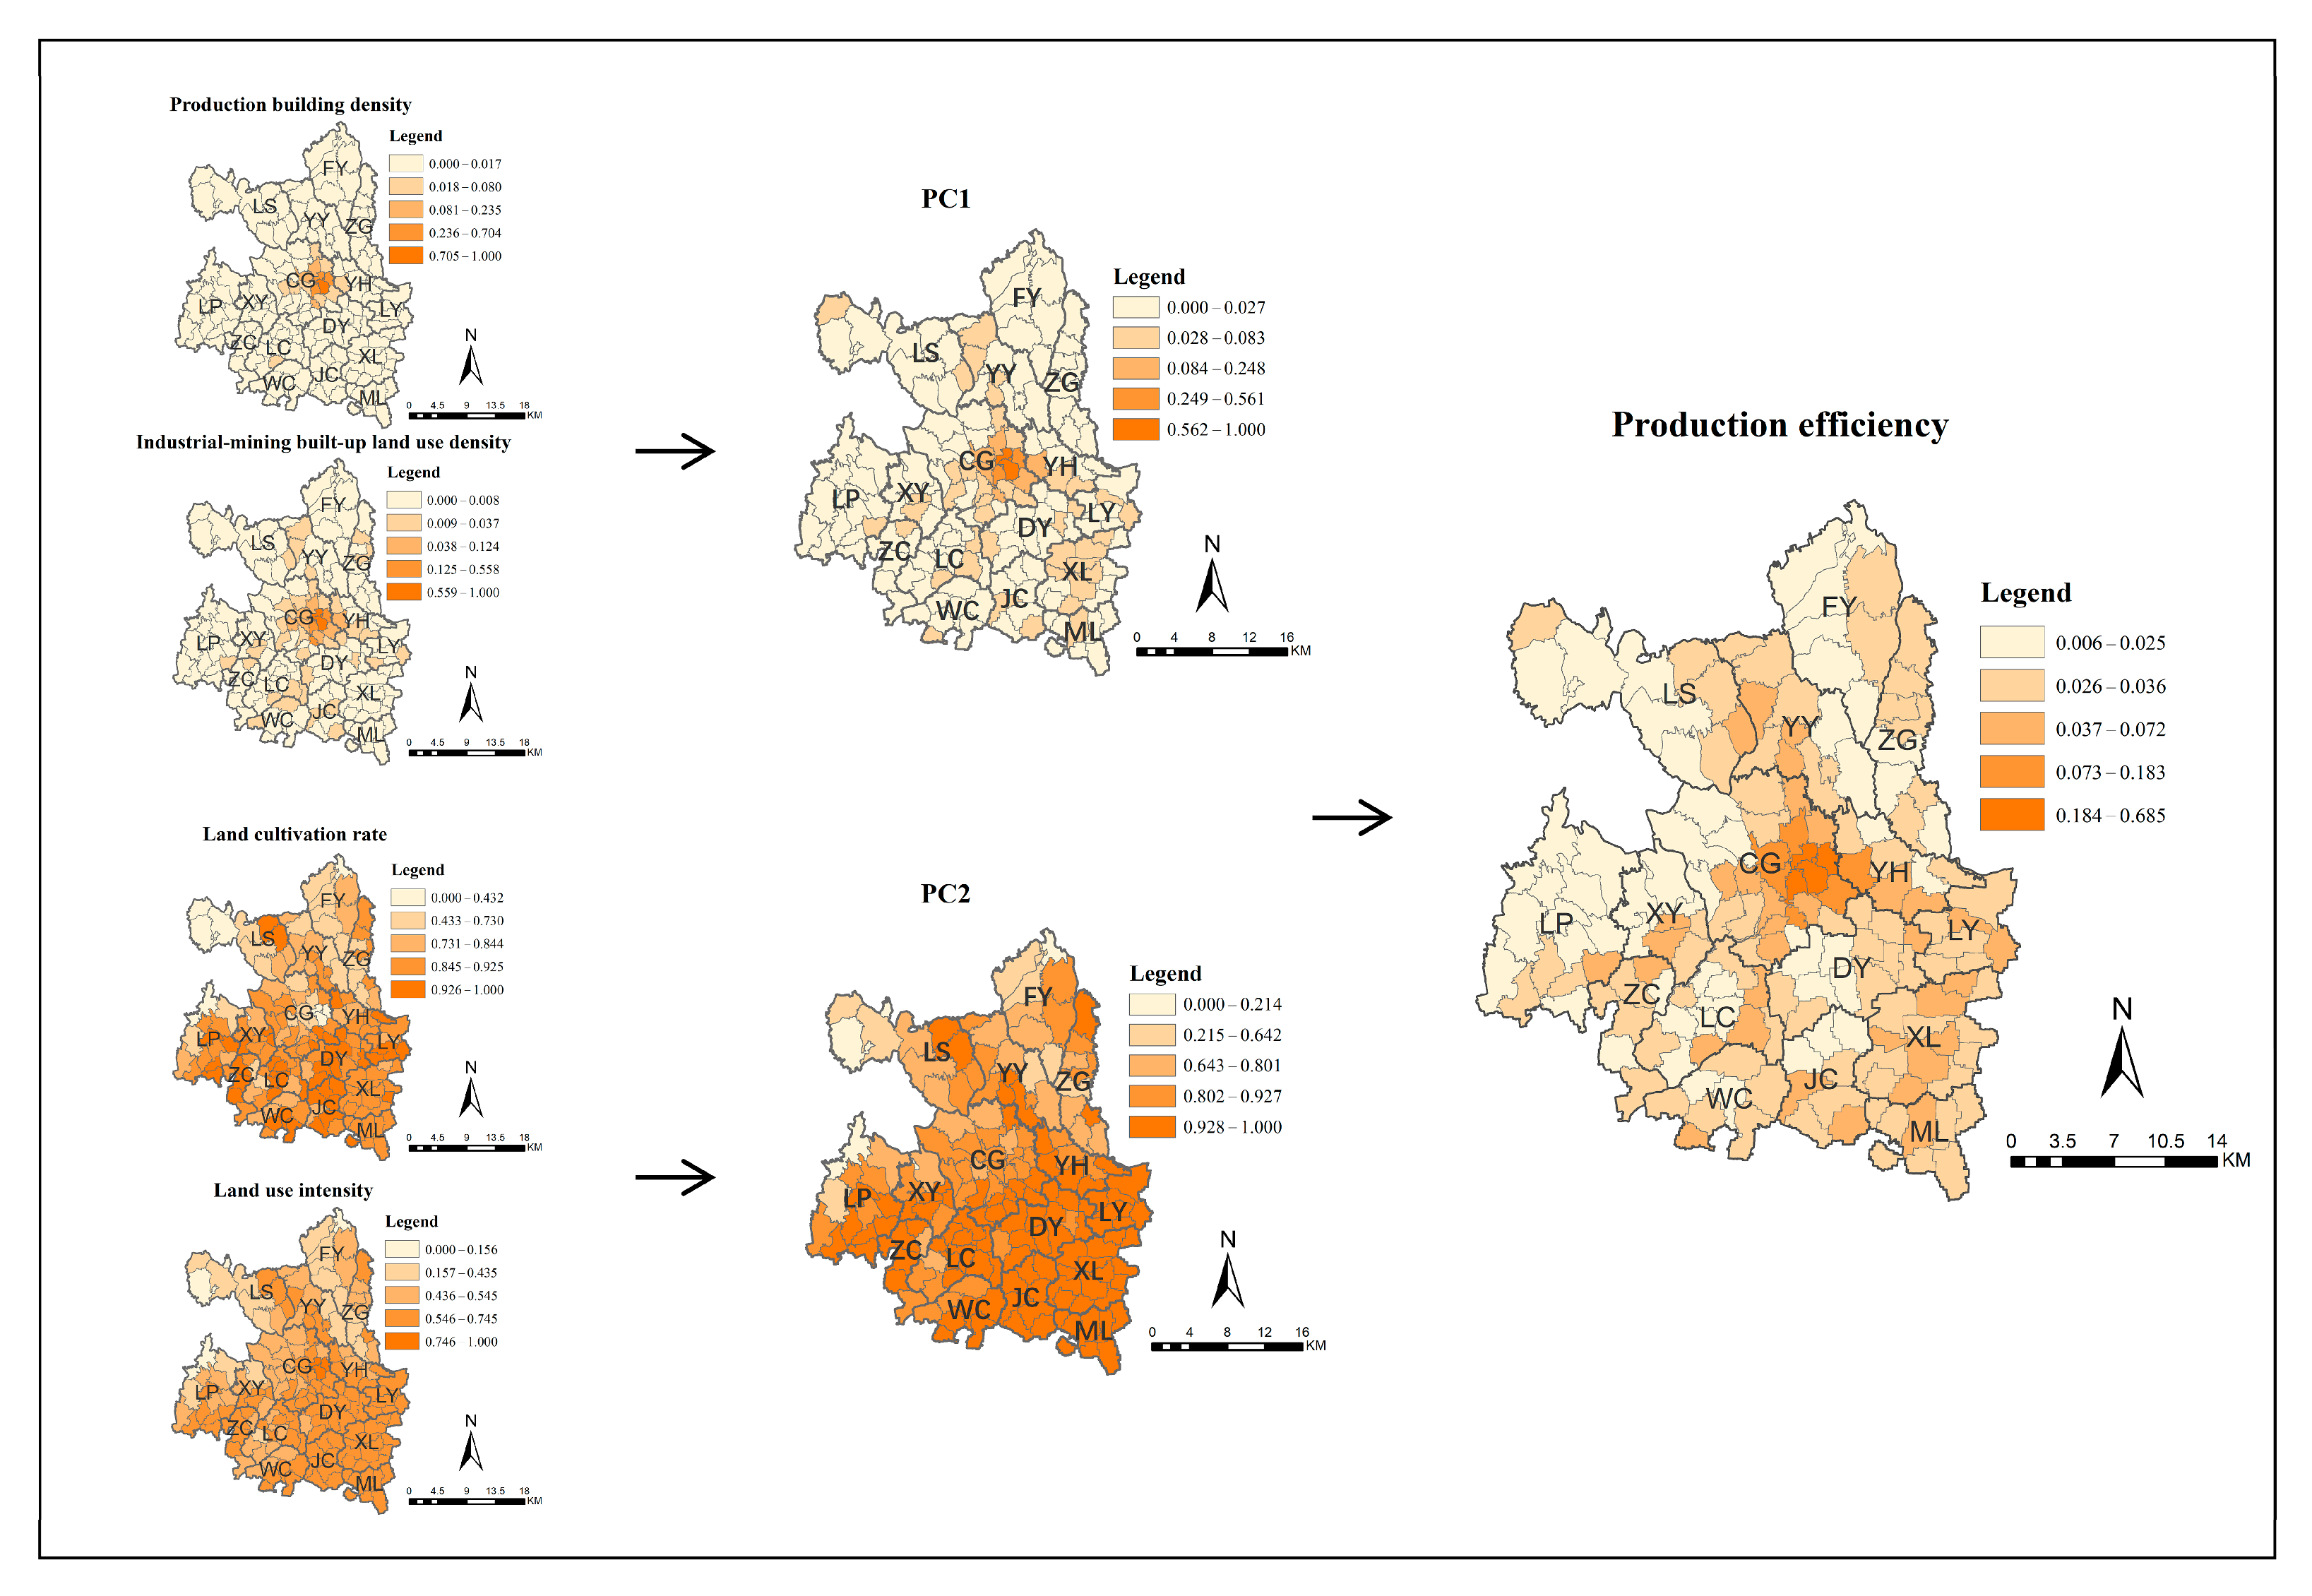
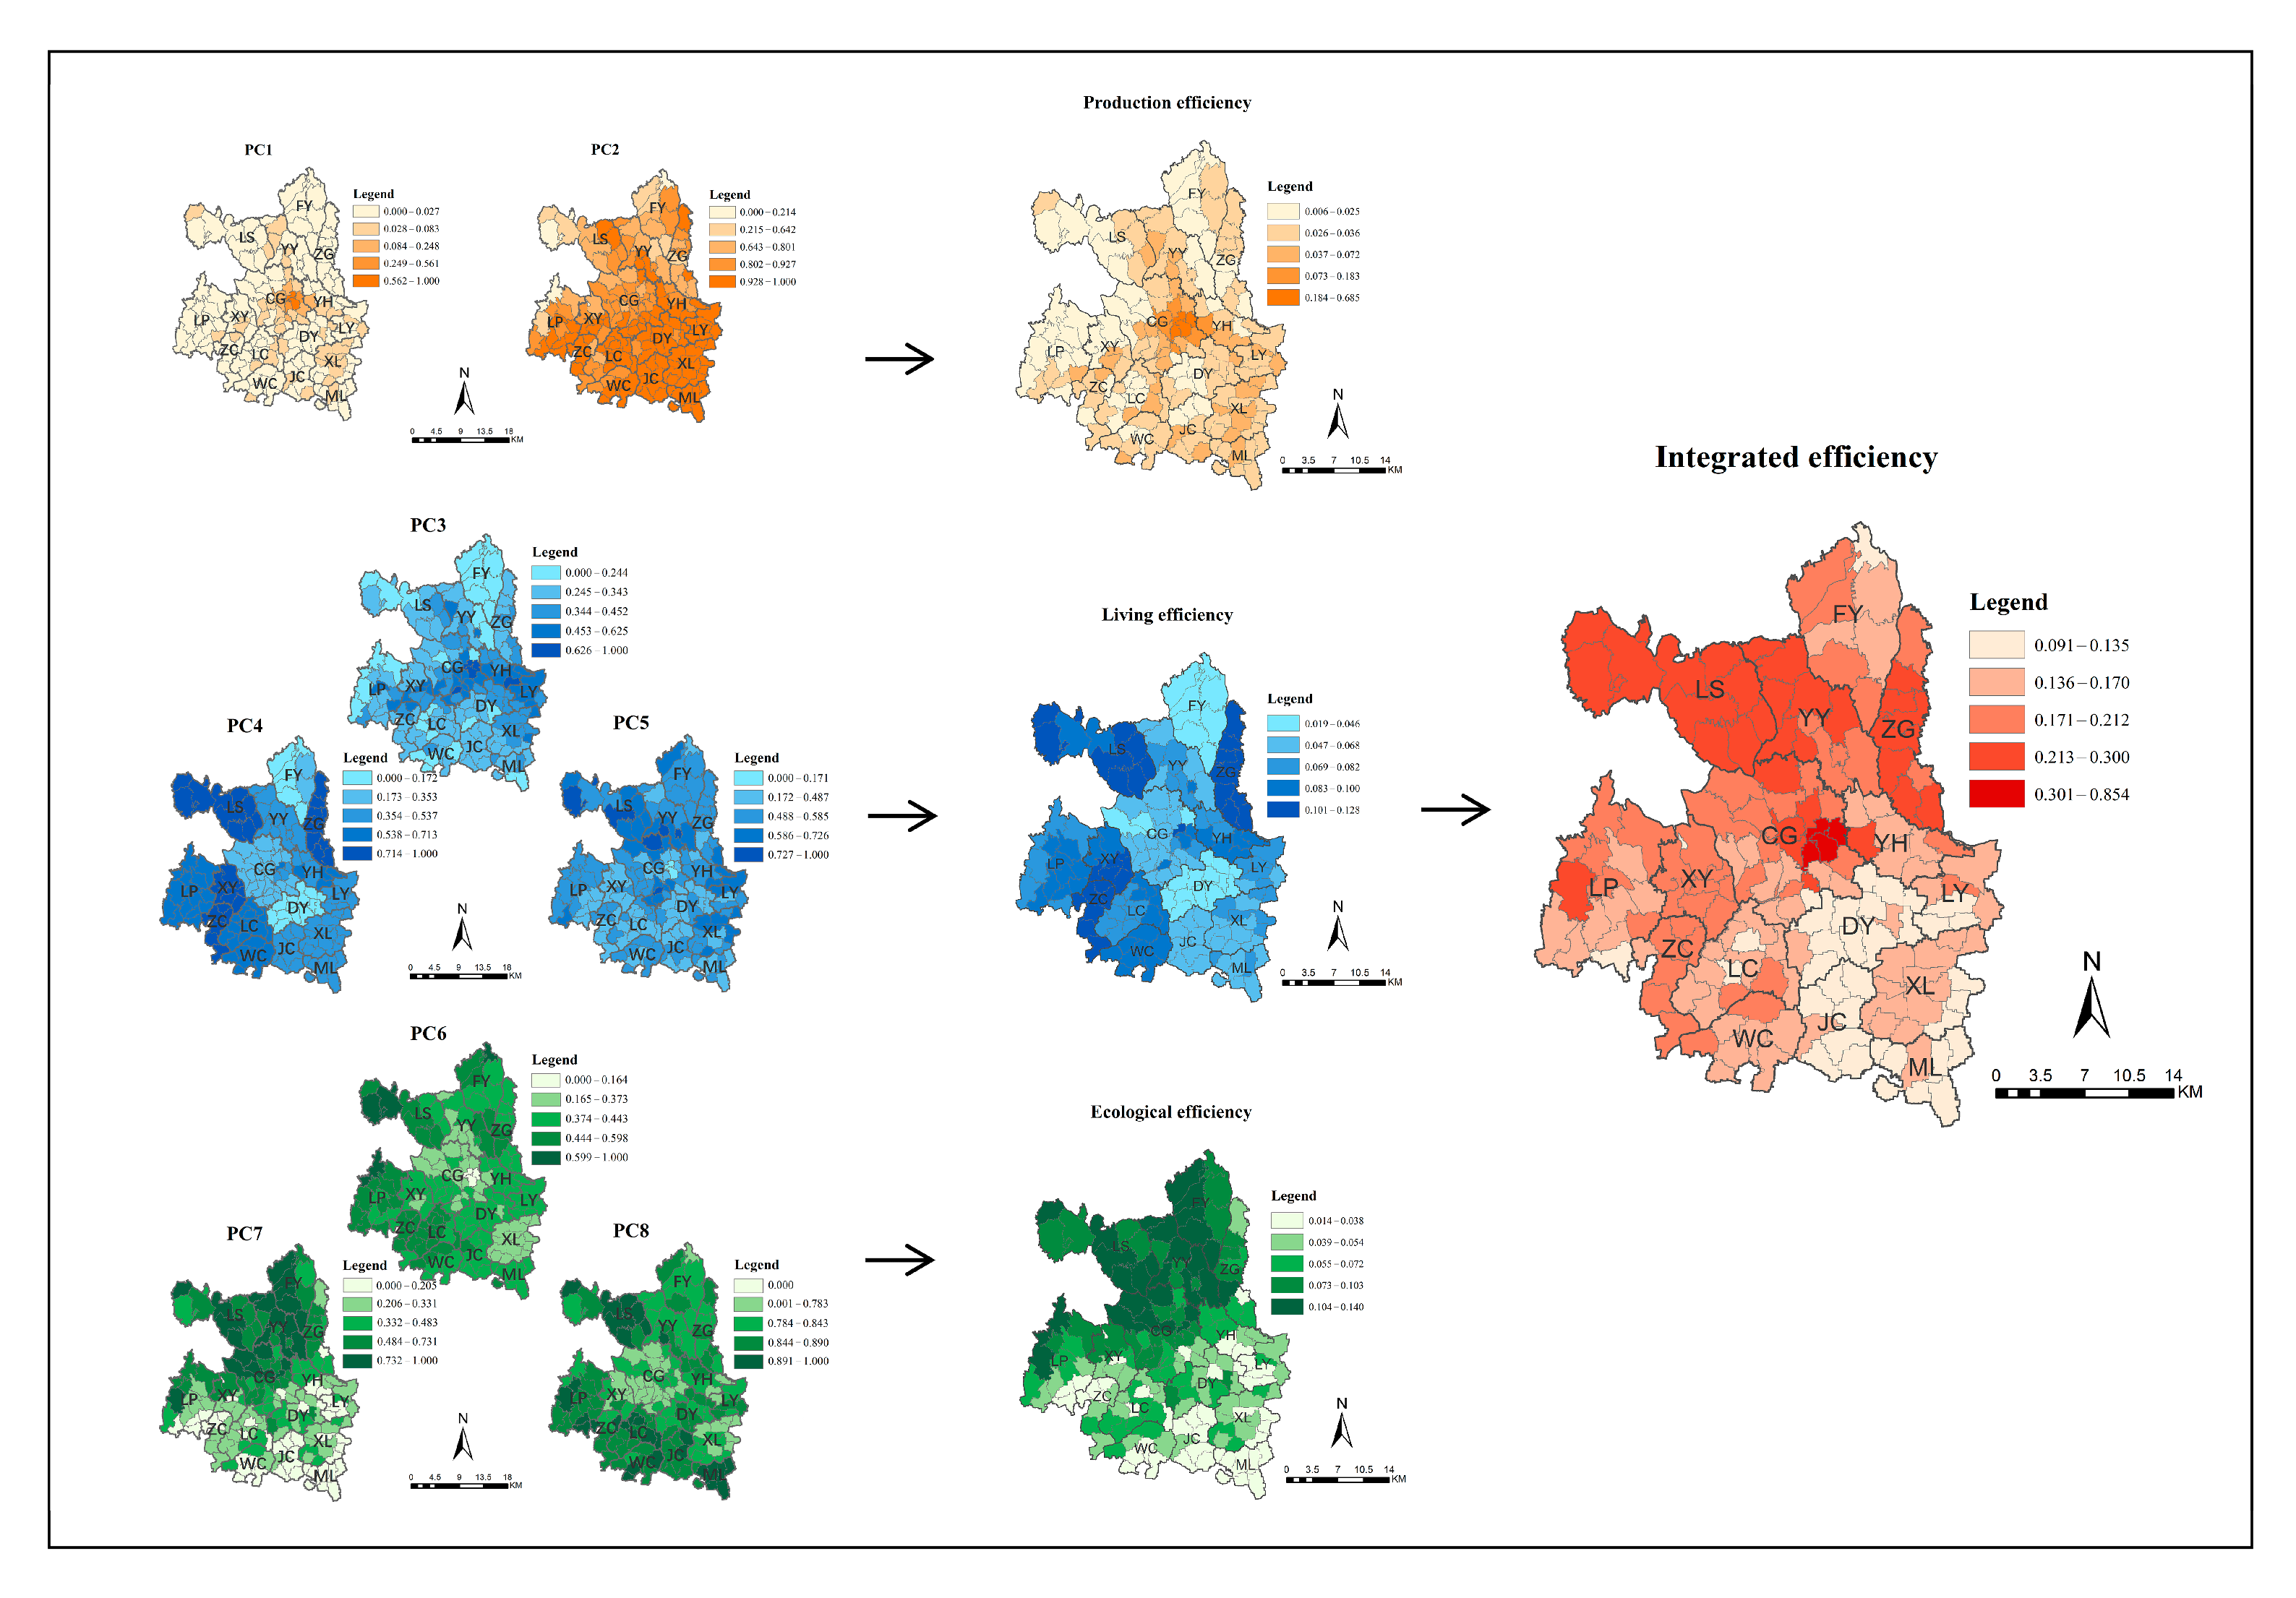
- The comprehensive evaluation index of production space utilization efficiency ranges from 0.006 to 0.685, indicating a relatively large span. It exhibits significant spatial heterogeneity, forming a pattern characterized by high values in the central area that gradually decrease outward. The highest and moderately high production efficiency zones are mainly concentrated in the western villages of the CG Subdistrict in central Qian County. At the same time, most other areas fall into the low to moderately low categories. Specifically, the evaluation values of PC1 (land use intensity of production land) show a spatial pattern largely consistent with the overall production efficiency distribution. This is because GG is the political, economic, and cultural center of Qian County, where production-related construction land is relatively extensive and exhibits a concentrated spatial layout in the area. In contrast, PC2 (intensity of agricultural land reuse) shows relatively small distribution differences across the county. Except for lower values observed in Zhoujiahe Village in the west and Yongjiu Village and Qian County Forest Farm in the north, most other areas fall within medium-high to high-value zones. This is mainly because these regions are predominantly mountainous or contain reservoirs, resulting in limited available agricultural land.
- The comprehensive evaluation index of living space utilization efficiency ranges from 0.019 to 0.128, with a relatively narrow value span and limited spatial variation. Overall, it shows higher values in the eastern and western regions, while remaining relatively low in the central area. The highest-value areas are primarily concentrated in villages located in LS, XY, and ZC towns in the western part of Qian County, and in ZG town in the east. In contrast, the lowest-value areas are mainly distributed in villages in FY town (north) and DY town (central region). Specifically, the evaluation values of PC3 (living space quality) show higher values in the central region and lower values in both the northern and southern areas, which is associated with denser road networks and higher fragmentation of built-up land in central areas. The evaluation values of PC4 (livability of living space) show a distribution pattern that is generally consistent with the overall living efficiency index, which is characterized by higher values in the eastern and western regions and lower values in the central area. This reflects the relatively better infrastructure and higher living standards found in the western and eastern villages and towns of Qian County. The evaluation values of PC5 (residential land use intensity) display considerable spatial variation across the county and show a marked advantage in the northern region, indicating a distinct north–south gradient. Most northern areas fall into the moderate to high range, while southern areas are predominantly in the moderate to low range. The highest values are observed in Yongjiu, Xianfeng, Qianling, Taiping, and Chenjiawa villages in the north, and Juzhou Village in the central region. The lowest values are concentrated in Huakou and Dongjie villages in the central region. This pattern is linked to the fact that northern areas are located on hilly and gully terrain with relatively lower population densities than the south, resulting in higher per capita built-up land area in the north. In contrast, the lowest evaluation values occur in areas with both limited built-up land area and higher population density, leading to lower efficiency.
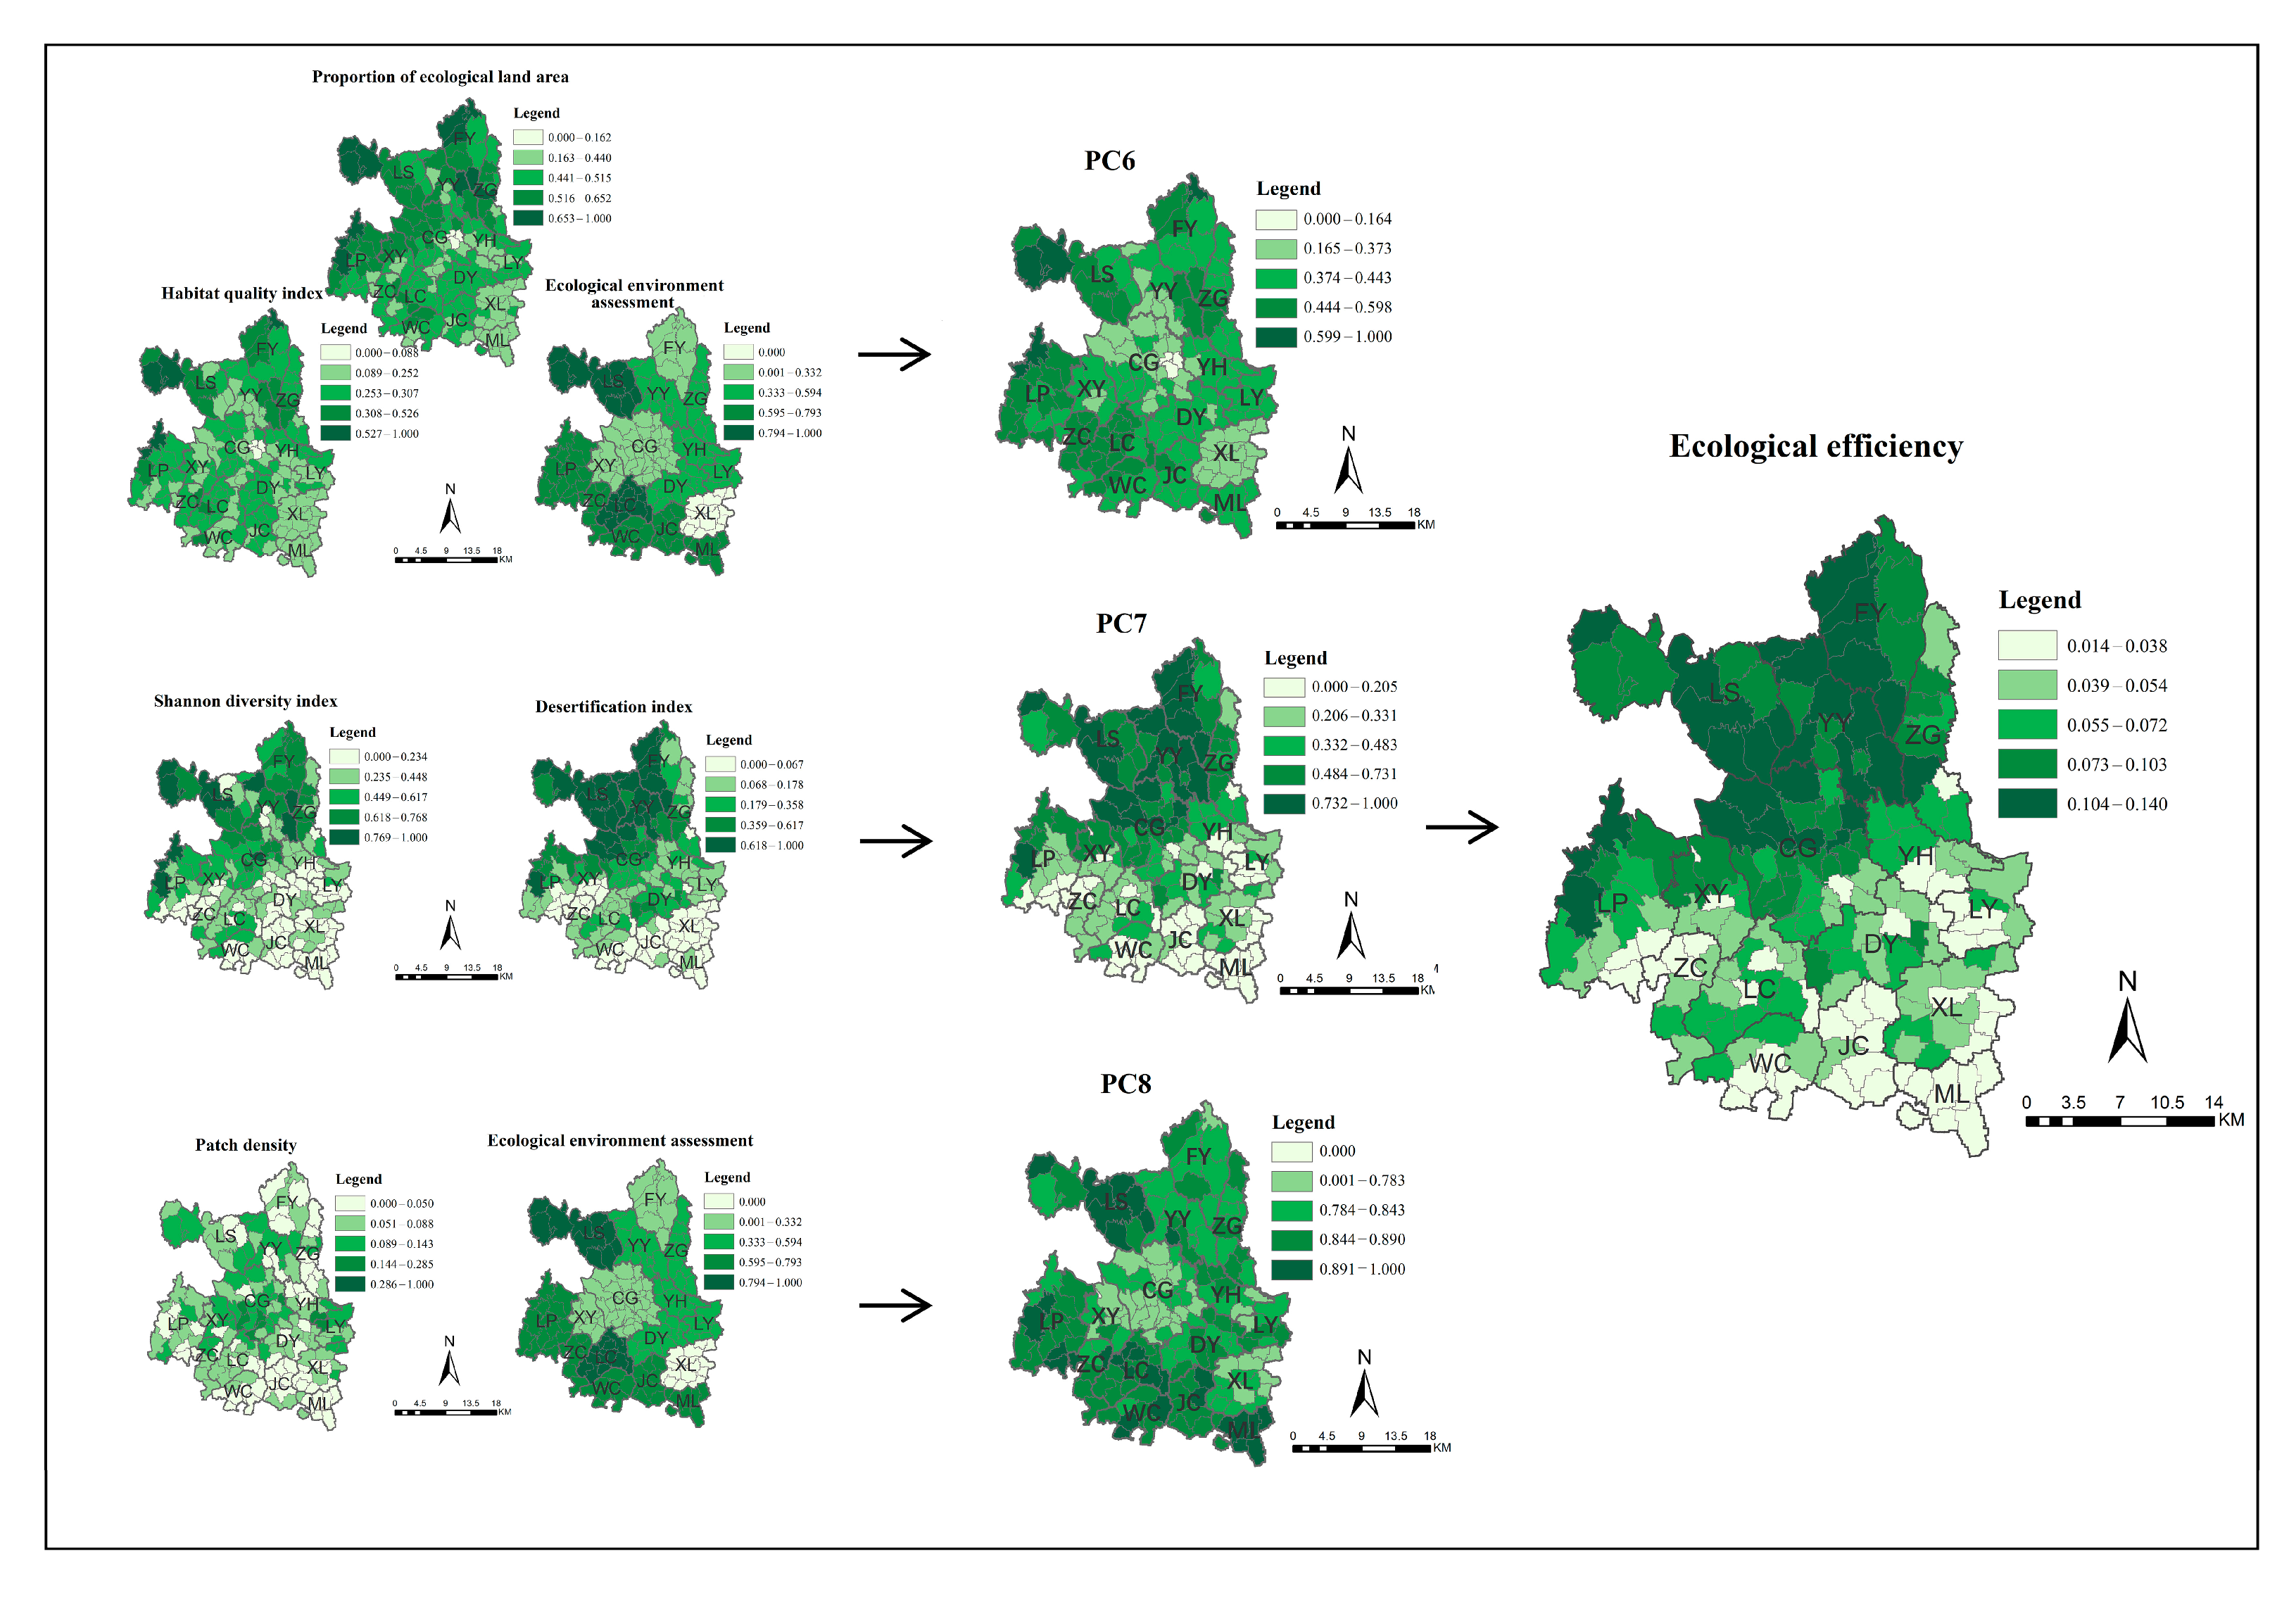
- The comprehensive evaluation index of ecological space utilization efficiency ranges from 0.014 to 0.140, with a relatively narrow value span and limited spatial variation. Overall, it shows a marked advantage in the northern region, indicating a distinct south–north gradient. The areas with the highest and moderately high ecological efficiency scores are primarily concentrated in the northern half of Qian County. In contrast, the lowest and moderately low scores are mostly found in the southern half. PC6 (ecological foundation quality) demonstrates relatively limited variation across the county. Most areas fall into the moderate to high-value range, except for lower scores observed in YY Town in the north, CG Town and Zhongxiang Village in the central area, XL Town in the south, and Sangguan and Sanxing villages in the west. This is largely attributed to the smaller proportions of ecological land types, such as forests, grasslands, and water bodies, in those areas. PC7 (ecological space security) shows a clear spatial trend similar to the composite ecological efficiency score, with higher values in the north and lower values in the south. This reflects higher levels of human disturbance, lower vegetation coverage, and greater land degradation in southern regions. PC8 (ecological space fragmentation) also shows limited spatial variation. Most areas fall into the moderate to high-value range, except for relatively low values observed in XY and CG towns in the central region; XL Town and the villages of Yangzhuang, Tuanjie, and Fengxing in the east; and the Qian County Forest Farm in the north. These areas are characterized by higher ecological fragmentation, which has negatively impacted the local ecological environment.
- The comprehensive evaluation index of integrated space utilization efficiency ranges from 0.091 to 0.854, indicating a relatively wide value span and significant spatial heterogeneity. Overall, it shows a clear trend of higher values in the northern region and lower values in the south, reflecting the integrated spatial characteristics of production, living, and ecological efficiency. Areas with the highest consolidation potential are concentrated in the CG Subdistrict in central Qian County, which aligns with the high-value cluster observed in the production efficiency evaluation. Moderately high values are mainly found in the northern towns of LS and ZG, consistent with the high-value areas of living space utilization efficiency. Influenced by the spatial distribution pattern of ecological efficiency, the overall LC potential also demonstrates a north–south gradient, with higher values in the north. By contrast, the southern region of Qian County shows relatively low scores across all three functional dimensions, resulting in the clustering of low-value zones in this area.
4.2. Consolidation Potential and Zoning Results
- Production consolidation potential zones. A total of 155 villages were identified within the production consolidation potential zones, accounting for 88.57% of all villages in Qian County. These villages are predominantly distributed across most areas of the county, excluding the central GG region. According to the classification results, 34 villages (19.43%) fall into the preliminary consolidation zone (score range: 0.033–0.042), 70 villages (40.00%) into the priority consolidation zone (0.025–0.032), and 51 villages (29.14%) into the intensive consolidation zone (0.006–0.024). In terms of spatial distribution, preliminary consolidation zones are primarily clustered in XL Town in the southern part of Qian County, an area known for its high-quality Hongxiantao peach industry. Other preliminary zones are scattered across the southern and central regions, with a few found in the north. Priority consolidation zones are dispersed throughout the county but tend to be more concentrated in the north. Intensive consolidation zones are mainly concentrated in contiguous patches in the western and northern parts of the county, while also appearing sporadically in the central and southwestern regions. This pattern is associated with the high overlap of these areas with forest land, grassland, and water bodies, as well as the relatively low proportion of cultivated land and residential construction land, combined with a high degree of land fragmentation.
- Living consolidation potential zones. A total of 88 villages were identified within the living consolidation potential zones, accounting for 50.29% of all villages in Qian County. These villages are primarily distributed in the northern, central, and southeastern parts of the county. Specifically, 36 villages (20.57%) were classified as preliminary consolidation zones (score range: 0.064–0.075), mostly clustered in XL and ML towns in the southern part of Qian County, LY Town in the east, and YY Town in the north. A total of 29 villages (16.57%) were identified as priority consolidation zones (0.043–0.063), mainly located in JC Town in the south and CG Subdistrict in the central part of the county. Meanwhile, 23 villages (13.14%) were designated as intensive consolidation zones (0.019–0.042), predominantly located in FY Town in the northern part of Qian County and DY Town in the central part.
- Ecological consolidation potential zones. A total of 110 villages were identified within the ecological consolidation potential zones, accounting for 62.86% of all villages in Qian County. In terms of both quantity and spatial distribution, ecological efficiency in the northern rural areas of Qian County is significantly higher than in the central and southern regions. Specifically, 30 villages (17.14%) were identified as preliminary consolidation zones (score range: 0.050–0.064), primarily located in the central areas of LC, DY, and YH. Field investigations reveal that these areas suffer from severe soil erosion, which is largely attributed to low vegetation coverage, rugged and fragmented topography, uneven precipitation distribution, and loose soil texture. A total of 42 villages (24.00%) fall within the priority consolidation zone (0.036–0.049), sporadically distributed across the southern part of Qian County. Meanwhile, 38 villages (21.71%) were classified as intensive consolidation zones (0.014–0.035), mainly concentrated in the southern towns of ML, JC, WC, LY, and ZC. This region serves as a key grain-producing area for food security in Qian County. Despite its fertile soils and suitability for cultivation, long-term issues, such as the improper use of plastic mulch and fertilizers, as well as inadequate treatment of livestock and poultry waste, have led to serious non-point and point-source pollution problems in some cultivated lands.
- Integrated consolidation potential zones. A total of 111 villages were identified within the integrated consolidation potential zones, accounting for 64.16% of all villages in Qian County. These zones are mainly distributed across the southern half of the county and in FY Town in the north, indicating considerable spatial disparities in the integrated development of PLE functions between the central area and the northern and southern regions. Preliminary consolidation zones (score range: 0.158–0.181) include 36 villages (32.43%) and are primarily located in the western part of Qian County and FY Town in the north. Priority consolidation zones (0.129–0.158), comprising 43 villages (38.74%), are concentrated in the southern towns of LC, WC, and XL. Intensive consolidation zones (0.091–0.129), with 32 villages (28.83%), are clustered in the central and southeastern areas, with sporadic distribution in the west and north.
4.3. Obstacle Factor Identification Results
- Significant heterogeneity in obstacle factors is observed across different consolidation subzones within the production consolidation potential zones. In the preliminary and priority consolidation zone, the primary obstacle factor impeding the realization of consolidation potential is PC1, with cumulative obstacle degrees of 0.196 and 0.409, respectively. PC1 is predominantly characterized by high loadings on production building density and industrial-mining built-up land use density, with loading coefficients of 0.993 and 0.994. These variables reflect the spatial clustering of structures associated with secondary and tertiary industries. In contrast, the intensive consolidation zone is primarily constrained by PC2, with a cumulative obstacle degree of 0.597. PC2 is mainly associated with the land cultivation rate and land use intensity, bearing loading coefficients of 0.886 and 0.843. These findings underscore the detrimental impact of fragmented land use patterns on production efficiency.
- Significant consistency in obstacle factors is observed across different consolidation subzones within the living consolidation potential zones. In the preliminary consolidation zone, priority consolidation zone, and intensive consolidation zone, the primary obstacle factor constraining the realization of living consolidation potential is PC4, with cumulative obstacle degrees of 0.241, 0.223, and 0.246, respectively. PC4 is primarily characterized by high loadings on the infrastructure quality assessment and resident satisfaction index, with loading coefficients of 0.914 and 0.851, respectively. These variables capture the adverse effects of deficient infrastructure and low levels of resident well-being on the overall efficiency of living space. Field investigations indicate that the preliminary consolidation zone is significantly impacted by challenges, such as inadequate household waste management and lagging infrastructure development, particularly odor pollution resulting from the open-air dumping of domestic waste. In addition, villages in XY Town identified as part of the preliminary consolidation zone, along with rural settlements in central and northern Qian County designated as priority and intensive consolidation zones, are predominantly located in narrow valley corridors or on relatively flat marginal slopes of gullies within the loess hilly region. These areas commonly experience transportation constraints and suffer from critical shortages in infrastructure provision, including wastewater treatment facilities, gas supply systems, and healthcare services, which have become key barriers to the enhancement of living space efficiency.
- A high degree of consistency in obstacle factors is also evident across different consolidation subzones within the ecological consolidation potential zones. In the preliminary consolidation zone, priority consolidation zone, and intensive consolidation zone, the primary obstacle factor impeding the improvement of ecological consolidation potential is PC7, with cumulative obstacle degrees of 0.266, 0.218, and 0.321, respectively. PC7 is mainly defined by high loadings on the Shannon diversity index and the desertification index, with loading coefficients of 0.827 and 0.890, respectively. These variables reflect the negative impact of land use type diversity and land degradation levels on the overall efficiency of the ecological dimension.
- Notable differences in obstacle factors are observed across different consolidation subzones within the integrated consolidation potential zones. In the preliminary consolidation zone, the primary obstacle factor constraining the realization of integrated consolidation potential is PC8, with a cumulative obstacle degree of 0.241. In the priority consolidation zone, the primary obstacle factor is PC7, with a cumulative obstacle degree of 0.301. For the intensive consolidation zone, the primary obstacle factor is PC4, with a cumulative obstacle degree of 0.265. PC8 is primarily associated with patch density and ecological environment assessment, bearing loading coefficients of +0.896 and −0.578, respectively. After the normalization of negatively oriented indicators, these results reflect the adverse impacts of land use fragmentation and degraded ecological conditions on PLE spatial utilization efficiency.
5. Discussion
5.1. The Impact of the PLE Space Utilization Efficiency on the Potential and Zoning of LC
5.1.1. Impact of Production Efficiency on the Potential and Zoning of LC
5.1.2. Impact of Living Efficiency on the Potential and Zoning of LC
5.1.3. Impact of Ecological Efficiency on the Potential and Zoning of LC
5.2. Suggestions for the LC in Qian County
5.2.1. Measures to Enhance Production Space Utilization Efficiency
5.2.2. Measures to Enhance Living Space Utilization Efficiency
5.2.3. Measures to Enhance Ecological Space Utilization Efficiency
5.3. Limitations
6. Conclusions
Supplementary Materials
Author Contributions
Funding
Institutional Review Board Statement
Informed Consent Statement
Data Availability Statement
Conflicts of Interest
Abbreviations
| PLE | Production–Living–Ecological |
| LC | Land Consolidation |
| PCA | Principal Component Analysis |
| EWM | Entropy Weight Method |
| AWM | Attribute-Weighting Method |
| LWSM | Linear Weighted Sum Method |
| TVCM | Threshold-Verification Coefficient Method |
| JNB | Jenks Natural Breaks |
| ODM | Obstacle Degree Model |
Appendix A. Questionnaire Design and Results

Appendix B. Ecological Indicator Derivation


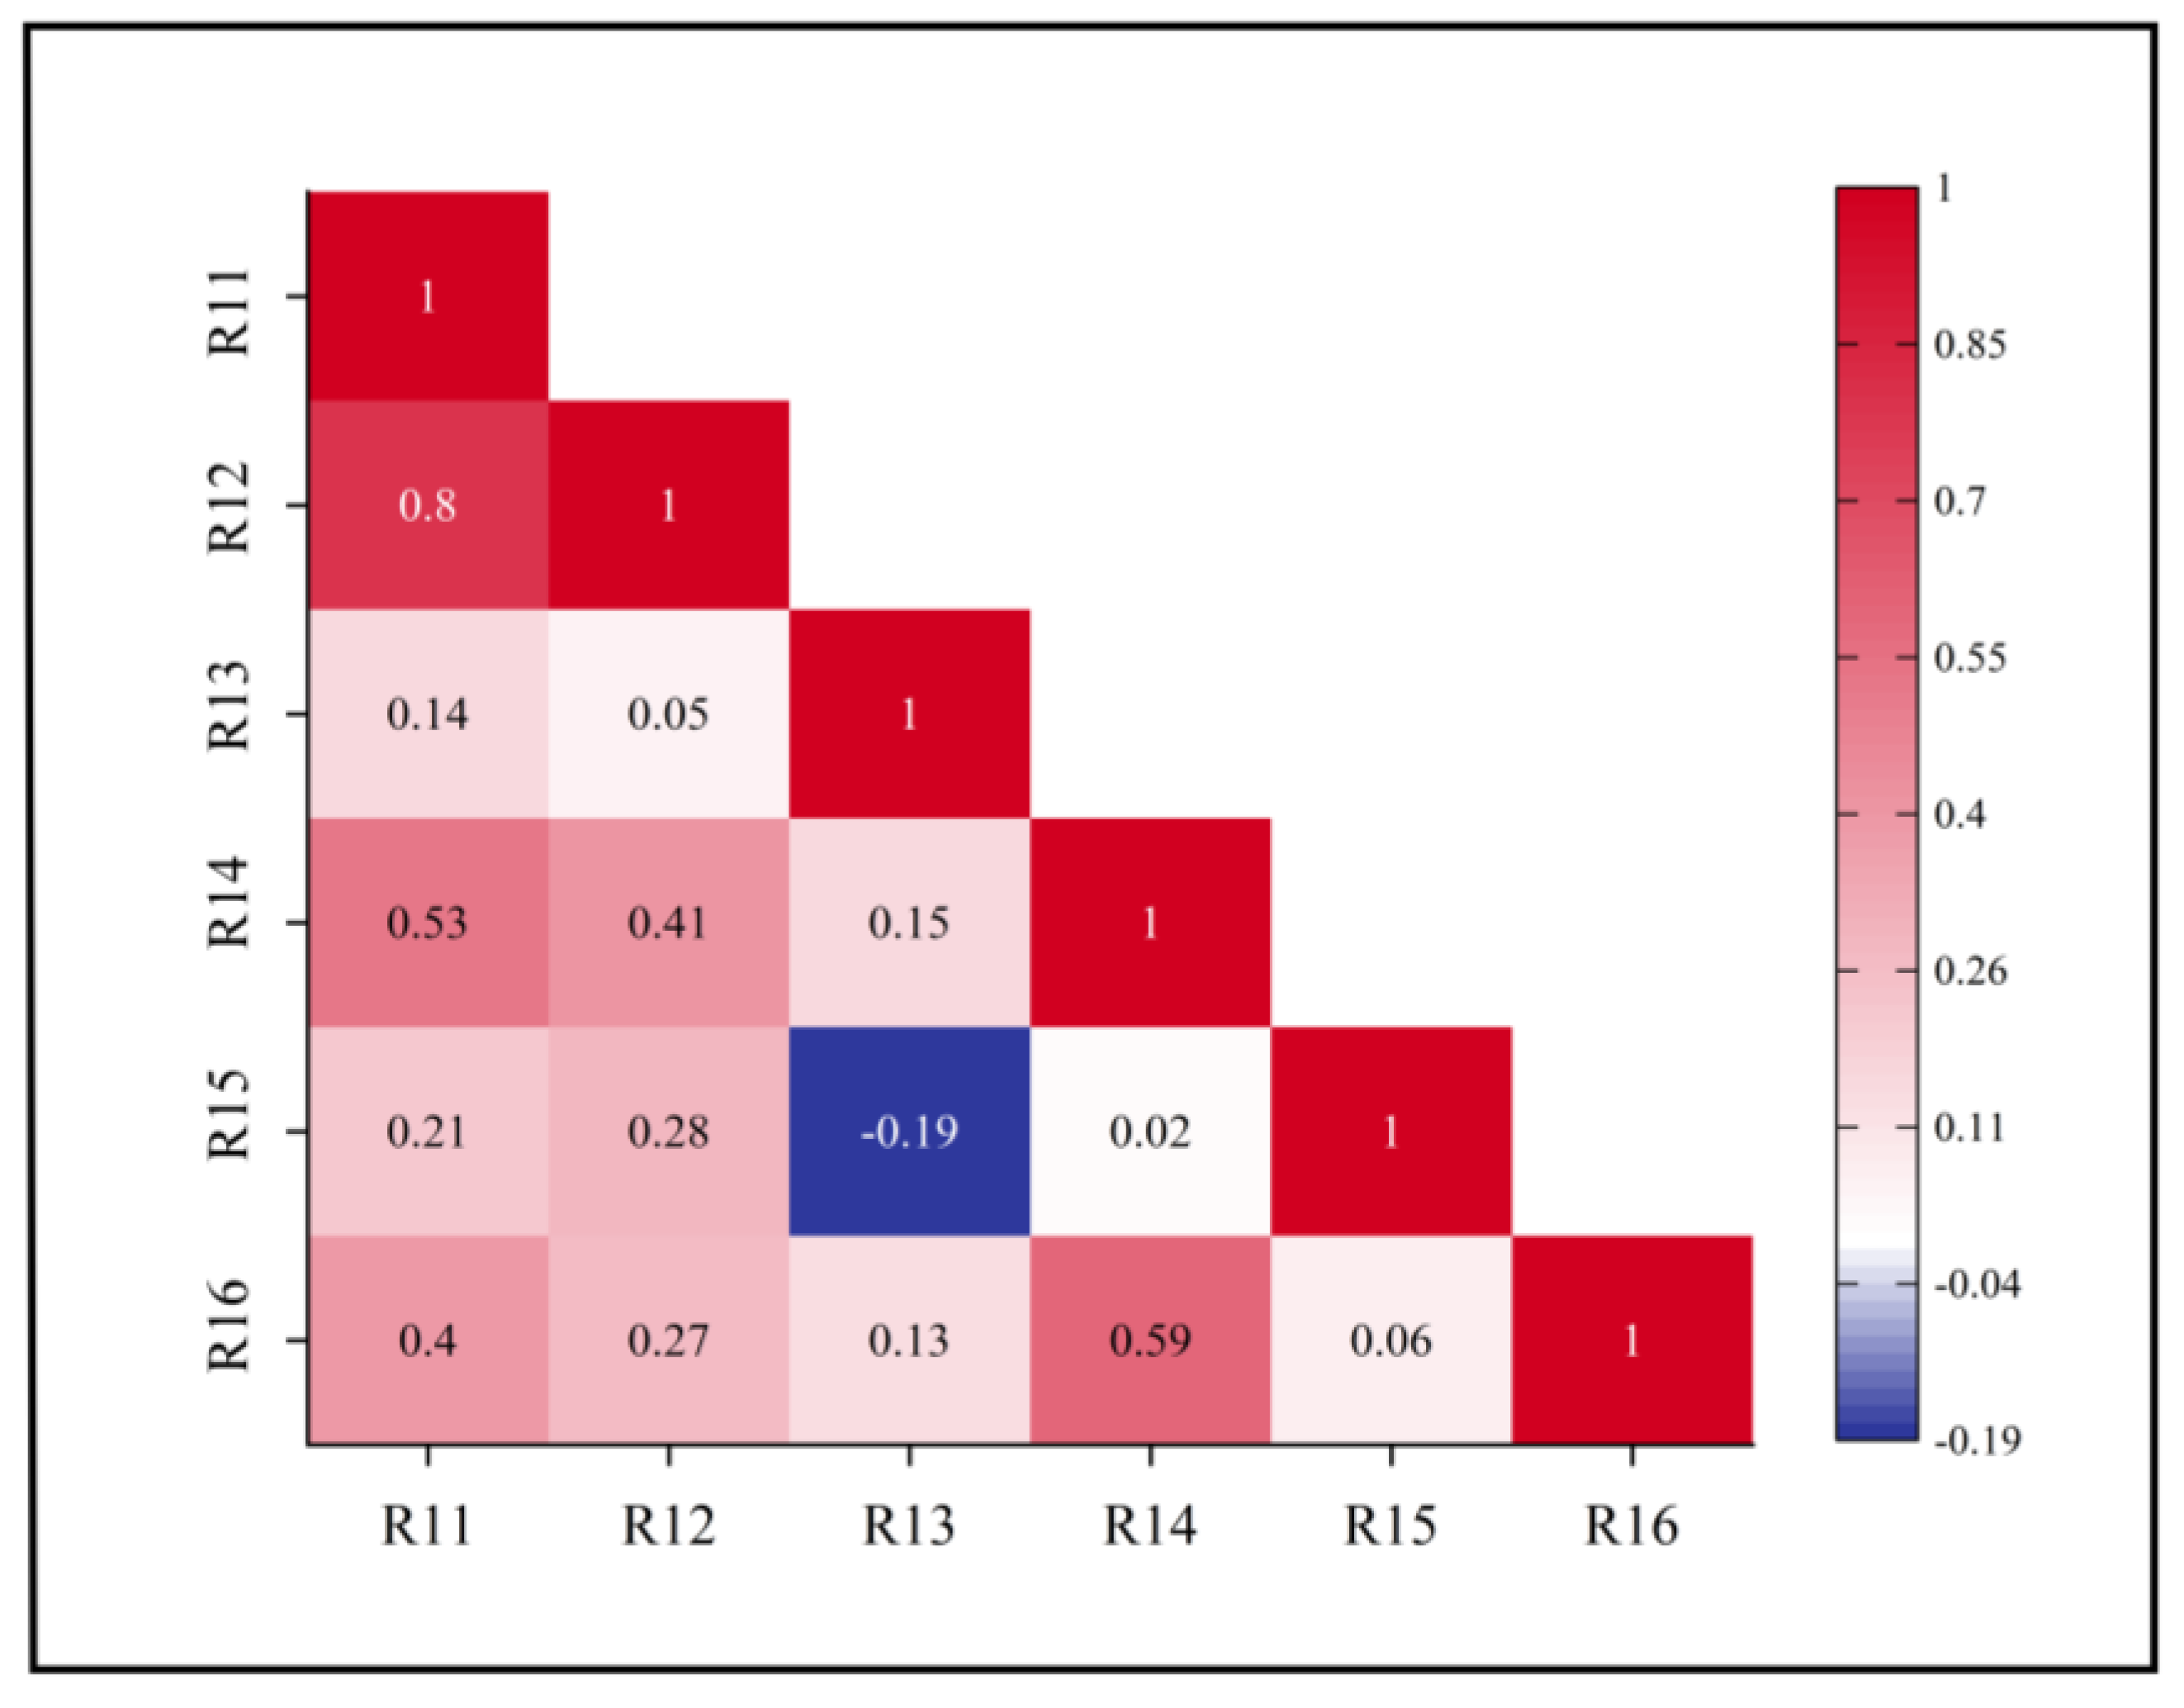
Appendix C. Indicator Correlation and PCA Results


| Variable | PC1 | PC2 |
|---|---|---|
| X1 | −0.178 | 0.595 |
| X2 | 0.199 | 0.560 |
| X3 | 0.417 | −0.019 |
| X4 | 0.418 | −0.011 |
| Variable | PC3 | PC4 | PC5 |
|---|---|---|---|
| X5 | 0.286 | 0.111 | −0.418 |
| X6 | 0.530 | 0.027 | 0.316 |
| X7 | 0.504 | 0.090 | −0.078 |
| X8 | 0.180 | 0.622 | 0.020 |
| X9 | −0.01 | 0.528 | −0.039 |
| Variable | PC6 | PC7 | PC8 |
|---|---|---|---|
| X11 | 0.434 | 0.014 | 0.111 |
| X12 | 0.524 | −0.125 | 0.048 |
| X13 | 0.348 | −0.178 | −0.453 |
| X14 | −0.062 | 0.520 | −0.008 |
| X15 | −0.210 | 0.642 | −0.130 |
Appendix D. Obstacle Factor Analysis
| Production Consolidation Potential Zones | Obstacle Factor Rankings | |
|---|---|---|
| 1 | 2 | |
| Preliminary consolidation zone | PC1 (0.196) | PC2 (0.078) |
| Priority consolidation zone | PC1 (0.409) | PC2 (0.240) |
| Intensive consolidation zone | PC2 (0.597) | PC1 (0.301) |
| Living Consolidation Potential Zones | Obstacle Factor Rankings | ||
|---|---|---|---|
| 1 | 2 | 3 | |
| Preliminary consolidation zone | PC4 (0.241) | PC5 (0.200) | PC3 (0.197) |
| Priority consolidation zone | PC4 (0.223) | PC3 (0.170) | PC5 (0.159) |
| Intensive consolidation zone | PC4 (0.246) | PC3 (0.151) | PC5 (0.141) |
| Ecological Consolidation Potential Zones | Obstacle Factor Rankings | ||
|---|---|---|---|
| 1 | 2 | 3 | |
| Preliminary consolidation zone | PC7 (0.266) | PC8 (0.254) | PC6 (0.243) |
| Priority consolidation zone | PC7 (0.218) | PC6 (0.179) | PC8 (0.171) |
| Intensive consolidation zone | PC7 (0.321) | PC6 (0.212) | PC8 (0.201) |
| Integrated Consolidation Potential Zones | Obstacle Factor Rankings | |||||||
|---|---|---|---|---|---|---|---|---|
| 1 | 2 | 3 | 4 | 5 | 6 | 7 | 8 | |
| Preliminary consolidation zone | PC8 (0.214) | PC4 (0.213) | PC1 (0.209) | PC3 (0.208) | PC6 (0.205) | PC7 (0.203) | PC5 (0.200) | PC2 (0.195) |
| Priority consolidation zone | PC7 (0.301) | PC4 (0.264) | PC5 (0.253) | PC3 (0.253) | PC6 (0.252) | PC1 (0.251) | PC8 (0.238) | PC2 (0.11) |
| Intensive consolidation zone | PC4 (0.265) | PC7 (0.248) | PC5 (0.199) | PC3 (0.191) | PC1 (0.188) | PC8 (0.183) | PC6 (0.177) | PC2 (0.117) |
References
- Lin, G.; Jiang, D.; Fu, J.Y.; Zhao, Y. A Review on the Overall Optimization of Production-Living-Ecological Space: Theoretical Basis and Conceptual Framework. Land 2022, 11, 345. [Google Scholar] [CrossRef]
- Zhao, T.Y.; Cheng, Y.N.; Fan, Y.Y.; Fan, X.N. Functional Tradeoffs and Feature Recognition of Rural Production-Living-Ecological Spaces. Land 2022, 11, 1103. [Google Scholar] [CrossRef]
- Ling, Z.Y.; Jiang, W.G.; Liao, C.M.; Li, Y.S.; Ling, Y.R.; Peng, K.F.; Deng, Y.W. Evaluation of Production-Living-Ecological Functions in Support of SDG Target 11.a: Case Study of the Guangxi Beibu Gulf Urban Agglomeration, China. Diversity 2022, 14, 469. [Google Scholar] [CrossRef]
- Zhang, R.J.; Yu, K.H.; Luo, P.P.; Chaplot, V. Spatio-Temporal Relationship between Land Use Carbon Emissions and Ecosystem Service Value in Guanzhong, China. Land 2024, 13, 118. [Google Scholar] [CrossRef]
- Chen, Y.T.; Li, Z.B.; Li, P.; Zhang, Y.X.; Liu, H.L.; Pan, J.J. Impacts and Projections of Land Use and Demographic Changes on Ecosystem Services: A Case Study in the Guanzhong Region, China. Sustainability 2022, 14, 3003. [Google Scholar] [CrossRef]
- Zhu, W.; Gu, S.G.; Jiang, R.; Zhang, X.; Hatano, R. Saline-Alkali Soil Reclamation Contributes to Soil Health Improvement in China. Agriculture 2024, 14, 1210. [Google Scholar] [CrossRef]
- Li, W.; Liu, Y.J.; Yang, Z.F. Preliminary Strategic Environmental Assessment of the Great Western Development Strategy: Safeguarding Ecological Security for a New Western China. Environ. Manag. 2012, 49, 483–501. [Google Scholar] [CrossRef]
- Ye, H.; Song, Y.Y.; Xue, D.Q. Multi-Scenario Simulation of Land Use and Habitat Quality in the Guanzhong Plain Urban Agglomeration, China. Int. J. Environ. Res. Public Health 2022, 19, 8703. [Google Scholar] [CrossRef]
- Görg, C.; Plank, C.; Wiedenhofer, D.; Mayer, A.; Pichler, M.; Schaffartzik, A.; Krausmann, F. Scrutinizing the Great Acceleration: The Anthropocene and its analytic challenges for social-ecological transformations. Anthr. Rev. 2020, 7, 2053019619895034. [Google Scholar] [CrossRef]
- Lawrence, M.; Homer-Dixon, T.; Janzwood, S.; Rockstöm, J.; Renn, O.; Donges, J.F.J.G.S. Global polycrisis: The causal mechanisms of crisis entanglement. Glob. Sustain. 2024, 7, e6. [Google Scholar] [CrossRef]
- Rockström, J.; Kotzé, L.; Milutinovic, S.; Biermann, F.; Brovkin, V.; Donges, J.; Ebbesson, J.; French, D.; Gupta, J.; Kim, R.; et al. The planetary commons: A new paradigm for safeguarding Earth- regulating systems in the Anthropocene. Proc. Natl. Acad. Sci. USA 2024, 121, e2301531121. [Google Scholar] [CrossRef] [PubMed]
- Folke, C.; Polasky, S.; Rockström, J.; Galaz, V.; Westley, F.; Lamont, M.; Scheffer, M.; Österblom, H.; Carpenter, S.R.; Chapin, F.S.; et al. Our future in the Anthropocene biosphere. Ambio 2021, 50, 834–869. [Google Scholar] [CrossRef]
- Matlovic, R.; Matlovičová, K. Polycrisis in the Anthropocene as a key research agenda for geography: Ontological delineation and the shift to a postdisciplinary approach. Folia Geogr. 2024, 66, 5. [Google Scholar]
- Zhou, Y.; Li, P.X.; Zhang, Q.; Cheng, G.Q. Socio-economic impacts, challenges, and strategies for whole-region comprehensive land consolidation in China. Land Use Policy 2025, 150, 107461. [Google Scholar] [CrossRef]
- Li, J.; Ding, Y.P.; Jing, M.; Dong, X.Y.; Zheng, J.X.; Gu, L.Y. Quantitative Change or Qualitative Change: The Impact of Whole-Region Comprehensive Land Consolidation on Cultivated Land Security-Based on Panel Data from Townships in Zhejiang Province. Land 2024, 13, 2158. [Google Scholar] [CrossRef]
- Zuo, Y.Y.; Yang, C.X.; Xin, G.X.; Wu, Y.; Chen, R.R. Driving Mechanism of Comprehensive Land Consolidation on Urban-Rural Development Elements Integration. Land 2023, 12, 2037. [Google Scholar] [CrossRef]
- Su, M.Y.; Fang, X.Q.; Sun, K.Y.; Bao, J.H.; Cao, Y. Construction and Optimization of an Ecological Network in the Comprehensive Land Consolidation Project of a Small Rural Town in Southeast China. Sustainability 2023, 15, 5984. [Google Scholar] [CrossRef]
- Zhu, J.; Ma, S.Q.; Zhou, Q.Y. Industrial Revitalization of Rural Villages via Comprehensive Land Consolidation: Case Studies in Gansu, China. Land 2022, 11, 1307. [Google Scholar] [CrossRef]
- Liu, N.N.; Zhong, Q.K.; Zhu, K. Unveiling the Dynamics of Rural Revitalization: From Disorder to Harmony in China’s Production-Life-Ecology Space. Land 2024, 13, 604. [Google Scholar] [CrossRef]
- Demetriou, D. Automating the land valuation process carried out in land consolidation schemes. Land Use Policy 2018, 75, 21–32. [Google Scholar] [CrossRef]
- Yang, J.M.; Yao, Y.J.; Wei, Y.X.; Zhang, Y.H.; Jia, K.; Zhang, X.T.; Shang, K.; Bei, X.Y.; Guo, X.Z. A Robust Method for Generating High-Spatiotemporal-Resolution Surface Reflectance by Fusing MODIS and Landsat Data. Remote Sens. 2020, 12, 2312. [Google Scholar] [CrossRef]
- Liang, M.; Yang, G.; Zhu, X.J.; Cheng, H.; Zheng, L.G.; Liu, H.; Dong, X.L.; Zhang, Y.H. AHP-EWM Based Model Selection System for Subsidence Area Research. Sustainability 2023, 15, 7135. [Google Scholar] [CrossRef]
- Feizizadeh, B.; Blaschke, T. Land suitability analysis for Tabriz County, Iran: A multi-criteria evaluation approach using GIS. J. Environ. Plan. Manag. 2013, 56, 1–23. [Google Scholar] [CrossRef]
- Paracchini, M.L.; Pacini, C.; Jones, M.L.M.; Pérez-Soba, M. An aggregation framework to link indicators associated with multifunctional land use to the stakeholder evaluation of policy options. Ecol. Indic. 2011, 11, 71–80. [Google Scholar] [CrossRef]
- Xiao, P.N.; Zhao, C.; Zhou, Y.; Feng, H.Y.; Li, X.G.; Jiang, J.H. Study on Land Consolidation Zoning in Hubei Province Based on the Coupling of Neural Network and Cluster Analysis. Land 2021, 10, 756. [Google Scholar] [CrossRef]
- Li, Y.R.; Liu, Y.S.; Long, H.L.; Cui, W.G. Community-based rural residential land consolidation and allocation can help to revitalize hollowed villages in traditional agricultural areas of China: Evidence from Dancheng County, Henan Province. Land Use Policy 2014, 39, 188–198. [Google Scholar] [CrossRef]
- Ling, L.S.; Tang, H.J.; Chen, X.Y.; Li, S.W.; Han, X.J. Spatial zoning and effect evaluation of county high-standard farmland siting delineation for sustainable cultivated land use in China: A case study in Dali, Shaanxi. Ecol. Indic. 2024, 167, 112647. [Google Scholar] [CrossRef]
- Yang, H.; Ma, W.Q.; Liu, T.X.; Li, W.Q. Assessing farmland suitability for agricultural machinery in land consolidation schemes in hilly terrain in China: A machine learning approach. Front. Plant Sci. 2023, 14, 1084886. [Google Scholar] [CrossRef]
- Xia, M.; Wang, L.Y.; Wen, B.; Zou, W.; Ou, W.X.; Qu, Z.Q. Land Consolidation Zoning in Coastal Tidal Areas Based on Landscape Security Pattern: A Case Study of Dafeng District, Yancheng, Jiangsu Province, China. Land 2021, 10, 145. [Google Scholar] [CrossRef]
- Ma, L.B.; Tao, T.M.; Yao, Y.; Li, Y.W. Renovation Potential Evaluation and Type Identification of Rural Idle Residential Land: A Case Study of Yuzhong County, Longzhong Loess Hilly Region, China. Land 2023, 12, 163. [Google Scholar] [CrossRef]
- Biermann, F.; Abbott, K.; Andresen, S.; Bäckstrand, K.; Bernstein, S.; Betsill, M.M.; Bulkeley, H.; Cashore, B.; Clapp, J.; Folke, C.; et al. Navigating the Anthropocene: Improving Earth System Governance. Science 2012, 335, 1306–1307. [Google Scholar] [CrossRef]
- Pritchard, B.; Welch, E.; Restrepo, G.U. How land-use planning in multifunctional regions shapes spaces for farming. Geogr. Res. 2024, 62, 117–133. [Google Scholar] [CrossRef]
- Bouma, J. How to Realize Multifunctional Land Use as a Contribution to Sustainable Development. Front. Environ. Sci. 2021, 9, 620285. [Google Scholar] [CrossRef]
- Zhao, Q.; Yu, L.; Chen, X. Land system science and its contributions to sustainable development goals: A systematic review. Land Use Policy 2024, 143, 107221. [Google Scholar] [CrossRef]
- Yang, F.; Zhao, Z.F. The Research on the Spatial Governance Tools and Mechanism of Megacity Suburbs Based on Spatial Evolution: A Case of Beijing. Sustainability 2022, 14, 12384. [Google Scholar] [CrossRef]
- Berkes, F. Environmental Governance for the Anthropocene? Social-Ecological Systems, Resilience, and Collaborative Learning. Sustainability 2017, 9, 1232. [Google Scholar] [CrossRef]
- Huang, H.; Zhou, Y.; Qian, M.J.; Zeng, Z.Q. Land Use Transition and Driving Forces in Chinese Loess Plateau: A Case Study from Pu County, Shanxi Province. Land 2021, 10, 67. [Google Scholar] [CrossRef]
- Hu, B.; Ni, Q.S.; Chen, Z.F.; Liu, X.Q.; Liu, P.G.; Yuan, Z.Y. Driving Factors of Rural Land-Use Change from a Multi-Scale Perspective: A Case Study of the Loess Plateau in China. Land 2025, 14, 617. [Google Scholar] [CrossRef]
- 陕西省人民政府. 陕西省国土空间规划 (2021–2035年) [Territorial Spatial Planning of Shaanxi Province (2021–2035)]. 2024. Available online: https://www.shaanxi.gov.cn/zfxxgk/fdzdgknr/ghxx/gtzygh/202406/P020240622343901996974.pdf (accessed on 5 February 2025).
- Rockström, J.; Steffen, W.; Noone, K.; Persson, Å.; Chapin, F.S.; Lambin, E.F.; Lenton, T.M.; Scheffer, M.; Folke, C.; Schellnhuber, H.J.; et al. A safe operating space for humanity. Nature 2009, 461, 472–475. [Google Scholar] [CrossRef]
- Xu, X.L.; Liu, J.Y.; Zhang, S.W.; Li, R.D.; Yan, C.Z.; Wu, S.X. 2018, China Multi-period Land Use Land Cover Remote Sensing Monitoring Dataset. Data Registration and Publishing System of Institute of Geographic Sciences and Natural Resources Research, Chinese Academy of Sciences. Available online: http://www.resdc.cn (accessed on 12 February 2025).
- Konieczny, D.T.; Fjaeldstad, A.W.; Sandberg, K. Test-retest reliability and validity of the Importance of Olfaction Questionnaire in Denmark. PLoS ONE 2024, 19, e0269211. [Google Scholar] [CrossRef]
- 湖南省市场监督管理局. 城镇低效用地识别技术指南 [Technical Guideline of Identification for Low Efficient Urban Constructionland]. 2023. Available online: https://www.hnbzw.com/Standard/StdDetail.aspx?ekdHR4nH7qpUsAzXTctYuqV3MMEEcE/h (accessed on 6 February 2025).
- Wang, F.; Zhang, P.T.; Zhang, G.J.; Cui, J.H. Agricultural Land Quality Evaluation and Utilization Zoning Based on the Production-Ecology-Health Dimension: A Case Study of Huanghua City. Land 2023, 12, 1367. [Google Scholar] [CrossRef]
- Yang, Z.H.; Shen, N.N.; Qu, Y.B.; Zhang, B.L. Association between Rural Land Use Transition and Urban-Rural Integration Development: From 2009 to 2018 Based on County-Level Data in Shandong Province, China. Land 2021, 10, 1228. [Google Scholar] [CrossRef]
- Xu, W.T.; Yang, L.C. Evaluating the urban land use plan with transit accessibility. Sustain. Cities Soc. 2019, 45, 474–485. [Google Scholar] [CrossRef]
- Andersen, P.S.; Vejre, H.; Dalgaard, T.; Brandt, J. An indicator-based method for quantifying farm multifunctionality. Ecol. Indic. 2013, 25, 166–179. [Google Scholar] [CrossRef]
- Kosmas, C.; Kairis, O.; Karavitis, C.; Ritsema, C.; Salvati, L.; Acikalin, S.; Alcalá, M.; Alfama, P.; Atlhopheng, J.; Barrera, J.; et al. Evaluation and Selection of Indicators for Land Degradation and Desertification Monitoring: Methodological Approach. Environ. Manag. 2014, 54, 951–970. [Google Scholar] [CrossRef]
- Pliego-Martínez, O.; Martínez-Rebollar, A.; Estrada-Esquivel, H.; de la Cruz-Nicolás, E. An Integrated Attribute-Weighting Method Based on PCA and Entropy: Case of Study Marginalized Areas in a City. Appl. Sci. 2024, 14, 2016. [Google Scholar] [CrossRef]
- Jolliffe, I.T.; Cadima, J. Principal component analysis: A review and recent developments. Philos. Trans. R. Soc. A-Math. Phys. Eng. Sci. 2016, 374, 20150202. [Google Scholar] [CrossRef]
- Liang, X.D.; Liu, C.M.A.; Li, Z. Measurement of Scenic Spots Sustainable Capacity Based on PCA-Entropy TOPSIS: A Case Study from 30 Provinces, China. Int. J. Environ. Res. Public Health 2018, 15, 10. [Google Scholar] [CrossRef]
- Yue, C. Entropy-based weights on decision makers in group decision-making setting with hybrid preference representations. Appl. Soft Comput. 2017, 60, 737–749. [Google Scholar] [CrossRef]
- Pena, J.; Nápoles, G.; Salgueiro, Y. Implicit and hybrid methods for attribute weighting in multi-attribute decision-making: A review study. Artif. Intell. Rev. 2021, 54, 3817–3847. [Google Scholar] [CrossRef]
- Ma, J.F.; Li, W.F.; Wang, Z.; He, L.; Han, L.J. Measuring Multi-Faceted Land Use Efficiency of Large-Scale Urban Agglomerations under Multi-Scale Drivers: Evidence from China. Land 2022, 11, 91. [Google Scholar] [CrossRef]
- Liu, Y.; Shi, F.C.; He, H.M.; Shen, L.Y.; Luo, W.Z.; Sun, L.Y. Study on the Matching Degree between Land Resources Carrying Capacity and Industrial Development in Main Cities of Xinjiang, China. Sustainability 2021, 13, 10568. [Google Scholar] [CrossRef]
- Wu, R.M.X.; Zhang, Z.W.; Yan, W.J.; Fan, J.F.; Gou, J.W.; Liu, B.; Gide, E.G.; Soar, J.; Shen, B.; Fazal-E-Hasan, S.; et al. A comparative analysis of the principal component analysis and entropy weight methods to establish the indexing measurement. PLoS ONE 2022, 17, e0262261. [Google Scholar] [CrossRef]
- Malczewski, J. Local Weighted Linear Combination. Trans. Gis 2011, 15, 439–455. [Google Scholar] [CrossRef]
- Sujithlal, S.P.; Ahana, K.K.; Satheesan, K.; Kottayil, A. Identification of the Tropopause Using the Jenks Natural Breaks Classification From 205-MHz Stratosphere-Troposphere Wind Profiler Radar. IEEE Trans. Geosci. Remote Sens. 2024, 62, 4104006. [Google Scholar] [CrossRef]
- Ma, Y.J.; Yu, Z.Y.; Liu, W.; Ren, Q. Exploring the coupling coordination relationship and obstacle factors of rural revitalization, new-type urbanization, and digital economy in China. PLoS ONE 2025, 20, e0313125. [Google Scholar] [CrossRef] [PubMed]
- Zhou, J.; Hu, T.F.; Wei, Z.Q.; Ji, D.D. Evaluation of High-Quality Development Level of Regional Economy and Exploration of Index Obstacle Degree: A Case Study of Henan Province. J. Knowl. Econ. 2024, 16, 10566–10598. [Google Scholar] [CrossRef]
- Sun, X.B.; Li, Q.F.; Kong, X.B.; Cai, W.M.; Zhang, B.L.; Lei, M. Spatial Characteristics and Obstacle Factors of Cultivated Land Quality in an Intensive Agricultural Region of the North China Plain. Land 2023, 12, 1552. [Google Scholar] [CrossRef]
- Lian, H.P.; Zhang, Y.D.; Xiong, X.Z.; Han, W.J. Functional Assessment of Rural Counties Under the Production-Living-Ecological Framework: Evidence from Guangdong, China. Land 2025, 14, 995. [Google Scholar] [CrossRef]
- Erb, K.H.; Matej, S.; Haberl, H.; Gingrich, S. Sustainable land systems in the Anthropocene Navigating the global land squeeze. One Earth 2024, 7, 1170–1186. [Google Scholar] [CrossRef]
- Chen, X.X.; Xue, Z.; Han, G.Y.; Gao, Q. The impact of land consolidation on farmer income: Evidence from high-standard farmland construction in China. Front. Sustain. Food Syst. 2024, 8, 1412095. [Google Scholar] [CrossRef]
- Yan, J.L.; Liu, Y.Q.; Long, H.L. Integrating ecosystem services into comprehensive land consolidation: A multi-scale governance perspective. J. Geogr. Sci. 2025, 35, 716–744. [Google Scholar] [CrossRef]
- Metternicht, G.; Akhtar-Schuster, M.; Castillo, V. Implementing land degradation neutrality: From policy challenges to policy opportunities for national sustainable development. Environ. Sci. Policy 2019, 100, 189–191. [Google Scholar] [CrossRef]
- Schreinemachers, P.; Tipraqsa, P. Agricultural pesticides and land use intensification in high, middle and low income countries. Food Policy 2012, 37, 616–626. [Google Scholar] [CrossRef]
- Wang, A.Q.; Zhang, L.X.; Shi, Y.J.; Rozelle, S.; Osborn, A.; Yang, M. Rural Solid Waste Management in China: Status, Problems and Challenges. Sustainability 2017, 9, 506. [Google Scholar] [CrossRef]
- Zhang, D.L.; Yu, L.H.; Wang, W.X. Promoting Effect of Whole-Region Comprehensive Land Consolidation on Rural Revitalization from the Perspective of Farm Households: A China Study. Land 2022, 11, 1854. [Google Scholar] [CrossRef]
- Jiang, Y.F.; Long, H.L.; Tang, Y.T.; Deng, W.; Chen, K.Q.; Zheng, Y.H. The impact of land consolidation on rural vitalization at village level: A case study of a Chinese village. J. Rural. Stud. 2021, 86, 485–496. [Google Scholar] [CrossRef]
- Zhang, B.L.; Wang, S.X.; Wang, D.D.; Wang, Q.; Yang, X.Y.; Tong, R.P. Air quality changes in China 2013-2020: Effectiveness of clean coal technology policies. J. Clean. Prod. 2022, 366, 132961. [Google Scholar] [CrossRef]
- Wu, D.; Zou, C.X.; Cao, W.; Xiao, T.; Gong, G.L. Ecosystem services changes between 2000 and 2015 in the Loess Plateau, China: A response to ecological restoration. PLoS ONE 2019, 14, e0209483. [Google Scholar] [CrossRef]
- Liu, J.S.; Zhang, X.F.; Lin, J.; Li, Y.R. Beyond government-led or community-based: Exploring the governance structure and operating models for reconstructing China’s hollowed villages. J. Rural. Stud. 2022, 93, 273–286. [Google Scholar] [CrossRef]
- Bai, X.M.; van der Leeuw, S.; O’Brien, K.; Berkhout, F.; Biermann, F.; Brondizio, E.S.; Cudennec, C.; Dearing, J.; Duraiappah, A.; Glaser, M.; et al. Plausible and desirable futures in the Anthropocene: A new research agenda. Glob. Environ. Chang.-Hum. Policy Dimens. 2016, 39, 351–362. [Google Scholar] [CrossRef]
- Cox, M. Diagnosing Institutional Fit: A Formal Perspective. Ecol. Soc. 2012, 17, 54. [Google Scholar] [CrossRef]
- Le, Q.B.; Park, S.J.; Vlek, P.L.G. Land Use Dynamic Simulator (LUDAS): A multi-agent system model for simulating spatio-temporal dynamics of coupled human-landscape system 2. Scenario-based application for impact assessment of land-use policies. Ecol. Inform. 2010, 5, 203–221. [Google Scholar] [CrossRef]
- Kim, J.H. Spatiotemporal scale dependency and other sensitivities in dynamic land-use change simulations. Int. J. Geogr. Inf. Sci. 2013, 27, 1782–1803. [Google Scholar] [CrossRef]
- Verburg, P.H.; Erb, K.H.; Mertz, O.; Espindola, G. Land System Science: Between global challenges and local realities. Curr. Opin. Environ. Sustain. 2013, 5, 433–437. [Google Scholar] [CrossRef]
- Jiang, Z.F.; Li, Q.; Gao, W.; Su, H.Y.; Zhang, Y.S. Interest Equilibrium and Path Choice in the Development of Construction Land Decrement: A Theoretical Analysis Based on the Multi-Agent Game Model. Sustainability 2023, 15, 4734. [Google Scholar] [CrossRef]
- Long, H.L.; Qu, Y. Land use transitions and land management: A mutual feedback perspective. Land Use Policy 2018, 74, 111–120. [Google Scholar] [CrossRef]
- Chaffin, B.C.; Gosnell, H.; Cosens, B.A. A decade of adaptive governance scholarship: Synthesis and future directions. Ecol. Soc. 2014, 19, 56. [Google Scholar] [CrossRef]
- Song, W.; Cao, S.S.; Du, M.Y.; He, Z.Y. Aligning territorial spatial planning with sustainable development goals: A comprehensive analysis of production, living, and ecological spaces in China. Ecol. Indic. 2024, 160, 111816. [Google Scholar] [CrossRef]


| Data Types | Data Sources | Resolution (m) | Collection | Classification | Data Use |
|---|---|---|---|---|---|
| Qian County administrative boundary data (county-level, town-level, and village-level administrative divisions) | Scientific data registration and publishing system of geographic remote sensing ecological network (GISRS) (http://gisrs.cn/minindex.html, accessed on 8 January 2025) | - | 2020 | Vector | Used to clip land use data according to the study area |
| Land use and cover change (LUCC) secondary land category data of China (based on the national land use classification system (GB/T 21010-2017 [41]) | Institute of Geographic Sciences and Natural Resources Research, Chinese Academy of Sciences (https://www.resdc.cn/, accessed on 10 January 2025) | 30 | 2020 | Raster | Used to calculate indicators related to land use types |
| Soil organic carbon data | Institute of Soil Science, Chinese Academy of Sciences (http://www.issas.cas.cn/, accessed on 12 January 2025) | 250 | 2021 | Raster | Used to compute the proportion of soil organic matter content |
| POI data | Gaode map (https://gaode.com/, accessed on 18 January 2025) | - | 2022 | Vector | Used to calculate the production building density and industrial-mining built-up land use density |
| Landsat 8 remote sensing imagery | Geospatial data cloud (https://www.gscloud.cn/, accessed on 10 January 2025) | 15 | 2022 | Raster | Used to derive the desertification index |
| Road network data | Gaode map (https://gaode.com/, accessed on 4 February 2025) | - | 2021 | Vector | Used to calculate road network density |
| Population data | Open land map (https://openlandmap.org/, accessed on 11 January 2025) | - | 2021 | Raster | Used to estimate population density and per capita built-up land area |
| Field survey data (includes infrastructure satisfaction, resident satisfaction, and ecological environment evaluation data) | Field investigation | - | 2024 | Excel | Used to assess living and ecological land use efficiency |
| Target Level | Indicator Level | Indicator Description | Calculation Method |
|---|---|---|---|
| Production efficiency | Land cultivation rate | Reflects land resource utilization intensity and structure | |
| Soil organic matter content | Indicates carbon-containing organic compounds in soil | ||
| Land use intensity | Measures the human exploitation intensity of land resources | Where: La—comprehensive land use intensity index. Ai—grading index for the i-th land use intensity level (level 1: unused land/difficult-to-utilize land; level 2: forest land/grassland/water area; level 3: cultivated land/garden plot; level 4: urban and industrial-mining land) Ci—percentage area of the i-th land use intensity classification level n—number of land use intensity classification levels | |
| Production building density (units/km2) | Indicates secondary/tertiary industry development levels | ||
| Industrial-mining built-up land use density (units/km2) | Reflects industrial production intensity | ||
| Living efficiency | Population density (persons/km2) | Measures population distribution density | |
| Per capita built-up land area (m2/person) | Evaluates rural land use efficiency | ||
| Fragmentation of built-up land patches | Quantifies the spatial fragmentation of construction land | ||
| Road network density (km/km2) | Assess transportation infrastructure rationality | ||
| Infrastructure quality assessment | Evaluates public facility completeness (1–5 scale) | Subjective rating (1–5 scale) | |
| Resident satisfaction index | Measures quality of life (1–5 scale) | Subjective rating (1–5 scale) | |
| Ecological efficiency | Proportion of ecological land area (%) | Indicates the proportion of ecologically functional land | where: Ael— normalization coefficient of the ecological land area ratio index; reference value: 100.5022 |
| Habitat quality index | Evaluates ecological environment status | where: Abio—normalization coefficient for the habitat quality index; reference value: 511.2642131067 | |
| Patch density (units/hm2) | Measures landscape fragmentation | ||
| Shannon diversity index | Quantifies landscape diversity | where: Pi Represents the proportion of patch type i in the landscape | |
| Ecological environment assessment | Subjective evaluation of environmental quality (1–5 scale) | Subjective rating (1–5 scale) | |
| Desertification index | Assesses land degradation severity | where: FVC (Vegetation Cover Fraction)—degree of surface vegetation coverage NDVI—Normalized Difference Vegetation Index of mixed pixels. NDVIsoil—The NDVI value of bare soil pixels represents the NDVI value of pure vegetation pixels 1,2 |
| Metric | Production | Living | Ecological | |
|---|---|---|---|---|
| Kaiser–Meyer–Olkin | 0.534 | 0.612 | 0.656 | |
| Bartlett’s Test | Chi-square | 1077.836 | 208.81 | 339.544 |
| d | 6 | 15 | 15 | |
| level of significance | 0.000 | 0.000 | 0.000 | |
| Objective Layer | Principal Component | Explanation Rate (%) | Variable | Principal Component Load |
|---|---|---|---|---|
| Production | PC1 | 59.566 | X1 Production building density X2 Industrial-mining built-up land use density | +0.993 +0.994 |
| PC2 | 37.406 | X3 Land cultivation rate X4 Land use intensity | +0.886 +0.843 | |
| Living | PC3 | 37.962 | X5 Population density X6 Fragmentation built-up land patches X7 Road network density | +0.560 +0.779 +0.830 |
| PC4 | 20.517 | X8 Infrastructure quality assessment X9 Resident satisfaction index | +0.914 +0.851 | |
| PC5 | 17.061 | X5 Population density X10 Per capita built-up land area | −0.589 +0.877 | |
| Ecological | PC6 | 43.207 | X11 Proportion of ecological land area X12 Habitat quality index X13 Ecological environment assessment | +0.830 +0.894 +0.538 |
| PC7 | 21.319 | X14 Shannon diversity index X15 Desertification index | +0.827 +0.890 | |
| PC8 | 14.558 | X16 Patch density X13 Ecological environment assessment | +0.896 −0.578 |
| Objective Layer | Principal Component | Weight |
|---|---|---|
| Production efficiency | PC1 | 0.671 |
| PC2 | 0.017 | |
| Living efficiency | PC3 | 0.047 |
| PC4 | 0.095 | |
| PC5 | 0.017 | |
| Ecological efficiency | PC6 | 0.020 |
| PC7 | 0.128 | |
| PC8 | 0.005 |
Disclaimer/Publisher’s Note: The statements, opinions and data contained in all publications are solely those of the individual author(s) and contributor(s) and not of MDPI and/or the editor(s). MDPI and/or the editor(s) disclaim responsibility for any injury to people or property resulting from any ideas, methods, instructions or products referred to in the content. |
© 2025 by the authors. Licensee MDPI, Basel, Switzerland. This article is an open access article distributed under the terms and conditions of the Creative Commons Attribution (CC BY) license (https://creativecommons.org/licenses/by/4.0/).
Share and Cite
Xie, Z.; Wu, S.; Liu, X.; Shi, H.; Hao, M.; Zhao, W.; Fu, X.; Liu, Y. Land Consolidation Potential Assessment by Using the Production–Living–Ecological Space Framework in the Guanzhong Plain, China. Sustainability 2025, 17, 6887. https://doi.org/10.3390/su17156887
Xie Z, Wu S, Liu X, Shi H, Hao M, Zhao W, Fu X, Liu Y. Land Consolidation Potential Assessment by Using the Production–Living–Ecological Space Framework in the Guanzhong Plain, China. Sustainability. 2025; 17(15):6887. https://doi.org/10.3390/su17156887
Chicago/Turabian StyleXie, Ziyi, Siying Wu, Xin Liu, Hejia Shi, Mintong Hao, Weiwei Zhao, Xin Fu, and Yepeng Liu. 2025. "Land Consolidation Potential Assessment by Using the Production–Living–Ecological Space Framework in the Guanzhong Plain, China" Sustainability 17, no. 15: 6887. https://doi.org/10.3390/su17156887
APA StyleXie, Z., Wu, S., Liu, X., Shi, H., Hao, M., Zhao, W., Fu, X., & Liu, Y. (2025). Land Consolidation Potential Assessment by Using the Production–Living–Ecological Space Framework in the Guanzhong Plain, China. Sustainability, 17(15), 6887. https://doi.org/10.3390/su17156887