Article

Parametric Analysis of Rammed Earth Walls in the Context of the Thermal Protection of Environmentally Friendly Buildings

by
Piotr Kosiński
1,*,
Wojciech Jabłoński
2 and
Krystian Patyna
2
1
Faculty of Geoengineering, University of Warmia and Mazury in Olsztyn, Jana Heweliusza 10, 10-724 Olsztyn, Poland
2
Faculty of Civil Engineering and Architecture, Lublin University of Technology, 40 Nadbystrzycka St., 20-618 Lublin, Poland
*
Author to whom correspondence should be addressed.
Sustainability 2025, 17(15), 6886; https://doi.org/10.3390/su17156886
Submission received: 18 June 2025 / Revised: 11 July 2025 / Accepted: 21 July 2025 / Published: 29 July 2025

Abstract

Rammed earth (RE), a traditional material aligned with circular economy (CE) principles, has been gaining renewed interest in contemporary construction due to its low environmental impact and compatibility with sustainable building strategies. Though not a modern invention, it is being reintroduced in response to the increasingly strict European Union (EU) regulations on carbon footprint, life cycle performance, and thermal efficiency. RE walls offer multiple benefits, including humidity regulation, thermal mass, plasticity, and structural strength. This study also draws attention to their often-overlooked ability to mitigate indoor overheating. To preserve these advantages while enhancing thermal performance, this study explores insulation strategies that maintain the vapor-permeable nature of RE walls. A parametric analysis using Delphin 6.1 software was conducted to simulate heat and moisture transfer in two main configurations: (a) a ventilated system insulated with mineral wool (MW), wood wool (WW), hemp shives (HS), and cellulose fiber (CF), protected by a jute mat wind barrier and finished with wooden cladding; (b) a closed system using MW and WW panels finished with lime plaster. In both cases, clay plaster was applied on the interior side. The results reveal distinct hygrothermal behavior among the insulation types and confirm the potential of natural, low-processed materials to support thermal comfort, moisture buffering, and the alignment with CE objectives in energy-efficient construction.

1. Introduction

In 2022, the construction sector was responsible for approximately 37% of global carbon dioxide emissions into the atmosphere [1]. According to the 2024 report by the United Nations Environment Programme, this upward trend is ongoing [2]. One of the key contributors to total greenhouse gas (GHG) emissions is the extraction of raw materials and the production of construction materials, which together account for an estimated 5–15% of global GHG emissions [3,4]. Another critical factor is the volume of waste generated by the sector. Eurostat data indicate that in 2022, construction and demolition waste (CDW) represented 38% of the total waste generated across EU member states [5]. To mitigate these impacts, several policies have been introduced, including Directive 2008/98/EC of the European Parliament and of the Council [6], which outlines the possibility of removing the waste status from certain materials, including construction materials. Furthermore, Regulation (EU) 2020/852 of the European Parliament and of the Council [7] advocates for a transition toward a CE model. The implementation of CE principles and the effective reintegration of materials into the construction process require the coordinated planning of supply chains—from demolition sites to target destinations [8,9]—as well as legislative adjustments [10] and the proper processing of CDW for reuse.
In response to these challenges, growing attention is being paid to the identification of viable strategies and methods for the reuse of demolition materials. Among those most frequently cited as suitable for reuse in load-bearing structures are concrete waste, timber, bricks, and steel [8,11,12,13,14,15].
Following proper demolition procedures, material assessment, and processing, both timber elements [16] and steel components [17] can be reused in the construction of buildings, particularly within skeletal and frame structural systems. An essential consideration in construction with both new and reclaimed timber is the selection of jointing methods that allow for easy disassembly and reassembly in future structures [18]. Crushed concrete and brick debris can be reused as sub-base material for pavements [19] or as substitutes for natural aggregates in new mixtures [20,21]. Larger ceramic elements, after preliminary selection, may also be reused in wall construction; however, to ensure the structural integrity of such walls, factors such as shape and material quality must be carefully evaluated [22]. Improper arrangement may result in the need for increased quantities of mortar [22]. A similar challenge applies to the use of large-scale concrete rubble. According to Grangeot et al. [15], it is possible to assemble large elements—whether irregularly shaped or with preserved perpendicular or parallel edges—into stable wall structures. However, this method requires prior scanning or, at minimum, the precise measurement of the elements, the accurate preparation of mounting holes for secure connections, and the use of heavy construction equipment for handling and installation [15,23]. When main components are properly positioned and the gaps filled with smaller, matching pieces, it is possible to limit mortar use to only about 15% of the wall surface—potentially using earth-based mortar as a filler [15,23].
Although soil excavated from construction-related activities—such as digging, tunneling, and earthworks—is formally classified as CDW [10], it is relatively seldom addressed in CDW-related studies, despite accounting for approximately 50% of the total volume of such waste [24].
Excavated soil from earthworks accompanying virtually every type of construction project can also be considered a reusable material within the CE framework. Once verified as uncontaminated and suitable for further use, such soil can serve as a valuable source of aggregate material [10]. Load-bearing walls constructed with earth can be realized using masonry techniques—for example, compressed earth blocks (CEB) [25]—or as monolithic walls employing the RE technique [26]. To improve the structural stability of RE walls, additives such as cement or hydraulic lime are often introduced [27], with lime considered a more environmentally sustainable stabilizer due to the carbonation process it undergoes during curing [28].
Earthen construction, when compared with other industrial building materials suitable for massive wall construction, is characterized by significantly lower GHG emissions. According to research by Nouri et al. [29], RE walls have a carbon footprint of approximately 42 kg CO2/t of material. In contrast, fired clay bricks generate 1287 kg CO2/t [29], while AAC blocks emit between 76 and 102 kg CO2/t [30]. Moreover, according to Arenas and Shafique [31], C30 concrete emits 317 kg CO2/m3, clay bricks 685 kg CO2/m3, CEB 48 kg CO2/m3, and RE 34 kg CO2/m3 [31]. In light of this data, RE exhibits the lowest carbon footprint among the materials compared, making it one of the most sustainable options for massive wall construction in the context of reducing GHG emissions.
As with other construction materials, the use of earth in building elements requires appropriate processing—specifically, the formulation of a suitable mix. Due to its physical properties, wall and structural elements can be constructed using both manual compaction methods and industrial production techniques [32]. The presence of clay, which serves as the primary binder in earthen walls, enables such structures to significantly contribute to the regulation of indoor humidity and the maintenance of a healthy indoor environment [33,34]. A critical issue in earthen structures is the need to maintain an appropriate level of moisture content. Exceeding threshold values can lead to a loss of structural stability [35]. Given the importance of ensuring adequate thermal comfort and moisture regulation within earthen walls, the selection of an appropriate insulation strategy is essential.
Previous research on the thermal insulation of earthen walls has primarily focused on highly processed materials such as expanded polystyrene [36,37,38,39], MW [40], and PIR foam [40], as well as natural insulation materials including WW [39], cork [41], lime–hemp composites [41,42], and sugarcane-based insulation [42]. These studies examined multilayer wall assemblies with insulation placed on the exterior [36,39,41,42]—combined with cement plaster [36] or lime plasters [42]—as well as systems where insulation was embedded between layers of RE [37,40], or installed on the interior side of the wall [38].
The existing body of work has analyzed closed-layer assemblies and predominantly focused on the performance of industrial insulation or natural-based insulation materials. In this context, the present study explores the behavior of rammed earth walls insulated with vapor-permeable materials such as MW and WW in two configurations: (a) a ventilated cavity system, (b) a closed assembly. In the ventilated configuration, this study evaluates MW, WW, loose HS, and loose CF. In both scenarios, the interior finish of the walls is assumed to be clay plaster. In the closed-layer configuration, the insulation is installed using a clay-based adhesive, while in the ventilated system, it is placed between wooden battens and protected with a wind barrier made of jute matting. In the first variant, the external finish is lime plaster; in the second, wooden cladding is used.

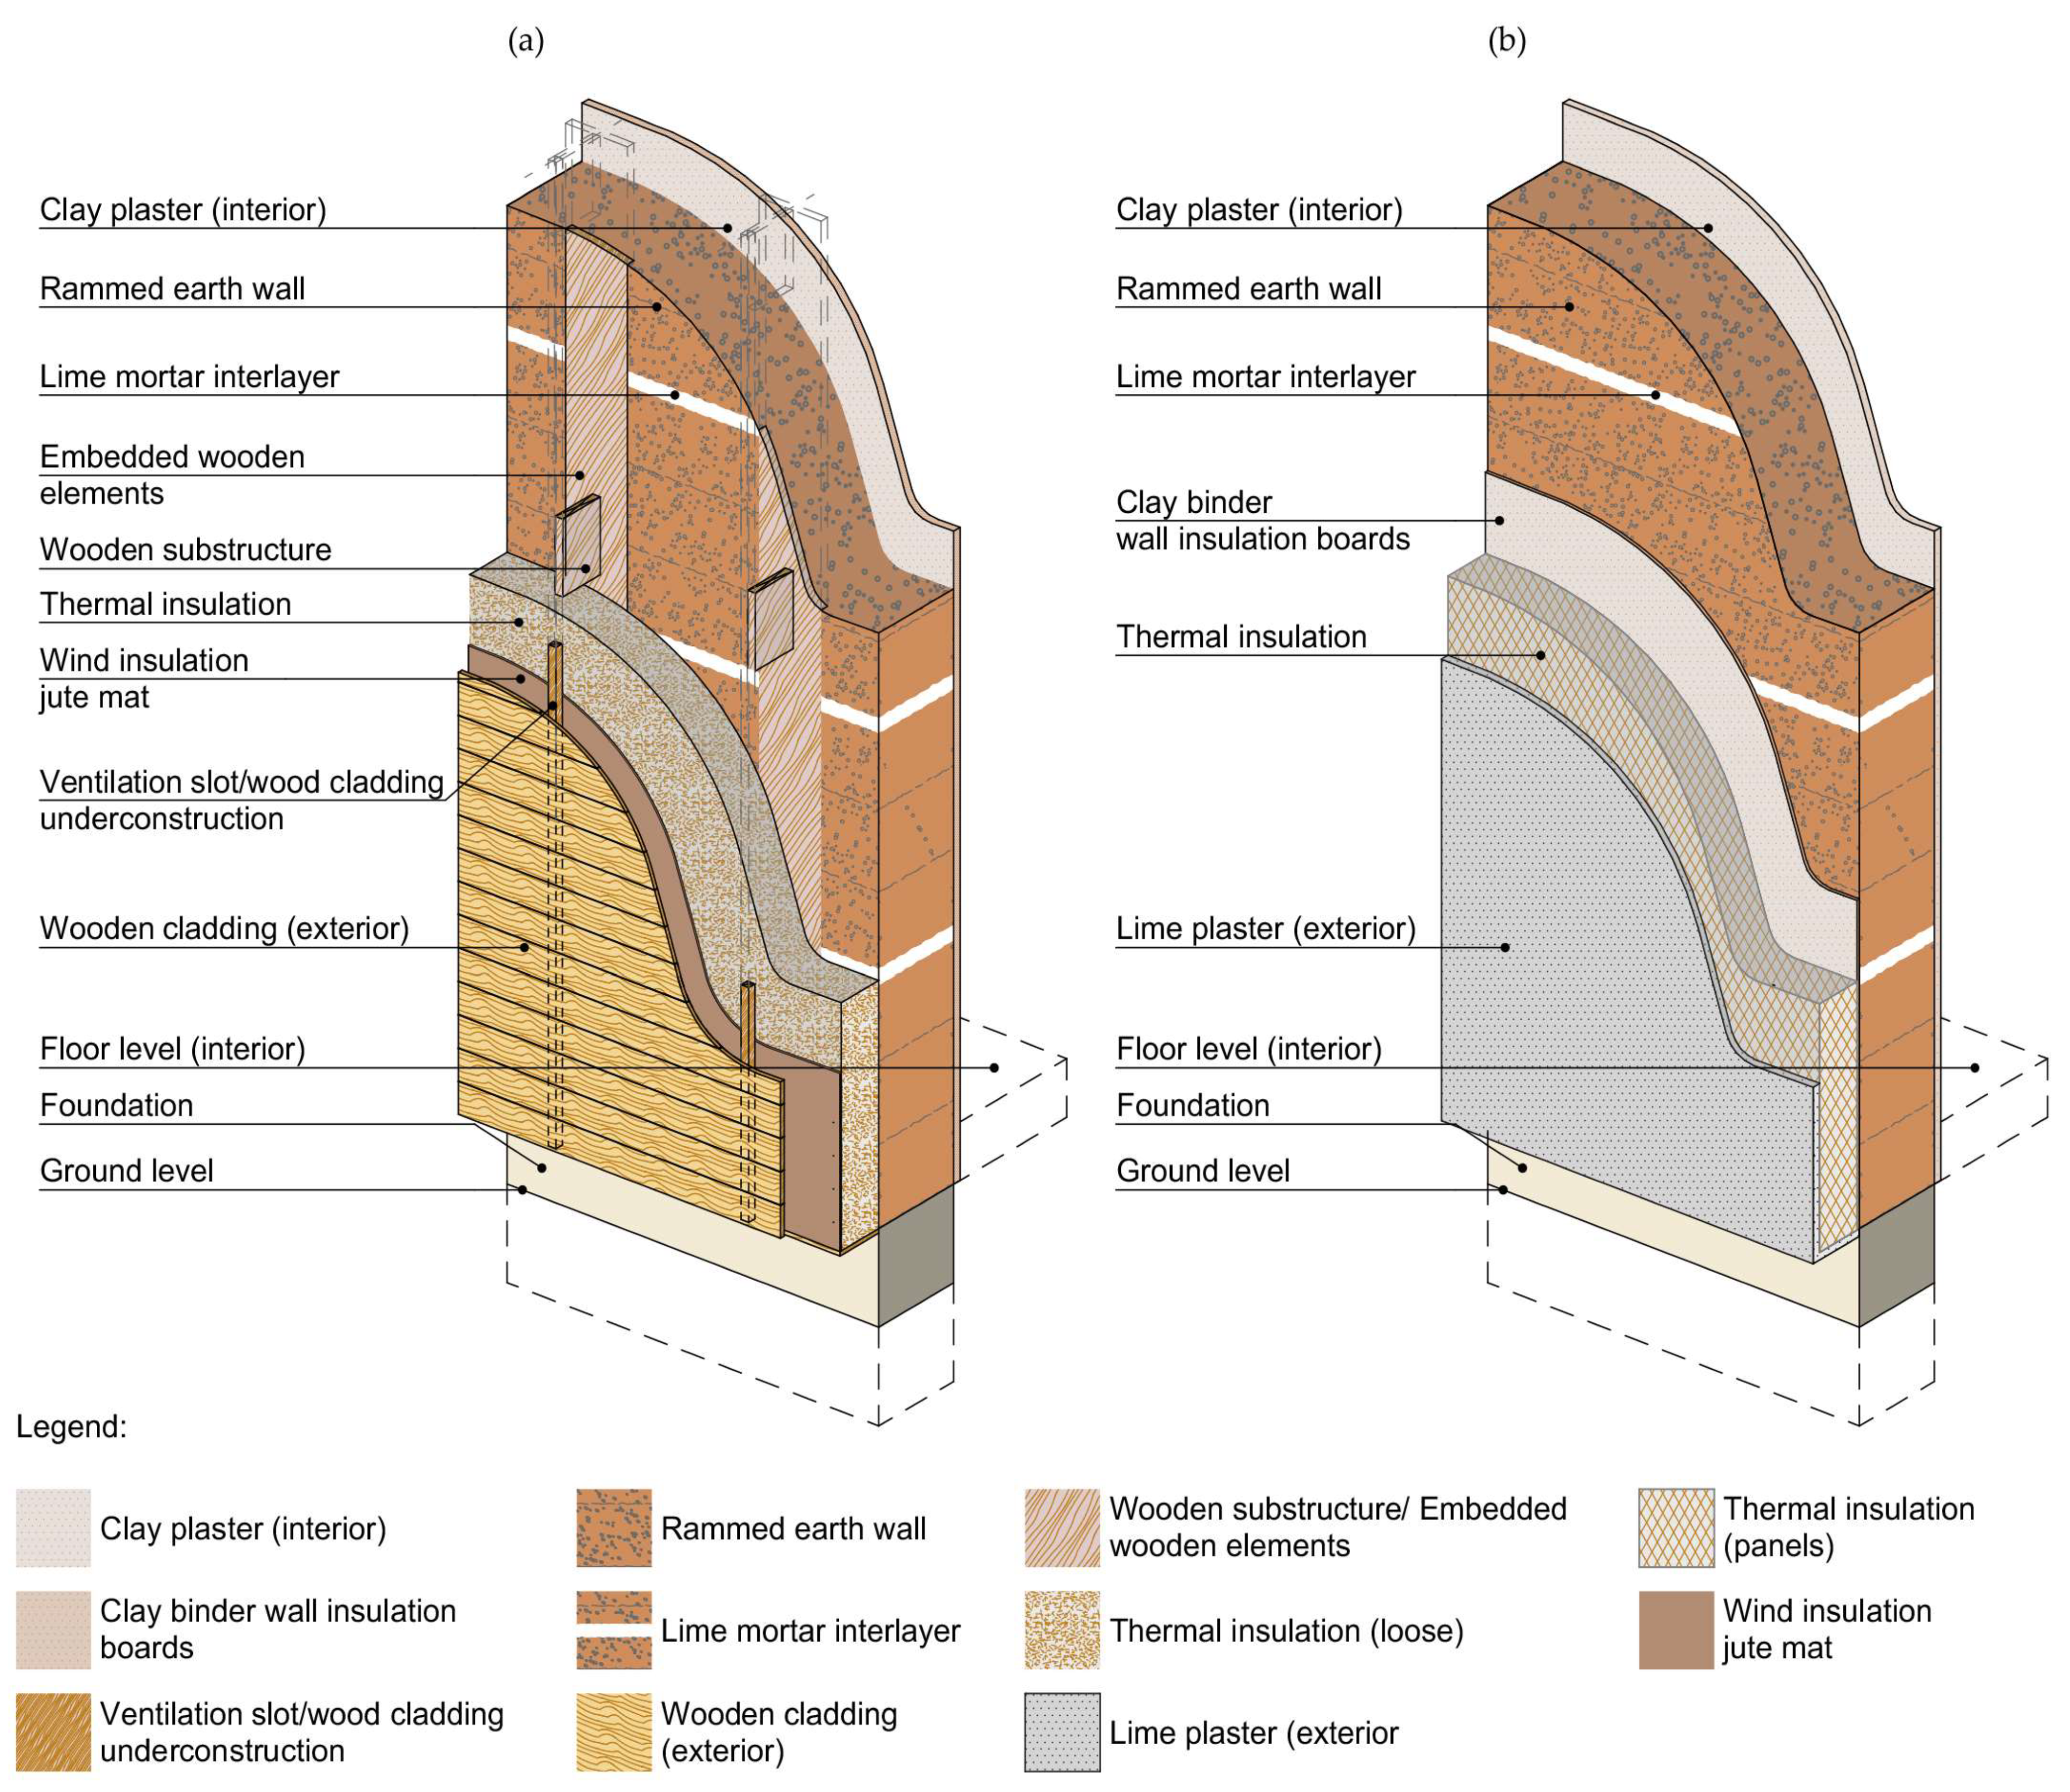
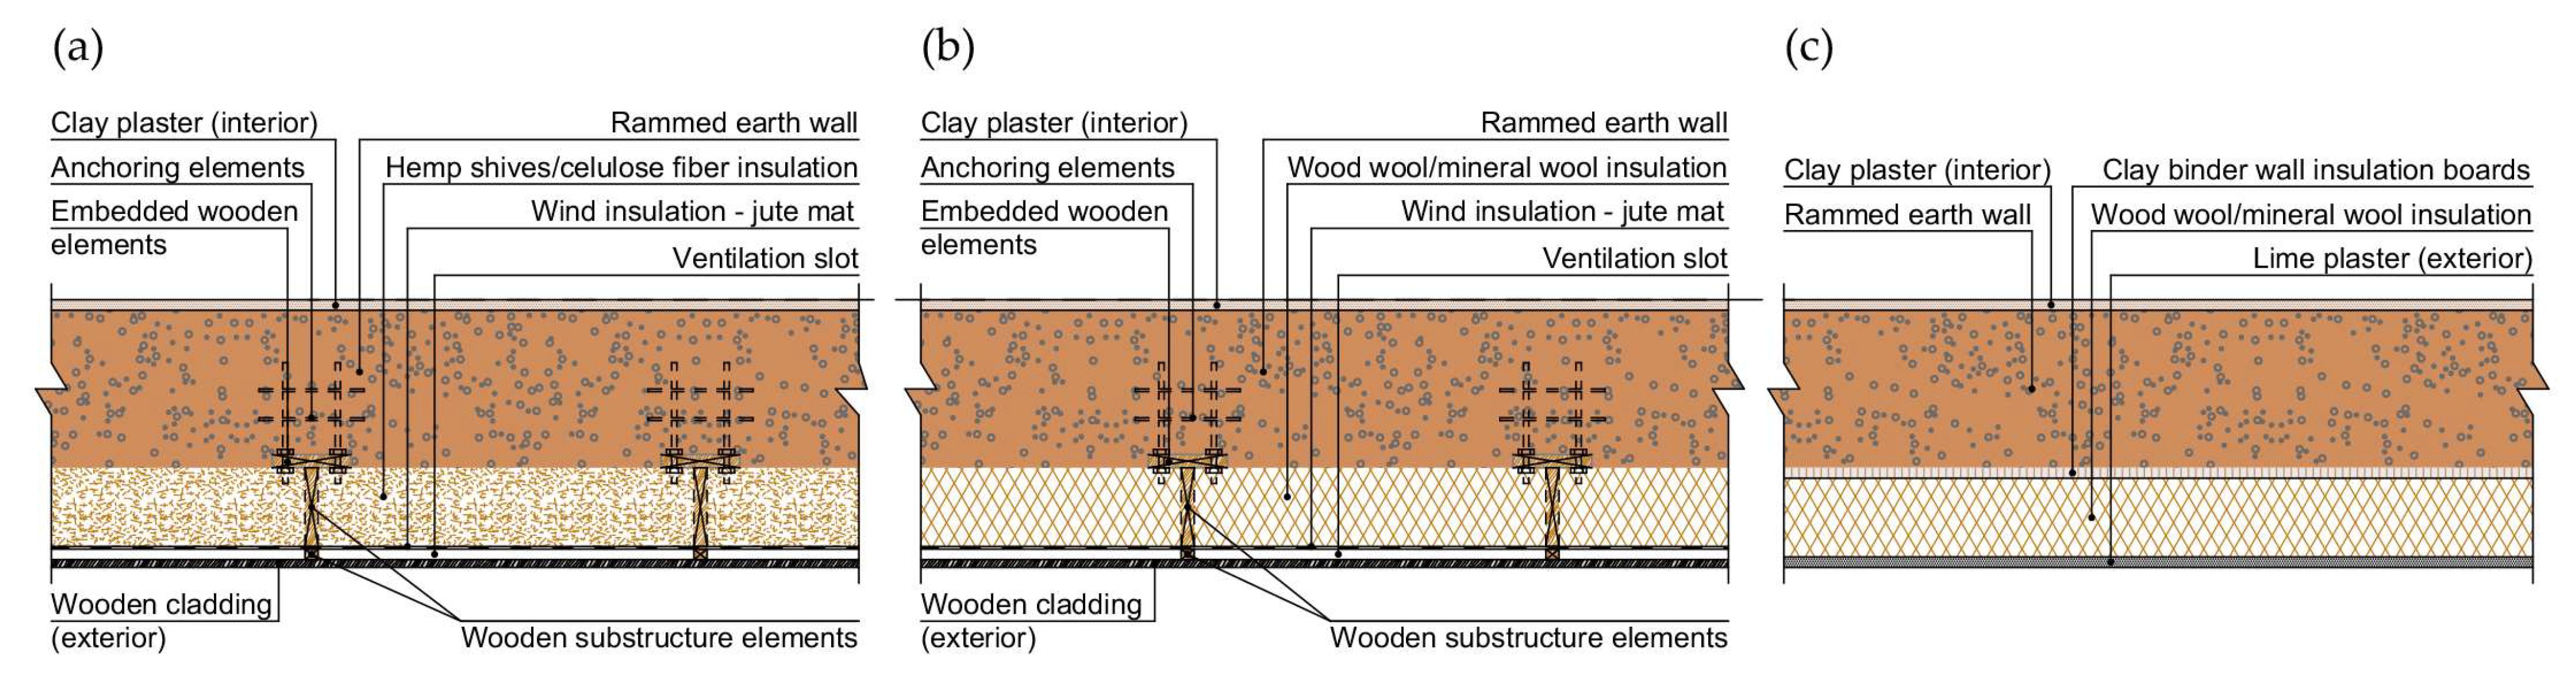
2. Materials and Methods

Based on the study by Kainfar and Taufigh [26], RE walls with a thickness of 30 cm and a density of 1800 kg/m3 [43] were adopted as the starting point for analysis. The objective of this study was to determine the appropriate thickness and composition of the insulation layer, taking into account both thermal comfort and moisture transport through the envelope, particularly in temperate climate conditions. The numerical studies consisted of conducting hygrothermal simulations of RE walls insulated with fibrous materials. The thermal insulation was assumed to be CF or HS in a loose state, and WW and MW in the form of formed panels. MW, although highly processed, is the most popular thermal insulation material in Europe [44] and can be considered a reference material [45].
The layers of the simulated models (from the inside) are as follows: clay plaster (0.02 m), RE (0.30 m), thermal insulation (0.150–0.188 m), jute mat to retain loose insulation, ventilated space, and wooden boards (0.02 m). In the case of MW and WW batt insulation, additional simulations were performed for walls without ventilated layers, finished with lime plaster (0.01 m) applied directly to the thermal insulation. Since the thermal insulation materials differ in thermal conductivity, the authors modeled walls with varying insulation thicknesses but with a constant thermal transmittance of U = 0.22 W/m2 K. The representation of the ventilated space consisted of introducing airflow at a pressure difference of 2 Pa across the 1.0 m height of the model. The assembly configurations are illustrated in Figure 1.
The models were built using materials from the Delphin 6.1 database, or, in the case of RE [46], HS, and CF, from other sources [45]. A summary of the specific data used in the simulations for each material is presented in Table 1.
The simulations were performed in the Delphin 6.1 program using the balance equations of the finite volume method. The internal boundary conditions were assumed to be a constant 50% relative humidity at a temperature of 20 °C. The external boundary conditions correspond to the climate of Olsztyn, based on data for a typical meteorological year [47]. The temperature and relative humidity (RH) for Olsztyn are shown in Figure 2.
The climate in Olsztyn is temperate, warm, and transitional. The lowest temperatures (below −15 °C) occur in January and early February, while the highest temperatures (above 30 °C) are recorded in summer. Air relative humidity strongly depends on precipitation and, naturally, on temperature. During the simulations, heat and moisture flows were recorded in the models. These are illustrated by color maps showing the distribution of temperature and relative humidity (RH). Additionally, heat fluxes (HF) on the interior side and moisture accumulation in individual layers—namely, the internal plaster, RE, and thermal insulation—were calculated. The simulation time was set to 3 years, which is considered an appropriate period in Delphin 6.1 for the numerical model to reach hygrothermal stabilization. This allows for the observation of whether seasonal fluctuations in moisture levels are recurring or result from the model reaching equilibrium. HF and moisture accumulation were recorded at a time step of 1 h, while temperature and RH distribution were recorded at a step of 1.5 days. The performance options of the Delphin 6.1 simulations were set to automatic, which means that the Integrator Maximum Method Order was 5 (on a scale 1–5) with an auto Non-linear Iteration Convergence Coefficient. The Maximum Dimension for Krylov Subspace was 10 with a Linear Iteration Convergence Coefficient of 0.08. The relative tolerance was 1 × 10⁻⁵, the absolute tolerances of the solver were set at 1 × 10⁻⁶ in the case of moisture and air mass balance equations, and the maximum time step size was 30 min. The minimum element size was 1 mm, and maximum element size was 50 mm. The stretch factor was 1.3. The models consisted of 1040 to 1722 mesh elements.
Figure 3 presents three models of RE walls insulated with different types of materials: (a) HS and CF with ventilation slot, (b) MW and WW with ventilation slot, (c) MW and WW without ventilation slot. All models correspond to the diagrams shown in Figure 1.

3. Results

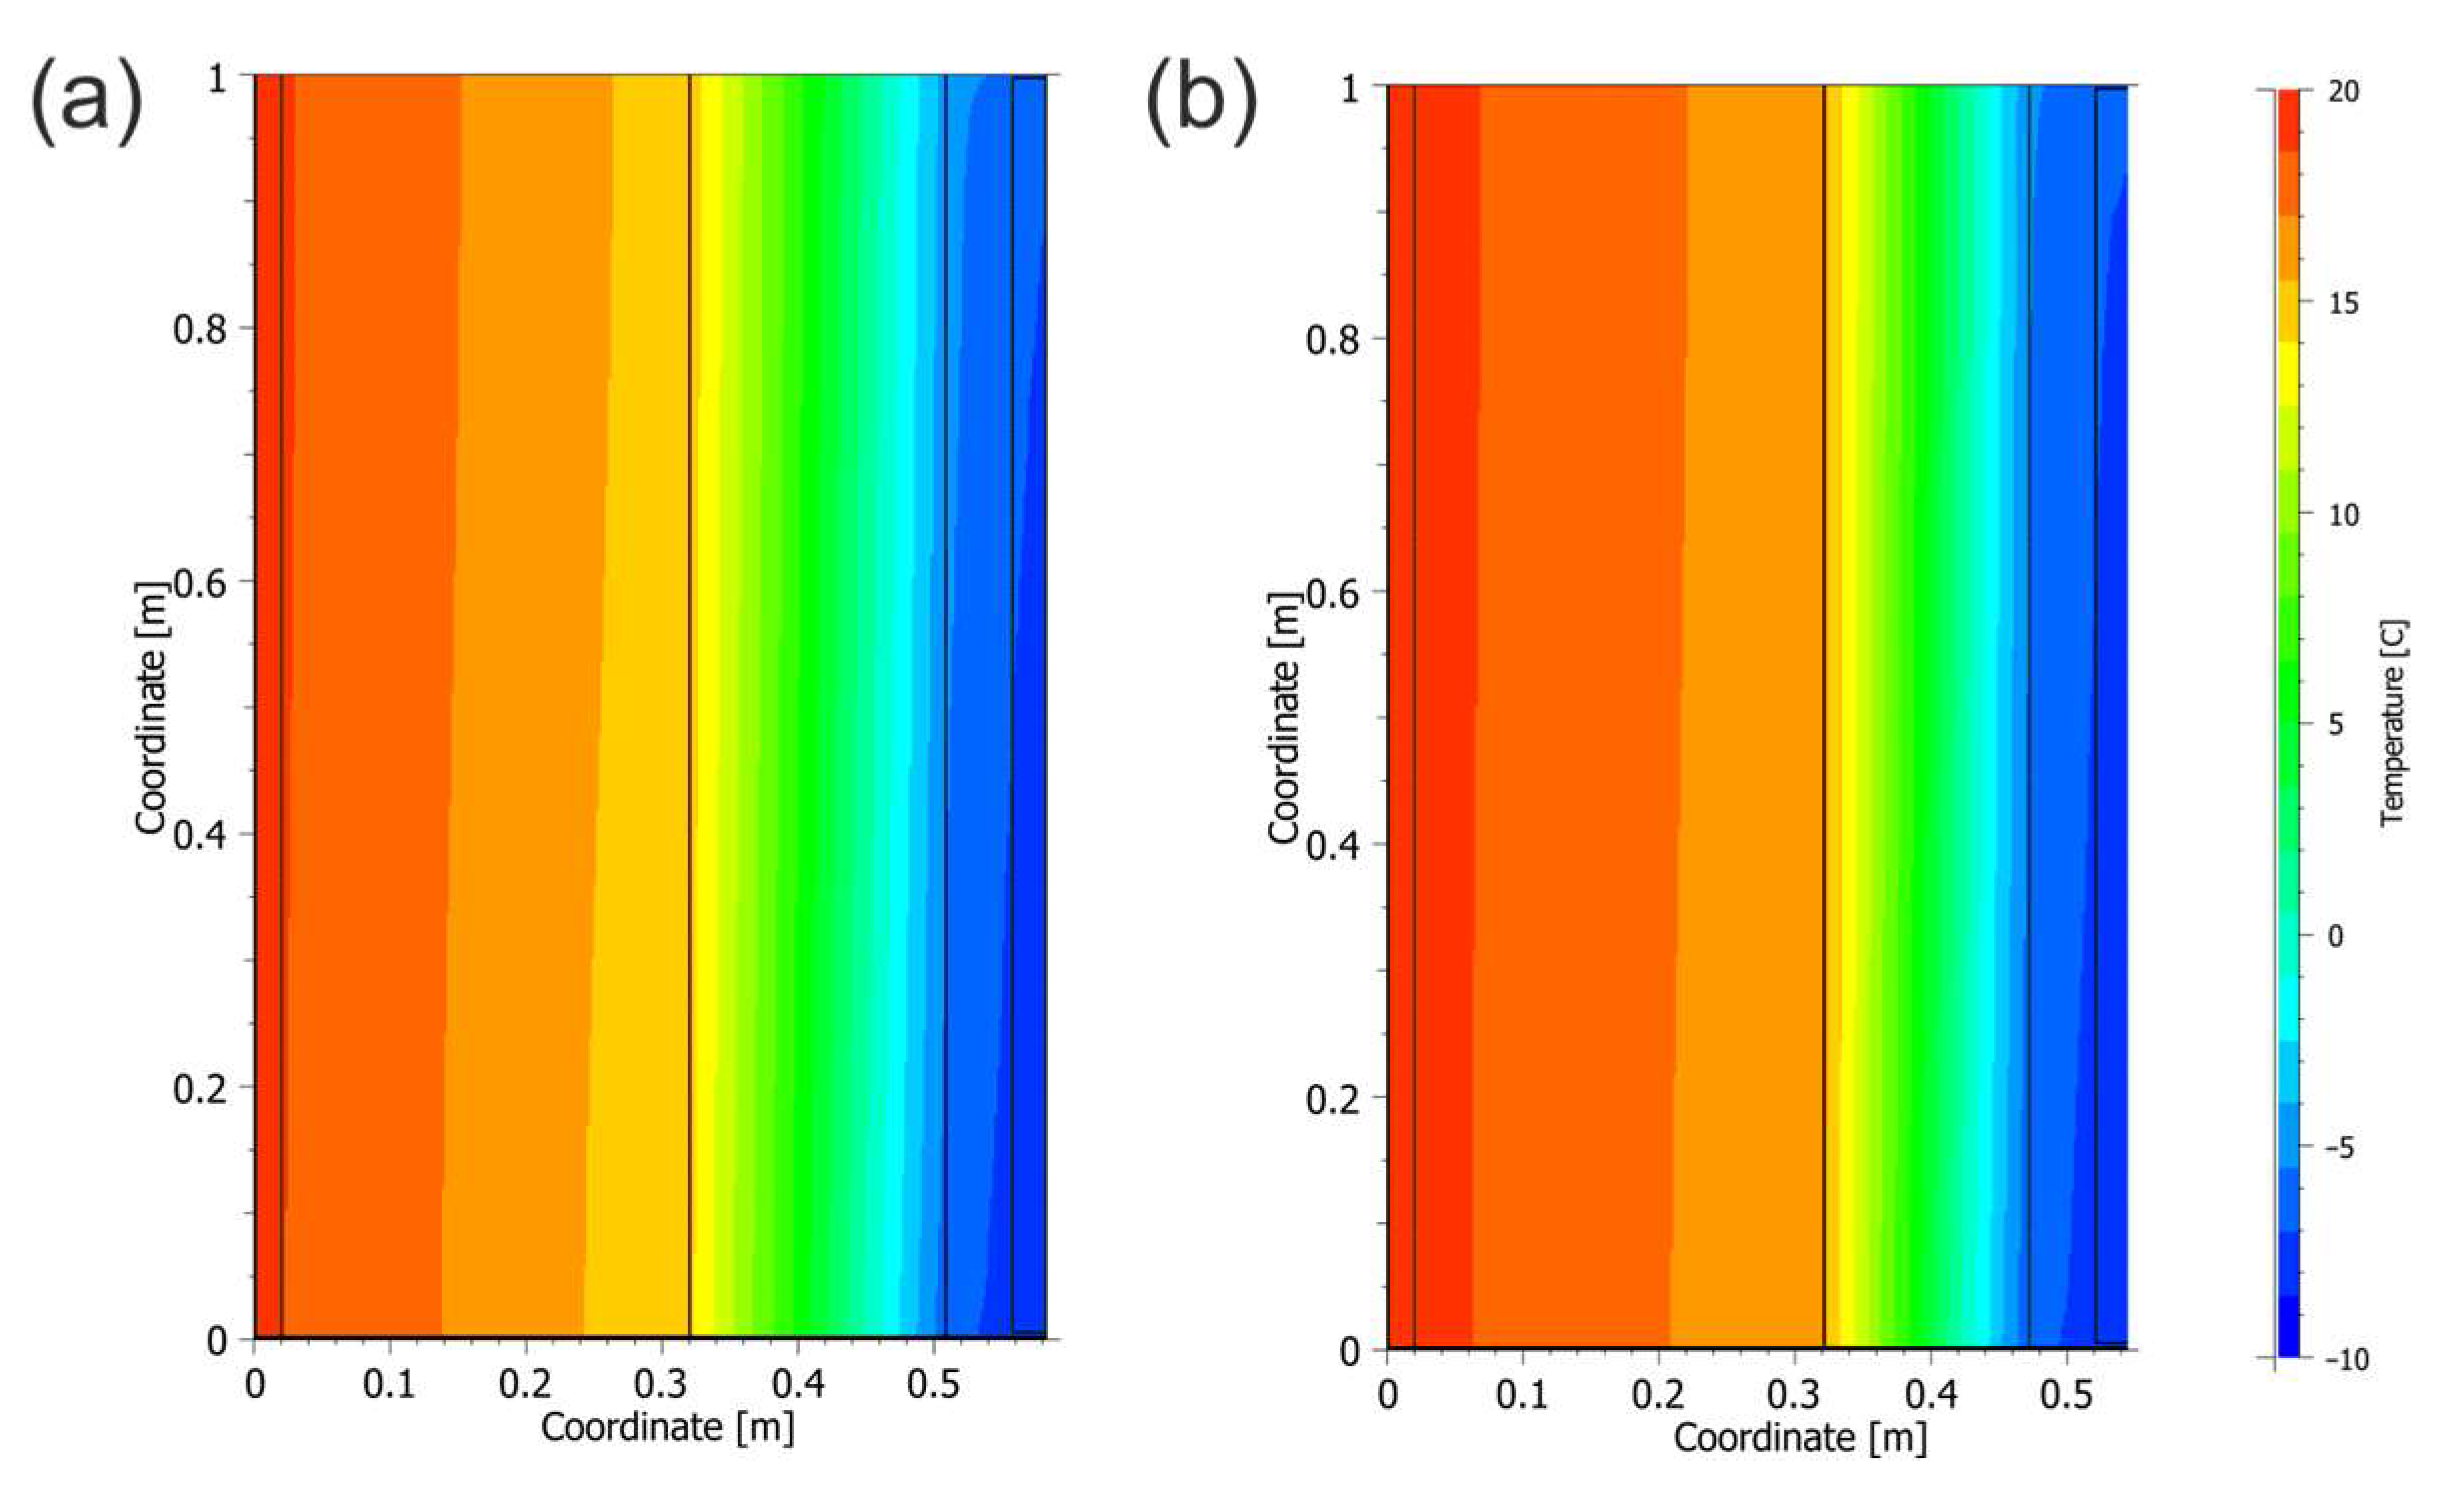
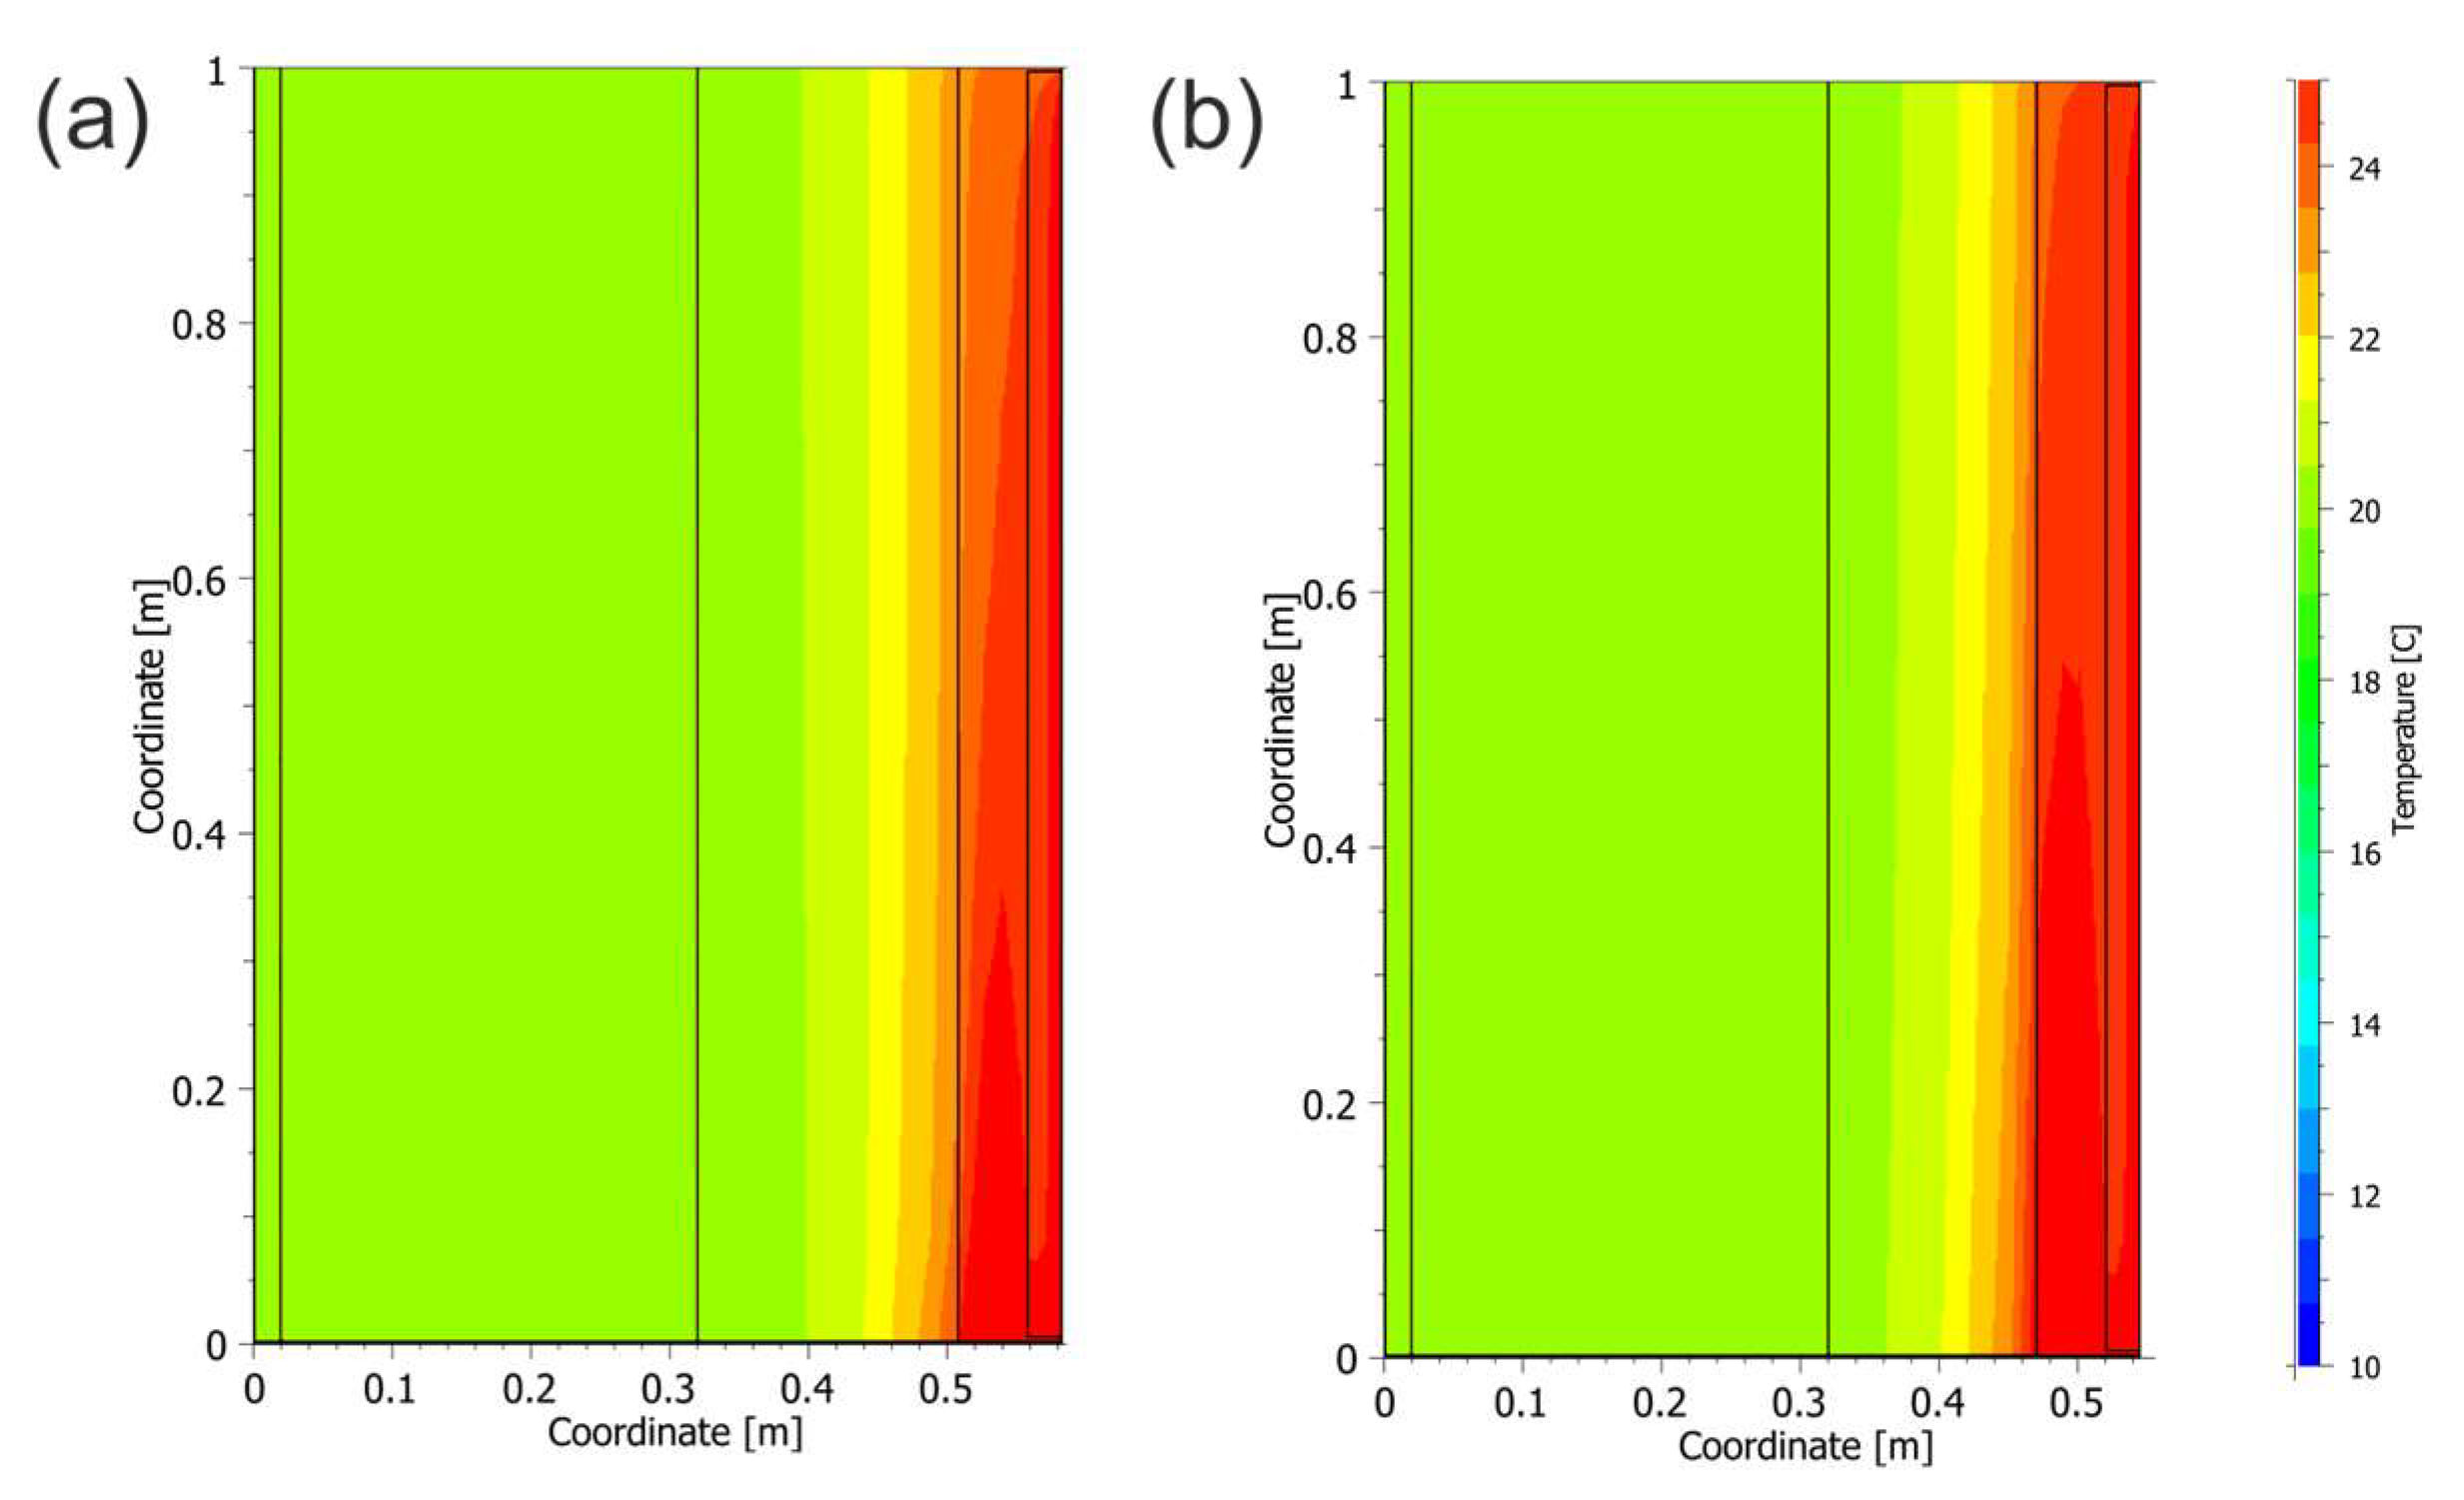
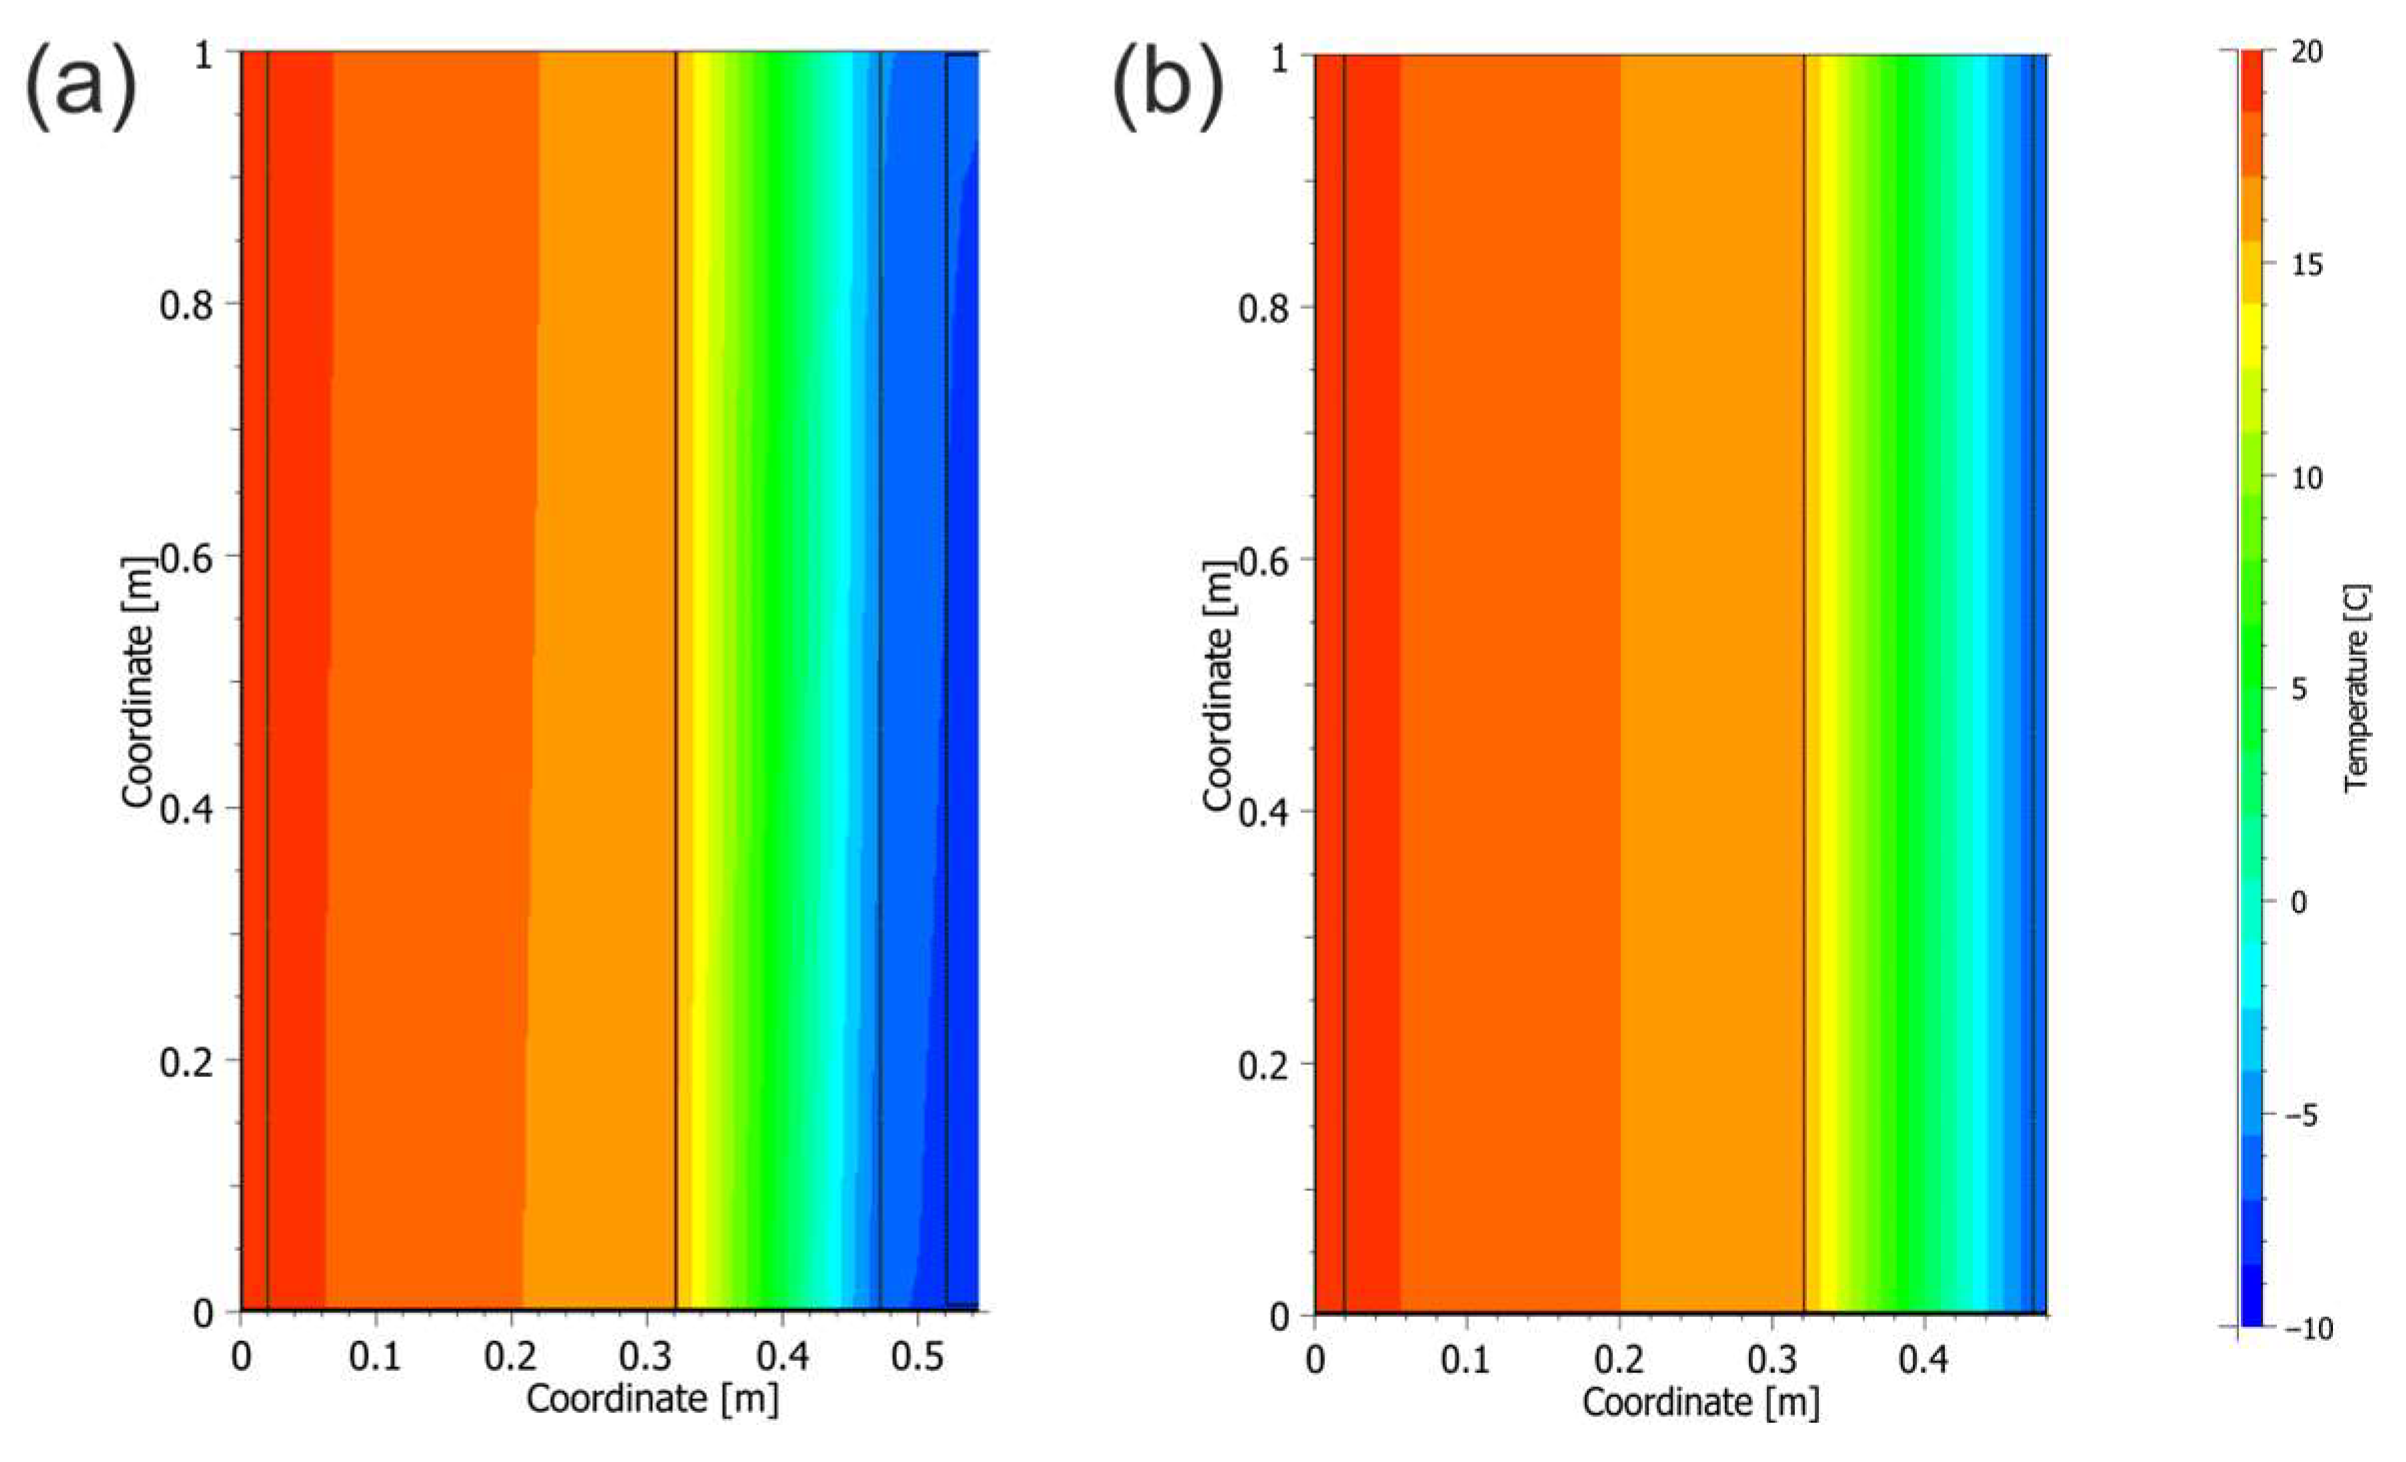
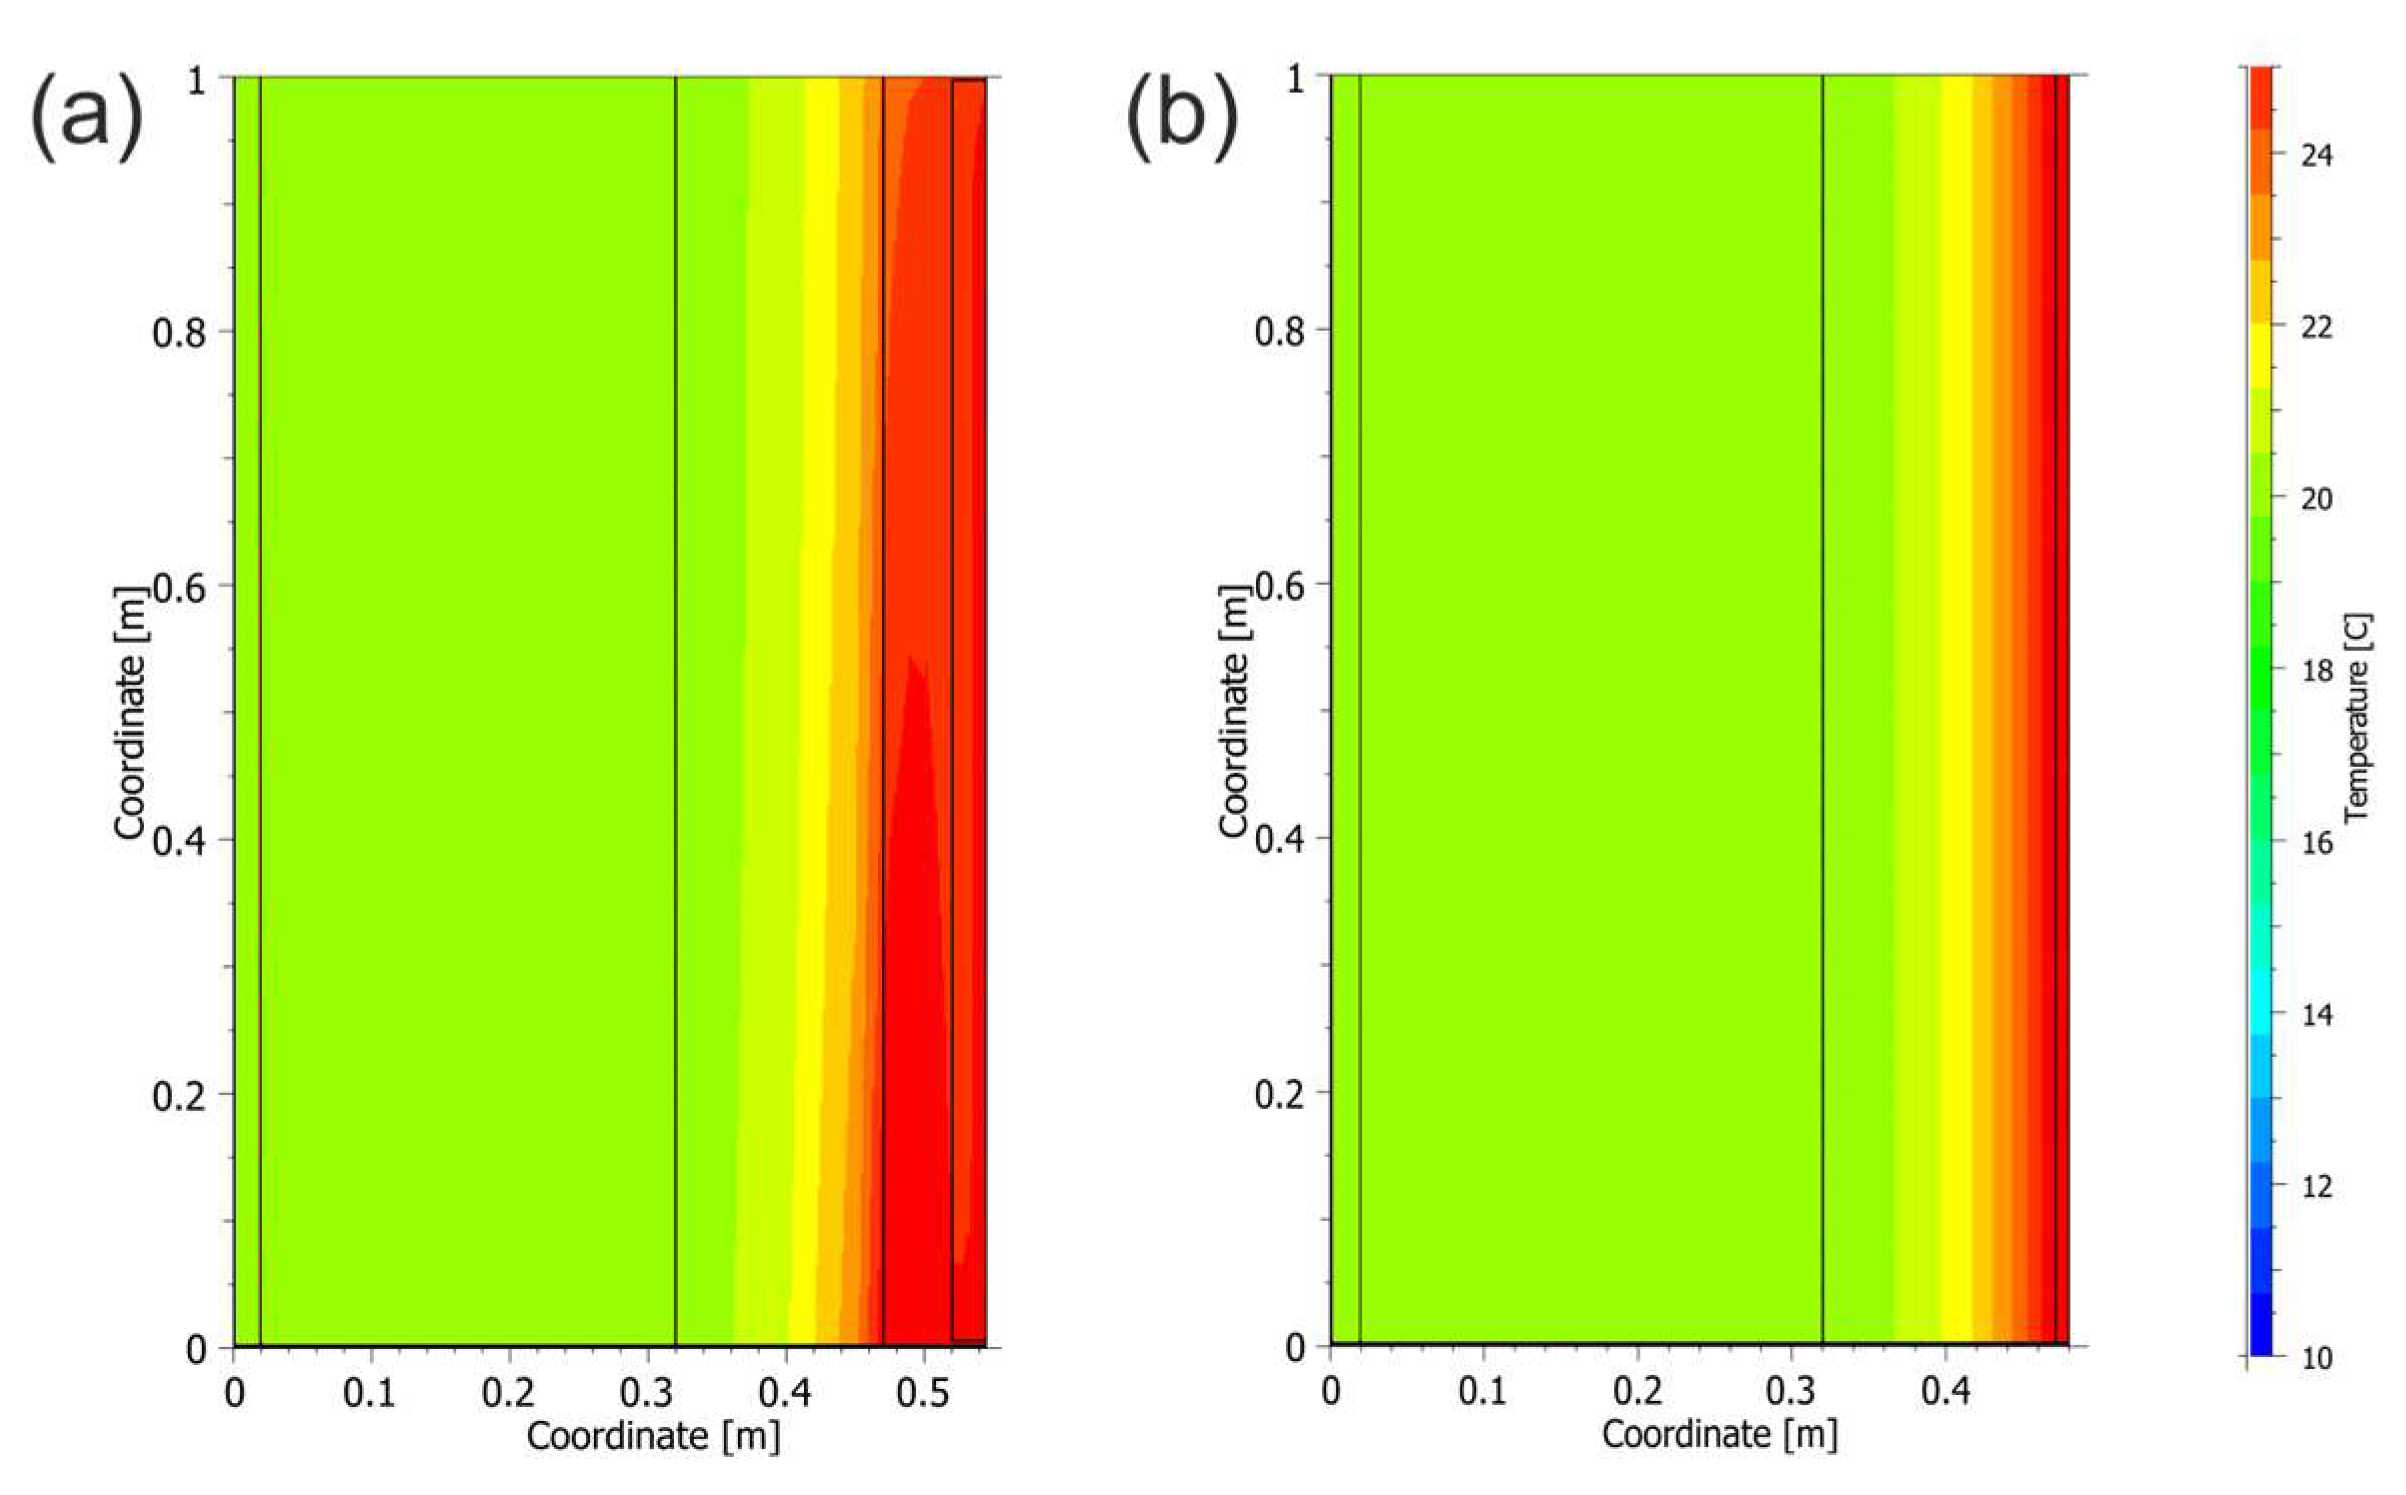
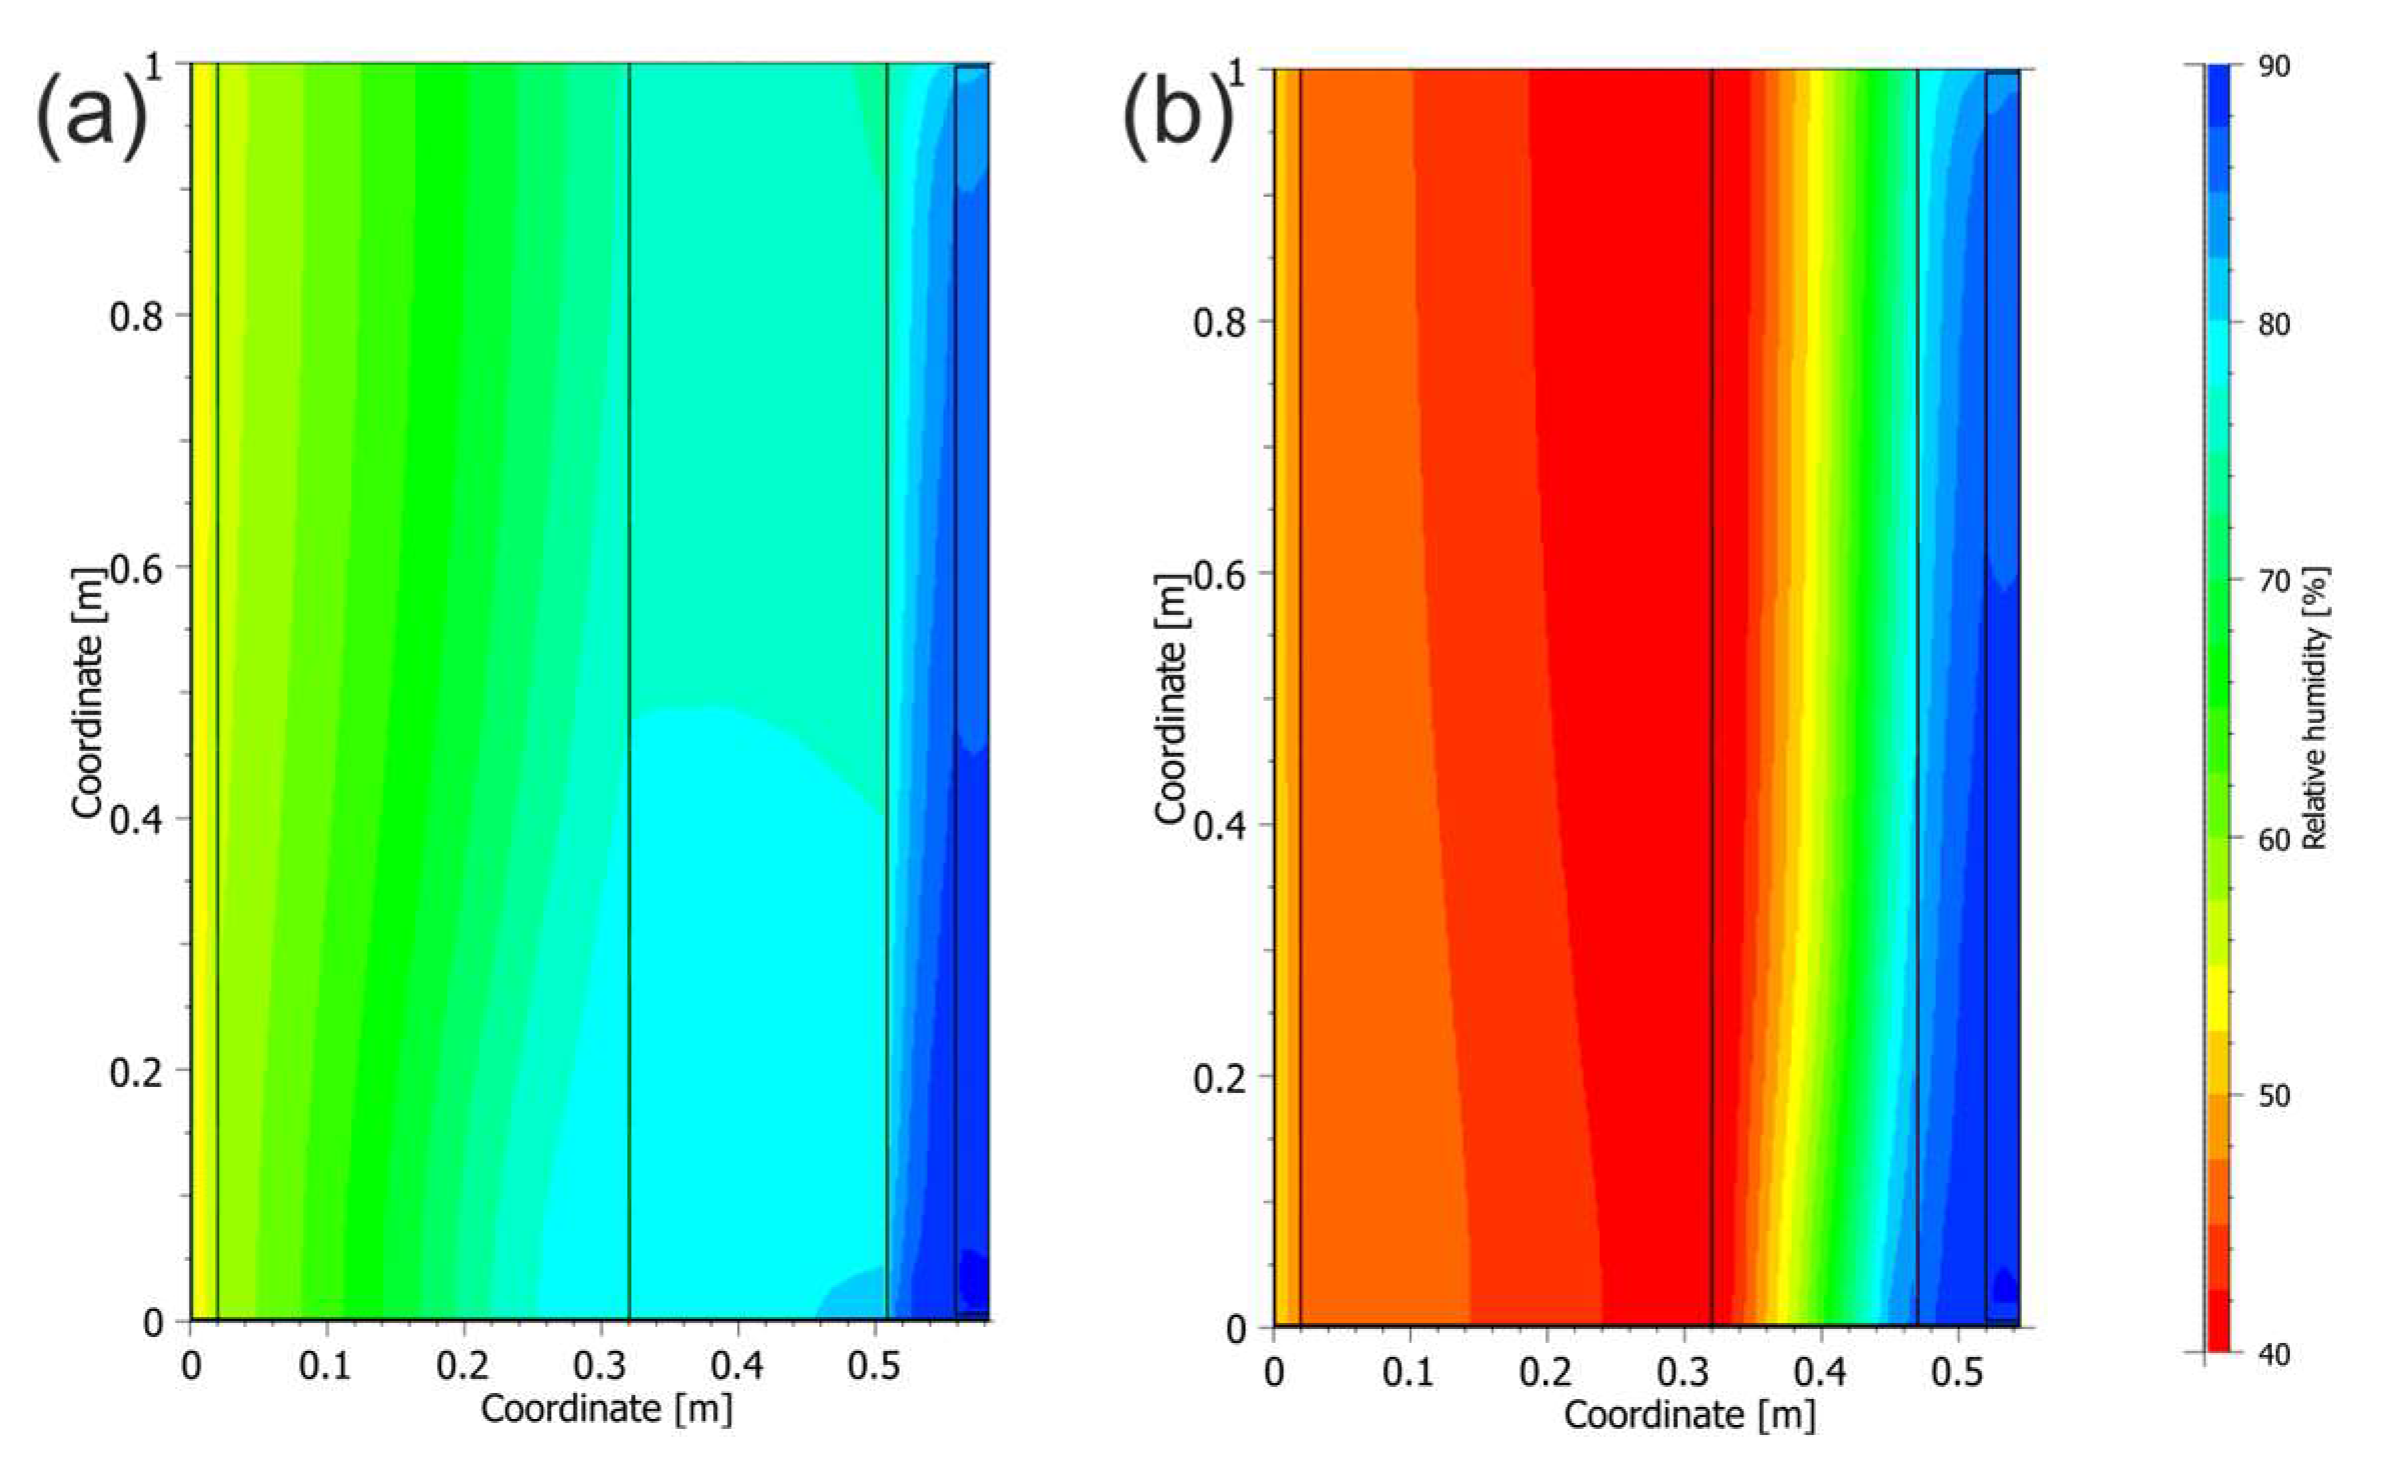
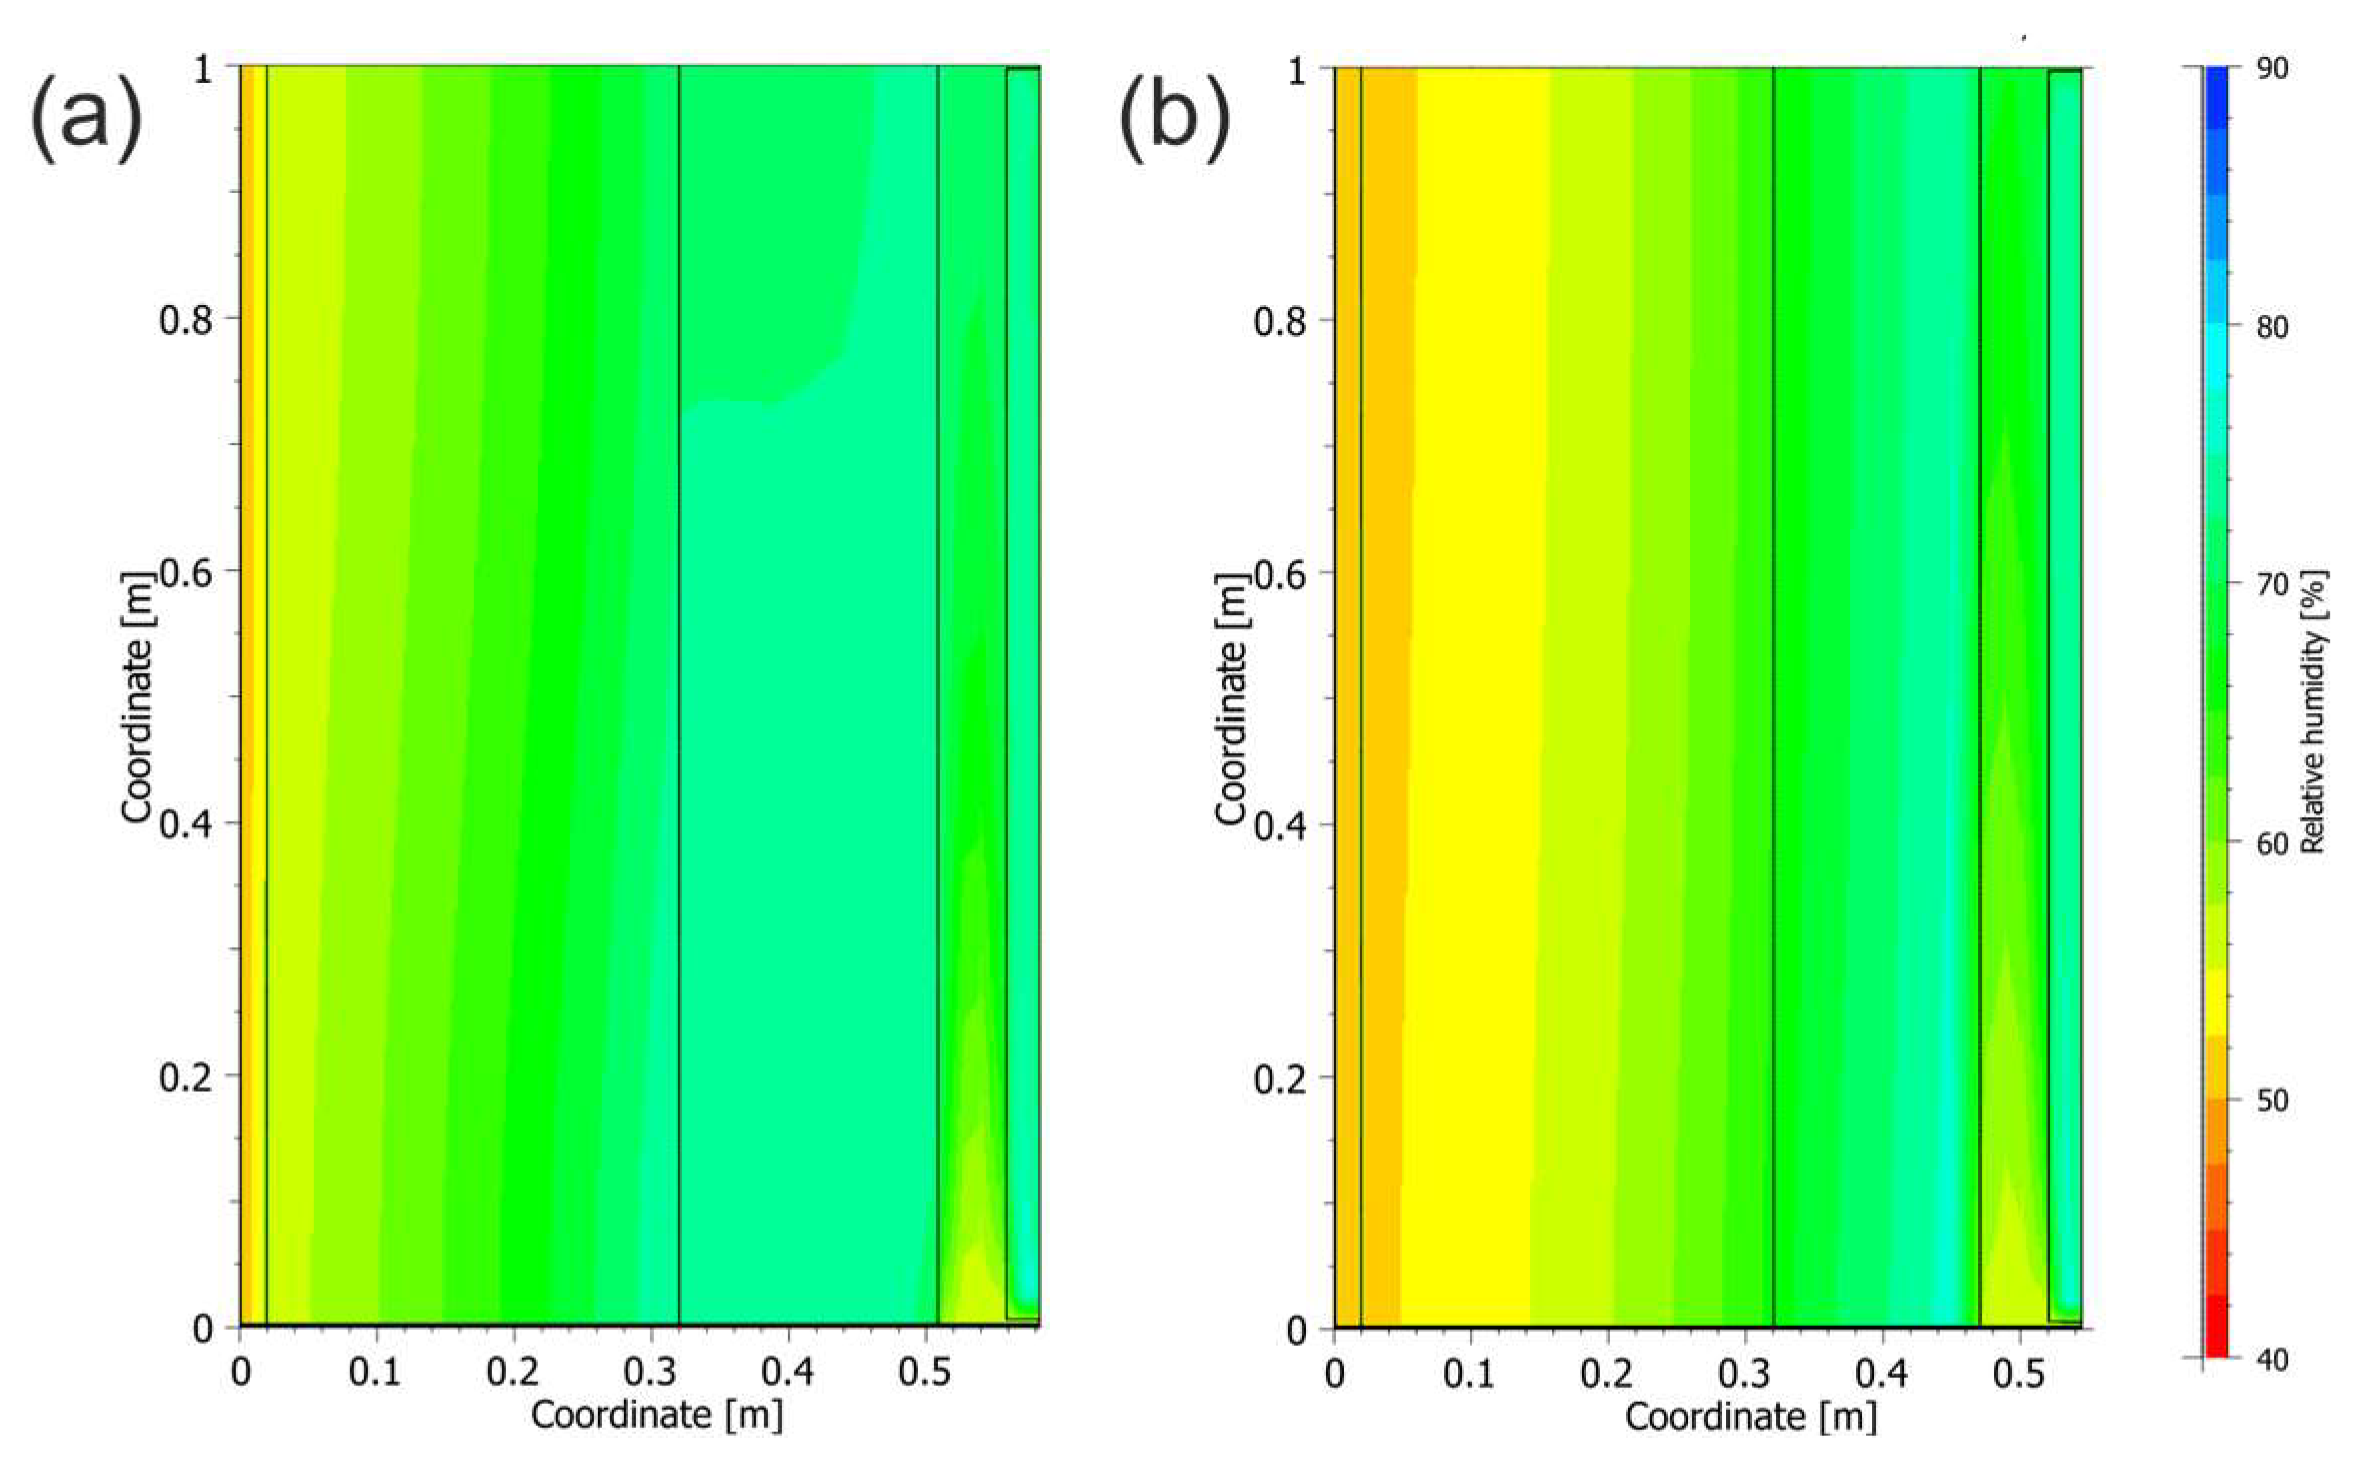
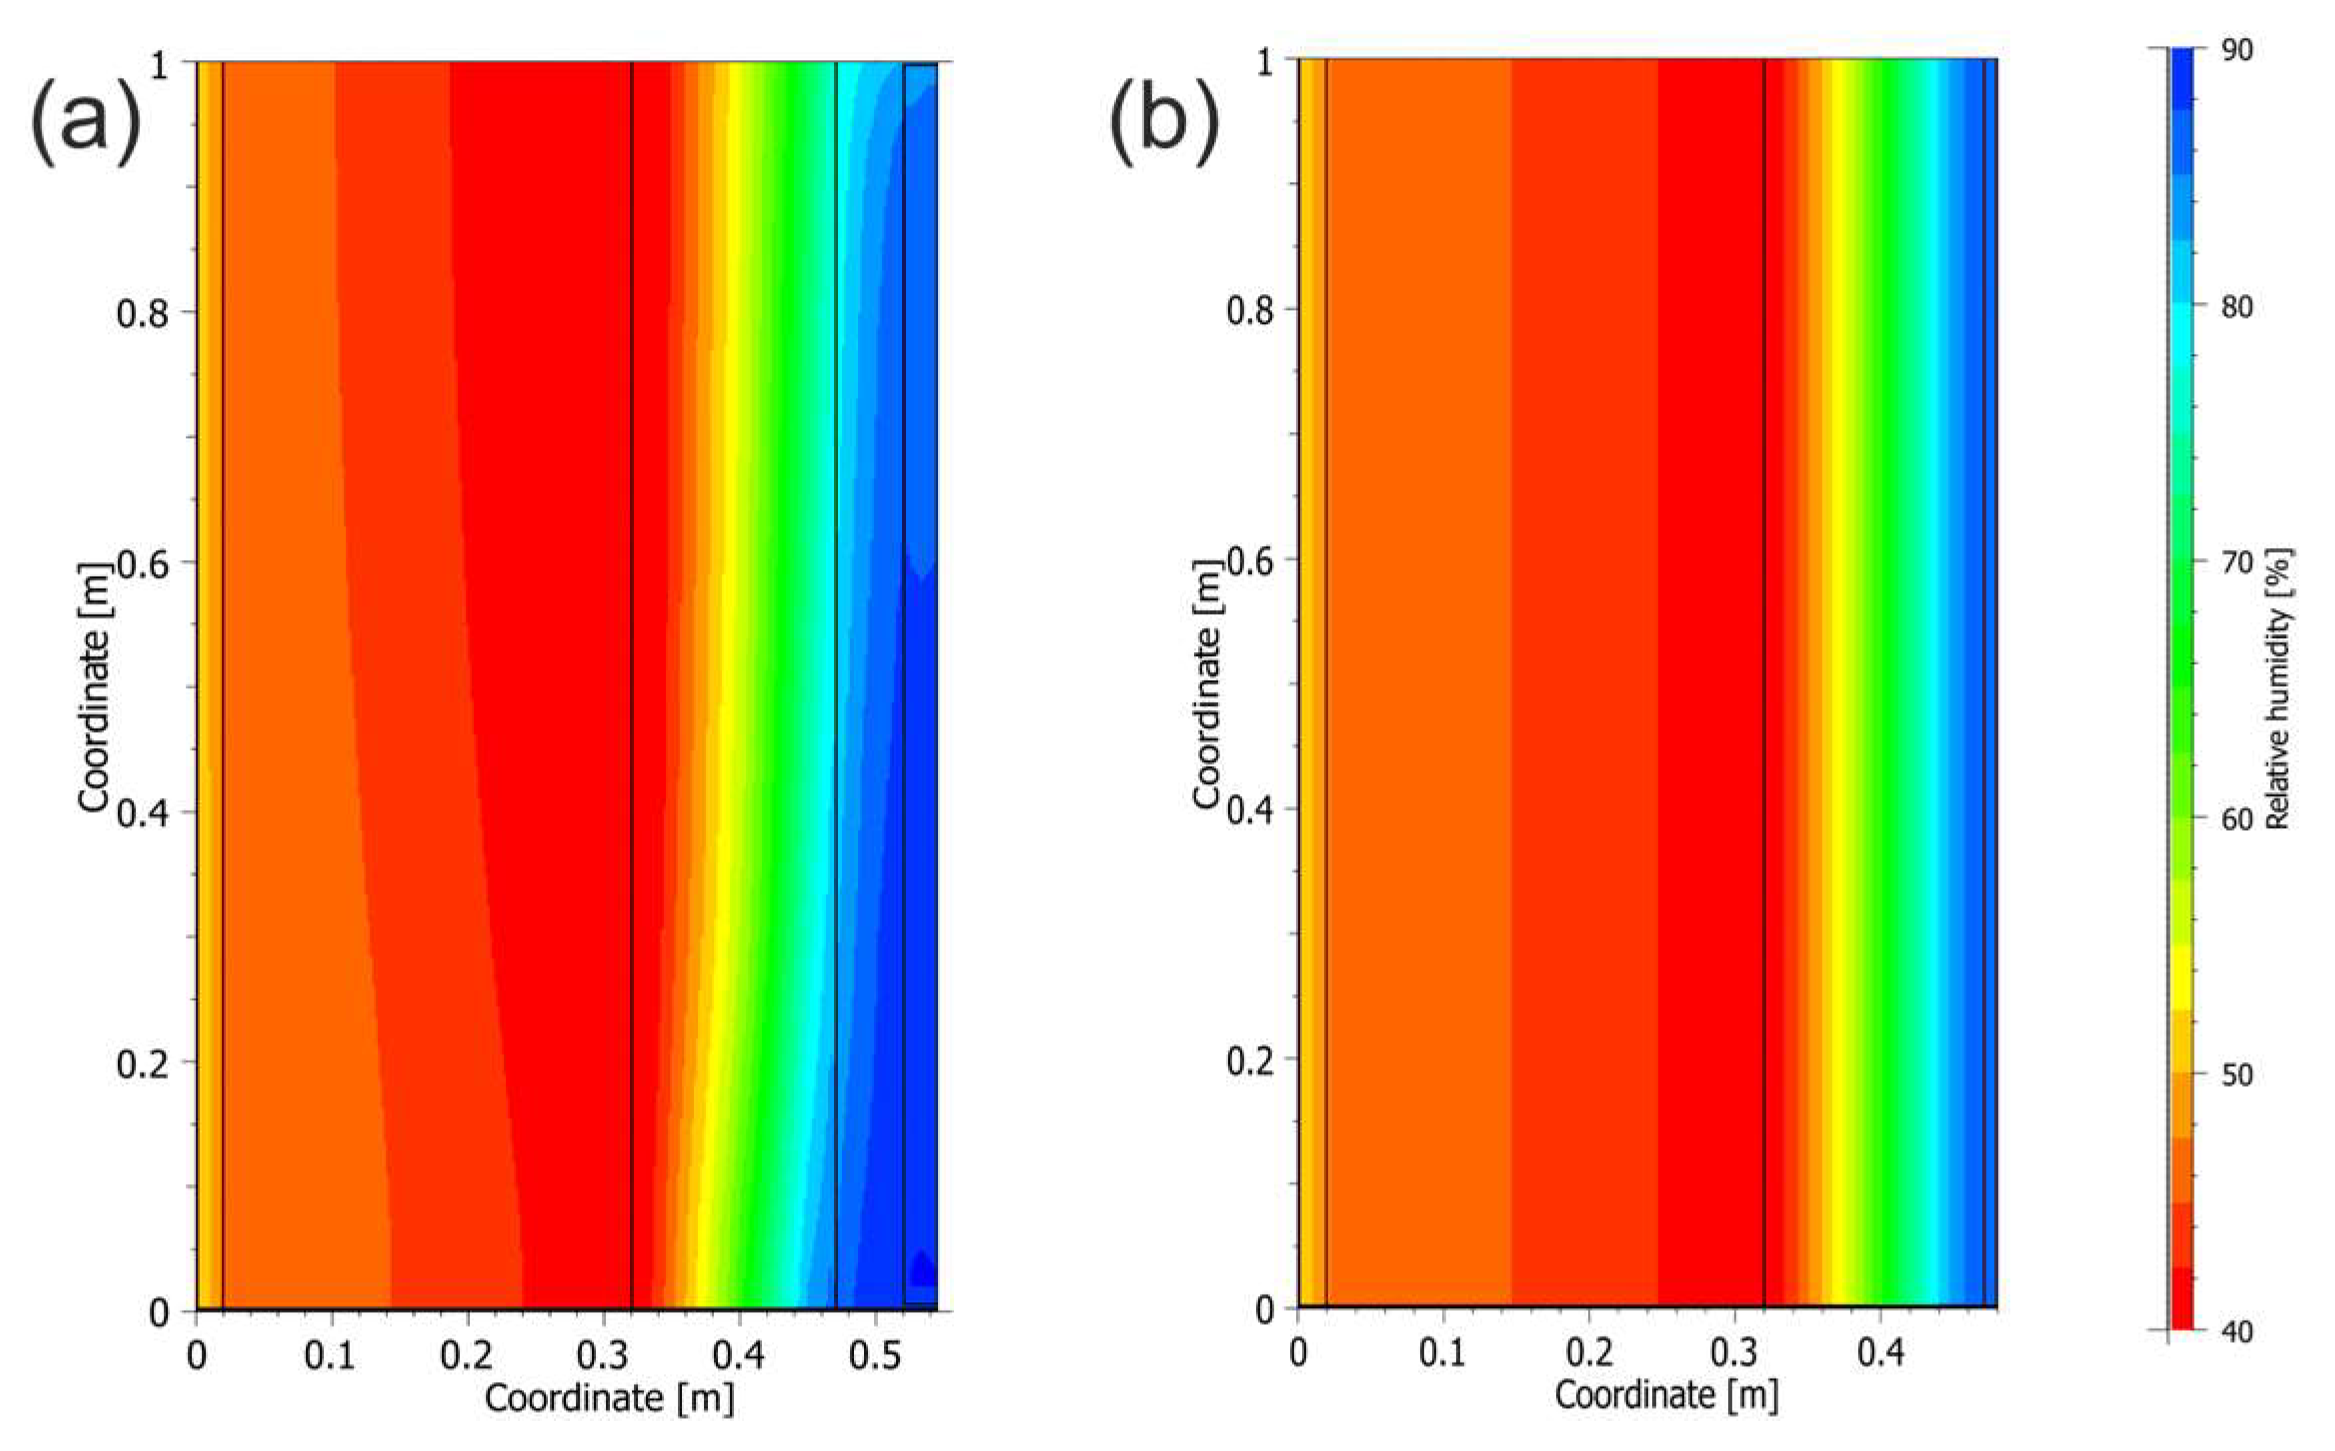
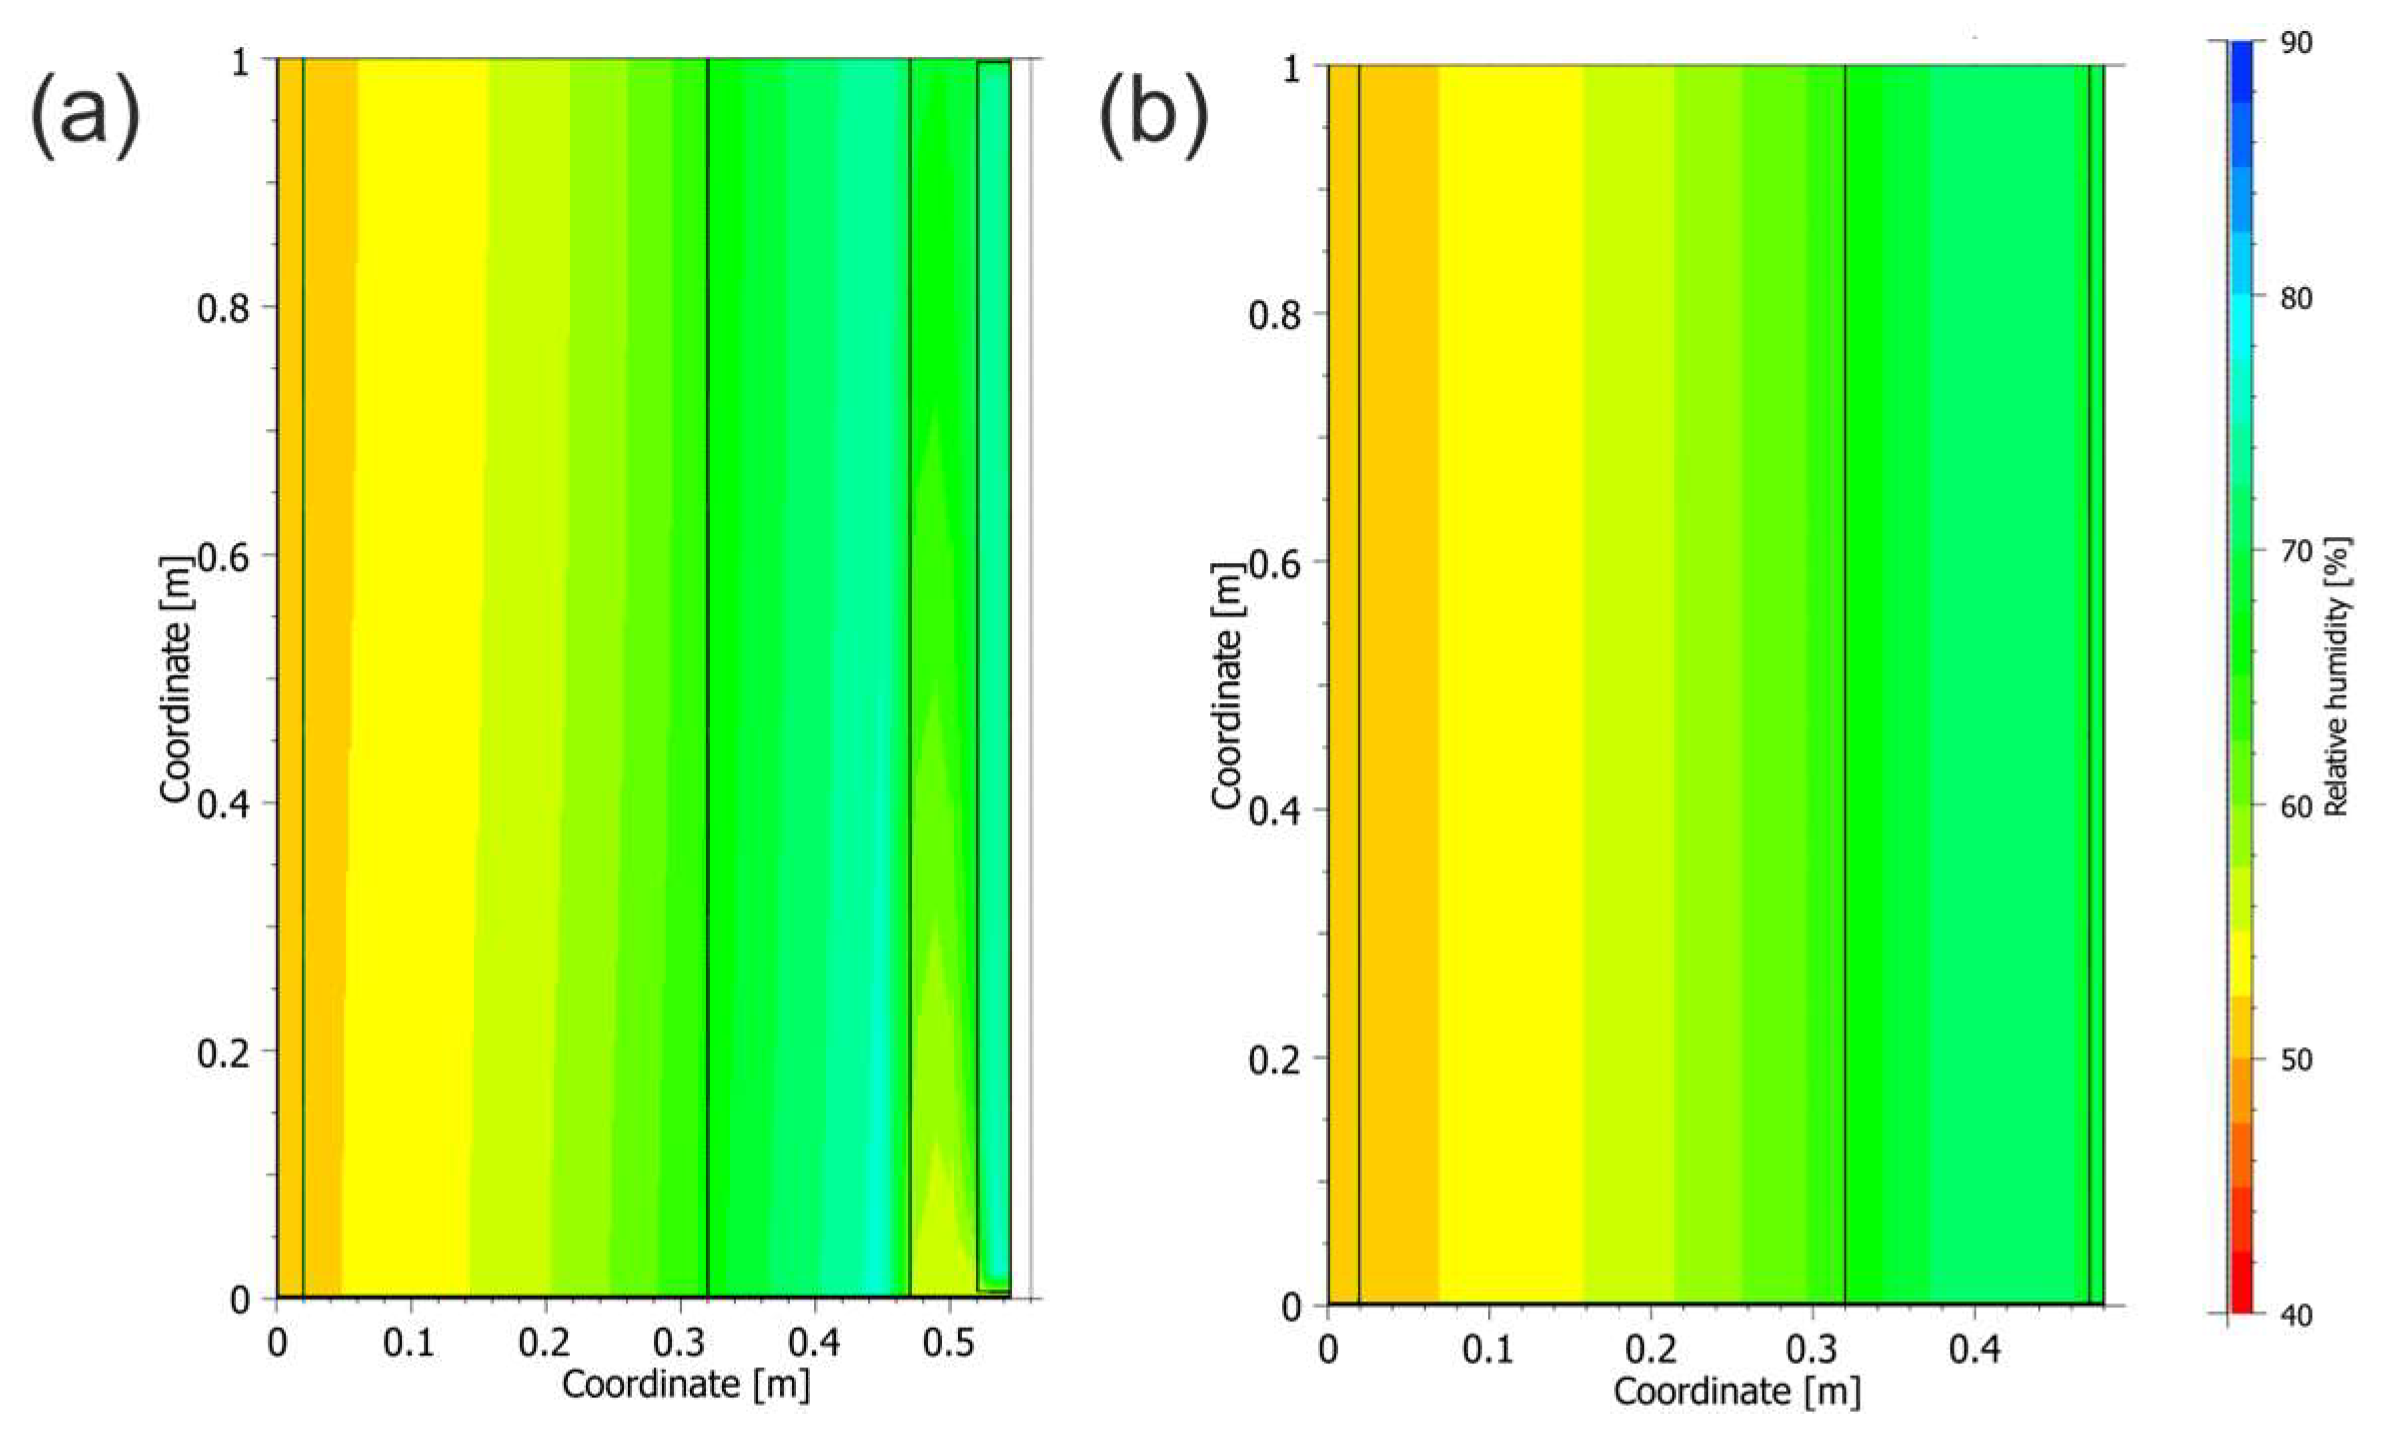
3.1. Temperature Distribution and Relative Humidity
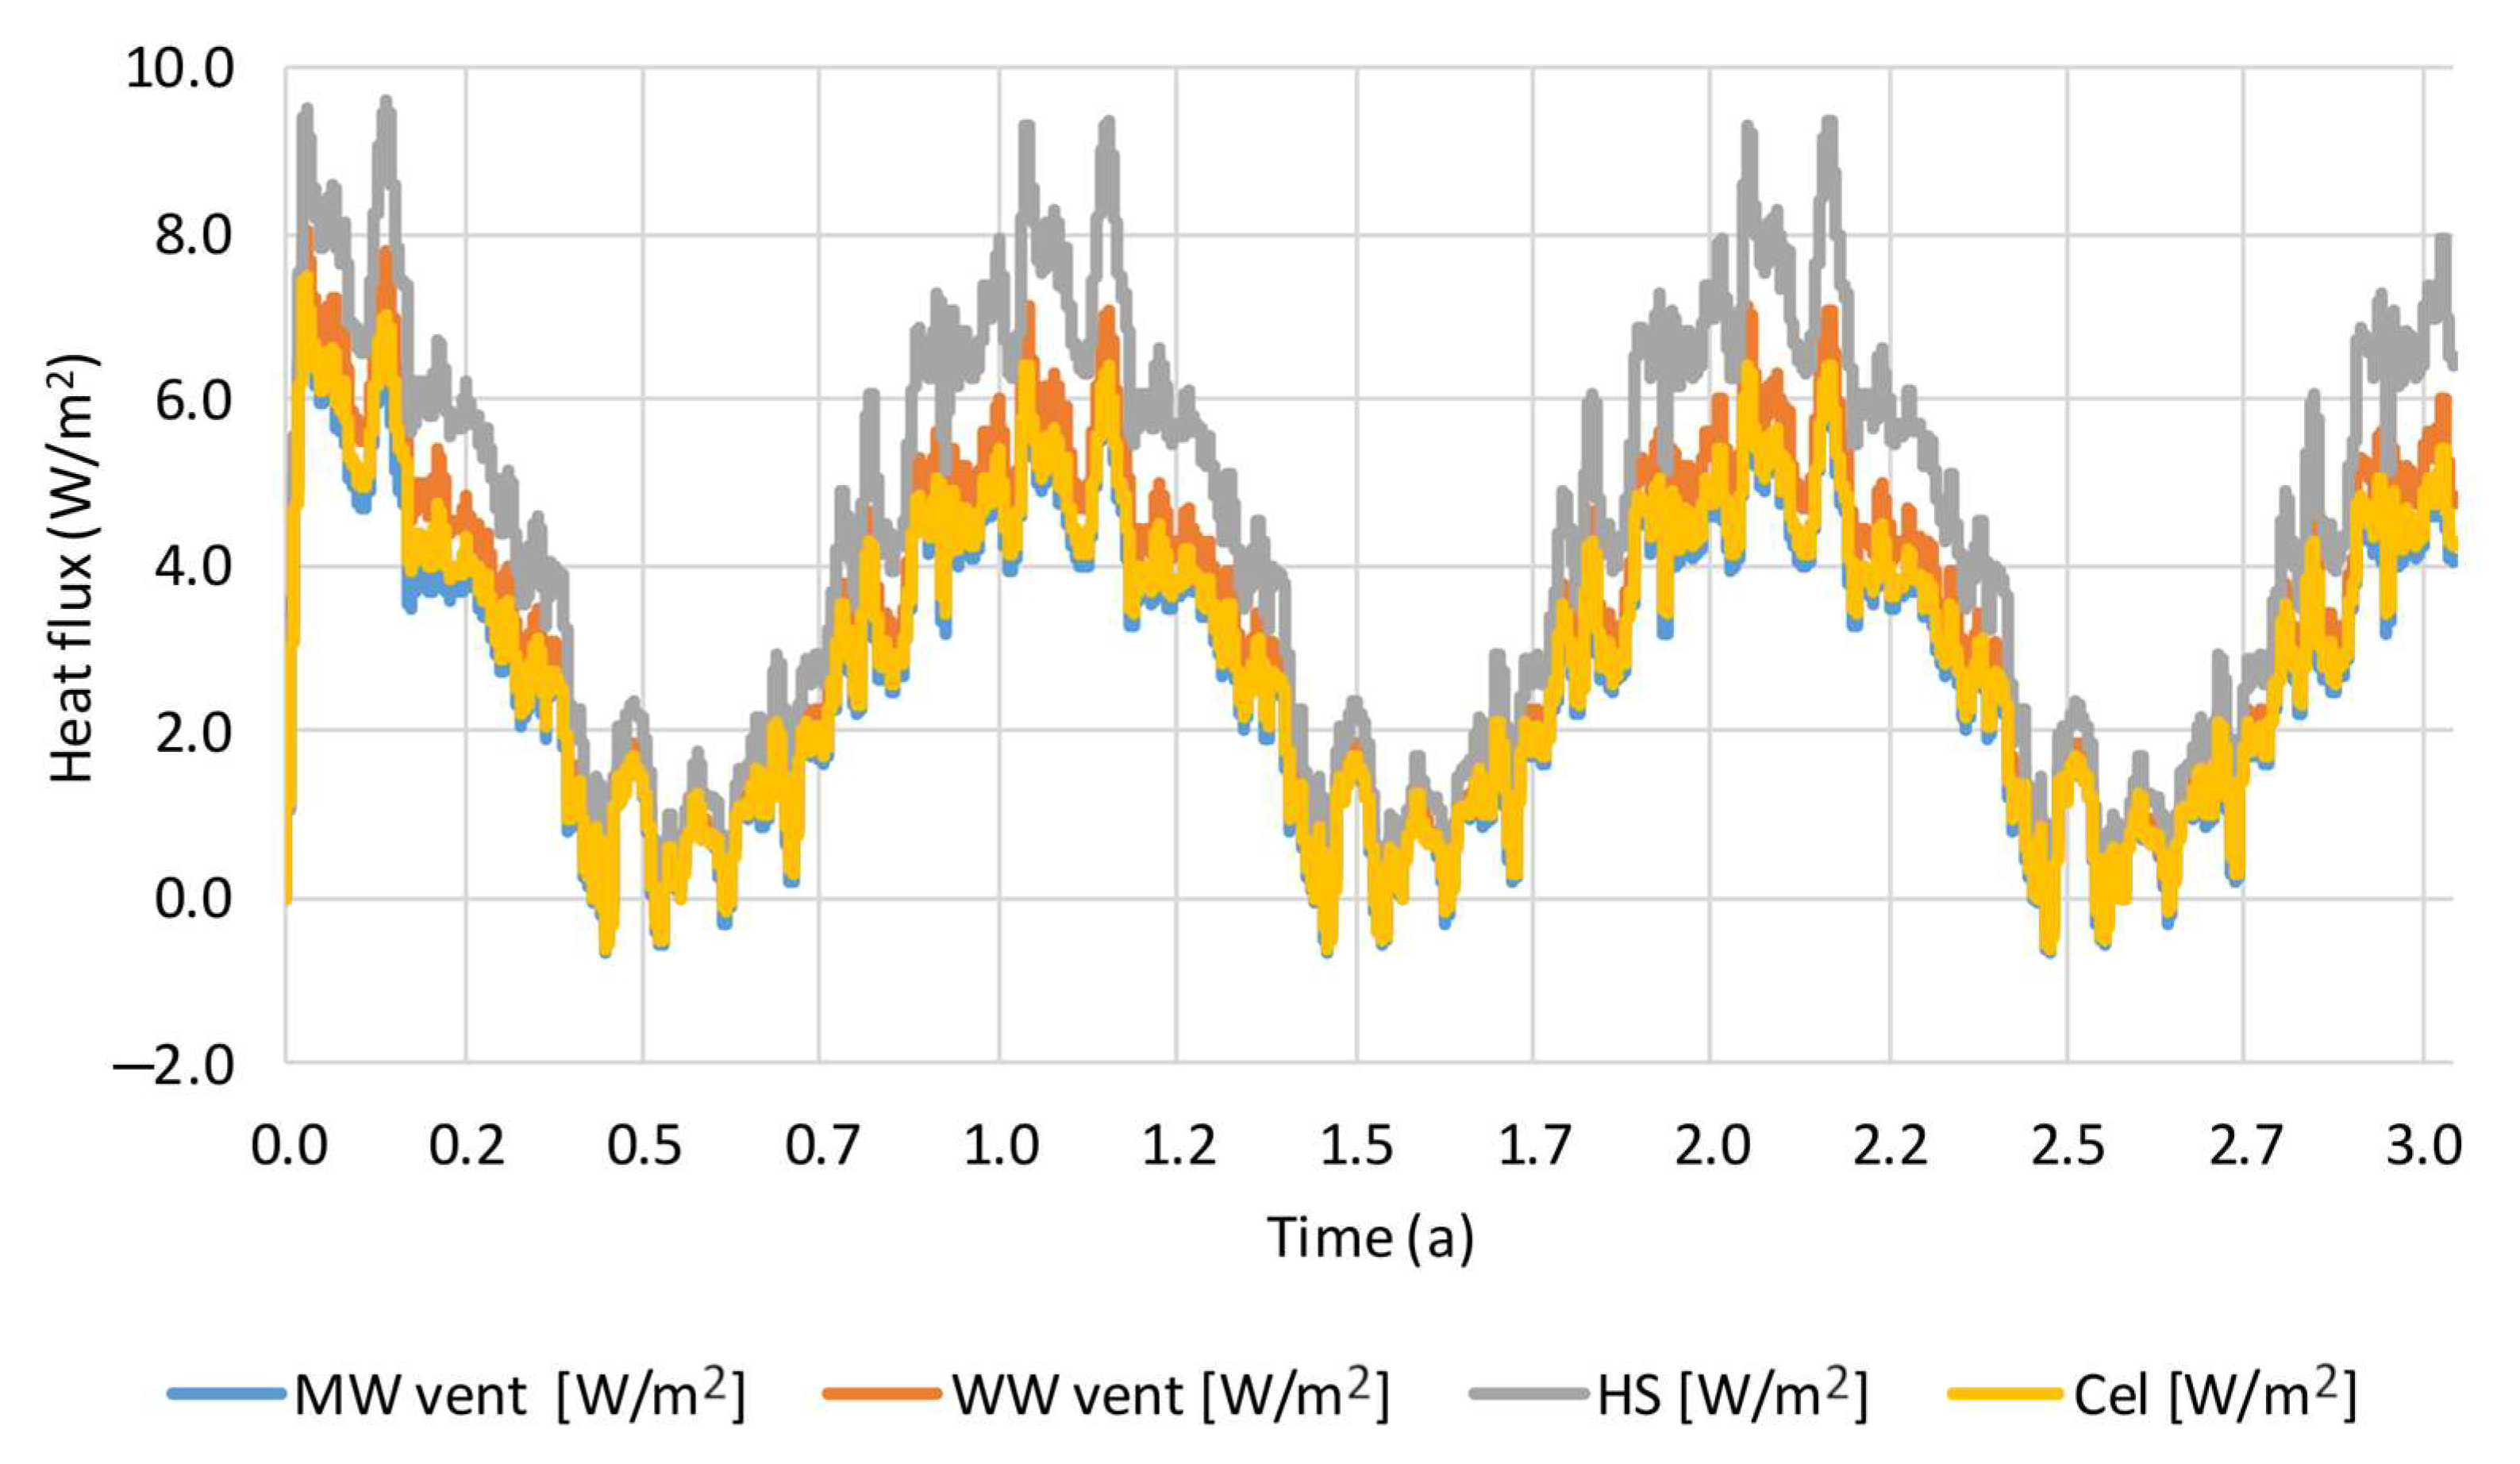
The temperature and RH distributions in the models are presented below (Figure 4, Figure 5, Figure 6, Figure 7, Figure 8, Figure 9, Figure 10 and Figure 11). The main part of this article presents the results for RE walls insulated with loose HS and WW in the panels. The Figure 4, Figure 5, Figure 6, Figure 7, Figure 8, Figure 9, Figure 10 and Figure 11 include the results for all materials. The results are shown for the coldest day of the typical meteorological year in Olsztyn, January 6th, and for the warmest, July 5th. Figure 4 presents the temperature distribution in the ventilated models on January 6th. The model insulated with HS shows a slightly lower internal surface temperature—by approximately 0.25 °C—compared with the others. In the case of the remaining insulation types, the temperature of the internal layer is nearly identical, at around 19.40 °C.
Figure 5 presents the temperature distribution in the ventilated models on July 5th. All models have nearly the same internal layer temperature: approximately 20.00 °C.
Figure 6 presents a comparison of temperature distribution between the ventilated and plastered models insulated with WW on the coldest day, January 6th. The temperature distribution of the internal surface is nearly identical. The presence of a ventilated cavity does not significantly affect the thermal distribution within the RE layer.
Figure 7 presents a comparison of temperature distribution between the ventilated and plastered models insulated with WW on the warmest day, July 5th. The presence of a ventilated gap slightly increases the temperature of the thermal insulation, warming it up. This may have a positive effect of removing excess moisture accumulated in the wall during the winter.
Table 2 presents the temperature results measured at characteristic points—on the internal surface of the wall and at the junction between the rammed earth and the thermal insulation. In the model insulated with HS, the temperature is the lowest in all analyzed cases. In winter, this contributes to greater heat loss, while in summer, it can have a positive effect on reducing overheating in the room. In the models insulated with WW, the beneficial effect of the plaster on the temperature of the RE layer is noticeable during the winter period.
Figure 8 presents the RH distribution in the ventilated models on January 6th. The highest RH is observed in the RE wall insulated with HS, and the lowest in the wall insulated with MW. The models insulated with CF, MW, and WW show that the thermal insulation draws a significant amount of moisture from the RE layer. Higher RH levels occur at the inner edge of the RE layer in these models compared with its middle. CF and WW, being highly hygroscopic materials, absorb a large amount of moisture, which causes the RE layers to remain at a higher RH level than in the case of MW insulation. MW, as a material with low hygroscopic capacity, contributes to lower RH in the RE layer. The RH in the RE layer is maintained within the range of 58–80% for HS insulation, 31–46% for CF, 25–45% for MW, and 38–47% for WW.
Figure 9 presents the RH distribution in the ventilated models on July 5th. The highest RH still occurs in the wall insulated with HS, while the lowest is observed in the wall insulated with CF. In all models, the lowest RH values occur at the inner edge of the RE layer. The RH in the RE layer is maintained within the following ranges: 56–74% for HS insulation, 51–64% for CF, 52–72% for MW, and 52–66% for WW.
Figure 10 presents a comparison of RH distribution between the ventilated and plastered models insulated with WW on the coldest day, January 6th. The RH distribution in the models is not visibly affected by the presence of a ventilated cavity. The RH ranges recorded in the RE layer are similar in the corresponding models, regardless of whether they are ventilated or plastered.
Figure 11 presents a comparison of the RH distribution between the ventilated and plastered models insulated with WW on the warmest day, July 5th. The drying effect of the ventilated gap on moisture distribution in the RE layer is noticeable. The models with external plaster are characterized by a slightly higher RH. Importantly, the ventilated gap directly dries the thermal insulation layer, increasing its capacity to absorb moisture from the RE layer.
Table 3 presents the relative humidity calculated in the RE layer for all models in both ventilated and plastered configurations. Walls insulated with CF, WW, and MW absorb more moisture in summer than in winter. In contrast, the wall insulated with HS tends to have lower humidity in summer.

3.2. Heat Flux

Figure 12 presents the heat flux (HF) calculated for the ventilated models insulated with CF, HS, MW, and WW. In all analyzed cases, stabilization occurs starting from the second year of simulation, and HF variations become repeatable in the following year. It is noticeable that HF decreases during the summer and increases in the winter. The highest HF values are observed for the wall insulated with HS (max HF = 9.37 W/m2), followed by WW (7.11 W/m2), CF (6.42 W/m2), and MW (6.40 W/m2). Conversely, the lowest HF values—indicating heat flow from the outside to the inside—are recorded for MW (−0.68 W/m2), CF (−0.62 W/m2), WW (−0.47 W/m2), and HS (−0.28 W/m2). This means that a wall insulated with HS has, on the one hand, the lowest thermal insulation performance in winter, resulting in greater heat loss, but on the other hand, it is more effective at limiting excess heat from entering the interior during summer.
Figure 13 presents a comparison of the HF calculated for the ventilated and plastered models insulated with MW and WW. In the models with a ventilated layer, lower HF values were recorded compared with those in which the thermal insulation was covered with lime plaster. For MW, the difference is approximately 2%, and for WW, around 4%. The maximum HF values for plastered configurations are as follows: for MW (6.46 W/m2), for WW (7.48 W/m2), while the minimum values were for MW (−0.55 W/m2) and for WW (−0.45 W/m2).

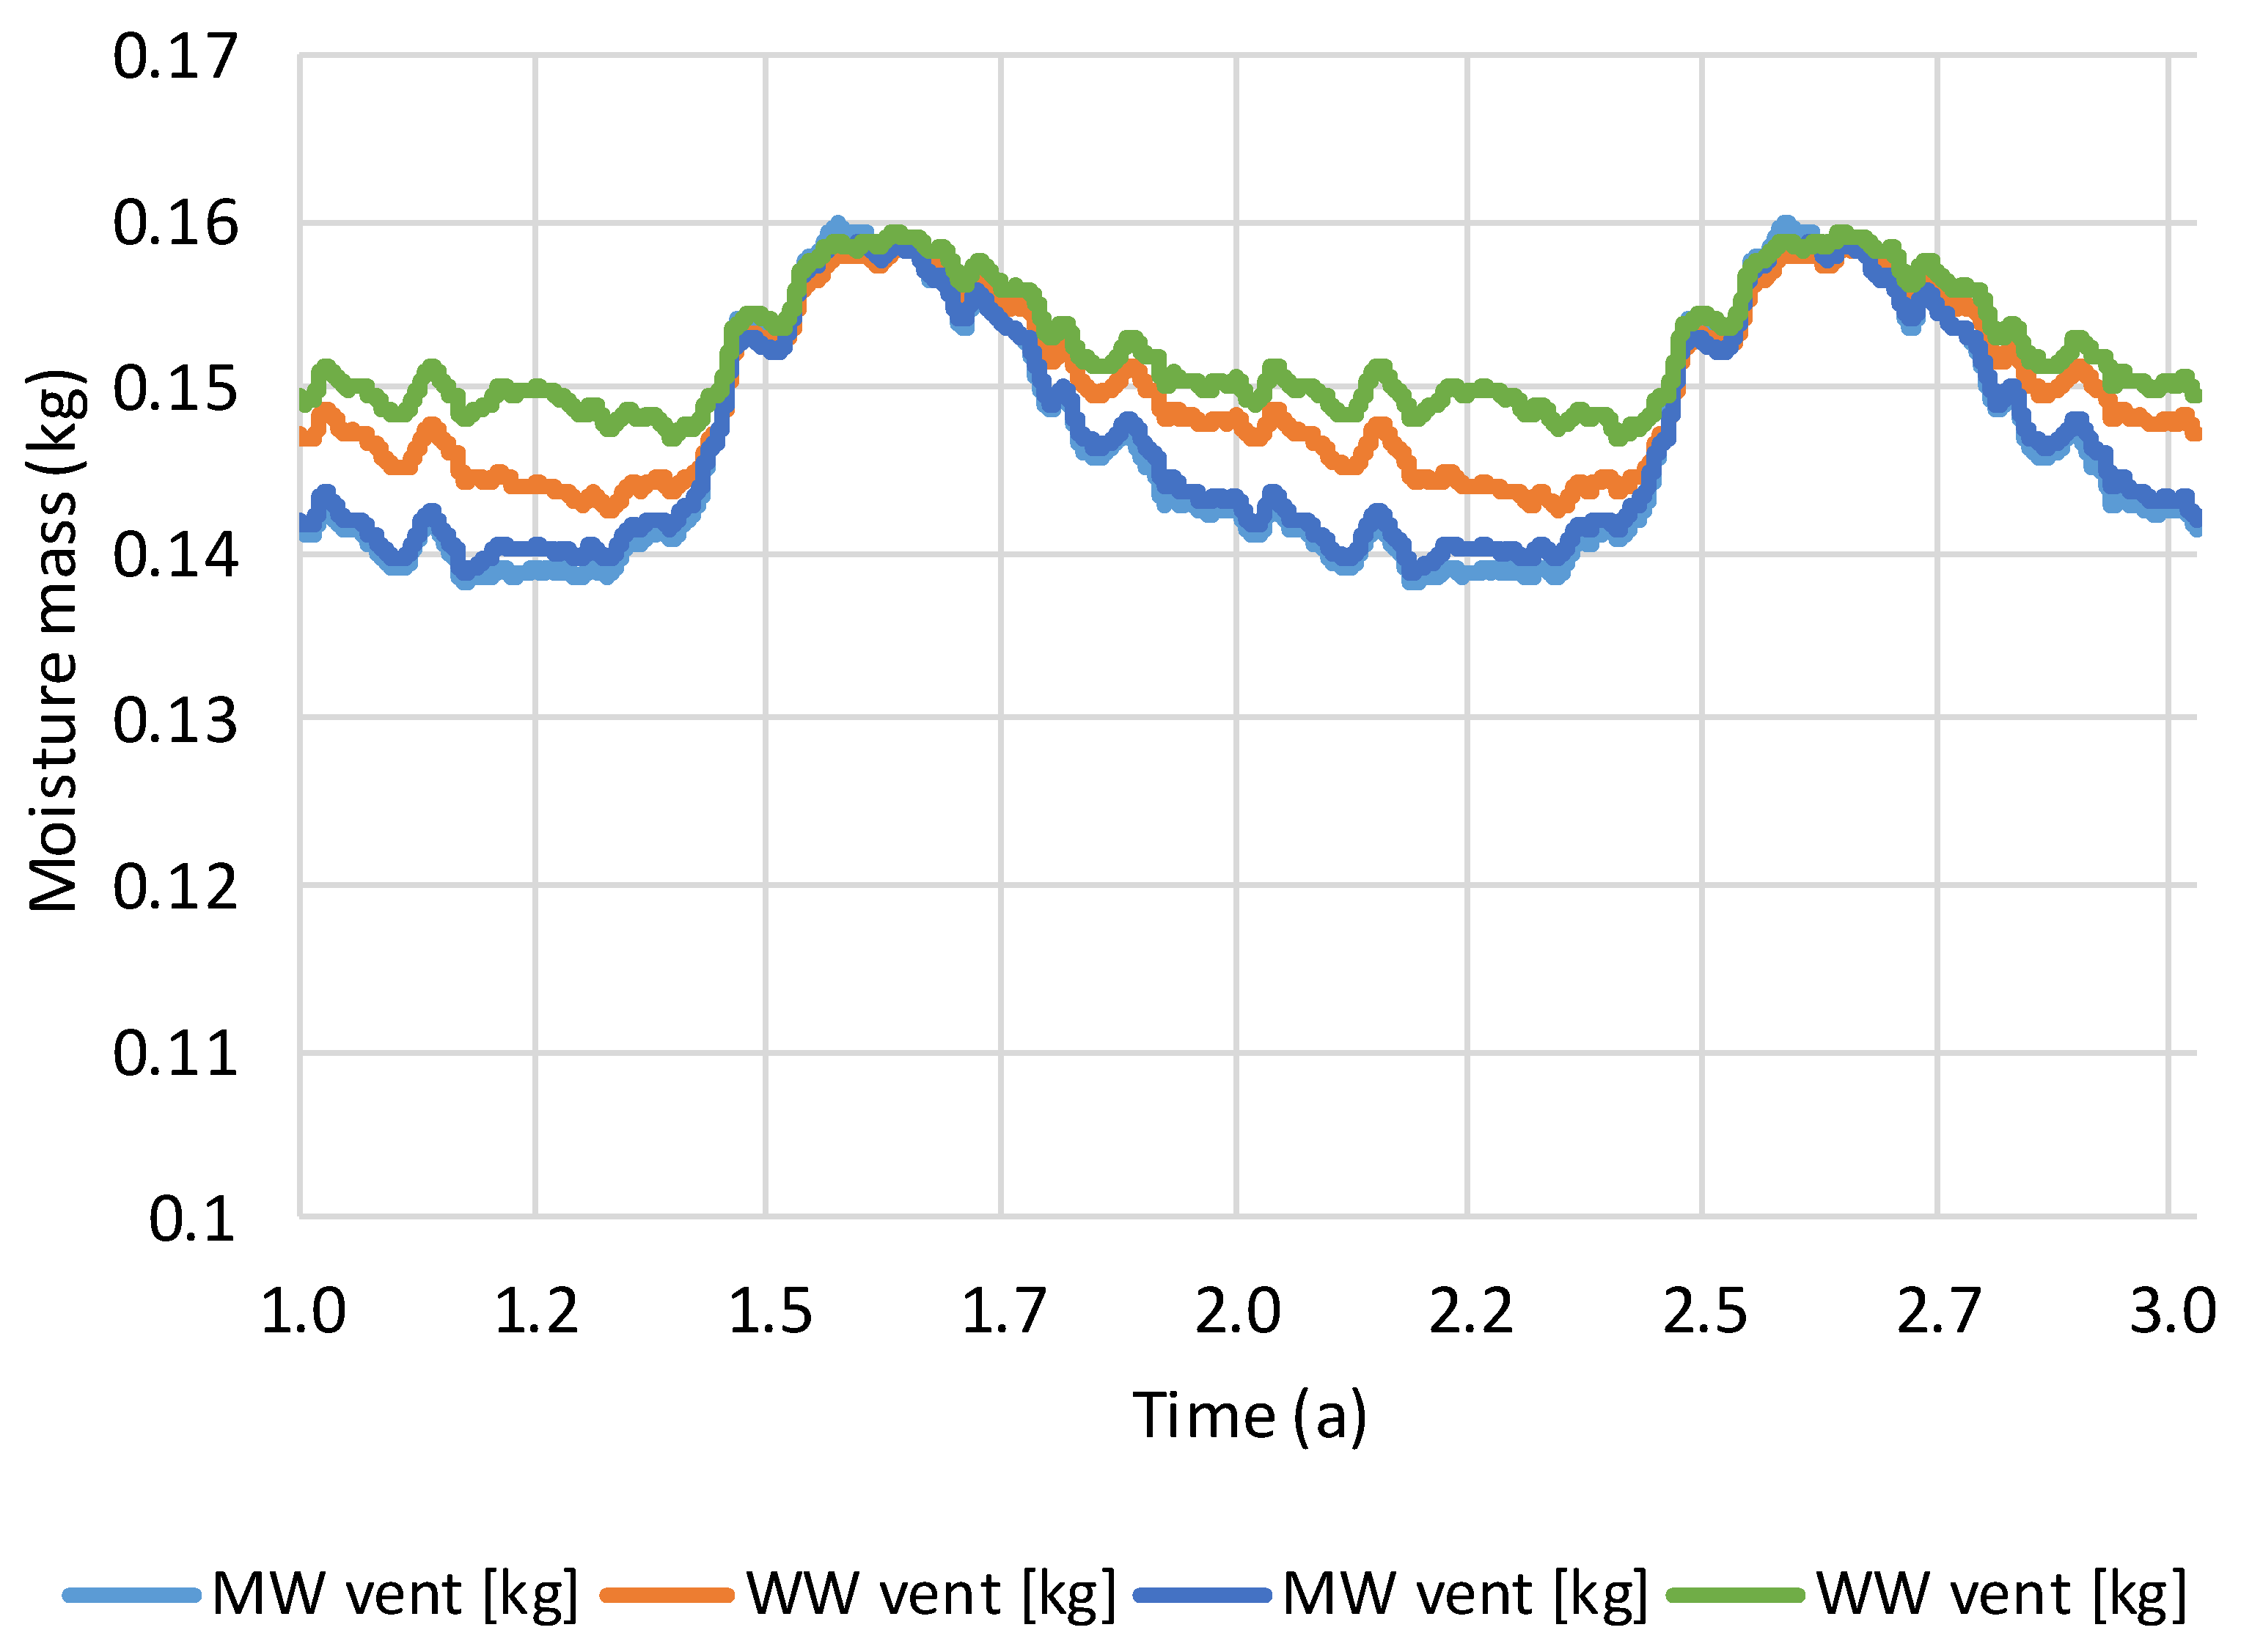
3.3. Moisture Content in the Rammed Earth Layer

Figure 14 presents the mass moisture accumulation in the RE layer for the ventilated models. Since stabilization occurred during the first year of simulation, the results are shown for the second and third years. In all cases except for HS insulation, the RE layer reaches its highest moisture content in summer and releases it to the environment in winter. In contrast, for the HS case, the highest moisture content is observed in winter, with drying occurring in summer. Moisture accumulation values for the HS model are the highest among those analyzed (6.71 kg in winter and 6.30 kg in summer). Lower moisture accumulation was recorded for the models insulated with CF (5.89 kg in winter and 6.24 kg in summer), MW (5.78 kg in winter and 6.29 kg in summer), and WW (5.97 kg in winter and 6.25 kg in summer).
Figure 15 presents a comparison of mass moisture accumulation in the RE layer in ventilated and plastered models insulated with MW and WW. Since stabilization was observed during the first year of simulation, the results are presented for the second and third years. Annual fluctuations are visible in all cases, with the highest moisture levels occurring in summer and the lowest in winter. All models reach similar maximum moisture levels in summer. In winter, the greatest drying is observed in the models insulated with MW. The plastered MW model shows lower overall moisture accumulation. For the models insulated with WW, the presence of a ventilated gap contributes to a reduction in the moisture content of the RE layer. The lowest moisture accumulation occurs in the model insulated with MW (5.81 kg), followed by the ventilated WW model (5.97 kg) and the plastered WW model (6.07 kg).
The annual fluctuations of mass moisture in the RE layer for the ventilated models are as follows: WW—5%, CF—6%, HS—7%, and MW—9%. For the plastered models, the fluctuations are 4% for WW and 8% for MW.

3.4. Accumulation of Moisture in the Interior Plaster

Figure 16 presents the moisture content in the internal clay plaster layer in the ventilated models insulated with CF, HS, MW, and WW. The trends shown in the graph are similar to those observed in the rammed earth layer. The HS-insulated model absorbs moisture in summer and releases it in winter, while the others show the opposite behavior. The lowest moisture accumulation is observed in the MW-insulated model. The annual moisture fluctuations in the clay plaster are 9% for HS, 11% for WW, 13% for CF, and 16% for MW.
Figure 17 presents a comparison of moisture accumulation in the plaster layers between the ventilated and plastered models insulated with MW and WW. The trends are consistent across the models: the greatest moisture accumulation occurs in summer, followed by moisture release in winter. As in Figure 15, the presence of a ventilated layer in the WW-insulated model contributes to a reduction in moisture accumulation compared with the plastered version. In contrast, for the MW-insulated models, the presence of a ventilation gap has no significant effect.

4. Discussion

Based on the conducted simulations, significant differences were observed in the behavior of individual types of insulation used in combination with RE walls. RE wall insulation with MW, WW, or CF reach their maximum RH values and moisture accumulation during the summer period, while in the case of HS insulation, the cycle is reversed: the highest moisture levels in both the RE wall and the clay plaster layer occur in winter, with drying taking place in summer. At the same time, the HS insulation exhibited the greatest heat loss during the winter period (highest HF), indicating that, as a thermal insulation material intended to reduce heat loss under winter conditions, it does not effectively fulfill its function. However, in summer, compared with the other tested insulation types, HS demonstrated the best performance in protecting RE walls and clay plaster from overheating and drying. This may have a positive effect on the indoor microclimate by maintaining stable humidity conditions, particularly in the spring months (March and April), when the issue of excessively dry indoor air often arises. HS are characterized by a high porosity and the ability to be highly hygroscopic [48], which is why this material has great potential in the natural regulation of humidity in partitions, and thus in the internal environment. The analysis of insulation systems with a ventilated cavity showed that the presence of an air gap does not have a significant effect on the temperature distribution across the tested insulation types, but it does contribute to reducing moisture levels in the RE and clay plaster layers. Moreover, a comparison of the behavior of insulation materials indicates that natural materials, compared with the analyzed MW, exhibit a better moisture buffering capacity, which may help support a more stable indoor microclimate in insulated spaces.
Moreover, the proposed solutions largely align with the principles of CE. The insulation materials based on HS, CF, and WW are renewable resources and, provided there is no biological degradation or contamination, are easily recoverable. This contributes to reducing the environmental impact at the end of the building’s life cycle. Due to the high energy input required for recycling, MW has limited potential within the CE framework. In addition to WW, CF, and HS insulation, the other materials used in the simulations also demonstrate a high potential for CE implementation. Minimally processed rammed earth and clay plasters can be reused in new construction projects. Properly designed and executed connections of timber elements allow for their easy recovery after building disassembly. Lime plasters and timber components can be directly reused after deconstruction, provided that they are not contaminated. If uncontaminated, lime plasters can also be reused as an additive in new mortars or safely disposed of. The use of natural and low-processed materials not only enhances hygrothermal performance but also contributes to increasing the circularity of building systems.
Considering the specific behavior of HS-based insulation, it can be concluded that, due to its high absorbency, this material is preliminarily disqualified as effective thermal insulation under the analyzed climate conditions. However, it may perform well as a material for preventing building overheating, which is a relevant factor in the context of adapting buildings to climate change.
In addition to hygrothermal performance, it is also important to assess the potential of various insulation types within the framework of the circular economy (CE), which emphasizes material circularity and the possibility of repurposing and reusing materials. In this context, the materials of natural origin demonstrate particularly high value in the following ways:
  • HS, as a by-product of the textile industry, has strong potential due to its ability to be safely composted or used as a biological substrate. If no biological degradation is observed, it may also be reused as insulation in a subsequent building. Additionally, it is a material that can be sourced locally.
  • CF, derived from recycled paper, can be recycled again or, similarly to hemp shives, reused as insulation provided that there is no biological degradation.
  • WW, as a finished product, can be reused in prefabrication or subjected to material recirculation.
  • MW has the lowest potential in this regard due to the difficulty of material recovery. Moreover, its production process is more energy-intensive compared with the other materials.
Taking the CE paradigm as a guiding principle for material selection, along with the results of the conducted analyses, it is proposed that in colder climate zones—such as Northern Europe—RE walls combined with WW insulation represent the most suitable solution. In contrast, for regions with temperate or warm climates, where the risk of buildings overheating is more significant, the use of insulation made from HS or CF is considered more appropriate. The simulations indicate that HS insulation can be well suited for insulating RE in temperate, warm, and transitional climates. Previous studies indicated that HS is free from the risk of biological contamination if the ambient humidity does not exceed 93% [48]. The simulation results indicate the safe use of HS. From the perspective of the ease of installation, WW adhered with clay-based mortar appears to be the most optimal solution. However, to enable the effective application of HS-based insulation systems, especially in low-complexity prefabricated systems, further research-by-design is necessary. Such research could facilitate the development of alternative insulation methods that are both practical and adaptable to various contexts. At the same time, the ratio between wall thickness and the required insulation level should always be verified based on the specific climate zone and the intended use of the building.
The results obtained indicate the need for further research aimed at identifying the most suitable and optimal combinations of materials, their applications, hygrothermal parameters, and performance in the context of circular economy (CE) principles. It should be emphasized that currently available knowledge does not cover the full spectrum of possible raw materials originating from recycling or local cultivation. Therefore, additional comparative studies involving other bio-based insulation materials are warranted—particularly with respect to their moisture resistance and the structural stability of RE walls, which—as previous studies have shown—may deteriorate under prolonged exposure to elevated moisture contents. Further investigation is also needed regarding the disassembly potential of materials and their influence on the indoor microclimate. In order to supplement and verify the accuracy of the numerical simulation results, and to gain a better understanding of the long-term behavior of the analyzed materials, the construction of physical models appears to be justified.
In addition to enabling the empirical assessment of moisture content, temperature, and the technical condition of insulation materials over time under real-life conditions, such models would also allow for the observation of factors such as the moisture resistance of clay plasters, microbial growth, the actual durability of material junctions, and the practical feasibility of separating and reusing individual components at the end of a building’s life cycle.

5. Conclusions

  • The type of insulation used has a significant impact on the hygrothermal behavior of RE walls.
  • HS insulation demonstrates a distinct pattern—with peak moisture levels occurring in winter and drying taking place in summer. From a CE perspective, although HS insulation exhibits thermally unfavorable behavior in winter, its strong moisture buffering capacity and natural, biodegradable characteristics suggest high reuse or composting potential. This duality underscores the need to balance performance with end-of-life sustainability.
  • The behavior of HS indicates a high potential for moisture regulation in RE walls and clay plasters. HS may be considered a climate-adaptive insulation material, particularly in the context of rising temperatures, due to its excellent performance in reducing overheating.
  • Natural origin materials show a better moisture buffering capacity compared with MW. CF and HS have the highest compatibility with CE principles. Their renewable origin, local availability, and ease of reintegration into biological or technical cycles position them as promising candidates for sustainable insulation systems.
  • The presence of a ventilated cavity does not significantly affect the temperature distribution across the wall assembly, but it significantly reduces moisture accumulation in the RE and plaster layers—particularly in systems using WW—and may help prevent the biological degradation of HS insulation.
  • While MW performs well in stabilizing internal humidity, its low recyclability and high processing energy demand make it less compatible with CE goals. In contrast, CF, HS and WW, though showing higher moisture fluctuations, offer better prospects for reuse and material cycling within a sustainable construction framework.
  • To verify the simulation results and better understand material performance over time, it is recommended to construct physical mock-ups of wall sections or demonstration buildings. This would allow for the assessment of insulation impact on structural stability, indoor microclimate, and material recovery potential after disassembly.
  • In the context of the CE, HS and CF show the greatest potential. These materials are renewable, biodegradable, and can be reused or reprocessed without a loss of functionality.
  • The safety and durability of RE construction largely depend on effective moisture protection. Therefore, the choice of insulation is crucial not only for thermal performance but also for structural integrity.
  • In the broader material context, rammed earth (RE) itself presents great potential from a CE perspective: it can often be sourced directly from a construction site, used with minimal processing, and reused as aggregate or infill at the end of its lifecycle. Similarly, clay plasters are not only vapor-permeable and regulate humidity well but can also be reapplied or safely returned to the environment. Lime plasters, while more energy-intensive to produce, offer a carbon capture benefit through carbonation and are recyclable as hydraulic binders. Timber components, if designed for disassembly, can be reused in future constructions—especially when connected using reversible joinery. Together, these elements enhance the regenerative character of the entire wall assembly.
These findings contribute to the development of sustainable wall assemblies by demonstrating how material selection—guided by both performance and circularity—can support climate-resilient, low-impact construction strategies

Author Contributions

Conceptualization, P.K., W.J., and K.P.; methodology, P.K., W.J., and K.P.; software, P.K.; validation, P.K., W.J., and K.P.; formal analysis, P.K., W.J., and K.P.; investigation, P.K., W.J., and K.P.; resources, P.K., W.J., and K.P.; data curation, P.K., W.J., and K.P.; writing—original draft preparation, P.K., W.J., and K.P.; writing—review and editing, P.K., W.J., and K.P.; visualization, P.K., W.J., and K.P.; supervision, P.K.; project administration, P.K. All authors have read and agreed to the published version of the manuscript.

Funding

This research received no external funding.

Institutional Review Board Statement

Not applicable.

Informed Consent Statement

Not applicable.

Data Availability Statement

On request from authors.

Conflicts of Interest

The authors declare no conflict of interest.

Abbreviations

The following abbreviations are used in this manuscript:
EUEuropean Union
CECircular Economy
RERammed Earth
HSHemp Shives
CFCellulose Fiber
WWWood Wool
MWMineral Wool
HFHeat Flux
RHRelative Humidity
CDWConstruction and Demolition Waste
GHGsGreen House Gasses

References

  1. U.N. Environment Programme. 2022 Global Status Report for Buildings and Construction | UNEP—UN Environment Programme. Available online: https://www.unep.org/resources/publication/2022-global-status-report-buildings-and-construction (accessed on 14 May 2025).
  2. U.N. Environment Programme. Global Status Report for Buildings and Construction | UNEP—UN Environment Programme. Available online: https://www.unep.org/resources/report/global-status-report-buildings-and-construction (accessed on 16 May 2025).
  3. US EPA. C-MORE: Construction Material Opportunities to Reduce Emissions. Available online: https://www.epa.gov/greenerproducts/cmore (accessed on 16 May 2025).
  4. Communication from the Commission to the European Parliament, the Council, the European Economic and Social Committee and the Committee of the Regions. A New Circular Economy Action Plan for a Cleaner and More Competitive Europe. 2020. Available online: https://eur-lex.europa.eu/legal-content/EN/TXT/?uri=celex:52020DC0098 (accessed on 16 May 2025).
  5. Waste Statistics. Available online: https://ec.europa.eu/eurostat/statistics-explained/index.php?title=Waste_statistics (accessed on 16 May 2025).
  6. Directive—2008/98—EN—Waste Framework Directive—EUR-Lex. Available online: https://eur-lex.europa.eu/eli/dir/2008/98/oj/eng (accessed on 17 June 2025).
  7. Regulation—2020/852—EN—Taxonomy Regulation—EUR-Lex. Available online: https://eur-lex.europa.eu/eli/reg/2020/852/oj/eng (accessed on 17 June 2025).
  8. Ormondroyd, G.A.; Spear, M.J.; Skinner, C. The Opportunities and Challenges for Re-Use and Recycling of Timber and Wood Products Within the Construction Sector. In Environmental Impacts of Traditional and Innovative Forest-Based Bioproducts; Kutnar, A., Muthu, S.S., Eds.; Springer: Singapore, 2016; pp. 45–103. ISBN 978-981-10-0655-5. [Google Scholar]
  9. Vargas, M.; Alfaro, M.; Karstegl, N.; Fuertes, G.; Gracia, M.D.; Mar-Ortiz, J.; Sabattin, J.; Duran, C.; Leal, N. Reverse Logistics for Solid Waste from the Construction Industry. Adv. Civ. Eng. 2021, 2021, 6654718. [Google Scholar] [CrossRef]
  10. Hale, S.E.; Roque, A.J.; Okkenhaug, G.; Sørmo, E.; Lenoir, T.; Carlsson, C.; Kupryianchyk, D.; Flyhammar, P.; Žlender, B. The Reuse of Excavated Soils from Construction and Demolition Projects: Limitations and Possibilities. Sustainability 2021, 13, 6083. [Google Scholar] [CrossRef]
  11. Mália, M.; de Brito, J.; Pinheiro, M.D.; Bravo, M. Construction and Demolition Waste Indicators. Waste Manag. Res. 2013, 31, 241–255. [Google Scholar] [CrossRef] [PubMed]
  12. Menegaki, M.; Damigos, D. A Review on Current Situation and Challenges of Construction and Demolition Waste Management. Curr. Opin. Green Sustain. Chem. 2018, 13, 8–15. [Google Scholar] [CrossRef]
  13. Bansal, A.; Mishra, G.; Bishnoi, S. Recycling and Reuse of Construction and Demolition Waste: Sustainable Approach. In Proceedings of the 7th International Conference on Sustainable Build Environment, Kandy, Sri Lanka, 16–18 December 2016. [Google Scholar]
  14. Iacovidou, E.; Purnell, P. Mining the Physical Infrastructure: Opportunities, Barriers and Interventions in Promoting Structural Components Reuse. Sci. Total Environ. 2016, 557–558, 791–807. [Google Scholar] [CrossRef]
  15. Grangeot, M.; Wang, Q.; Beyer, K.; Fivet, C.; Parascho, S. Structural Concrete Rubble Arrangements. In Scalable Disruptors; Eversmann, P., Gengnagel, C., Lienhard, J., Ramsgaard Thomsen, M., Wurm, J., Eds.; Springer Nature Switzerland: Cham, Switzerland, 2024; pp. 15–27. [Google Scholar]
  16. Kitek Kuzman, M.; Zbašnik-Senegačnik, M.; Kosanović, S.; Miloshevska Janakieska, M.; Novaković, N.; Rajković, I.; Grošelj, P. Architectural Perspectives on Wood Reuse within Circular Construction: A South–Central European Study. Buildings 2024, 14, 560. [Google Scholar] [CrossRef]
  17. Kanyilmaz, A.; Birhane, M.; Fishwick, R.; del Castillo, C. Reuse of Steel in the Construction Industry: Challenges and Opportunities. Int. J. Steel Struct. 2023, 23, 1399–1416. [Google Scholar] [CrossRef]
  18. Ottenhaus, L.-M.; Yan, Z.; Brandner, R.; Leardini, P.; Fink, G.; Jockwer, R. Design for Adaptability, Disassembly and Reuse—A Review of Reversible Timber Connection Systems. Constr. Build. Mater. 2023, 400, 132823. [Google Scholar] [CrossRef]
  19. Aatheesan, T.; Arulrajah, A.; Bo, M.W.; Wilson, J.L. Beneficial Use of Brick Rubble as Pavement Sub-Base Material. In Advances in Transportation Geotechnics; CRC Press: Boca Raton, FL, USA, 2008; ISBN 978-0-429-20728-0. [Google Scholar]
  20. Kalinowska-Wichrowska, K.; Pawluczuk, E.; Bołtryk, M. Waste-Free Technology for Recycling Concrete Rubble. Constr. Build. Mater. 2020, 234, 117407. [Google Scholar] [CrossRef]
  21. Hoffmann, C.; Schubert, S.; Leemann, A.; Motavalli, M. Recycled Concrete and Mixed Rubble as Aggregates: Influence of Variations in Composition on the Concrete Properties and Their Use as Structural Material. Constr. Build. Mater. 2012, 35, 701–709. [Google Scholar] [CrossRef]
  22. Wyller, M.; Svatoš-Ražnjević, H.; Schad, E.; Menges, A. A Taxonomy of Techniques and Tools for Rubble. In Scalable Disruptors; Eversmann, P., Gengnagel, C., Lienhard, J., Ramsgaard Thomsen, M., Wurm, J., Eds.; Springer Nature Switzerland: Cham, Switzerland, 2024; pp. 3–14. [Google Scholar]
  23. Grangeot, M.; Bastien-Masse, M.; Fivet, C.; Parascho, S. Large Concrete Rubble as a New Structural Construction Material: Opportunities and Digital Processes for Load-Bearing Walls. Buildings 2025, 15, 1437. [Google Scholar] [CrossRef]
  24. Giorgi, S.; Lavagna, M.; Campioli, A. Guidelines for Effective and Sustainable Recycling of Construction and Demolition Waste. In Designing Sustainable Technologies, Products and Policies: From Science to Innovation; Benetto, E., Gericke, K., Guiton, M., Eds.; Springer International Publishing: Cham, Switzerland, 2018; pp. 211–221. ISBN 978-3-319-66981-6. [Google Scholar]
  25. Valenzuela, M.; Ciudad, G.; Cárdenas, J.P.; Medina, C.; Salas, A.; Oñate, A.; Pincheira, G.; Attia, S.; Tuninetti, V. Towards the Development of Performance-Efficient Compressed Earth Blocks from Industrial and Agro-Industrial by-Products. Renew. Sustain. Energy Rev. 2024, 194, 114323. [Google Scholar] [CrossRef]
  26. Kianfar, E.; Toufigh, V. Reliability Analysis of Rammed Earth Structures. Constr. Build. Mater. 2016, 127, 884–895. [Google Scholar] [CrossRef]
  27. Ávila, F.; Puertas, E.; Gallego, R. Mechanical Characterization of Lime-Stabilized Rammed Earth: Lime Content and Strength Development. Constr. Build. Mater. 2022, 350, 128871. [Google Scholar] [CrossRef]
  28. Kang, S.-H.; Kwon, Y.-H.; Moon, J. Quantitative Analysis of CO2 Uptake and Mechanical Properties of Air Lime-Based Materials. Energies 2019, 12, 2903. [Google Scholar] [CrossRef]
  29. Nouri, H.; Safehian, M.; Hosseini, S.M.M.M. Life Cycle Assessment of Earthen Materials for Low-Cost Housing a Comparison between Rammed Earth and Fired Clay Bricks. Int. J. Build. Pathol. Adapt. 2021, 41, 364–377. [Google Scholar] [CrossRef]
  30. Hammond, G.P.; Jones, C.I. Embodied Energy and Carbon in Construction Materials. Proc. Inst. Civ. Eng.—Energy 2008, 161, 87–98. [Google Scholar] [CrossRef]
  31. Arenas, N.F.; Shafique, M. Reducing Embodied Carbon Emissions of Buildings—A Key Consideration to Meet the Net Zero Target. Sustain. Futur. 2024, 7, 100166. [Google Scholar] [CrossRef]
  32. Gomaa, M.; Schade, S.; Bao, D.W.; Xie, Y.M. Automation in Rammed Earth Construction for Industry 4.0: Precedent Work, Current Progress and Future Prospect. J. Clean. Prod. 2023, 398, 136569. [Google Scholar] [CrossRef]
  33. McGregor, F.; Heath, A.; Maskell, D.; Fabbri, A.; Morel, J.-C. A Review on the Buffering Capacity of Earth Building Materials. Proc. Inst. Civ. Eng.—Constr. Mater. 2016, 169, 241–251. [Google Scholar] [CrossRef]
  34. Tan, J.; Liang, J.; Wan, L.; Jiang, B. Influence of Non-Constant Hygrothermal Parameters on Heat and Moisture Transfer in Rammed Earth Walls. Buildings 2022, 12, 1077. [Google Scholar] [CrossRef]
  35. Bui, Q.-B.; Morel, J.-C.; Hans, S.; Walker, P. Effect of Moisture Content on the Mechanical Characteristics of Rammed Earth. Constr. Build. Mater. 2014, 54, 163–169. [Google Scholar] [CrossRef]
  36. Yu, S.; Hao, S.; Mu, J.; Tian, D.; Zhao, M. Research on Optimization of the Thermal Performance of Composite Rammed Earth Construction. Energies 2022, 15, 1519. [Google Scholar] [CrossRef]
  37. Dong, X.; Soebarto, V.; Griffith, M. Achieving Thermal Comfort in Naturally Ventilated Rammed Earth Houses. Build. Environ. 2014, 82, 588–598. [Google Scholar] [CrossRef]
  38. Toufigh, V.; Samadianfard, S. Experimental and Numerical Investigation of Thermal Enhancement Methods on Rammed-Earth Materials. Sol. Energy 2022, 244, 474–483. [Google Scholar] [CrossRef]
  39. Serrano, S.; de Gracia, A.; Cabeza, L.F. Adaptation of Rammed Earth to Modern Construction Systems: Comparative Study of Thermal Behavior under Summer Conditions. Appl. Energy 2016, 175, 180–188. [Google Scholar] [CrossRef]
  40. Windstorm, B.; Schmidt, A. A Report of Contemporary Rammed Earth Construction and Research in North America. Sustainability 2013, 5, 400–416. [Google Scholar] [CrossRef]
  41. Giuffrida, G.; Caponetto, R.; Nocera, F.; Cuomo, M. Prototyping of a Novel Rammed Earth Technology. Sustainability 2021, 13, 11948. [Google Scholar] [CrossRef]
  42. Giuffrida, G.; Ibos, L.; Boudenne, A.; Allam, H. Exploring the Integration of Bio-Based Thermal Insulations in Compressed Earth Blocks Walls. Constr. Build. Mater. 2024, 418, 135412. [Google Scholar] [CrossRef]
  43. Schroeder, H. 4—Modern Earth Building Codes, Standards and Normative Development. In Modern Earth Buildings; Hall, M.R., Lindsay, R., Krayenhoff, M., Eds.; Woodhead Publishing Series in Energy; Woodhead Publishing: Cambridge, UK, 2012; pp. 72–109. ISBN 978-0-85709-026-3. [Google Scholar]
  44. IAL Consultants. The European Market for Thermal Insulation Products; IAL Consultants: London, UK, 2023. [Google Scholar]
  45. Kosiński, P.; Patyna, K. Practical Use of Materials of Natural Origin as Loose-Fill Insulations in Open-Diffusion Constructions—Observation and Numerical Simulation. Sustainability 2024, 16, 4593. [Google Scholar] [CrossRef]
  46. Indekeu, M.L.; Janssen, H.; Woloszyn, M. Determination of the Moisture Diffusivity of Rammed Earth from Transient Capillary Absorption Moisture Content Profiles. Constr. Build. Mater. 2022, 318, 125978. [Google Scholar] [CrossRef]
  47. Dane do obliczeń energetycznych budynków—Ministerstwo Inwestycji i Rozwoju—Portal Gov.pl. Available online: https://www.gov.pl/web/archiwum-inwestycje-rozwoj/dane-do-obliczen-energetycznych-budynkow (accessed on 17 June 2025).
  48. Kosiński, P.; Brzyski, P.; Tunkiewicz, M.; Nagy, B.; Gotkowska-Płachta, A. Moisture Properties, Microstructural and Microbiological Characteristics of Flax and Hemp Shives Used in Construction Industry. J. Nat. Fibers 2024, 21, 2356695. [Google Scholar] [CrossRef]
Figure 1. Diagrams of RE walls with insulation layers: (a) insulation using MW and WW in panels, and loose HS and CF, with a ventilated air cavity; (b) panel insulation made of MW and WW applied with clay-based adhesive, without a ventilated cavity.
Sustainability 17 06886 g001
Figure 2. Climatic conditions of Olsztyn on the basis of a typical meteorological year, (a) RH, (b) temperature.
Sustainability 17 06886 g002
Figure 3. Models of analyzed RE walls with inner finish made of clay render insulated with (a) loose HS and CF insulation with ventilation slot, (b) panels of MW and WW panels, both with ventilation slot. Both insulation types (a,b) are placed between preassembly wooden elements, with jute mat used as wind insulation, finished with wooden cladding. Model (c) is insulated with MW and WW panels assembled on clay binder, without a ventilation slot, with an external lime plaster finish.
Sustainability 17 06886 g003
Figure 4. Temperature distribution on the 6th January in wall in ventilated models insulated with (a) loose HS, (b) WW panels.
Sustainability 17 06886 g004
Figure 5. Temperature distribution on the 5th July in wall in ventilated models insulated with (a) loose HS, (b) WW panels.
Sustainability 17 06886 g005
Figure 6. Temperature distribution on the 6th January in wall insulated with WW, (a) ventilated case, (b) plastered case.
Sustainability 17 06886 g006
Figure 7. Temperature distribution on the 5th July in wall insulated with WW, (a) ventilated case, (b) plastered case.
Sustainability 17 06886 g007
Figure 8. Relative humidity distribution on the 6th January in wall models insulated with (a) loose HS, (b) WW panels.
Sustainability 17 06886 g008
Figure 9. Relative humidity distribution on the 5th July in wall models insulated with (a) loose HS, (b) WW panels.
Sustainability 17 06886 g009
Figure 10. Relative humidity distribution on the 6th January in wall insulated with WW, (a) ventilated case, (b) plastered case.
Sustainability 17 06886 g010
Figure 11. Relative humidity distribution on the 5th July in wall insulated with WW, (a) ventilated case, (b) plastered case.
Sustainability 17 06886 g011
Figure 12. HF on the internal side of analyzed ventilated models.
Sustainability 17 06886 g012
Figure 13. HF comparison between the ventilated and plastered models insulated with MW and WW.
Sustainability 17 06886 g013
Figure 14. Moisture content in the RE layer of the ventilated models.
Sustainability 17 06886 g014
Figure 15. Moisture content in the RE layer, comparison between ventilated and plastered models.
Sustainability 17 06886 g015
Figure 16. Moisture content in the internal clay plaster layer of the ventilated models.
Sustainability 17 06886 g016
Figure 17. Moisture content in the internal clay plaster layer comparison between ventilated and plastered models insulated with MW and WW.
Sustainability 17 06886 g017
Table 1. Properties of the materials used in simulations.
PropertiesLime PlasterRELight Clay PlasterMWCFHSWW
Thickness (m)0.0100.3000.0200.1500.1800.1880.150
Density (kg/m3)1498.42240.0900.0100.060.0115.050.0
Porosity (m3/m3)0.430.330.470.920.780.790.82
Specific heat (J/(kg⋅K))802.48371000.0840.025001600.01660
Thermal conductivity (W/(m⋅K))0.410.5510.230.0400.04950.0510.039
Diffusion resistance (-)9.34.530.01.003.53.51.2
Table 2. Temperature values calculated for critical points in the models.
Temperature (°C)CFHSWW VentMW VentWW PlastMW Plast
Winter
Internal surface19.4119.1219.3519.4119.3119.40
RE/insulation joint16.1614.4915.7716.1816.3616.03
Summer
Internal surface20.0019.9419.9820.0219.9920.01
RE/insulation joint20.1419.8620.0320.2520.0120.26
Table 3. Relative humidity in rammed earth layer depending on the thermal insulation system.
Relative Humidity (%) CF HS WW Vent MW Vent WW Plast MW Plast
Winter
Min31.058.038.025.039.025.0
Max46.080.047.045.047.045.0
Summer
Min51.056.052.052.052.052.0
Max64.074.066.072.065.072.0
Disclaimer/Publisher’s Note: The statements, opinions and data contained in all publications are solely those of the individual author(s) and contributor(s) and not of MDPI and/or the editor(s). MDPI and/or the editor(s) disclaim responsibility for any injury to people or property resulting from any ideas, methods, instructions or products referred to in the content.

