Article

Spatio-Temporal Dynamics, Driving Mechanisms, and Decoupling Evaluation of Farmland Carbon Emissions: A Case Study of Shandong Province, China

1
State Key Laboratory of Nutrient Use and Management, Key Laboratory of Wastes Matrix Utilization, Ministry of Agriculture and Rural Affair, Institute of Agricultural Resources and Environment, Shandong Academy of Agricultural Sciences, Jinan 250100, China
2
National Center of Technology Innovation for Comprehensive Utilization of Saline-Alkali Land, Dongying 257347, China
*
Author to whom correspondence should be addressed.
Sustainability 2025, 17(15), 6876; https://doi.org/10.3390/su17156876
Submission received: 4 July 2025 / Revised: 24 July 2025 / Accepted: 25 July 2025 / Published: 29 July 2025

Abstract

Understanding the spatio-temporal evolution of farmland carbon emissions, disentangling their underlying driving forces, and exploring the decoupling relationship between these emissions and economic development are pivotal to advancing low-carbon and high-quality agricultural development in Shandong Province, China. Using the Logarithmic Mean Divisia Index (LMDI) and Tapio decoupling model, this study conducted a comprehensive analysis of panel data from 16 cities in Shandong Province spanning 2004–2023. This research reveals that the total farmland carbon emissions in Shandong Province followed a trajectory of “initial fluctuating increase and subsequent steady decline” during the study period. The emissions peaked at 29.4 million tons in 2007 and then declined to 20.2 million tons in 2023, representing a 26.0% reduction compared to the 2004 level. Farmland carbon emission intensity in Shandong Province showed an overall downward trend over the period 2004–2023, with the 2023 intensity registering a 68.9% decline compared to 2004. The carbon emission intensity, agricultural structure, and labor effects acted as inhibiting factors on farmland carbon emissions in Shandong Province, while the economic development effect exerted a positive driving impact on the growth of such emissions. Over the 20-year period, these four factors cumulatively contributed to a reduction of 2.1 × 10⁵ tons in farmland carbon emissions. During 2004–2013, the farmland carbon emissions in Zaozhuang, Yantai, Jining, Linyi, Dezhou, Liaocheng, and Heze showed a weak decoupling state, while in 2014–2023, the farmland carbon emissions and economic development in all cities of Shandong Province showed a strong decoupling state. In the future, it is feasible to reduce farmland carbon emissions in Shandong Province by improving agricultural resource utilization efficiency through technological progress, adopting advanced low-carbon technologies, and promoting the transformation of agricultural industrial structures towards “high-value and low-carbon” designs.

1. Introduction

Climate change driven by greenhouse gas (GHG) emissions has emerged as one of the present era’s gravest global challenges, demanding urgent collective efforts from all nations [1]. As the world’s largest developing nation, China bears a substantial responsibility to tackle global climate change. Actively responding to global climate governance initiatives, China has internationally pledged its “dual carbon” goals—aiming to reach carbon peak by 2030 and carbon neutrality by 2060—establishing systematic demands for energy structure transformation and green development across all industries [2]. Amid the push for carbon peak and neutrality, agricultural carbon emissions cannot be neglected [3]. As the foundation of the national economy, agriculture significantly influences atmospheric greenhouse effects across spatial and temporal scales [4]. As indicated in the sixth assessment report of the IPCC, climate warming is primarily driven by GHG emissions generated from human activities [5]. Among these, agriculture contributes 19–29% of anthropogenic GHG emissions [6], serving as one of the main sources of non-CO2 GHGs, accounting for approximately 20% of CH4 and 60% of N2O emissions. Amid China’s ongoing socioeconomic development, agricultural production has expanded in scale, escalating carbon emission pressure within the sector [7]. Farmland carbon emissions are a key part of agricultural carbon emissions, as farmland production relies heavily on inputs like chemical fertilizers, agricultural diesel, plastic films, pesticides, etc.—each a notable source of such emissions. During China’s push toward carbon peak and carbon neutrality, farmland carbon emissions face enormous pressure. In-depth research on the current status, characteristics, and influencing factors of farmland carbon emissions, as well as explorations of effective emission reduction and carbon sequestration strategies, are of great practical significance for achieving carbon peak and carbon neutrality in agriculture and thus promoting the realization of the national “dual carbon” goals.
In recent years, studies on farmland carbon emissions have mainly focused on carbon emission accounting [8], the spatio-temporal evolution of regional carbon emissions [9,10], influencing factor analysis, and decoupling effects [11,12]. For carbon emission accounting analysis, existing studies have focused on the IPCC inventory method, LCA carbon footprint method, and input–output method [13,14]. These studies have primarily centered on national [12] and provincial scales [15], with limited attention paid to fine-grained analysis at the prefecture-level city scale. For example, Han et al. (2024) used the IPCC method to compute carbon emissions from state-owned farms in 29 provinces of China from 2010 to 2022 [12]. Tang et al. (2024) quantified non-CO2 GHG emissions originating from agricultural activities in Southwest China during 1995–2021 using the carbon emission coefficient method [15]. While some studies have explored regional carbon emissions in East China, they rarely targeted Shandong Province specifically, let alone systematically analyzed the spatio-temporal characteristics of 16 prefecture-level cities over a 20-year period. This gap hinders our progress towards a comprehensive understanding of the heterogeneous evolution of farmland carbon emissions within major agricultural provinces. Regarding the influencing factors of carbon emissions, the Logarithmic Mean Divisia Index (LMDI) model has been widely applied in driving factor research [16]. The LMDI method offers advantages such as accurate data processing and stable structure, and it can overcome residual problems that may arise in other analytical methods [17]. In terms of factor selection, this method emphasizes variables like labor, economic development, industrial structure, and energy structure changes [18,19,20,21]. Existing research on influencing factor analysis using the LMDI model has mainly focused on national [22] or multi-provincial comparisons [15]. De Freitas et al. (2011) used the LMDI model to explore the decoupling relationship between economic growth and carbon emissions in Brazil, finding that carbon emission intensity and energy structure were the key drivers behind the country’s emission reduction trends [22]. Duan et al. (2023) utilized the same model to assess factors influencing agricultural methane emissions in China from 2010 to 2020 [23]. However, their research rarely examines how the driving factors change among the prefecture-level cities in a province. Additionally, to achieve a dynamic balance between carbon emissions and economic growth, some scholars have used decoupling factors to characterize the decoupling stages of carbon emissions and economic growth [21,24]. Although the combination of LMDI and Tapio models has been widely adopted, most research either focuses on a single region [25] or performs comparisons across provinces [26], with few long-term tracking studies on the decoupling relationships between farmland carbon emissions and agricultural economic growth at the prefecture-level city scale. Meng et al. (2024) employed an enhanced LMDI decomposition method and the Tapio decoupling model to examine the factors influencing agricultural carbon emissions in Sichuan Province and their link to economic growth during 2010–2020 [25]. Tang et al. (2024) investigated the drivers of agricultural non-CO2 GHG emissions in Southwest China during 1995–2021 and their relationship with economic development using the STIRPAT model and Tapio model, finding that the economic, population, structural, and technological levels showed varying degrees of influence across provinces and that there existed strong or weak decoupling relationships between economic growth and GHG emissions [15]. However, existing studies fail to capture the long-term dynamic changes and spatial variations among prefecture-level cities within provinces such as Shandong, which is characterized by distinct diversity in population and agriculture. Therefore, a systematic analysis of the spatio-temporal variation characteristics and influencing factors of regional farmland carbon emissions can provide a theoretical basis for formulating carbon emission reduction strategies.
As a major agricultural province, Shandong long leads China in total agricultural output value. Clarifying the spatio-temporal variation characteristics and influencing factors of farmland carbon emissions in Shandong, and formulating corresponding emission reduction measures, are critical for achieving the “dual carbon” goals both locally and nationwide. To this end, this study calculates farmland carbon emissions across Shandong’s cities from 2004 to 2023, applies the LMDI model to examine driving factors, and uses the Tapio model to analyze their decoupling relationship with economic growth. Corresponding emission reduction strategies are also proposed, aiming to provide a theoretical basis for Shandong’s low-carbon high-quality development.

2. Materials and Methods
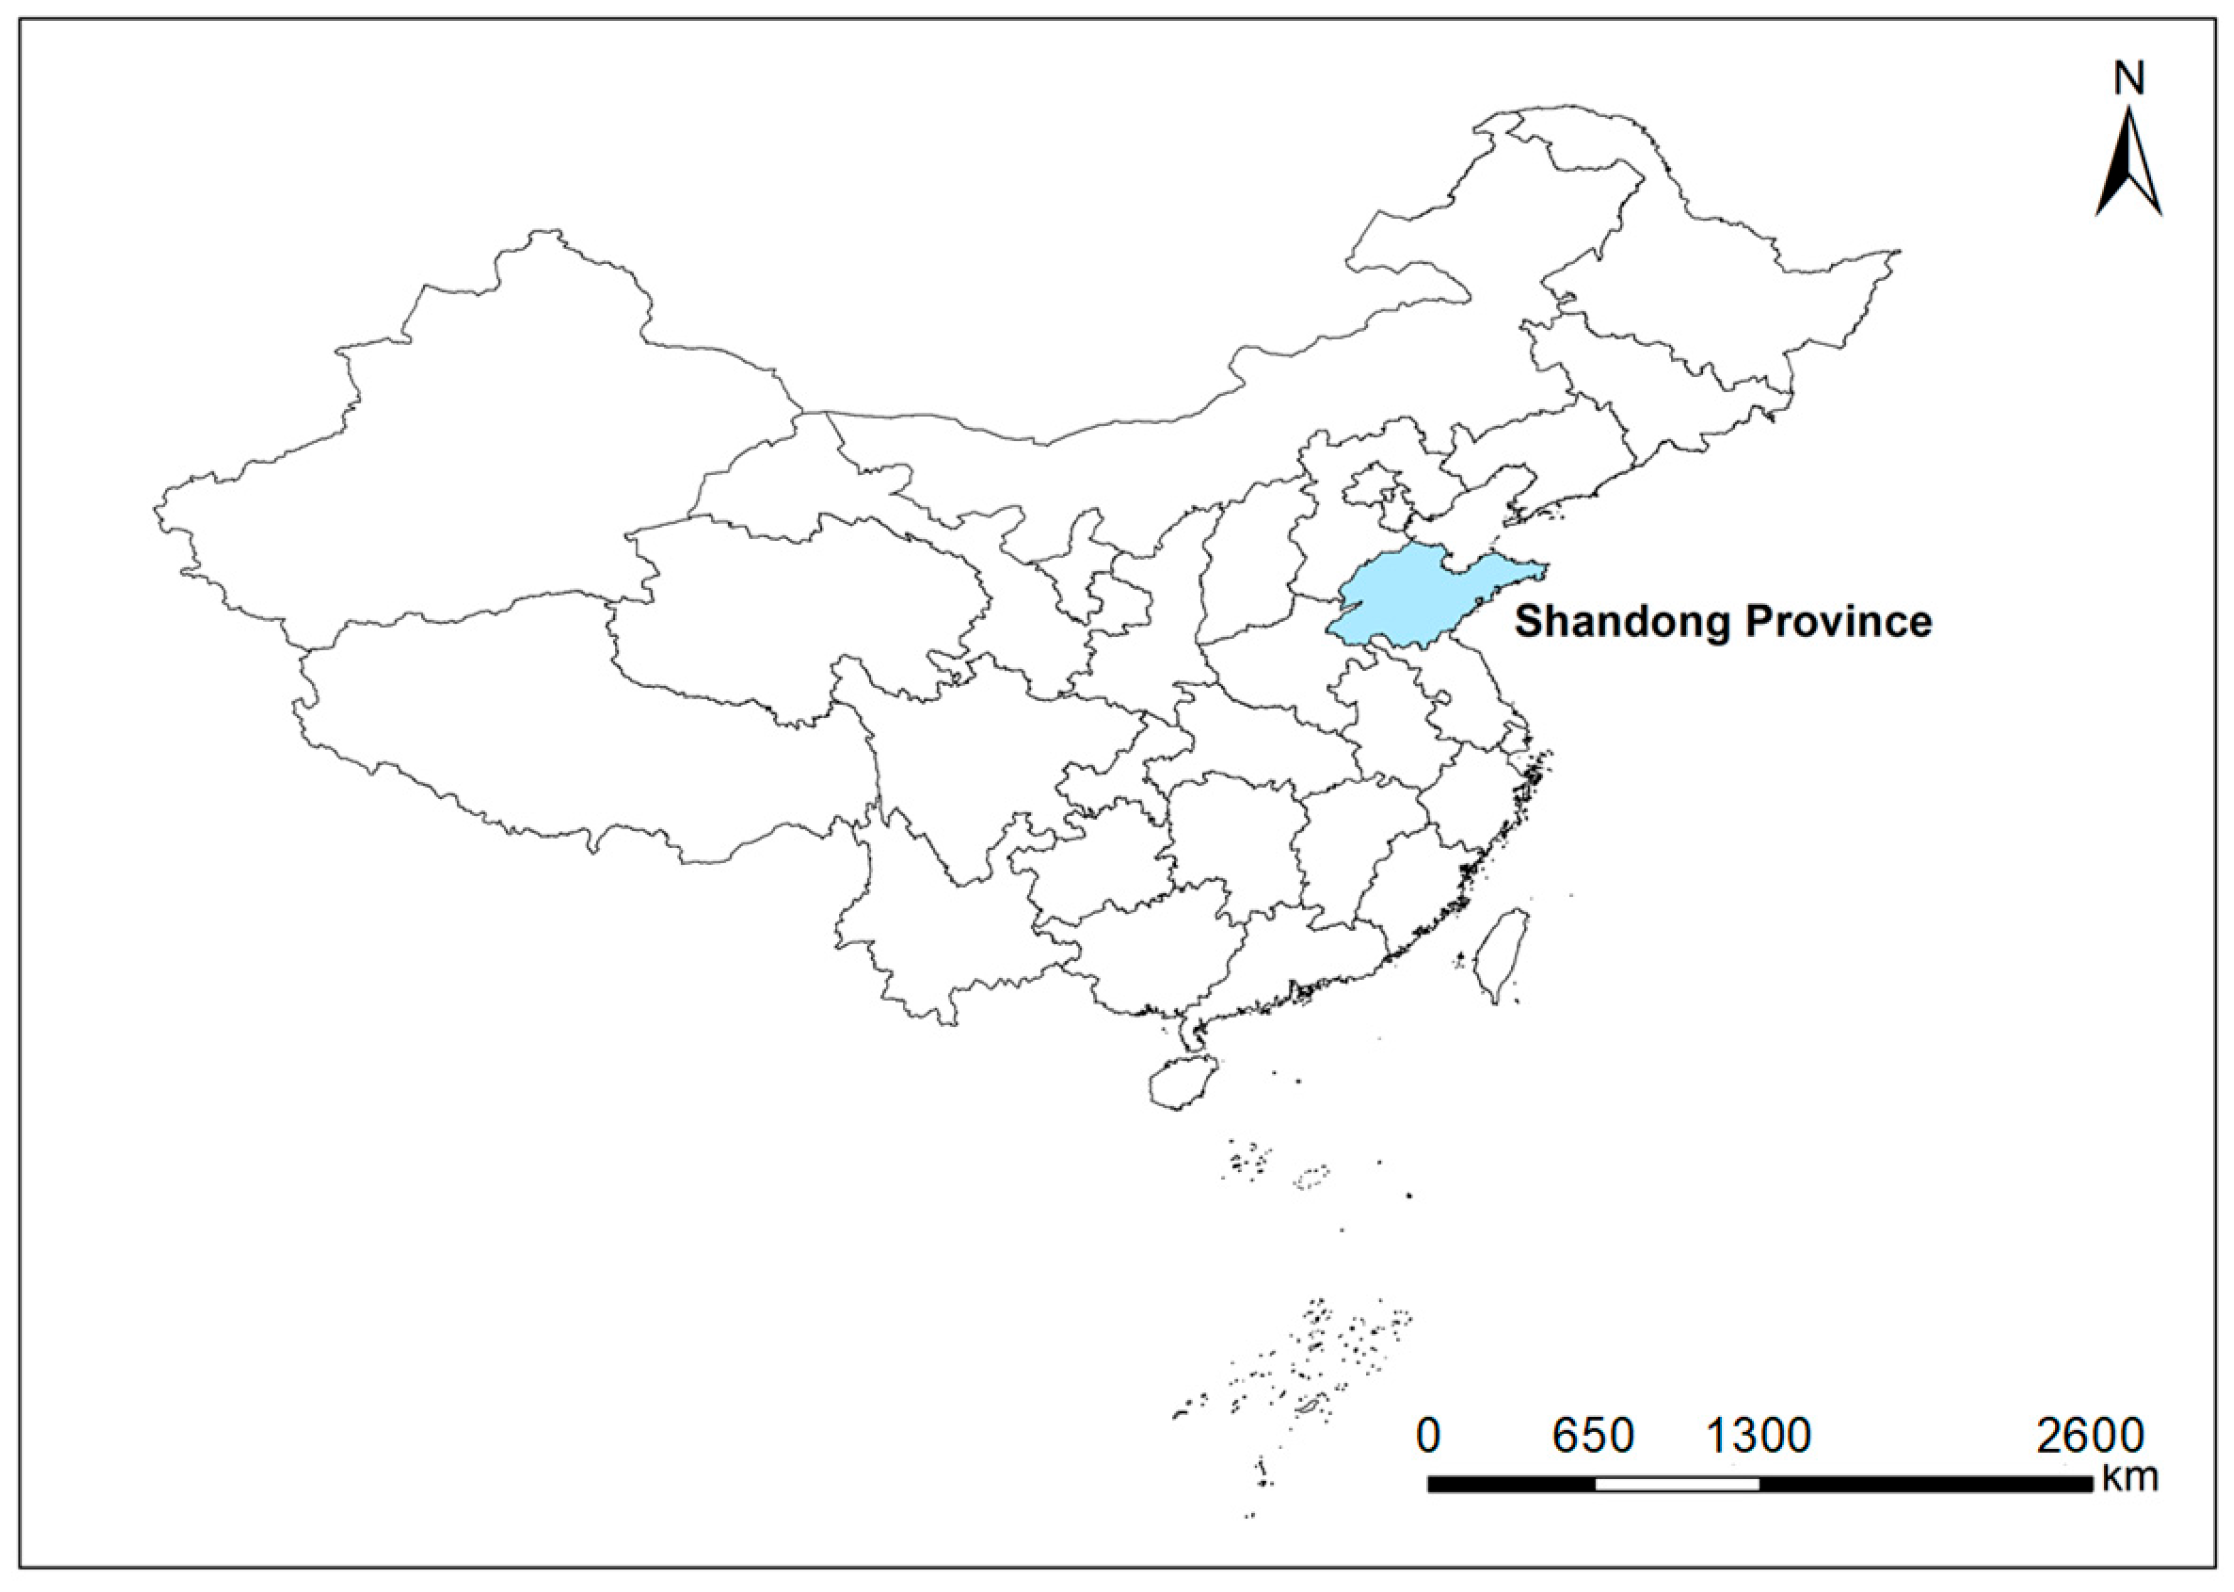
2.1. Study Area

Shandong Province lies in China’s eastern coast and the lower reaches of the Yellow River, encompassing both a peninsula and inland regions (Figure 1). As a major coastal province in China, Shandong has a large economic aggregate and is renowned as a significant agricultural and economic hub. In 2023, its GDP hit CNY 9.4 trillion, ranking third in the country and making up 7.5% of the national total. The sown area of crops in Shandong was 1.1 × 10⁷ hectares, ranking third in China and accounting for 6.4% of the national total. The total agricultural output value amounted to CNY 646.2 billion, ranking second nationally and accounting for 7.4% of the country’s total [27].

2.2. Data Sources and Processing

The data of Shandong Province and its various cities from 2004 to 2023 mainly come from the Shandong Statistical Yearbook and Shandong Rural Statistical Yearbook [28,29]. The research method is shown in Figure 2.

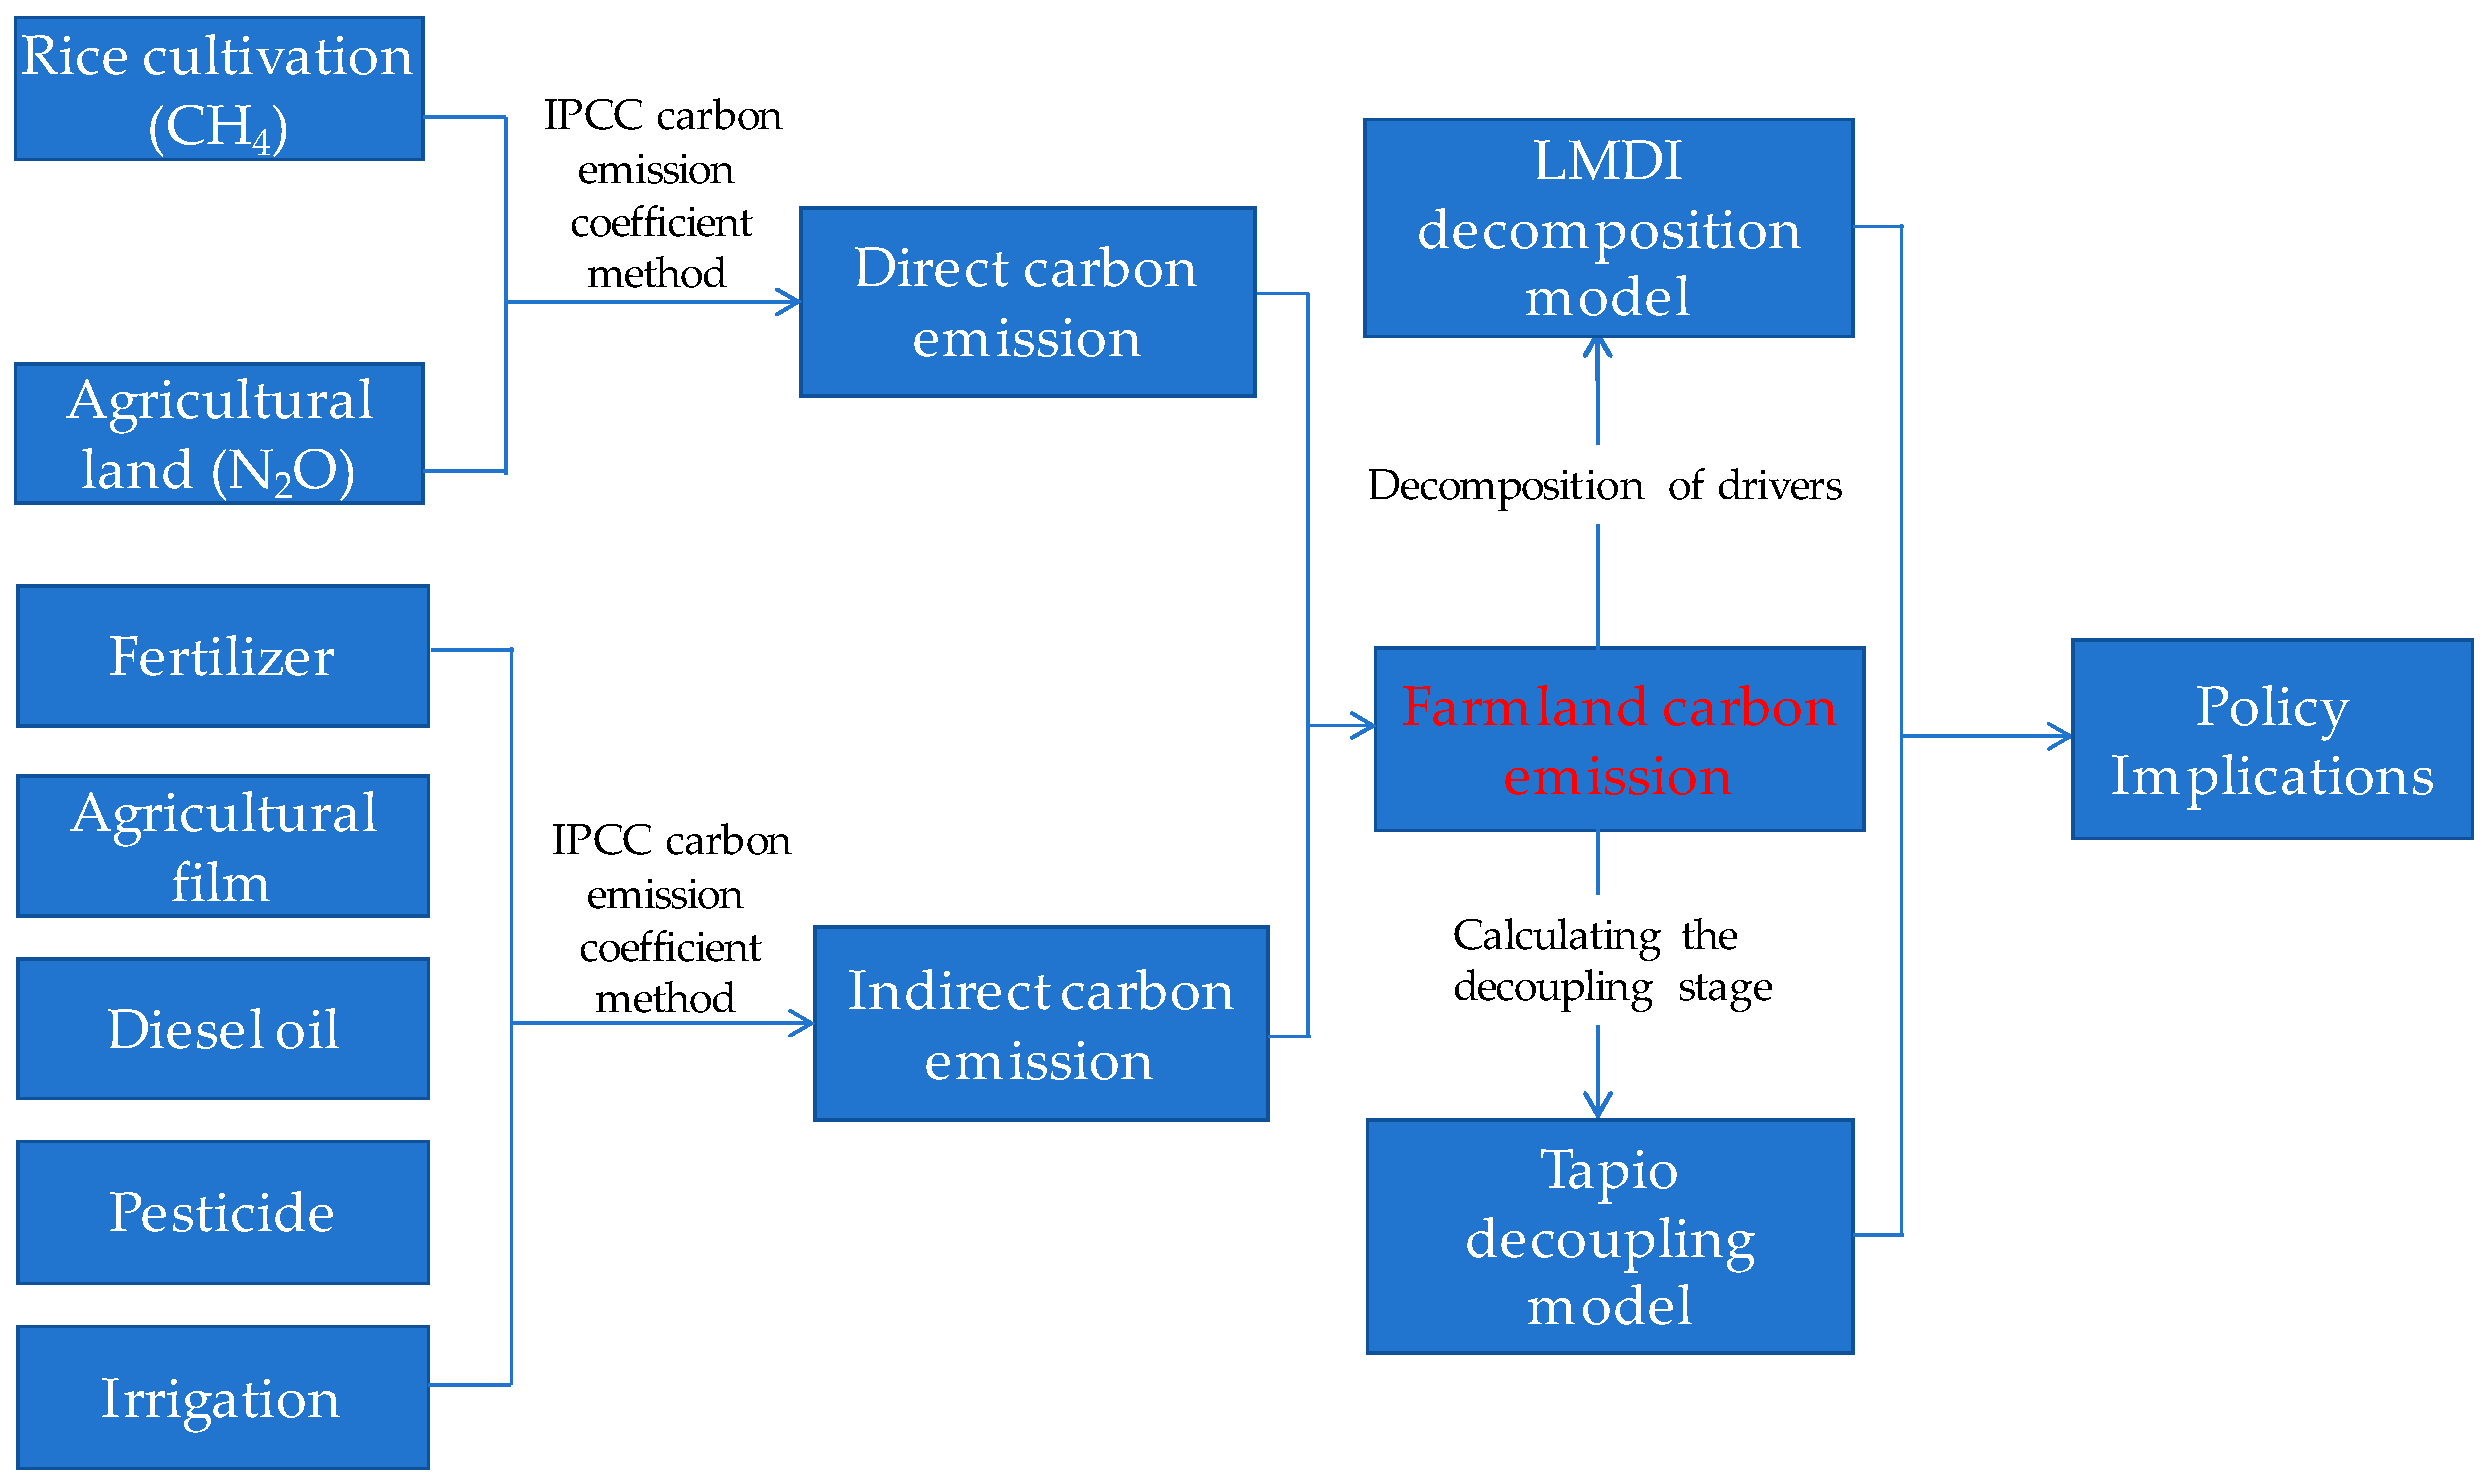
2.3. Calculation of Carbon Emissions

2.3.1. Direct Carbon Emissions

Farmland’s direct carbon emissions can be categorized into methane (CH4) emissions from paddy fields and nitrous oxide (N2O) emissions from dry land areas. The calculation method for CH4 emissions from paddy fields follows the guidelines outlined in the ‘Provincial Greenhouse Gas Inventory Compilation Guide’.
C F C H 4 = A × I × 34
C F C H 4 refers to the carbon emission caused by CH4 emissions from paddy fields, A represents the planting area of rice, I denotes the methane emission factor of rice (210.0 kg·hm−2) [8], and 34 denotes methane’s (CH4) global warming potential (GWP) relative to CO2 over a 100-year timeframe, expressed in CO2 equivalents.
The N2O emissions from dry lands mainly include the direct soil N2O emissions caused by nitrogen fertilizer input, as well as the indirect N2O emissions generated from the atmospheric deposition of NH3 and NOₓ onto farmland soils followed by volatilization and those from groundwater leaching. The N2O emissions from dry lands are estimated using the following formula [5]:
C F N 2 O = D C F N 2 O + G C F N 2 O + L C F N 2 O
D C F N 2 O = N × F 1 × 44 28 × 273
G C F N 2 O = N × F G × F 2 × 44 28 × 273
L C F N 2 O = N × F L × F 3 × 44 28 × 273
D C F N 2 O   refers to the direct soil N2O emissions (kg CO2·eq·ha−1) caused by nitrogen fertilizer input, G C F N 2 O denotes the indirect N2O emissions (kg CO2·eq·ha−1) resulting from the volatilization of NH3 and NOₓ into the atmosphere after their deposition on farmland soils, and L C F N 2 O represents the indirect N2O emissions (kg CO2·eq·ha−1) from groundwater leaching. F1 represents the direct N2O emission factor for nitrogen fertilizer input, with a value of 0.01 [30]; F2 denotes the direct N2O emission factor for nitrogen fertilizer application and F3 stands for indirect emission factors from nitrogen deposition and leaching/runoff losses, with values of 0.01 and 0.0075, respectively. FG is the proportion of fertilizer lost as volatilized NH3 and NOₓ (0.1 kg·kg−1), and FL refers to the nitrogen loss fraction via groundwater leaching and surface runoff (0.3 kg·kg−1). The molecular weight ratio of N2O to N2 is 44/28, while N2O has a 100-year global warming potential (GWP) of 273 relative to CO2, both used to express results in CO2-equivalent units [5].

2.3.2. Indirect Carbon Emissions

Indirect carbon emissions (CFindirect) include inputs of chemical fertilizers, pesticides, diesel, irrigation electricity, and agricultural films. They were calculated by using the following formula:
C F i n d i r e c t = i = 1 n I i × C i
where Ii is the amount of agricultural inputs and Ci is the corresponding CO2 emission coefficient for agricultural input products. The CO2 emission coefficients for nitrogen fertilizer, phosphate fertilizer potassic fertilizer, compound fertilizer, pesticide, electricity for irrigation, diesel, and plastic film were 1.53 kg CE·kg−1, 1.63 kg CE·kg−1, 0.66 kg CE·kg−1, 1.77 kg CE·kg−1, 12.5 kg CE·kg−1, 1.23 kg CE·kWh−1, 0.89 kg CE·kg−1, and 22.0 kg CE·kg−1, respectively.

2.4. LMDI Model

Drawing on the realities of agricultural production in Shandong Province, farmland carbon emissions were categorized into predefined factors: carbon emission intensity effect, agricultural structure effect, economic development effect, and labor effect. The extended Kaya identity and LMDI method were used to recognize, measure, and give an account of the primary driving forces that have an impact on changes in GHG emissions [31,32].
C = C A G D P × A G D P P G D P × P G D P P × P = C I × S I × E I × L I
where C denotes farmland GHG emissions, AGDP represents gross agricultural output value, PGDP denotes primary industry gross output value, and P signifies primary industry employment. CI, calculated as C/AGDP, represents the emission intensity effect, i.e., the ratio of farmland GHG emissions to gross agricultural output value. SI, expressed as AGDP/PGDP, indicates the agricultural structure effect, referring to the proportion of total agricultural output within the primary industry’s total output. EI, formulated as PGDP/P, reflects the economic development effect, representing the ratio of primary industry output to primary industry employment, while LI denotes the labor effect. The efficiency factor (ΔCI) captures changes in farmland GHG emissions relative to total agricultural output. The structural factor (ΔSI) reveals shifts in the agricultural output share within primary industry output. The economic factor (ΔEI) signifies changes in the primary industry’s labor productivity (output per employed person), and the labor factor (ΔLI) measures variations in labor input. Let Ct and Ct−1 denote farmland GHG emissions in periods t and t − 1, respectively, with ΔCtotal representing the total GHG emission change over a cycle. Through additive decomposition of farmland emissions, the GHG emission factors are broken down as follows:
C I = C t C t 1 ln C t ln C t 1 × ln C I t C I t 1
S I = C t C t 1 ln C t ln C t 1 × ln S I t S I t 1
E I = C t C t 1 ln C t ln C t 1 × ln E I t E I t 1
L I = C t C t 1 ln C t ln C t 1 × ln L I t L I t 1
C t o t a l = C I + S I + E I + L I

2.5. Decoupling Model

The Tapio decoupling model serves as the core framework to analyze the relationship between farmland carbon emissions and economic growth [33]. With economic growth, decoupling occurs when the growth rate of farmland carbon emissions lags behind that of the economy or turns negative. According to different decoupling elasticity coefficients, it is divided into decoupling, negative decoupling, and connection, as shown in Table 1. The decoupling elasticity (e) between farmland carbon emissions and economic growth is calculated as follows:
e = ( C t 2 C t 1 ) / C t 1 ( G D P t 2 G D P t 1 ) / G D P t 1
where e is the decoupling elasticity, Ct2 denotes the total farmland carbon emissions in the final period and Ct1 in the base period, and GDPt1 represents the regional GDP in the final period and GDPt2 in the base period.

3. Results

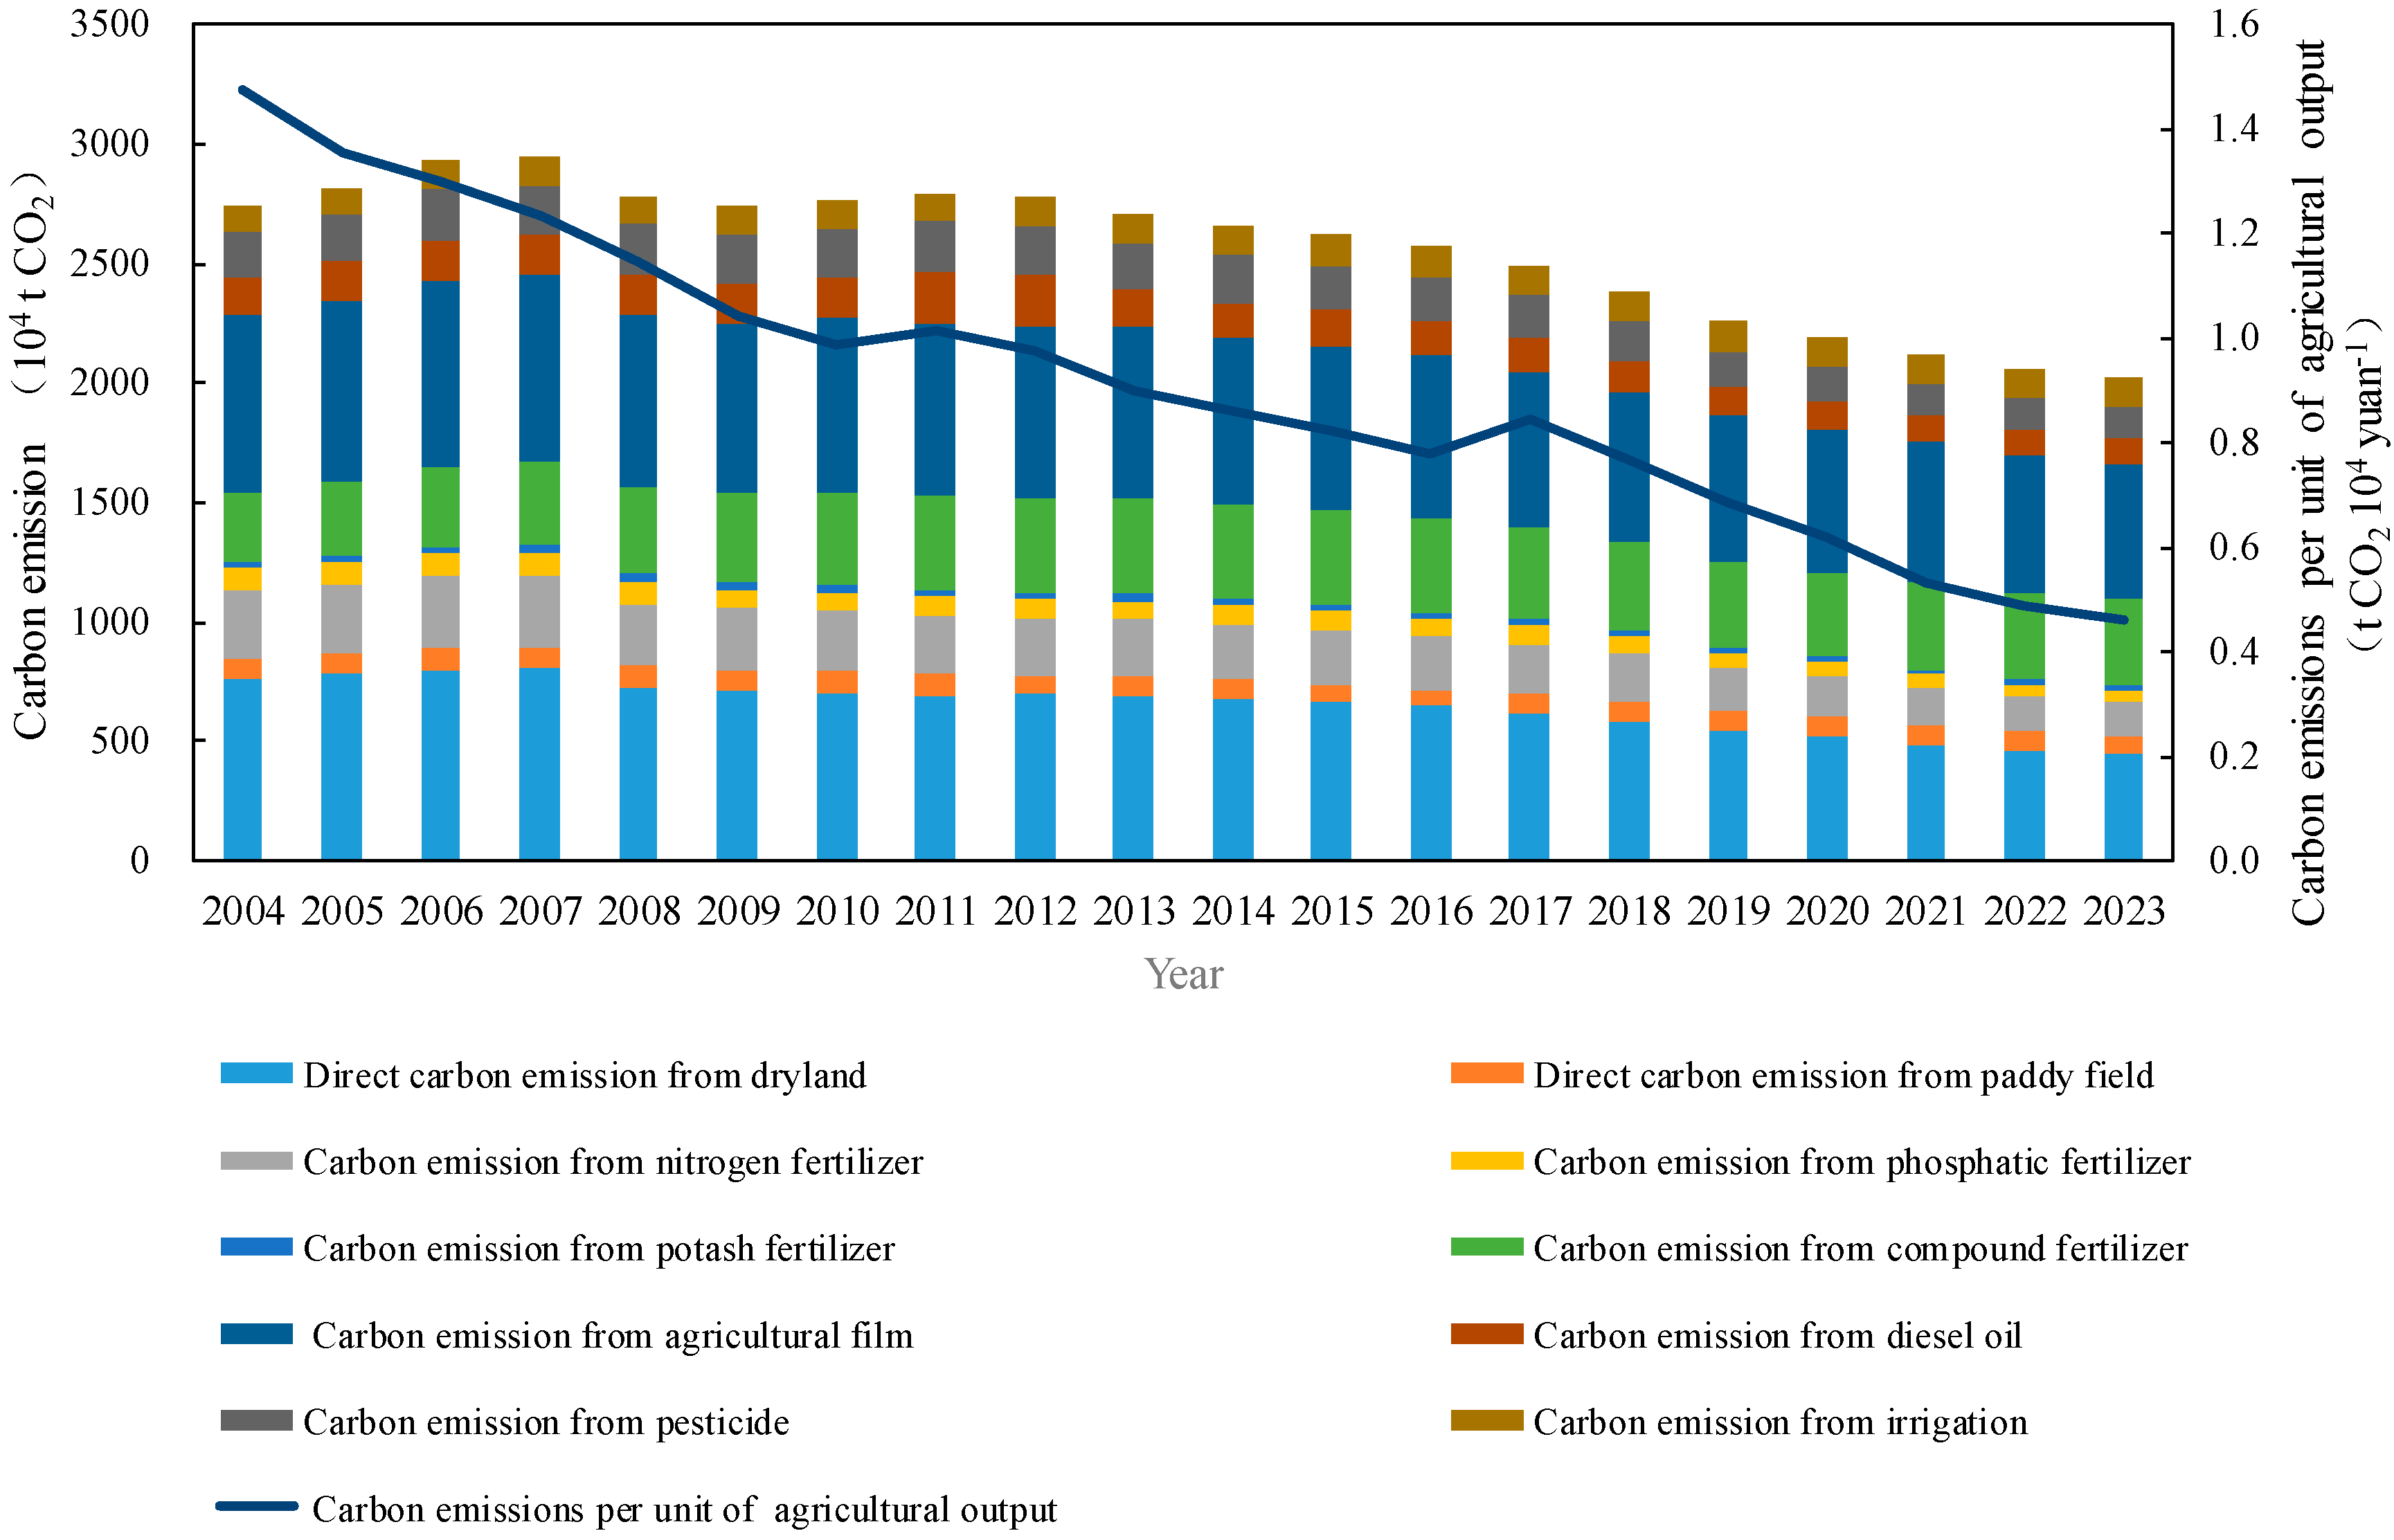
3.1. Farmland Carbon Emissions and Their Intensity in Shandong Province

From 2004 to 2023, the total farmland carbon emissions in Shandong Province showed a trend of “fluctuating increase-stable decrease”. In 2023, the total farmland carbon emissions in Shandong Province was 20.2 million tons, 26.0% lower than in 2004. Shandong Province witnessed its peak farmland carbon emissions in 2007, amounting to 29.4 million tons. Between 2011 and 2023, the province’s farmland carbon emissions exhibited a steady downward trajectory, with an average annual reduction of 6.4 × 10⁵ tons. In the analysis of farmland carbon emission factors, direct emissions from dry land and those from agricultural films accounted for the highest proportion. In 2004, direct dry land emissions and agricultural film emissions made up 27.8% and 27.2% of total emissions, respectively, while potassium fertilizer emissions accounted for the least: 1.1%. From 2004 to 2023, the proportions of direct emissions from dry land and carbon emissions from nitrogen fertilizer, phosphorus fertilizer, potassium fertilizer, and pesticide showed a year-by-year decreasing trend. Compared to 2004, the proportions of direct emissions from dry land, nitrogen fertilizer, phosphorus fertilizer, potassium fertilizer, and pesticide carbon emissions in 2023 decreased by 5.4, 3.2, 1.0, 0.2, and 0.7 percentage points, respectively. In contrast, the proportions of carbon emissions from compound fertilizer and irrigation in 2023 were 7.2 and 2.3 percentage points higher than those in 2004 (Figure 3).
The farmland carbon emission intensity in Shandong Province showed an overall downward trend from 2004 to 2023. In 2023, the carbon emissions per unit output value of farmland in Shandong Province was 0.46 tons of CO2 per 104 CNY, which was 68.9% lower than 1.48 tons of CO2 per 104 CNY in 2004.

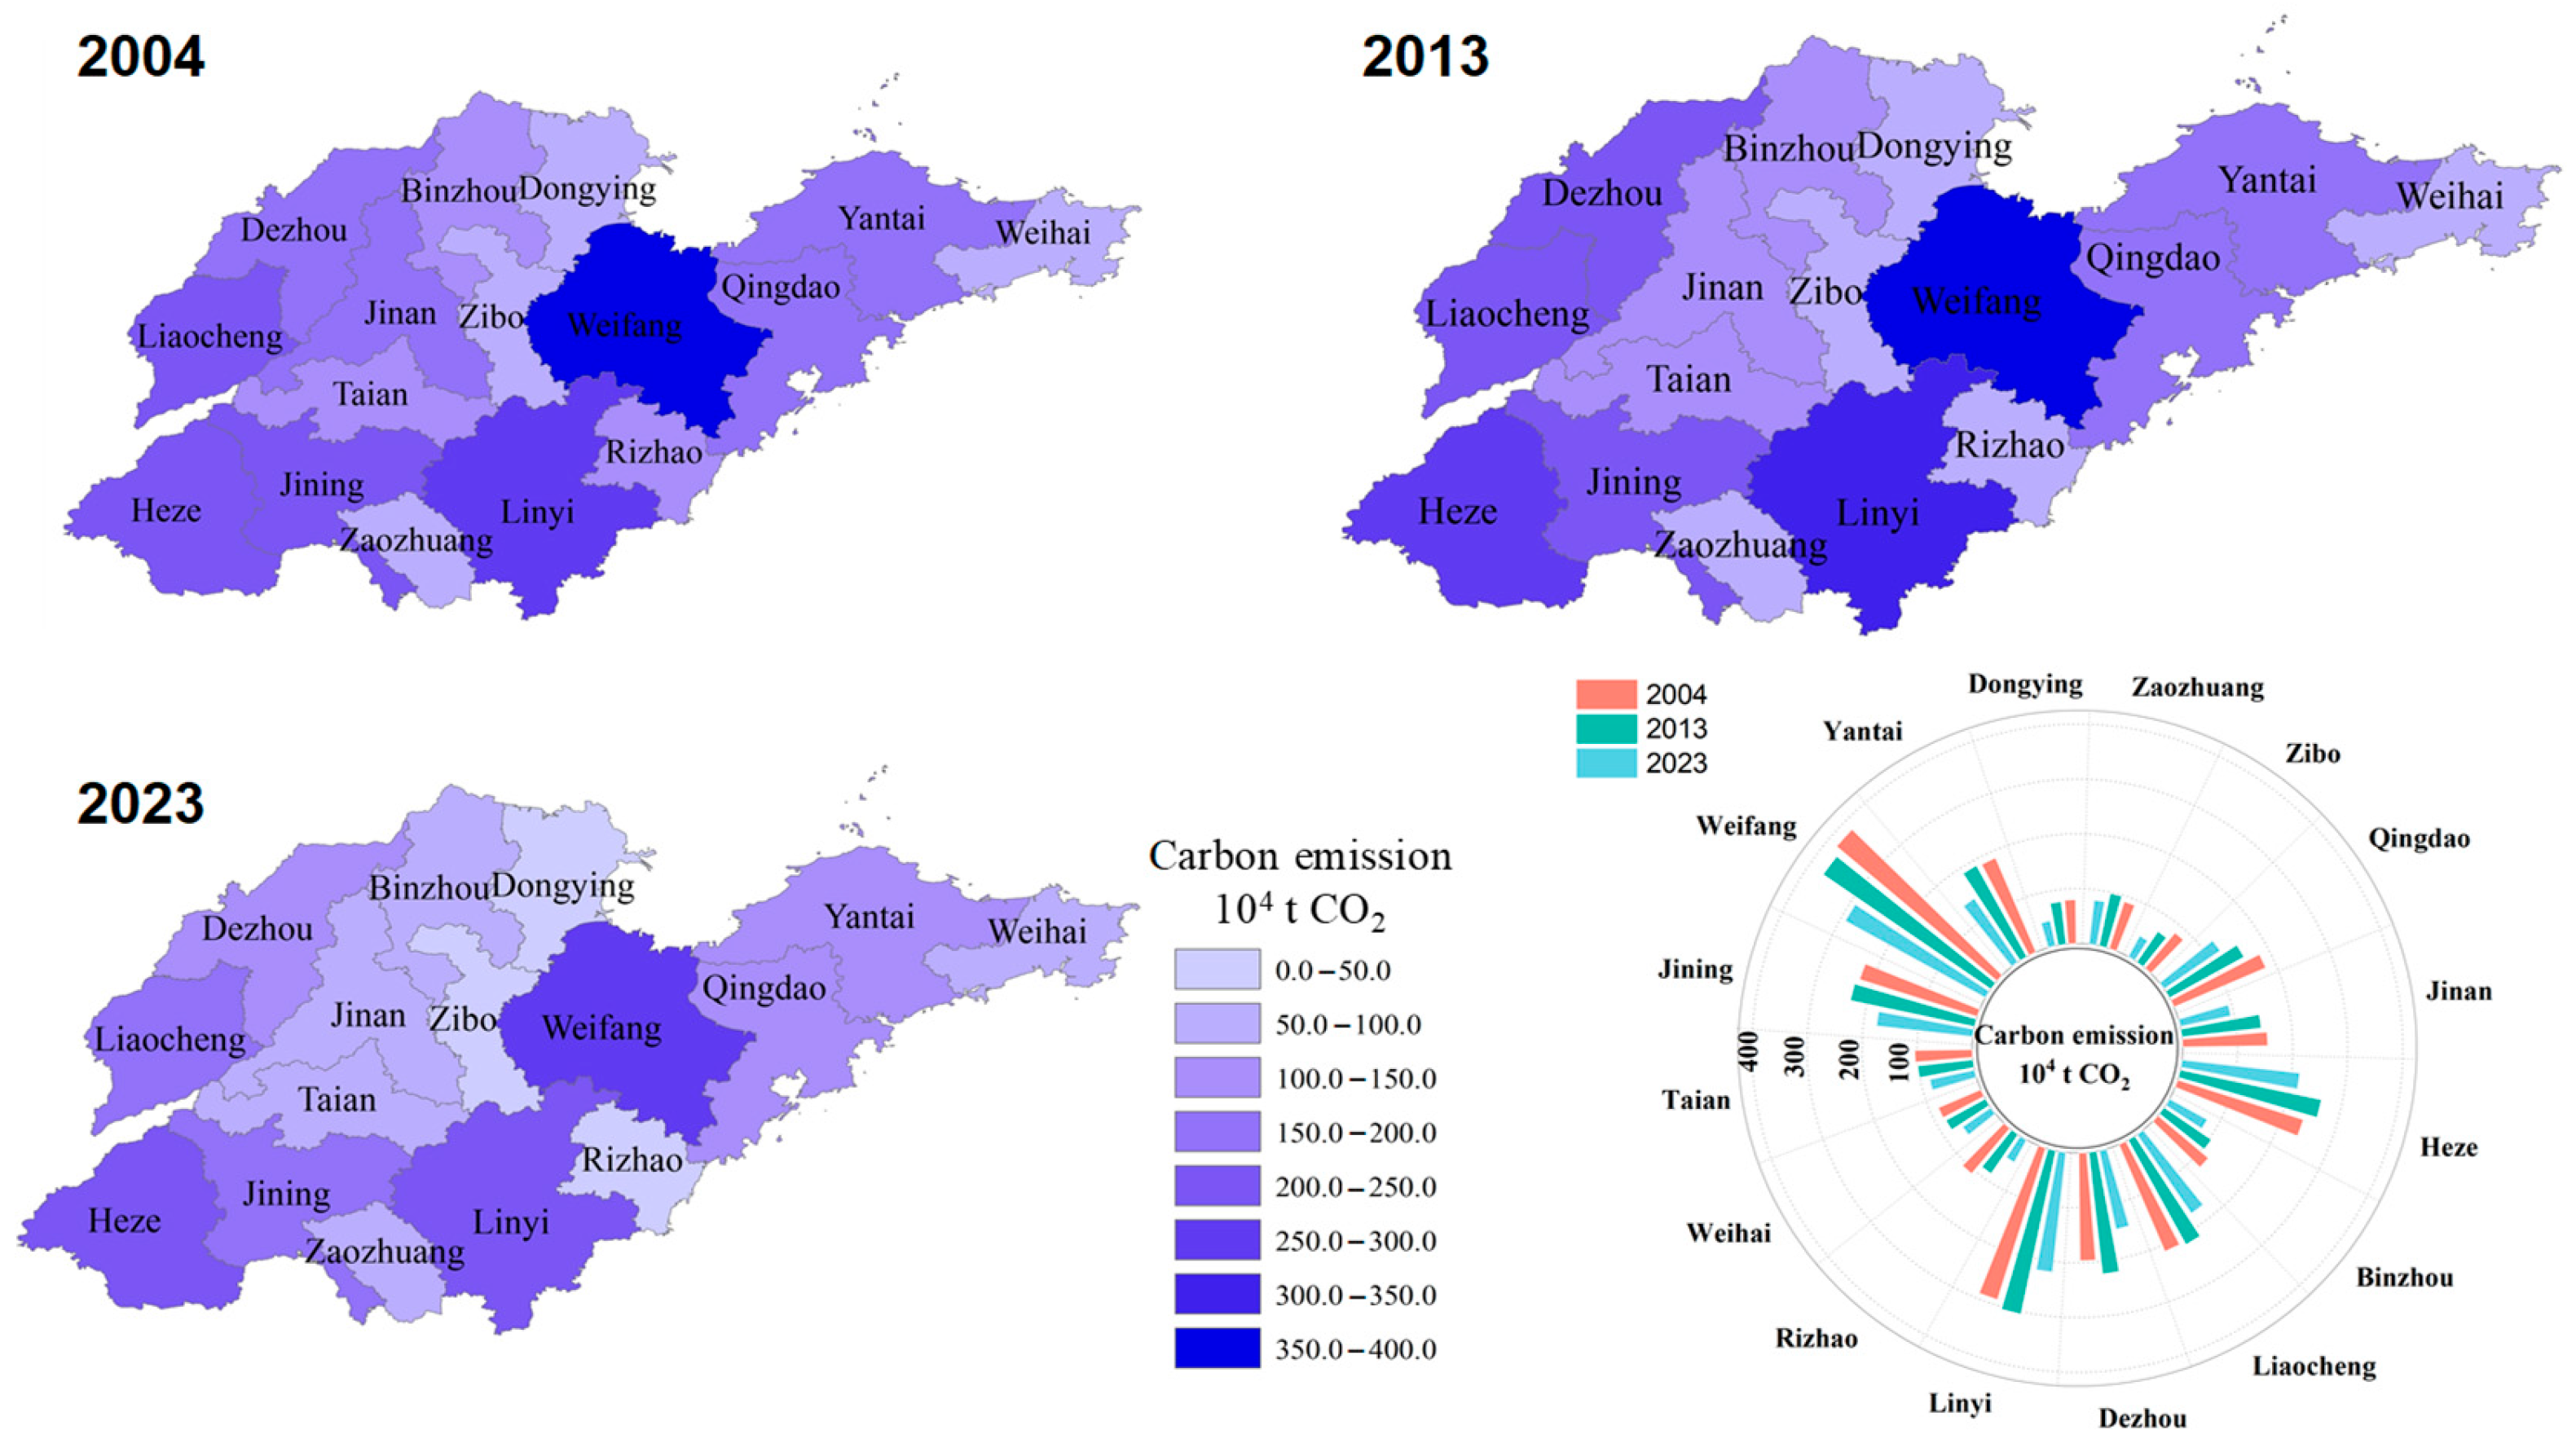
3.2. Spatial Distribution of Carbon Emissions in Key Years Across Shandong’s Cities

Both direct and indirect emissions from cities across Shandong Province showed a downward trend from 2004 to 2023. In 2004, Linyi recorded the highest direct farmland emissions at 1.0 × 10⁶ tons, while Zibo had the lowest direct farmland emissions at 2.1 × 10⁵ tons. In 2023, Jining ranked first in Shandong Province in terms of paddy field planting area, resulting in the highest direct farmland carbon emissions at 6.8 × 10⁵ tons. Zibo again had the lowest direct farmland carbon emissions at 9.8 × 10⁴ tons. From 2004 to 2023, Rizhao saw the highest decline rate in direct farmland carbon emissions at 68.0%, whereas Zaozhuang had the lowest decline rate in direct farmland carbon emissions at 19.0%. In 2004, Weifang, with its large protected vegetable planting area and high input of agricultural means of production, had the highest indirect farmland carbon emissions among the 16 cities in Shandong Province, reaching 3.0 × 10⁶ tons. Dongying had the lowest indirect farmland carbon emissions at 5.5 × 10⁵ tons. In 2023, Weifang still had the highest indirect farmland carbon emissions at 2.5 × 10⁶ tons, while Zibo had the lowest indirect farmland carbon emissions at 3.3 × 10⁵ tons. From 2004 to 2023, Rizhao registered the highest decline rate in indirect farmland carbon emissions at 52.4%, and Zaozhuang had the lowest decline rate in indirect farmland carbon emissions at 4.9% (Table 2).
Shandong Province exhibited regional variations in farmland carbon emissions. In 2004, Weifang had the highest total farmland carbon emissions, hitting 3.8 million tons, making up 13.9% of Shandong’s total farmland carbon emissions, Weihai had the lowest total farmland carbon emissions, at 8.4 × 10⁵ tons, accounting for 3.1% of the province’s total carbon emissions. Compared to 2004, total carbon emissions in Shandong’s cities saw little significant change in 2013, although those in Linyi, Dezhou, Heze, and other cities rose relatively, while those in Qingdao, Zibo, Rizhao, and other cities relatively decreased. In 2023, the total carbon emissions across different regions of Shandong Province presented a comparative downward trend when contrasted to those in 2004. Among them, Rizhao had the largest decline, reaching 56.6%, and Zaozhuang had the smallest decline in total farmland carbon emissions at 9.6% (Figure 4).

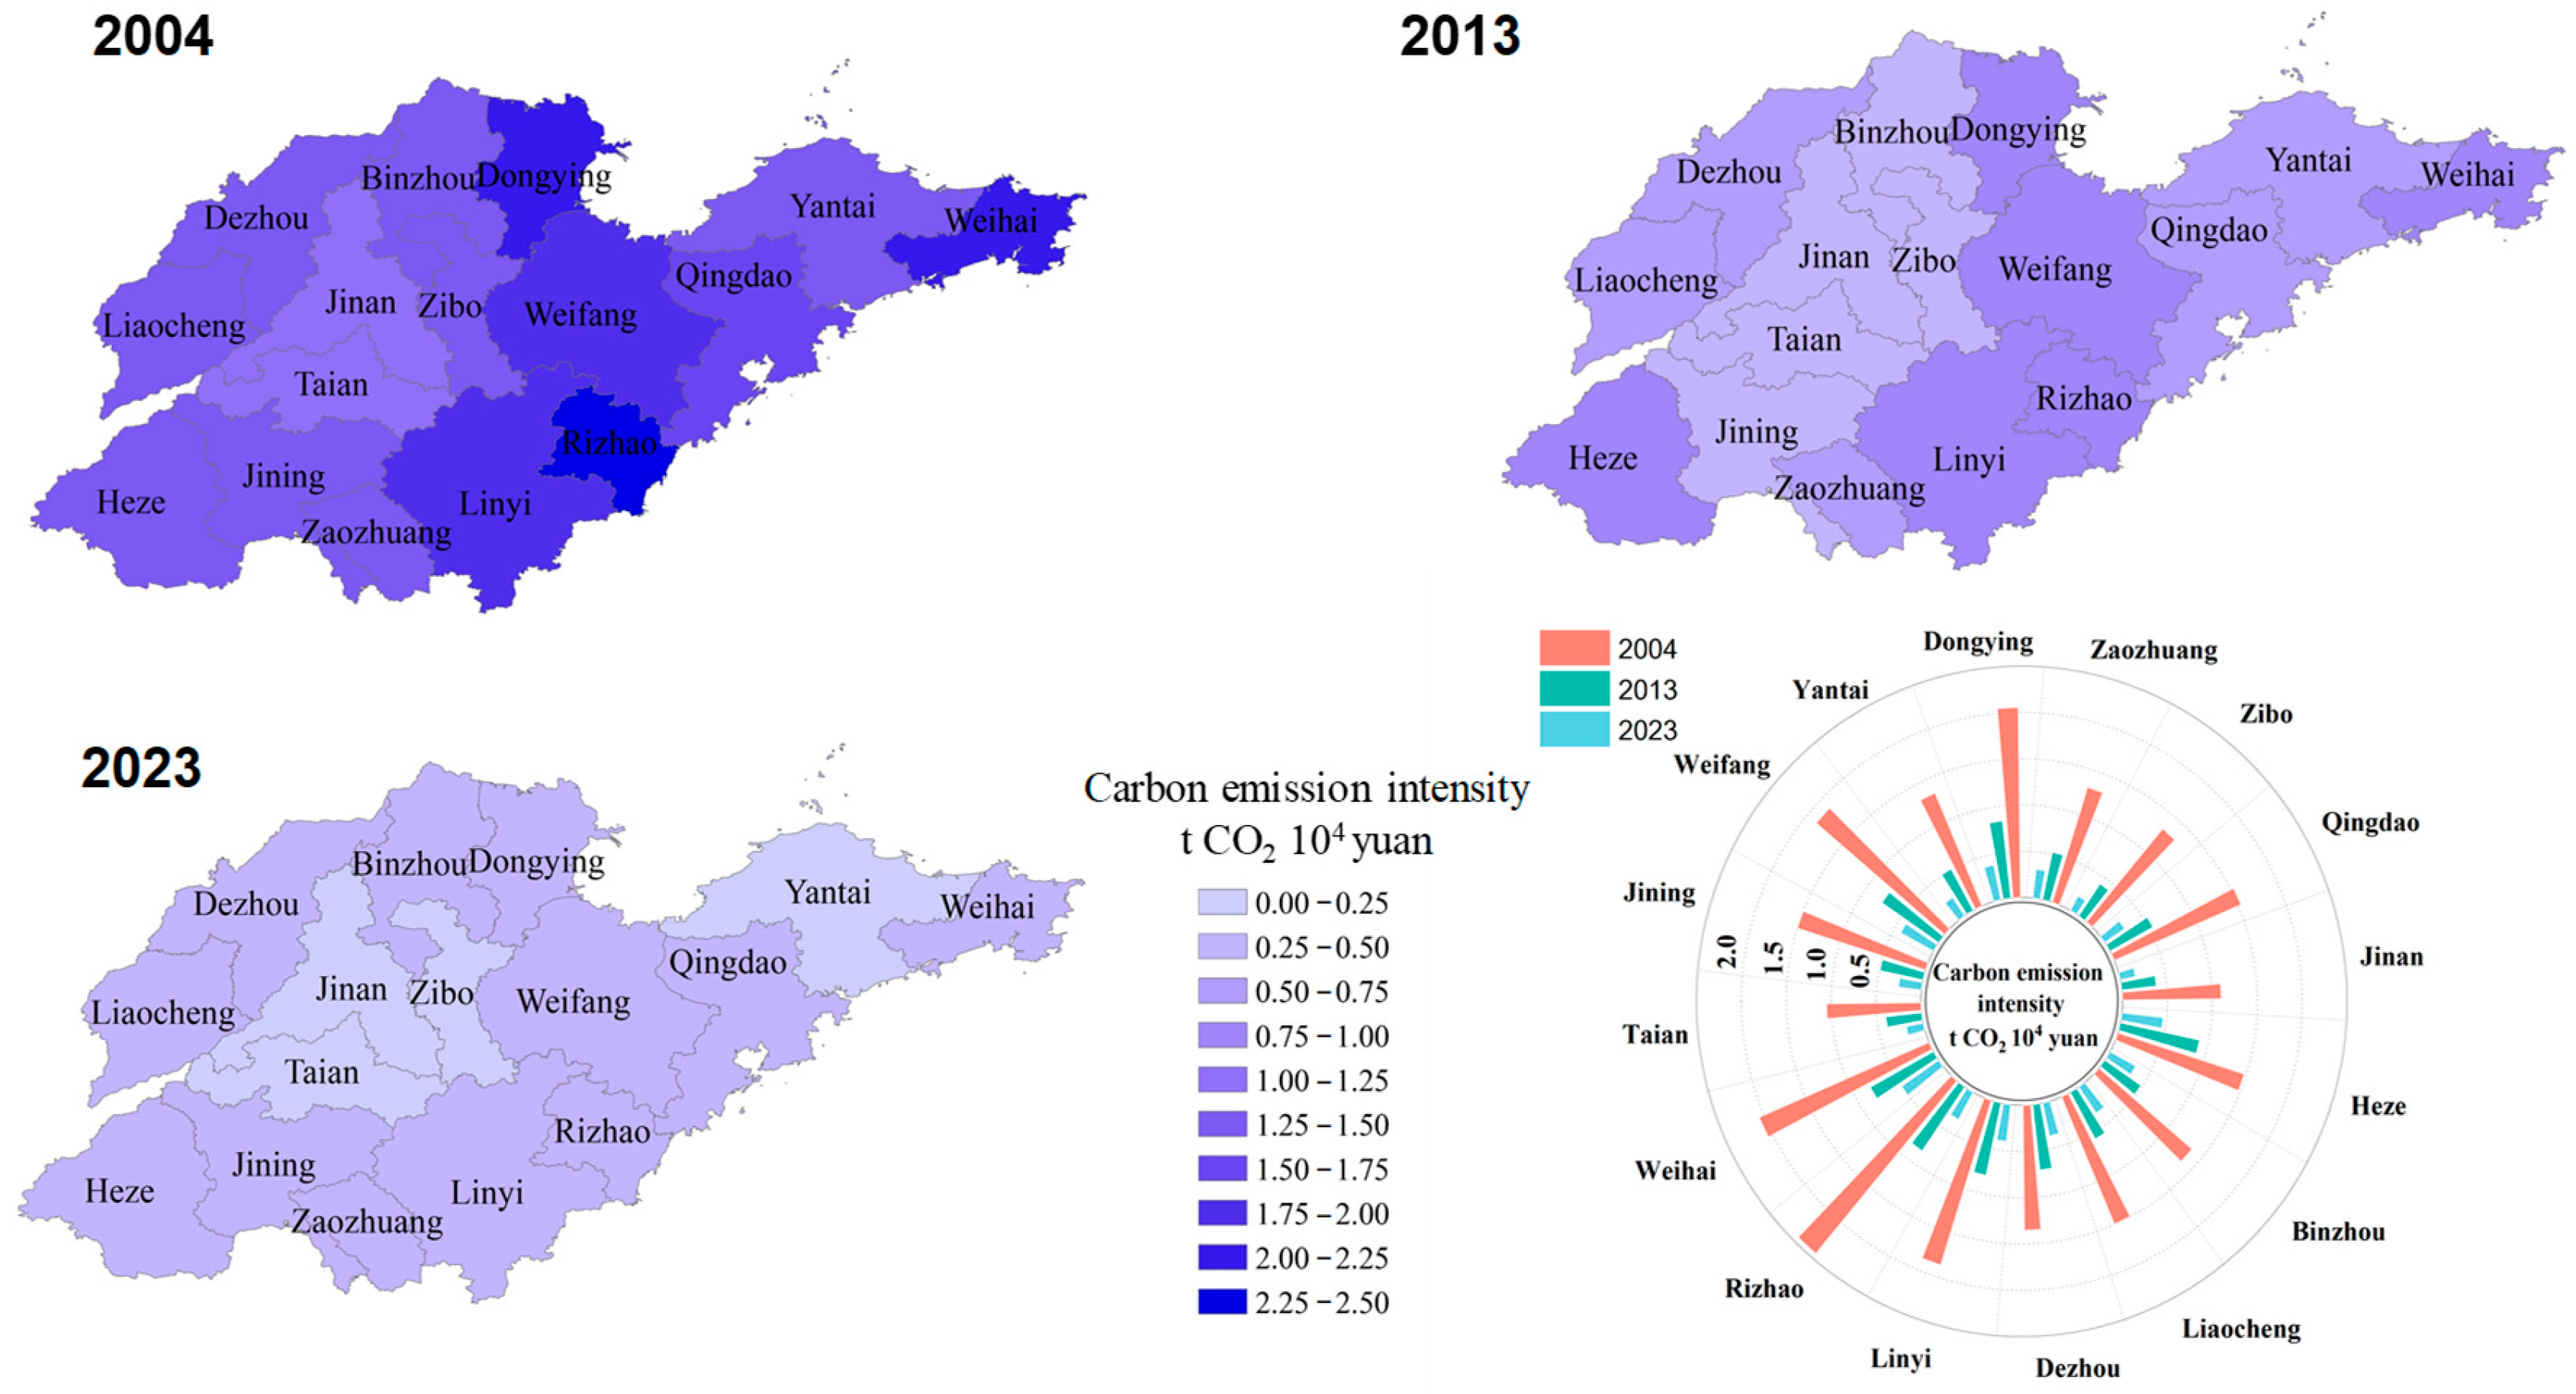
3.3. Spatial Distribution of Carbon Emission Intensity in Key Years Across Shandong’s Cities

Farmland carbon emission intensity varied regionally across Shandong’s cities. In 2004, Rizhao, Weihai, Dongying, Linyi, and Weifang were high-value areas for this intensity, being 2.44, 2.06, 2.05, 1.87, and 1.87 tons CO2 per 104 CNY, respectively. Tai’an and Jinan were the low-value areas, with values of 1.05 and 1.10 tons CO2 per 104 CNY, respectively. In 2013, farmland carbon emission intensity across Shandong’s cities ranged from 0.38 to 0.90 tons of CO2 per 104 CNY. When compared to 2004, every city in Shandong Province showed a reduction in farmland carbon emission intensity by 2013. Among them, Jining had the largest decline, reaching 67.4%, Heze had the smallest decline, at 39.1%. In 2023, Jinan had the lowest farmland carbon emission intensity, at 0.17 tons CO2 per 104 CNY, while Weihai had the highest, at 0.50 t CO2 per 104 CNY. Compared to 2004, Zibo had the largest reduction in farmland carbon emission intensity at 86.6%, and Heze had the smallest reduction at 68.8% (Figure 5).

3.4. Factors Influencing Farmland Carbon Emissions in Shandong Province

With 2004 set as the baseline year for the LMDI model, an analysis was conducted on the drivers of farmland carbon emissions in Shandong Province across four dimensions: carbon emission intensity, agricultural structure, economic development, and labor effects. Of these, carbon emission intensity, agricultural structure, and labor effects acted as inhibiting factors, exerting negative impacts on the growth of such emissions, while the economic development effect positively drove their growth. The carbon emission intensity, agricultural structure, and labor effects reduced Shandong’s farmland carbon emissions by 2.9 × 10⁶ tons, 1.9 × 10⁵ tons, and 2.5 × 10⁶ tons, respectively. The economic development effect pushed up these emissions by 5.3 × 10⁶ tons. Between 2004 and 2023, the total reduction in Shandong Province’s farmland carbon emissions attributed to the four factors stood at 2.1 × 10⁵ tons. From 2004 to 2023, the carbon emission intensity effect had the highest contribution rate to farmland carbon emissions in Shandong Province, reaching 274.7%, while the labor effect had the lowest contribution rate at 536.7% (Table 3, Figure 6).

3.5. Decoupling Analysis of Farmland Carbon Emissions and Economic Development in Shandong Province

From 2004 to 2013, carbon emissions decreased while regional GDP increased in Jinan, Qingdao, Zibo, Dongying, Tai’an, Weifang, Weihai, Rizhao, and Binzhou, showing a strong decoupling between economic growth and carbon emissions. In contrast, carbon emissions increased alongside regional GDP growth in Zaozhuang, Yantai, Jining, Linyi, Dezhou, Liaocheng, Binzhou, and Heze, presenting a weak decoupling state. Among these cities, Zibo had the strongest decoupling, with an elasticity of −0.09, while Dezhou had the weakest at 0.05. From 2014 to 2023, carbon emissions in all Shandong cities trended downward as regional GDP grew, both reflecting a strong decoupling between economic development and carbon emissions. Dongying ranked highest in decoupling, with an elasticity of −2.89, whereas Heze had the weakest at −0.17 (Table 4).

4. Discussions

4.1. The Changes of Carbon Emissions in Shandong Province over the Years

Farmland carbon emissions in Shandong Province peaked in 2007 and then gradually declined year by year, which is consistent with the findings of Liu et al. (2022) [34]. This trend is mainly attributed to the orientation of national agricultural policies [35]. In 2005, China proposed to increase direct subsidies to grain farmers, and in 2006, the traditional agricultural tax that had been implemented for more than 2600 years was fully abolished. A set of policies boosted farmers’ enthusiasm for grain cultivation, resulting in gradual growth in agricultural inputs, along with marked progress in agricultural productivity and mechanization. However, due to farmers’ poor awareness of low-carbon practices at the time, farmland carbon emissions rose alongside increased agricultural inputs, with those arising from such inputs peaking in 2007 [34,36]. After 2007, China successively implemented a series of cost-reducing and efficiency-improving measures, including soil testing and formula fertilization, comprehensive straw utilization, and fertilizer and pesticide reduction initiatives [24,37]. Shandong actively responded to the national push for low-carbon agricultural development, gradually easing the conflict between agricultural growth and resource and environmental concerns. This has resulted in an annual decline in the province’s agricultural carbon emissions since 2007 [38].
Among all cities in Shandong Province, Weifang has consistently maintained high agricultural carbon emissions (Figure 4). This is primarily attributed to its crop structure, which is dominated by high-input crops such as vegetables. The heavy use of chemical fertilizers and frequent irrigation in vegetable cultivation result in elevated carbon emissions [39]. Between 2004 and 2023, Rizhao achieved the highest reduction in carbon emissions at 56.6%, while Zaozhuang recorded the lowest at 9.6% (Figure 5). This discrepancy can be attributed to divergences in agricultural structure, technological adoption, and policy responsiveness between the two regions. As a major export-oriented vegetable production base in Shandong, Rizhao has a high proportion of protected agriculture and adopted low-carbon farming practices relatively early. In contrast, Zaozhuang relies heavily on traditional wheat-maize rotation, with persistently high application rates of chemical fertilizers and pesticides, coupled with frequent soil tillage, leading to high direct farmland carbon emissions. Rizhao, leveraging its port location advantages, has been compelled to optimize agricultural input efficiency due to demands from agricultural product exports. Zaozhuang, however, suffers from low agricultural scale, with high energy consumption from small-scale agricultural machinery and low fertilizer utilization rates, resulting in slow reductions in indirect carbon emissions. In terms of policy response, Rizhao has been included in Shandong’s low-carbon agriculture pilot zones, boasting a well-established linkage mechanism between carbon reduction subsidies and green certification. In contrast, Zaozhuang has insufficient investment in agricultural transformation, with delayed promotion of low-carbon technologies compared to advanced regions in the province, widening the gap in emission reduction effectiveness.
Due to being unaffected by the base number of total resources, farmland carbon emission intensity can more directly reflect a region’s low-carbon agricultural development level than total emissions [34]. The farmland carbon emission intensity in Shandong Province exhibited marked regional disparities between the east (Qingdao, Yantai, Weihai, Weifang, Rizhao) and west (Dezhou, Liaocheng, Heze, Binzhou), which may be caused by different planting structures and agricultural input in different regions. The eastern region had a high proportion of high-value-added cash crops (such as vegetables) and facility agriculture, with large agricultural input, resulting in significantly higher carbon emission intensity than the western inland areas. In the future, farmland carbon emission intensity can be reduced by optimizing the planting structure and production mode, strengthening technical cooperation between the east and west, and constructing a low-carbon agricultural mechanism [40].

4.2. Carbon Emission Factors and Their Relationship with Economic Development

Findings from the LMDI analysis indicate that the economic effect is a key contributing factor to farmland carbon emissions, consistent with the research by Huang et al. (2024), who identified it as a major driver of rising carbon emissions [41]. This suggests that Shandong’s economic growth has fueled an upward trend in such emissions. Therefore, there is a need to further improve agricultural productivity and constantly minimize farmland carbon emissions via scientific and technological advancements in agriculture, including the optimization of agricultural inputs, transformation of farmland infrastructure, and enhancement of agricultural resource distribution [42]. The carbon emission intensity effect was the primary inhibitor of farmland carbon emissions in Shandong, reflecting gradual improvements in agricultural production efficiency over the past 20 years. Alongside advances in agricultural mechanization and the adoption of practices like reducing chemical fertilizer and pesticide use, per-unit-output-value farmland emissions have fallen year by year. Ranking second among inhibitory factors for such emissions, the labor effect has driven a decline in Shandong’s total farmland carbon emissions over the past two decades. This indicates a gradual decrease in the population engaged in agricultural production, possibly related to agricultural structure adjustment and progressive improvements in urbanization. Meanwhile, it also reflects indirect progress in agricultural technology and gains in agricultural production efficiency [43]. The adjustment of agricultural structure has also played a role in reducing Shandong Province’s total farmland carbon emissions, which aligns with the research conclusions of Huang et al. (2022) [44]. Under the premise of maintaining the overall agricultural proportion, the realignment of agricultural structures and upgrading of agricultural industries can center on adopting modern low-carbon planting techniques and cultivating low-carbon agricultural models. Thereby, this will promote the high-quality green development of agricultural industries in Shandong Province.
From 2004 to 2013, farmland carbon emissions in Jining, Zaozhuang, Dezhou, Yantai, Linyi, Heze, and Liaocheng showed a weak decoupling state from economic development, while all cities in Shandong Province achieved strong decoupling between 2014 and 2023 (Table 4). This transformation was primarily attributed to the superimposed effects of systematic policies and technological innovations after 2014. During the weak decoupling phase (2004–2013), the seven cities, including Zaozhuang and Yantai, exhibited a “high output value-high carbon input” pattern due to the expansion of cash crops and the initiation of facility agriculture. However, constrained by technical limitations and policy intensity, carbon emission growth rates were only slightly lower than economic growth rates. In 2015, China promulgated the Action Plan for the Prevention and Control of Agricultural Non-Point Source Pollution, initiating a zero-growth campaign for chemical fertilizers and pesticides. This policy led to a significant provincewide reduction in the application of fertilizers and pesticides [45]. Additionally, clean energy use in facility agriculture, adoption of advanced low-carbon technologies, and shifts in the agricultural industrial structure toward “high-value, low-carbon” models have driven a gradual move toward strong decoupling between farmland carbon emissions and economic development in Shandong Province.

4.3. Policy Implications

Adopting large-scale, cleaner, and scientific models is of far-reaching significance for reducing agricultural input, increasing farmland mechanization, and improving production input and agricultural resource utilization efficiency. Scale operation enables centralized allocation and sharing of resources. Through the unified operations of large agricultural machinery, it reduces energy consumption and carbon emissions per unit area. Shandong Province’s priority lies in optimizing wheat–maize rotation in the western plain, a region that accounts for over half of the province’s grain output, as these crops dominate its farmland. Specific regional measures include deploying large-scale mechanized facilities, promoting suitable no-till wheat planters to reduce soil disturbance, and using GPS-guided irrigation systems in central Shandong’s mountainous areas to target water-scarce regions and enhance water use efficiency. Furthermore, promoting green agricultural inputs such as bio-fertilizers and biopesticides to replace traditional chemical fertilizers and pesticides can not only reduce soil and water pollution from chemical substances, but also decrease GHG emissions generated during fertilizer production and use [46]. Notably, Weifang’s facility agriculture integrates solar-powered climate control systems and soil amendments to lower emissions from high-value crops like tomatoes, leveraging the Jiaodong Peninsula’s abundant solar resources. Scientific farming methods, based on the concept of precision agriculture, leverage technologies to achieve the precise monitoring and management of soil nutrients, moisture, and crop growth conditions. By fertilizing and irrigating on demand, these methods avoid excessive resource input and enhance utilization efficiency [47]. Such shifts in field management practices are vital for transitioning from extensive to intensive low-carbon agriculture, and represent an inevitable step in tackling climate change and advancing sustainable agricultural development.
Tailoring agricultural structures to local conditions and promoting climate-smart agriculture play an irreplaceable role in reducing non-CO2 GHG emissions from agricultural production [48,49]. Considering the marked disparities in climate, soil, and other natural factors across various regions of Shandong Province, planting structures need to be rationally adjusted in line with local conditions. In the fruit-growing regions of the eastern peninsula (e.g., Yantai’s apple orchards), inter-row cover cropping enhances soil organic carbon sequestration, a practice well-suited to the area’s temperate monsoon climate, while curbing summer soil evaporation [50,51]. In southwestern Shandong, converting low-yield fields to nitrogen-fixing peanut crops capitalizes on local processing clusters in Heze, thereby reducing the application of synthetic fertilizers. The Yellow River Delta prioritizes salt-tolerant forages such as alfalfa across its saline-alkali soils, integrating with livestock enterprises to establish low-carbon feed-livestock cycles that mitigate methane emissions from manure. Through these measures, a more efficient, low-carbon, and sustainable agricultural industry system can be constructed, making important contributions to achieving low-carbon agricultural development and mitigating climate change.
It is noteworthy that reducing farmland carbon emissions in Shandong is a systematic project, which requires not only technological innovation and promotion, but also collaborative support from policy, the market, and society. The government needs to boost funding for the innovation and deployment of low-carbon agricultural technologies tailored to Shandong’s dominant crops like wheat, maize, and facility vegetables, enact supportive policy frameworks, and promote the adoption of low-carbon practices by farmers. Furthermore, increasing the establishment of agricultural science and technology service systems is essential to furnish farmers with technical training and guidance. Meanwhile, it is essential to improve the carbon trading market mechanism, incorporate emission reductions from Shandong’s core agricultural sectors (including Weifang’s vegetable cultivation, Yantai’s apple production, etc.) into the provincial carbon trading pilot, allow for farmers to gain economic benefits through carbon reduction and boost their enthusiasm to participate in low-carbon agricultural development. Launching low-carbon certification for Shandong’s signature agricultural products—such as Weifang vegetables, Yantai apples, Laiyang pears, and Jining garlic—will help these high-quality products access premium domestic and international markets, creating a value-added incentive for emission reduction efforts. Additionally, strengthening publicity and education can enhance the public’s awareness of low-carbon agricultural development, helping to foster a positive atmosphere where the whole of society jointly engages in addressing climate change and advancing low-carbon agricultural transition.

5. Conclusions

From 2004 to 2023, Shandong Province’s total farmland carbon emissions followed a trend of “gradual increase with fluctuations-stable decrease”, reaching a maximum of 29.4 million tons in 2007. The farmland carbon emissions intensity in Shandong Province presented an overall downward trend during 2004–2023. Carbon emissions intensity, agricultural structure, and labor effects inhibited farmland carbon emissions in Shandong Province, while the economic development effect drove their growth. From 2004 to 2013, farmland carbon emissions in Yantai, Jining, Zaozhuang, Dezhou, Linyi, Liaocheng, and Heze exhibited weak decoupling from economic development, whereas all cities in Shandong achieved strong decoupling during 2014–2023. Balancing economic development with farmland carbon emissions reduction remains a critical issue. In the future, technological innovation and the optimization of agricultural structures can help reduce farmland carbon emissions in Shandong Province.

Author Contributions

Conceptualization, T.S. and X.G.; Methodology, T.S., Z.Z. and X.G.; Investigation, T.S., R.L., B.G. and M.M.; Data curation, T.S. and M.M.; Writing—original draft, T.S., R.L., Z.Z., B.G., M.M., L.Y. and X.G.; Writing—review and editing, T.S., R.L., Z.Z., B.G., M.M., L.Y. and X.G.; Visualization, T.S., R.L. and Z.Z.; Funding acquisition, T.S., R.L., L.Y. and X.G. All authors have read and agreed to the published version of the manuscript.

Funding

This research was funded by the Shandong Province Modern Agricultural Industrial Technology System (grant nos. SDAIT-30-15, SDAIT-07-07), the Natural Science Foundation of the Shandong Province (grant no. ZR2023QC064), the Taishan Scholars Program (grant no. tsqn202312288), the Key R&D Plan of the Shandong Province (grant nos. 2024CXPT075, 2022TZXD0039-3), the National Key R&D Plan Project (grant nos. 2023YFD1902701-2, 2021YFD1900190306), the Smart Fertilization Project (grant no. 5).

Institutional Review Board Statement

Not applicable.

Informed Consent Statement

Not applicable.

Data Availability Statement

The data supporting the findings of this study are available from the corresponding author upon reasonable request.

Conflicts of Interest

The authors declare no conflict of interest.

References

  1. Mora, C.; Spirandelli, D.; Franklin, E.C.; Lynham, J.; Kantar, M.B.; Miles, W.; Smith, C.Z.; Freel, K.; Moy, J.; Louis, L.V.; et al. Broad threat to humanity from cumulative climate hazards intensified by greenhouse gas emissions. Nat. Clim. Change 2018, 8, 1062–1071. [Google Scholar] [CrossRef]
  2. Wang, Y.; Guo, C.H.; Chen, X.J.; Jia, L.Q.; Guo, X.N.; Chen, R.S.; Zhang, M.S.; Chen, Z.Y.; Wang, H.D. Carbon peak and carbon neutrality in China: Goals, implementation path and prospects. China Geol. 2021, 4, 720–746. [Google Scholar] [CrossRef]
  3. Wijerathna Yapa, A.; Pathirana, R. Sustainable Agro-Food Systems for Addressing Climate Change and Food Security. Agriculture 2022, 12, 1554. [Google Scholar] [CrossRef]
  4. Nsabiyeze, A.; Ma, R.; Li, J.; Luo, H.; Zhao, Q.; Tomka, J.; Zhang, M. Tackling climate change in agriculture: A global evaluation of the effectiveness of carbon emission reduction policies. J. Clean. Prod. 2024, 468, 142973. [Google Scholar] [CrossRef]
  5. Forster, P.; Storelvmo, T.; Armour, K.; Collins, W.; Dufresne, J.L.; Frame, D.; Lunt, D.J.; Mauritsen, T.; Palmer, M.D.; Watanabe, M.; et al. The Earth’s Energy Budget, Climate Feedbacks, and Climate Sensitivity. In Climate Change 2021: The Physical Science Basis. Contribution of Working Group I to the Sixth Assessment Report of the Intergovernmental Panel on Climate Change; Masson-Delmotte, V., Zhai, P., Pirani, A., Connors, S.L., Péan, C., Berger, S., Caud, N., Chen, Y., Goldfarb, L., Gomis, M.I., et al., Eds.; Cambridge University Press: Cambridge, UK; New York, NY, USA, 2021; pp. 923–1054. [Google Scholar]
  6. Vermeulen, S.J.; Campbell, B.M.; Ingram, J.S.I. Climate change and food systems. Annu. Rev. Environ. Resour. 2012, 37, 195–222. [Google Scholar] [CrossRef]
  7. Ming, J.; Li, J.; Zhang, M. What drives the agricultural carbon emissions for low-carbon transition? Evidence from China. Environ. Impact Assess. Rev. 2024, 105, 107440. [Google Scholar] [CrossRef]
  8. Huang, X.; Xu, X.; Wang, Q.; Zhang, L.; Gao, X.; Chen, L. Assessment of Agricultural Carbon Emissions and Their Spatiotemporal Changes in China, 1997–2016. Int. J. Environ. Res. Public Health 2019, 16, 3105. [Google Scholar] [CrossRef]
  9. Tian, Y.; Zhang, J.; He, Y. Research on Spatial-Temporal Characteristics and Driving Factor of Agricultural Carbon Emissions in China. J. Integr. Agric. 2014, 13, 1393–1403. [Google Scholar] [CrossRef]
  10. Chen, Y.; Li, M.; Su, K.; Li, X. Spatial-temporal characteristics of the driving factors of agricultural carbon emissions: Empirical evidence from Fujian, China. Energies 2019, 12, 3102. [Google Scholar] [CrossRef]
  11. Vastola, A.; Viccaro, M.; Grippo, V.; Genovese, F.; Romano, S.; Cozzi, M. The Decoupling Effect in Italian Agricultural Waste: An Empirical Analysis. Sustainability 2023, 15, 16596. [Google Scholar] [CrossRef]
  12. Makutėnienė, D.; Perkumienė, D.; Makutėnas, V. Logarithmic mean Divisia index decomposition based on Kaya identity of GHG emissions from agricultural sector in Baltic States. Energies 2022, 15, 1195. [Google Scholar] [CrossRef]
  13. Han, G.; Xu, J.; Zhang, X.; Pan, X. Efficiency and Driving Factors of Agricultural Carbon Emissions: A Study in Chinese State Farms. Agriculture 2024, 14, 1454. [Google Scholar] [CrossRef]
  14. Shen, X.; Yan, R.; Jiang, M. How does planting structure change affect the agricultural net carbon sink? Evidence from the Jiangsu coastal economic Belt. Ecol. Indic. 2025, 170, 112949. [Google Scholar] [CrossRef]
  15. Tang, R.; Chu, Y.; Liu, X.; Yang, Z.; Yao, J. Driving Factors and Decoupling Effects of Non-CO2 Greenhouse Gas Emissions from Agriculture in Southwest China. Atmosphere 2024, 15, 1084. [Google Scholar] [CrossRef]
  16. Ang, B. LMDI decomposition approach: A guide for implementation. Energ. Policy 2015, 86, 233–238. [Google Scholar] [CrossRef]
  17. Yang, S.H.; Zhang, Y.Q.; Geng, Y. An LMDI-based investigation of the changes in carbon emissions of the transportation sector in the Yangtze River Economic Belt. China Environ. Sci. 2022, 10, 4817–4826. (In Chinese) [Google Scholar]
  18. Liu, Y.; Feng, C. What drives the decoupling between economic growth and energy-related CO2 emissions in China’s agricultural sector? Environ. Sci. Pollut. Res. 2021, 28, 44165–44182. [Google Scholar] [CrossRef]
  19. Lauk, C.; Magerl, A.; le Noë, J.; Theurl, M.C.; Gingrich, S. Analyzing long-term dynamics of agricultural greenhouse gas emissions in Austria, 1830–2018. Sci. Total Environ. 2024, 911, 168667. [Google Scholar] [CrossRef]
  20. Jia, L.; Wang, M.; Yang, S.; Zhang, F.; Wang, Y.; Li, P.; Ma, W.; Sui, S.; Liu, T.; Wang, M. Analysis of agricultural carbon emissions and carbon sinks in the Yellow River Basin based on LMDI and Tapio decoupling models. Sustain. For. 2024, 16, 468. [Google Scholar] [CrossRef]
  21. Yuan, R.; Xu, C.; Kong, F. Decoupling agriculture pollution and carbon reduction from economic growth in the Yangtze River Delta, China. PLoS ONE 2023, 18, e0280268. [Google Scholar] [CrossRef]
  22. De Freitas, L.C.; Kaneko, S. Decomposing the decoupling of CO2 emissions and economic growth in Brazil. Ecol. Econ. 2011, 70, 1459–1469. [Google Scholar] [CrossRef]
  23. Duan, Y.; Gao, Y.; Zhao, J.; Xue, Y.; Zhang, W.; Wu, W.; Jiang, H.; Cao, D. Agricultural methane emissions in China: Inventories, Driving Forces and Mitigation Strategies. Environ. Sci. Technol. 2023, 57, 13292–13303. [Google Scholar] [CrossRef] [PubMed]
  24. Zhang, L.; Chen, J.; Dinis, F.; Wei, S.; Cai, C. Decoupling effect, driving factors and prediction analysis of agricultural carbon emission reduction and product supply guarantee in China. Sustainability 2022, 14, 16725. [Google Scholar] [CrossRef]
  25. Meng, Y.; Shen, Y.; Wang, W.; Liu, Y.; Wang, F.; Wang, H. Who affects carbon emissions? Drivers and decoupling effects of agricultural carbon emissions—Evidence from Sichuan, China. Front. Sustain. Food Syst. 2024, 8, 1441118. [Google Scholar] [CrossRef]
  26. Jiang, J.; Zhao, T.; Wang, J. Decoupling analysis and scenario prediction of agricultural CO2 emissions: An empirical analysis of 30 provinces in China. J. Clean Prod. 2021, 320, 128798. [Google Scholar] [CrossRef]
  27. National Bureau of Statistics of China (NBSC). China Statistics Yearbook; China Statistics Press: Beijing, China, 2024. Available online: https://www.stats.gov.cn/sj/ndsj/ (accessed on 10 May 2025).
  28. Bureau of Statistics of Shandong Province. Shandong Statistical Yearbook; China Statistics Press: Beijing, China, 2005–2024. Available online: http://tjj.shandong.gov.cn/col/col6279/index.html (accessed on 12 May 2025).
  29. Bureau of Statistics of Shandong Province. Shandong Rural Statistical Yearbook; China Statistics Press: Beijing, China, 2005–2024. Available online: http://nync.shandong.gov.cn/zwgk/nytj/ (accessed on 15 May 2025).
  30. Wang, C.; Niu, J. Water and Carbon Footprint and Layout Optimization of Major Grain Crops in the Northwest China. Sci. Agric. Sin. 2024, 57, 1137–1152. (In Chinese) [Google Scholar]
  31. Li, W.; Ou, Q.; Chen, Y. Decomposition of China’s CO2 emissions from agriculture utilizing an improved Kaya identity. Environ. Sci. Pollut. Res. Int. 2014, 21, 13000–13006. [Google Scholar] [CrossRef]
  32. Xia, Q.; Liao, M.; Xie, X.; Guo, B.; Lu, X.; Qiu, H. Agricultural carbon emissions in Zhejiang Province, China (2001–2020): Changing Trends, Influencing Factors, and has it Achieved Synergy with Food Security and Economic Development? Environ Monit Assess. 2023, 195, 1391. [Google Scholar] [CrossRef]
  33. Liu, X.; Ye, Y.; Ge, D.; Wang, Z.; Liu, B. Study on the Evolution and Trends of Agricultural Carbon Emission Intensity and Agricultural Economic Development Levels—Evidence from Jiangxi Province. Sustainability 2022, 14, 14265. [Google Scholar] [CrossRef]
  34. Liu, Y.; Liu, H.B. Characteristics, influence factors, and prediction of agricultural carbon emissions in Shandong Province. Chin. J. Eco-Agric. 2022, 30, 558–569. (In Chinese) [Google Scholar]
  35. Wang, X.F. Since the Reform and Opening Up Agricultural Policy of the Communist Party of China; Shandong Normal University: Jinan, China, 2012. (In Chinese) [Google Scholar]
  36. Yang, B.J.; Tian, J.R.; Sun, H.Y. Study on the factors affecting the carbon footprint of agricultural production based on the SVAR model. Ecol. Econ. 2019, 35, 120–127. (In Chinese) [Google Scholar]
  37. Zhang, X.; Zhang, Y.; Fan, S. The multiple roles of crop structural change in productivity, nutrition and environment in China: A decomposition analysis. J. Integr. Agric. 2024, 23, 1763–1773. [Google Scholar] [CrossRef]
  38. Li, B.; Zhang, J.B.; Li, H.P. Research on spatial-temporal characteristics and affecting factors decomposition of agricultural carbon emission in China. China Popul. Resour. Environ. 2011, 21, 80–86. (In Chinese) [Google Scholar]
  39. Zhang, F.; Liu, F.; Ma, X.; Guo, G.; Liu, B.; Cheng, T.; Liang, T.; Tao, W.; Chen, X.; Wang, X. Greenhouse gas emissions from vegetables production in China. J. Clean. Prod. 2021, 317, 128449. [Google Scholar] [CrossRef]
  40. Li, N.; Wei, C.; Zhang, H.; Cai, C.; Song, M.; Miao, J. Drivers of the national and regional crop production-derived greenhouse gas emissions in China. J. Clean. Prod. 2020, 257, 120503. [Google Scholar] [CrossRef]
  41. Huang, X.; Wu, X.; Guo, X.; Shen, Y. Agricultural carbon emissions in China: Measurement, Spatiotemporal Evolution, and Influencing Factors Analysis. Front. Environ. Sci. 2024, 12, 1488047. [Google Scholar] [CrossRef]
  42. Zhu, Y.; Huo, C. The Impact of Agricultural Production Efficiency on Agricultural Carbon Emissions in China. Energies 2022, 15, 4464. [Google Scholar] [CrossRef]
  43. Hao, Y.; Zhang, Z.Y.; Yang, C.X.; Wu, H.T. Does structural labor change affect CO2 emissions? Theoretical and empirical evidence from China. Technol. Forecast. Soc. Change 2021, 171, 120936. [Google Scholar] [CrossRef]
  44. Huang, X.B.; Gao, S.Q. Temporal characteristics and influencing factors of agricultural carbon emission in Jiangxi province of China. Environ. Res. Commun. 2022, 4, 045006. [Google Scholar] [CrossRef]
  45. Zhang, Z.Y.; Hu, C.X.; Lian, G.; Yang, Y.Y. Evolution of the collaborative network of agricultural non-point source pollution control policies in China. J. Agric. Resour. Environ. 2025, 1–12. (In Chinese) [Google Scholar] [CrossRef]
  46. Geng, Y.; Wang, J.; Sun, Z.; Ji, C.; Huang, M.; Zhang, Y.; Xu, P.; Li, S.; Pawlett, M.; Zou, J. Soil N-oxide emissions decrease from intensive greenhouse vegetable fields by substituting synthetic N fertilizer with organic and bio-organic fertilizers. Geoderma 2021, 383, 114730. [Google Scholar] [CrossRef]
  47. Balafoutis, A.; Beck, B.; Fountas, S.; Vangeyte, J.; Van der Wal, T.; Soto, I.; Gómez-Barbero, M.; Barnes, A.; Eory, V. Precision agriculture technologies positively contributing to GHG emissions mitigation, farm productivity and economics. Sustainability 2017, 9, 1339. [Google Scholar] [CrossRef]
  48. McNunn, G.; Karlen, D.L.; Salas, W.; Rice, C.W.; Mueller, S.; Muth, D., Jr.; Seale, J.W. Climate smart agriculture opportunities for mitigating soil greenhouse gas emissions across the US Corn-Belt. J. Clean. Prod. 2020, 268, 122240. [Google Scholar] [CrossRef]
  49. Kabato, W.; Getnet, G.T.; Sinore, T.; Nemeth, A.; Molnár, Z. Towards climate-smart agriculture: Strategies for sustainable agricultural production, food security, and greenhouse gas reduction. Agronomy 2025, 15, 565. [Google Scholar] [CrossRef]
  50. Zhang, W.; Feng, J.; Bai, X.; He, W.; Mo, J.; Gao, Q.; Wang, K.; Gu, S. Crop yield and soil quality of soya bean-maize rotation in response to 8-year keep stubble with no tillage practices on the Northeast China. Eur. J. Agron. 2025, 164, 127526. [Google Scholar] [CrossRef]
  51. Mehran, M.; Huang, L.; Geng, M.; Gan, Y.; Cheng, J.; Zhu, Q.; Ahmad, I.A.; Haider, S.; Mustafa, A. Co-utilization of green manure with straw return enhances the stability of soil organic carbon by regulating iron-mediated stabilization of aggregate-associated organic carbon in paddy soil. Soil Till. Res. 2025, 252, 106624. [Google Scholar] [CrossRef]
Figure 1. The location of the research area.
Sustainability 17 06876 g001
Figure 2. The research framework.
Sustainability 17 06876 g002
Figure 3. Total carbon emissions, emission intensity, and emission composition of Shandong Province from 2004 to 2023.
Sustainability 17 06876 g003
Figure 4. Spatial distribution of total carbon emissions in various cities of Shandong Province in 2004, 2013, and 2023.
Sustainability 17 06876 g004
Figure 5. Spatial distributions of carbon emission intensity in Shandong’s Cities in 2004, 2013, and 2023.
Sustainability 17 06876 g005
Figure 6. The contribution ratios of various factors to changes in Shandong’s farmland carbon emissions.
Sustainability 17 06876 g006
Table 1. Tapio decoupled elastic partition.
StatesCarbon Emission Growth RateEconomic Growth RateDecoupling Elasticity (e)
DecouplingWeak decoupling>0>00 ≤ e < 0.8
Strong decoupling<0>0e < 0
Recessive decoupling<0<0e > 1.2
Connection Growth connection>0>00.8 ≤ e ≤ 1.2
Fading connection<0<00.8 ≤ e ≤ 1.2
Negative decouplingWeak negative decoupling<0<00 ≤ e ≤ 0.8
Strong negative decoupling>0<0e < 0
Expansive negative decoupling>0>0e > 1.2
Table 2. Spatial distribution of direct and indirect carbon emissions in various cities of Shandong Province in 2004, 2013, and 2023.
RegionDirect Carbon Emission (104 t CO2)Indirect Carbon Emission (104 t CO2)
200420132023200420132023
Jinan52.045.624.5102.599.169.6
Qingdao49.430.320.4131.7124.0103.1
Zibo20.714.99.863.952.733.2
Zaozhuang30.034.024.359.463.956.5
Dongying24.722.719.955.255.227.0
Yantai56.550.337.8130.1139.0102.6
Weifang80.559.137.2300.3309.7253.4
Jining91.391.068.1132.7139.3108.0
Taian29.826.917.174.773.966.1
Weihai21.014.911.963.166.550.3
Rizhao29.419.39.478.466.937.3
Linyi104.491.165.2185.5213.7154.6
Dezhou64.573.546.1132.0149.6100.3
Liaocheng67.067.544.0145.3150.2130.7
Binzhou37.633.722.082.070.256.7
Heze89.495.567.4150.1166.6148.1
Total848.1770.2525.11887.01940.21497.5
Table 3. Variations in Shandong Province’s farmland carbon emissions from 2004 to 2023 due to different influencing factors.
YearΔCIΔSIΔEIΔLIΔCtotal
2004−2005−21.344.7837.9512.1333.52
2005−2006−10.35−2.0227.84−9.625.84
2006−2007−13.38−5.8432.87−10.942.71
2007−2008−18.95−1.1128.75−10.67−1.98
2008−2009−25.373.2322.56−12.03−11.61
2009−2010−13.99−0.3628.31−12.061.89
2010−20117.96−5.1520.37−11.7311.45
2011−2012−10.72−2.1226.87−12.641.39
2012−2013−21.812.9823.76−13.39−8.46
2013−2014−11.060.0822.37−15.02−3.62
2014−2015−12.384.1822.60−15.41−1.01
2015−2016−12.99−3.8328.47−17.90−6.25
2016−201719.99−23.2015.96−18.23−5.48
2017−2018−24.116.4428.18−16.39−5.89
2018−2019−28.02−4.1733.48−16.39−15.09
2019−2020−22.83−0.0831.93−16.73−7.72
2020−2021−34.970.9044.67−15.26−4.66
2021−2022−19.653.7730.23−16.70−2.35
2022−2023−12.042.9423.85−17.98−3.23
Total−286.03−18.57531.00−246.9633.52
Table 4. Decoupling of farmland carbon emissions in Shandong’s cities: 2004–2013 and 2014–2023.
Region2004–20132014–2023
ΔC/CΔGDP/GDPeDecoupling StateΔC/CΔGDP/GDPeDecoupling State
Jinan−0.062.25−0.03Strong decoupling−0.330.98−0.34Strong decoupling
Qingdao−0.152.53−0.06Strong decoupling−0.190.81−0.24Strong decoupling
Zibo−0.202.31−0.09Strong decoupling−0.310.13−2.35Strong decoupling
Zaozhuang0.092.590.04Weak decoupling−0.180.09−1.99Strong decoupling
Dongying−0.022.64−0.01Strong decoupling−0.400.14−2.89Strong decoupling
Yantai0.012.440.01Weak decoupling−0.250.69−0.36Strong decoupling
Weifang−0.032.69−0.01Strong decoupling−0.180.59−0.31Strong decoupling
Jining0.032.350.01Weak decoupling−0.210.45−0.47Strong decoupling
Taian−0.043.03−0.01Strong decoupling−0.180.11−1.71Strong decoupling
Weihai−0.031.66−0.02Strong decoupling−0.210.26−0.79Strong decoupling
Rizhao−0.203.26−0.06Strong decoupling−0.450.48−0.92Strong decoupling
Linyi0.052.400.02Weak decoupling−0.230.71−0.32Strong decoupling
Dezhou0.132.560.05Weak decoupling−0.330.47−0.70Strong decoupling
Liaocheng0.033.280.01Weak decoupling−0.200.16−1.24Strong decoupling
Binzhou−0.133.06−0.04Strong decoupling−0.280.37−0.77Strong decoupling
Heze0.094.530.02Weak decoupling−0.171.01−0.17Strong decoupling
Disclaimer/Publisher’s Note: The statements, opinions and data contained in all publications are solely those of the individual author(s) and contributor(s) and not of MDPI and/or the editor(s). MDPI and/or the editor(s) disclaim responsibility for any injury to people or property resulting from any ideas, methods, instructions or products referred to in the content.

