Article

The Influence Mechanism of the Digital Economy on Carbon Intensity Across Chinese Provinces

1
Business School, Beijing Information Science & Technology University, Beijing 100085, China
2
School of Economics and Management, North China Electric Power University, Beijing 102206, China
*
Author to whom correspondence should be addressed.
Sustainability 2025, 17(15), 6877; https://doi.org/10.3390/su17156877
Submission received: 10 May 2025 / Revised: 24 June 2025 / Accepted: 25 June 2025 / Published: 29 July 2025

Abstract

The accelerating growth of the digital economy (DE) offers fresh momentum towards reaching carbon emissions’ peak and neutrality. Nevertheless, the impact mechanism of the DE on carbon emissions intensity (CEI) is insufficiently characterized. Our study first constructs an expanded comprehensive indicator system to evaluate DE development level from five dimensions containing 17 indicators. Panel data from 30 Chinese provincial regions (2013–2023) were analyzed using fixed effects, mediating effects, and spatial Durbin models to empirically examine the relationship and mechanisms between DE and CEI. Considering the existence of indirect effects of DE on CEs, the mechanism associated with the effect of the DE on CEs from the perspectives of economic growth, industrial structure upgrading, and scientific and technology innovation has been explored. The findings indicate notable regional disparities in the DE level across various provincial regions of China. China’s DE development significantly inhibits CEI. Furthermore, the DE’s development has successfully curtailed CE growth via three mediating mechanisms. And the DE exhibits a critical spatial spillover effect on CEI, and that effect also exhibits regional heterogeneity. Our findings can aid in regional DE development and the creation of policies to reduce CEs.

1. Introduction

China’s ongoing reform and opening-up efforts have significantly enhanced its economic development in recent years, resulting in a remarkable global economic growth phenomenon. China’s factor-driven economic growth has resulted in a heavy reliance on energy resources, resulting in critical carbon emissions from both production and daily activities [1]. The BP Statistical Review of World Energy indicates that China has led global energy-consuming growth for 19 consecutive years. In accordance with the 2022 Carbon Dioxide Emissions Report by the International Energy Agency (IEA), China emitted 11,477 million tons of CO2, representing about 31% of global emissions. A large amount of CEs will bring incalculable losses to human society and affect the process of sustainable social development. In recent years, China has experienced an increase in extreme weather and natural disasters, transforming climate issues from theoretical concerns into tangible crises [2]. Excessive carbon emissions contribute to the greenhouse effect, significantly impacting agriculture, socio-economic activities, and human life, thereby obstructing sustainable development. At the United Nations General Assembly, China pledged to reach peak carbon emissions by 2030 and carbon neutrality by 2060, demonstrating its active role in global environmental governance. This commitment represents a shift in the economic growth model, addressing the urgent need for China to decrease energy intensity and carbon emissions [3].
In recent years, information and communication technologies (ICTs), including the Internet, big data, cloud computing, and artificial intelligence, have experienced rapid global development [4]. The accelerating growth of the DE is attributed to the widespread application of digital technologies (DTs). In terms of the 2022 report by the China Academy of Information and Communications Research, the added value of the DE across 47 countries globally amounted to USD 38.1 trillion, marking an increase of approximately USD 5.1 trillion from the previous year. From a single country perspective, in 2021, the US DE reached USD 15.3 trillion and continued to maintain its leading position in the world, followed closely by China, with a DE reaching USD 7.1 trillion. The DEs of Germany, Japan, the UK, and France have also crossed the USD 1 trillion mark. The Digital China Development Report (2022) illustrates that China’s DE was CNY 50.2 trillion in 2022, ranking second globally [5]. It experienced a nominal year-on-year increase of 10.3% and constituted 41.5% of the GDP. With the continuous increase in the scale of the DE, its impact on the environment and specific impact mechanisms also urgently need to be analyzed and explored to avoid irreparable losses to the ecological environment.
The evolution of the DE significantly influences CEs. The advancement of the DE has yielded significant economic and social benefits, yet it simultaneously increases global emission pressure. Firstly, the application and popularization of DT have increased energy consumption. High energy consumption contributes significantly to CE issues. Secondly, the swift advancement of the DE has increased pressure on logistics and transportation. The increase in logistics and transportation pressure has also exacerbated energy consumption. Conversely, the swift advancement of the DE presents both challenges and opportunities for addressing environmental issues and decreasing emissions. The use of DT to decrease carbon emissions is increasingly gaining popularity. Integrating DT with traditional manufacturing enhances energy efficiency, optimizes production processes, and minimizes waste. Afterwards, in the combination of DT and transportation, intelligent transportation systems would reduce energy consumption and CEs via optimizing routes and traffic flow. In addition, in terms of digital energy, smart grids can achieve efficient energy utilization and CE reduction by flexibly adjusting energy supply and demand. In terms of digital agriculture, intelligent agricultural production can reduce the employment of agricultural fertilizers and pesticides, and reduce agricultural CEs. In digital finance, sustainable investment can promote environmentally friendly economic development, encouraging businesses and all sectors of society to invest in reducing CEs and environmental protection. The relationship between the DE and CEs is multifaceted and intricate.
Our study firstly analyzed the DE development level of 30 provincial regions in China, using complete data from 2013 to 2023. The evaluation was conducted using the entropy approach. We then examined the direct effect of the DE on CEs and investigated the underlying mechanisms employing a mediating effect model. The innovative perspectives of our investigation are illustrated below. (1) Unlike most existing studies that emphasize the DE’s influence on economic factors like economic structure, per capita GDP, and employment, our research examines the DE’s influence on CEs to assess potential environmental effects. (2) An expanded comprehensive indicator system evaluates DE development by considering digital infrastructure, integrated development, social benefits, innovation capacity, and e-commerce. (3) Considering the existence of indirect effects of the DE on CEs, the mechanism associated with the effect of the DE on CEs from the perspectives of economic growth, IS upgrading, and STI has been explored. (4) Analyzing the nexus between the DE and CEs across 30 provincial regions in China offers a scientific foundation for advancing the DE and crafting green development strategies tailored to regional variations, aiming to realize carbon peak and neutrality.
The framework of our investigation is designed as below. Section 2 reviews the relevant literature. Section 3 presents the theoretical framework and hypotheses. Section 4 lists details of the methodology, variables, and data sources. Estimation results and discussion are depicted in Section 5. And the last section draws conclusions and proposes policy implications.

2. Literature Review

The previous literature related to our investigation was categorized into three types. The first type of research focused on measuring the CEs in various regions and industries, discussing the elements affecting CEs. Zhang et al. utilized the super-efficiency slack-based assessment method to analyze static changes in China’s regional CEs [6]. Sun and Huang estimated CEs efficiency, employing a stochastic frontier methodology and a parametric method [7]. Yu and Zhang introduced a nonconvex meta-frontier DEA framework to assess the efficiency of China’s CEs [8]. Key factors influencing CEs, as identified in various studies, include economic growth and structure, STI, and environmental regulation [9,10]. Research indicates that advancements in technology, along with low-carbon and carbon-free innovations, evidently contribute to decreasing carbon emissions [11]. Dumon et al. found that DT promoted sustainable organic agriculture and decreased resource consumption [12]. Moreover, they explored how economic development has a great impact on CEs efficiency [13].
The second type of literature concentrated on the DE. The theory of the DE, introduced by Tapscott in the 1990s, describes an economic system that heavily utilizes ICT [14]. From then on, international organizations, scholars, and governments have extended and diversified this term. The 2020 White Paper on China’s Digital Economy describes it as an emerging economic model that utilizes digital knowledge and information as core components, driven by DT and supported by modern information networks [15]. The theory of the DE was also widely discussed by scholars. Bukht and Heeks categorized the DE into three perspectives: core, narrow, and broad [16]. The first perspective encompasses digital industrial content, containing software-driven manufacturing, telecommunications, and information services [17]. The second perspective consists of digital services and the platform economy. The third perspective refers to e-commerce, the mechanical agriculture, the algorithmic economy, and new industries [18]. Certain studies have concentrated on assessing the level of regional DE development. Zhao et al. assesses DE development through digital infrastructure, integrated growth, innovation capacity, and e-commerce dimensions [19,20].
With the development of the DE and the influence the DE exerts on carbon emissions, scholars have gradually paid attention to the relationship between the DE and carbon emissions. The third category of literature emphasized the connection between the DE and CEs. Some scholars held the view that the DE can promote emissions reduction through improving regional STI capacity, enhancing resources consuming efficiency, and promoting economic structure transformation [17]. Some investigations also confirmed the advantages of developing DT for the recovering environment. Sun et al. developed a detailed DE indicator framework for 30 Chinese provinces from 2006 to 2017, utilizing the system-generalized approach of moments to assess the nexus between the DE and CEs [1]. The findings suggest that the DE could indirectly decrease CEs by expanding the tertiary industry and prompting green STI. Chen et al. [21] utilized a two-way fixed effect model to discuss the impact of the DE on CEs employing panel data from 30 Chinese provinces. Results demonstrated that advancing the DE can substantially reduce the intensity of CEs [21]. Other scholars also verified such conclusions through conducting empirical analysis in Brazil, India, Russia, South Africa, and other global countries [22,23,24]. On the contrary, several scholars have drawn the opposite conclusions. Zhou et al. indicated that the advancement of DT is expected to elevate energy consumption, particularly within the information technology sector, leading to a notable rise in CEs [25]. Salahuddin and Alam found that a 1% increase in Internet users leads to a 0.026% rise in per capita electricity consumption [26].
According to the above review, we can discover that existing research has offered a foundation to understand the current state of studies on the nexus between the DE and CEs. However, several issues still exist and need to be addressed. Firstly, the evaluation indicators of the DE development level of the previous literature are not sufficiently comprehensive, and primarily focused on a single dimension called digital infrastructure. Secondly, despite numerous studies examining the nexus between the DE and CEs, the effect of the DE on CEs remains debated. Some investigations verified that the growth of the DE will increase the CEs via stimulating energy consumption in some regions, while others illustrated that the growth of the DE will decrease CEs via STI. Integrating the DE wave with carbon neutrality and peak strategies is a crucial global necessity, particularly for China. Hence, it is urgent to understand whether and how the development of the DE influences CEs. Particularly, can the growth of the DE help China’s provincial regions reduce their CEs so as to realize the carbon peak and neutrality goal? What mechanisms are involved if the DE affects CEs? Aiming at addressing the above questions, it is essential to explore the development of the DE and examine its relationship with CEs.
Therefore, we firstly evaluate the DE development index across 30 provincial regions in China and examine the regional disparities in DE development. Secondly, spatial econometric models are applied to discuss the effect mechanism of the DE on CEs. Thirdly, digital techniques are integral to adjusting industrial structure (IS) and transforming energy consumption patterns. The impact of scientific and technological innovation (STI), IS, as well as economic growth on the DE’s impact on CEs will be further examined. Further investigation into these issues will enhance understanding of the DE’s effect on CEs and aid in developing scientifically grounded policies to balance the DE–environment nexus. This will offer valuable insights for reducing CEs and support China and other developing countries in realizing carbon peak and neutrality goals.

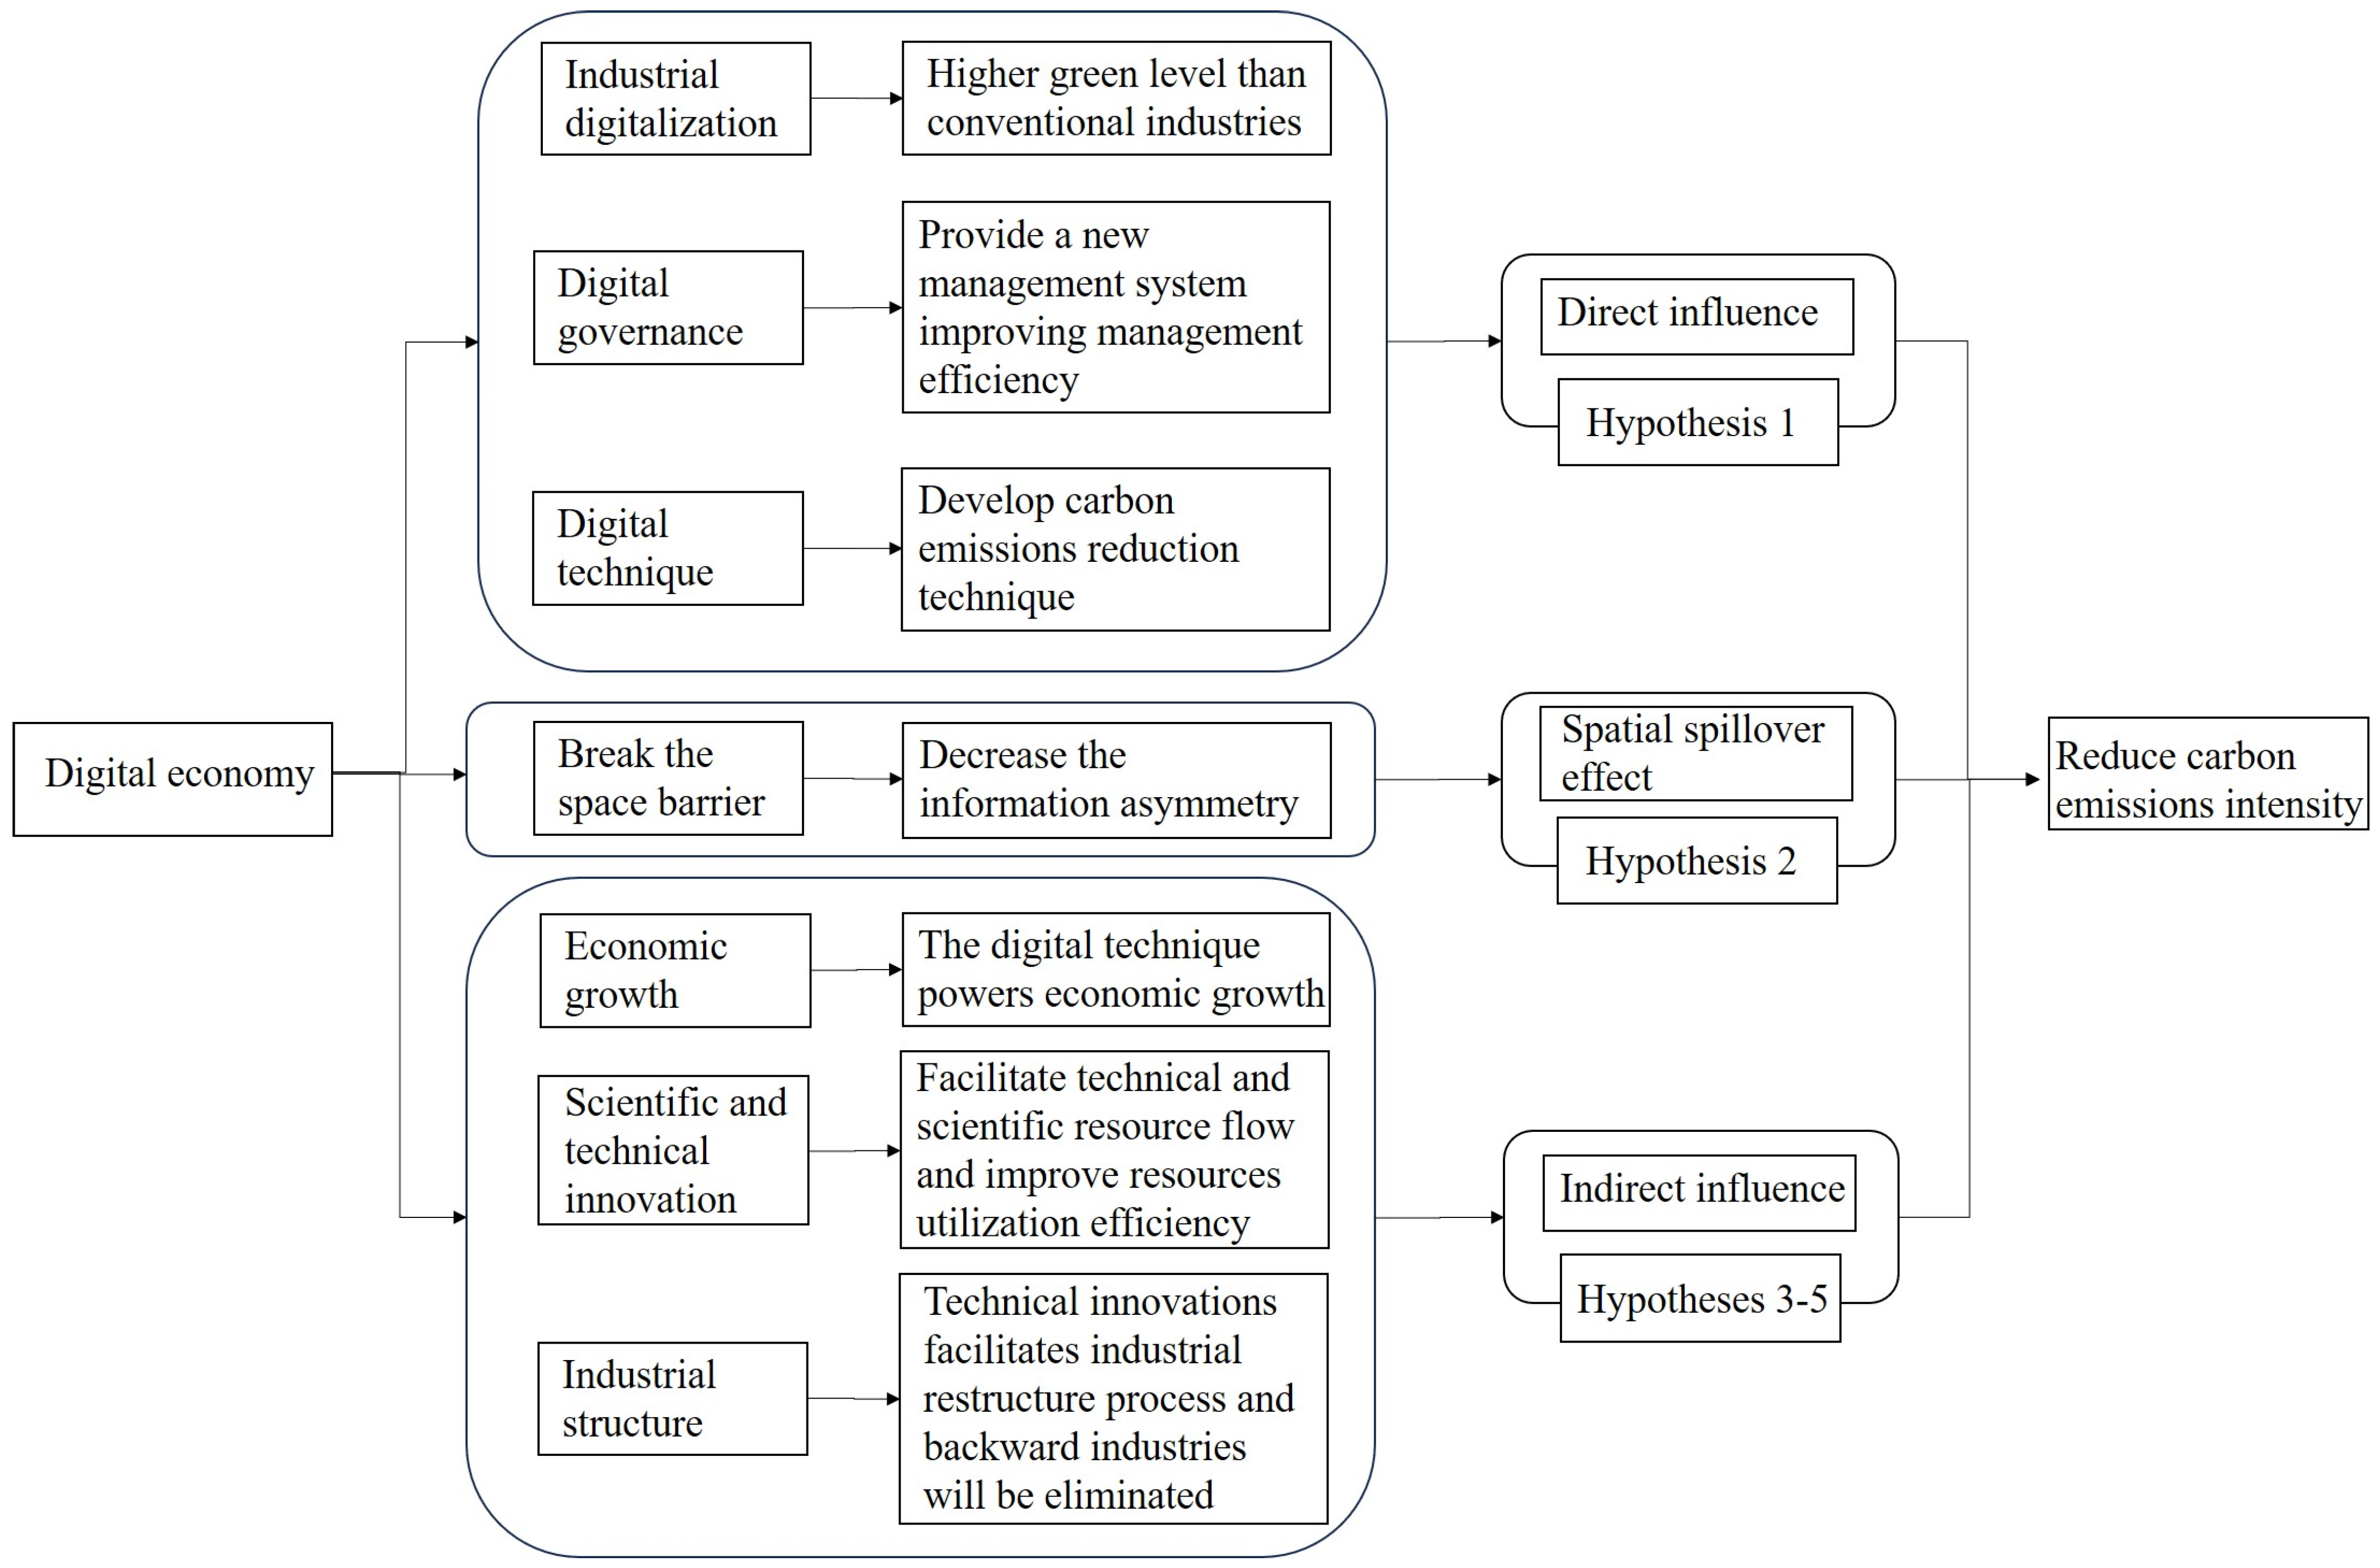
3. Theoretical Mechanism and Hypotheses

The effect of the DE on reducing CEs is categorized into direct influence, spatial spillover effect, as well as indirect influence. Figure 1 depicts the mechanism by which the DE influences the reduction in CEs.

3.1. The Direct Influence of the DE on CEs Reduction

As DT increasingly integrates with the real economy, it is driving sustained changes in industry through innovations in DT, improved energy efficiency, and enhanced pollutant conversion ratios. The influences of the DE on CEs are primarily depicted as follows. The digital industry is defined in terms of its environmentally friendly nature and minimal negative effect on the environment. Information and Internet enterprises dominate the digital industry and typically exhibit a higher level of environmental sustainability compared to traditional manufacturing sectors. Secondly, the advancement of the DE within the context of digital governance in the production sector introduces a novel management framework for society. DT improves the efficiency of public participation in environmental monitoring and facilitates clearer disclosure of environmental information [27]. The precise monitoring of pollutant emissions through DT enhances environmental regulation and significantly improves the government’s modern management capabilities. Moreover, digital governance can accurately allocate energy resources, decrease resources wastage, and improve resources’ consuming efficiency, thus reducing CEs [28]. Thirdly, the growth of the DE is largely reliant on the progress and widespread adoption of Internet information technologies. Simultaneously, the increase in the DE can also spread the width of information communication channels. Hence, more Internet technologies can be employed in environmental protection and the highly efficient use of resources, thus reducing CEs [29,30].
Considering the preceding analysis, the following hypothesis will be examined in our investigation.
Hypothesis 1.
The growth of the DE can significantly reduce the CEs intensity.

3.2. Spatial Spillover Effect of the DE on CEs Reduction

The spatial spillover effect of the DE on CEs is significant due to the externalities associated with geographical location and CEs. The growth of the DE has greatly decreased the challenges of economic communication posed by geographical distance. ICT enables the DE to enhance resource allocation and utilization efficiency across regions, facilitating the interregional flow of production factors. In addition, CEs, as a type of environmental public good, also have a significant spatial correlation. Previous scholars have also studied and interpreted them. Yilmaz et al. used panel data from 48 U.S. states spanning 1970 to 1997; the study demonstrated that ICT exhibited spatial spillover effects [31]. Afterwards, Liu et al. analyzed the CEs at the urban level in China and found that CEs showed a clear spatial agglomeration feature [32]. Godwin et al. identified the factors contributing to the digital divide in sub-Saharan Africa, highlighting the spatial interdependence of Internet access and broadband subscriptions across 41 interconnected regions [33]. Xu et al. measured ICT development levels, revealing that ICT capital enhances local CE efficiency and exerts significant spatial spillover effects on adjacent regions [34].
We will test the following hypothesis, building on prior empirical and theoretical research.
Hypothesis 2.
The DE can influence the decrease in CEs in adjacent areas via spatial spillover effects.

3.3. The Mechanisms Associated with the Influence of the DE on CEs

As the DE represents a recently emerged economic model, it is essential to examine potential mechanisms through which the DE impacts CEs from various perspectives. (1) The DE has gradually become the significant driver for economic growth [27]. The ongoing expansion of digital infrastructure and economic advancements driven by the DE will unavoidably impact circular economies. (2) The DE is driven by STI, which is crucial in accelerating the DE’s development. (3) The progress of the DE will greatly influence industrial development, which will exert great impact on CEs. We examine how the DE affects CEs by influencing economic growth, driving STI, and promoting IS upgrading.
Industrial digitization is crucial for DE development. The ICT sector is knowledge- and technique-intensive, facilitating the integration of numerous innovations into the real economy via DT. DT is the driver for real economy growth, hence facilitating economic growth and providing strong support for the high-quality development. Nevertheless, the ICT industry, especially electronic information installments, will consume a large amount of energy [35]. Hence, the DE may increase energy consumption and thus increase CEs. Considering this, we will test the hypothesis below.
Hypothesis 3.
Economic growth exerts a critical mediating effect between the DE and CEs.
The DE is driven by STI, and the government is crucial in facilitating its growth. STI forms the kernel of the DE, with enterprises acting as the crucial drivers of STI. Government support plays a crucial function in mitigating R&D risks for enterprises, prompting the flow of technical and scientific resources, and establishing the technical foundation for DE development, thereby advancing DE progress. Based on the advancement of STI, the energy-consuming efficiency and resources utilization efficiency can be improved, and thus the CEs can be decreased. In terms of the analysis above, we propose Hypothesis 4.
Hypothesis 4.
STI have a critical mediating effect on the nexus between the DE and CEs.
The influences of the DE on IS primarily emerge by IS optimization and industrial upgrading [36]. The integration of big data and emerging techniques in the digital economy (DE) will lead to the creation of new products and services, which can be commercialized and industrialized in response to evolving social consumer demands. This process will drive industrial development and transformation through the interplay of new supply and demand. STI can facilitate the industrial restructuring process and the growth of related industries [37]. Secondly, optimizing the IS can phase out outdated sectors, decreasing the ratio of high-pollution and energy-intensive industries in favor of lower energy-consuming ones, thus decreasing CEs [38]. In terms of the above discussion, the hypothesis below will be verified.
Hypothesis 5.
The IS can exert significant mediating influence on the nexus between the DE and CEs.
Figure 1 depicts the mechanism diagram for the DE’s impact on CEs reduction.

4. Methodology, Variables, and Data Sources

4.1. Model Setting

4.1.1. Basic Regression Model

The model set in our manuscript is as below:
Y i , t = β 0 + β 1 D E i , t + k = 1 r β k X k + μ i + σ t + ε i , t
where Y is the dependent variable, DE is the explanatory variable, β is the variables’ coefficients, X implies control variables, i and t signify regions and year, μ i and σ t are regional and temporal fixed effects, and ε i , t is the random error term.

4.1.2. Mediating Effect Model

To validate the mediating mechanism of the DE’s influence on CEs discussed earlier, this study employs Wen’s widely recognized test method to construct a mediating effect model [39].
M i , t = α 0 + α 1 D E i , t + k = 1 r α k X k + μ i + σ t + ε i , t
Y i , t = γ 0 + γ 1 D E i , t + γ 2 M i , t k = 1 r γ k X k + μ i + σ t + ε i , t
where M represents the mediating variable, and the definition of other variables is the same as Equation (1). α 1 × γ 2 represents the extent to which DE influences CE levels via mediating variables.

4.1.3. Spatial Autocorrelation Test Model

Before conducting spatial econometric model regression, it is essential to verify if these two variables have spatial correlation from a statistical perspective. Our study utilizes Moran’s I, that is Moran’s index (MI), to assess the spatial autocorrelation of two variables annually using the geographical neighboring matrix. The calculation process is conducted as follows:
I = i = 1 n j = 1 n W i j ( Y i Y ¯ ) ( Y j Y ¯ ) S 2 i = 1 n j = 1 n W i j
where S 2 = 1 n i = 1 n ( Y i Y ¯ ) 2 , Y ¯ = i = 1 n Y i n , Y i is the actual observation values for region i, W is the spatial weight matrix. Moran’s index assesses global spatial autocorrelation, with a value range of [−1, 1]. A numerical value within the range (0, 1] signifies a positive correlation, with the correlation strength increasing as the value approaches 1. A value of 0 signifies an absence of spatial correlation. A value in the range [−1, 0) signifies a negative spatial correlation, with the correlation strength increasing as the value decreases.

4.1.4. Spatial Econometrics

To validate the spatial spillover effect outlined in Hypothesis 2, our investigation employs a spatial econometric model for regression analysis. Traditional spatial econometric models encompass the Spatial Error Model (SEM) as defined in Equation (5), the Spatial Autoregressive Model (SAR) as outlined in Equation (6), and the Spatial Durbin Model (SDM) as specified in Equation (7). The SEM mainly studies the differences in interaction between regions due to their spatial positions, mainly considering the spatial correlation of independent variables. The SAR model concentrates on analyzing spillover effects in a specific region by considering the spatial correlation of dependent variables. The SDM considers the spatial correlation between the independent and dependent variables. This investigation conducted relevant tests before selecting spatial econometric models to determine the final spatial model.
y = α + X β + μ , μ = ρ W μ + ε , ε N ( 0 , σ 2 )
y = α + λ W y + X β + ε , ε N ( 0 , σ 2 )
y = α + λ W y + X β 1 + W X β 2 + ε , ε N ( 0 , σ 2 )
where λ is the spatial autocorrelation index, which represents the magnitude and direction of spatial correlation. W is the weight matrix essential for the SDM. Spatial weight matrices frequently utilized encompass geographic distance, economic distance, and neighboring matrices. This study employs the adjacency weight matrix as the regression matrix referring to the reference [24]. Given the geographical proximity and the context of China, Hainan and Guangdong provinces are considered neighboring regions. And in our investigation, the adjacency weight matrix was utilized as the spatial matrix in the spatial autocorrelation test and the regression of the econometric regression model. The expression of the adjacency matrix is depicted as Equation (8).
W i j = 1 , i   i s   a d j a c e n t   t o   j 0 , i   i s   n o t   a d j a c e n t   t o   j

4.2. Variables Selection and Data Sources

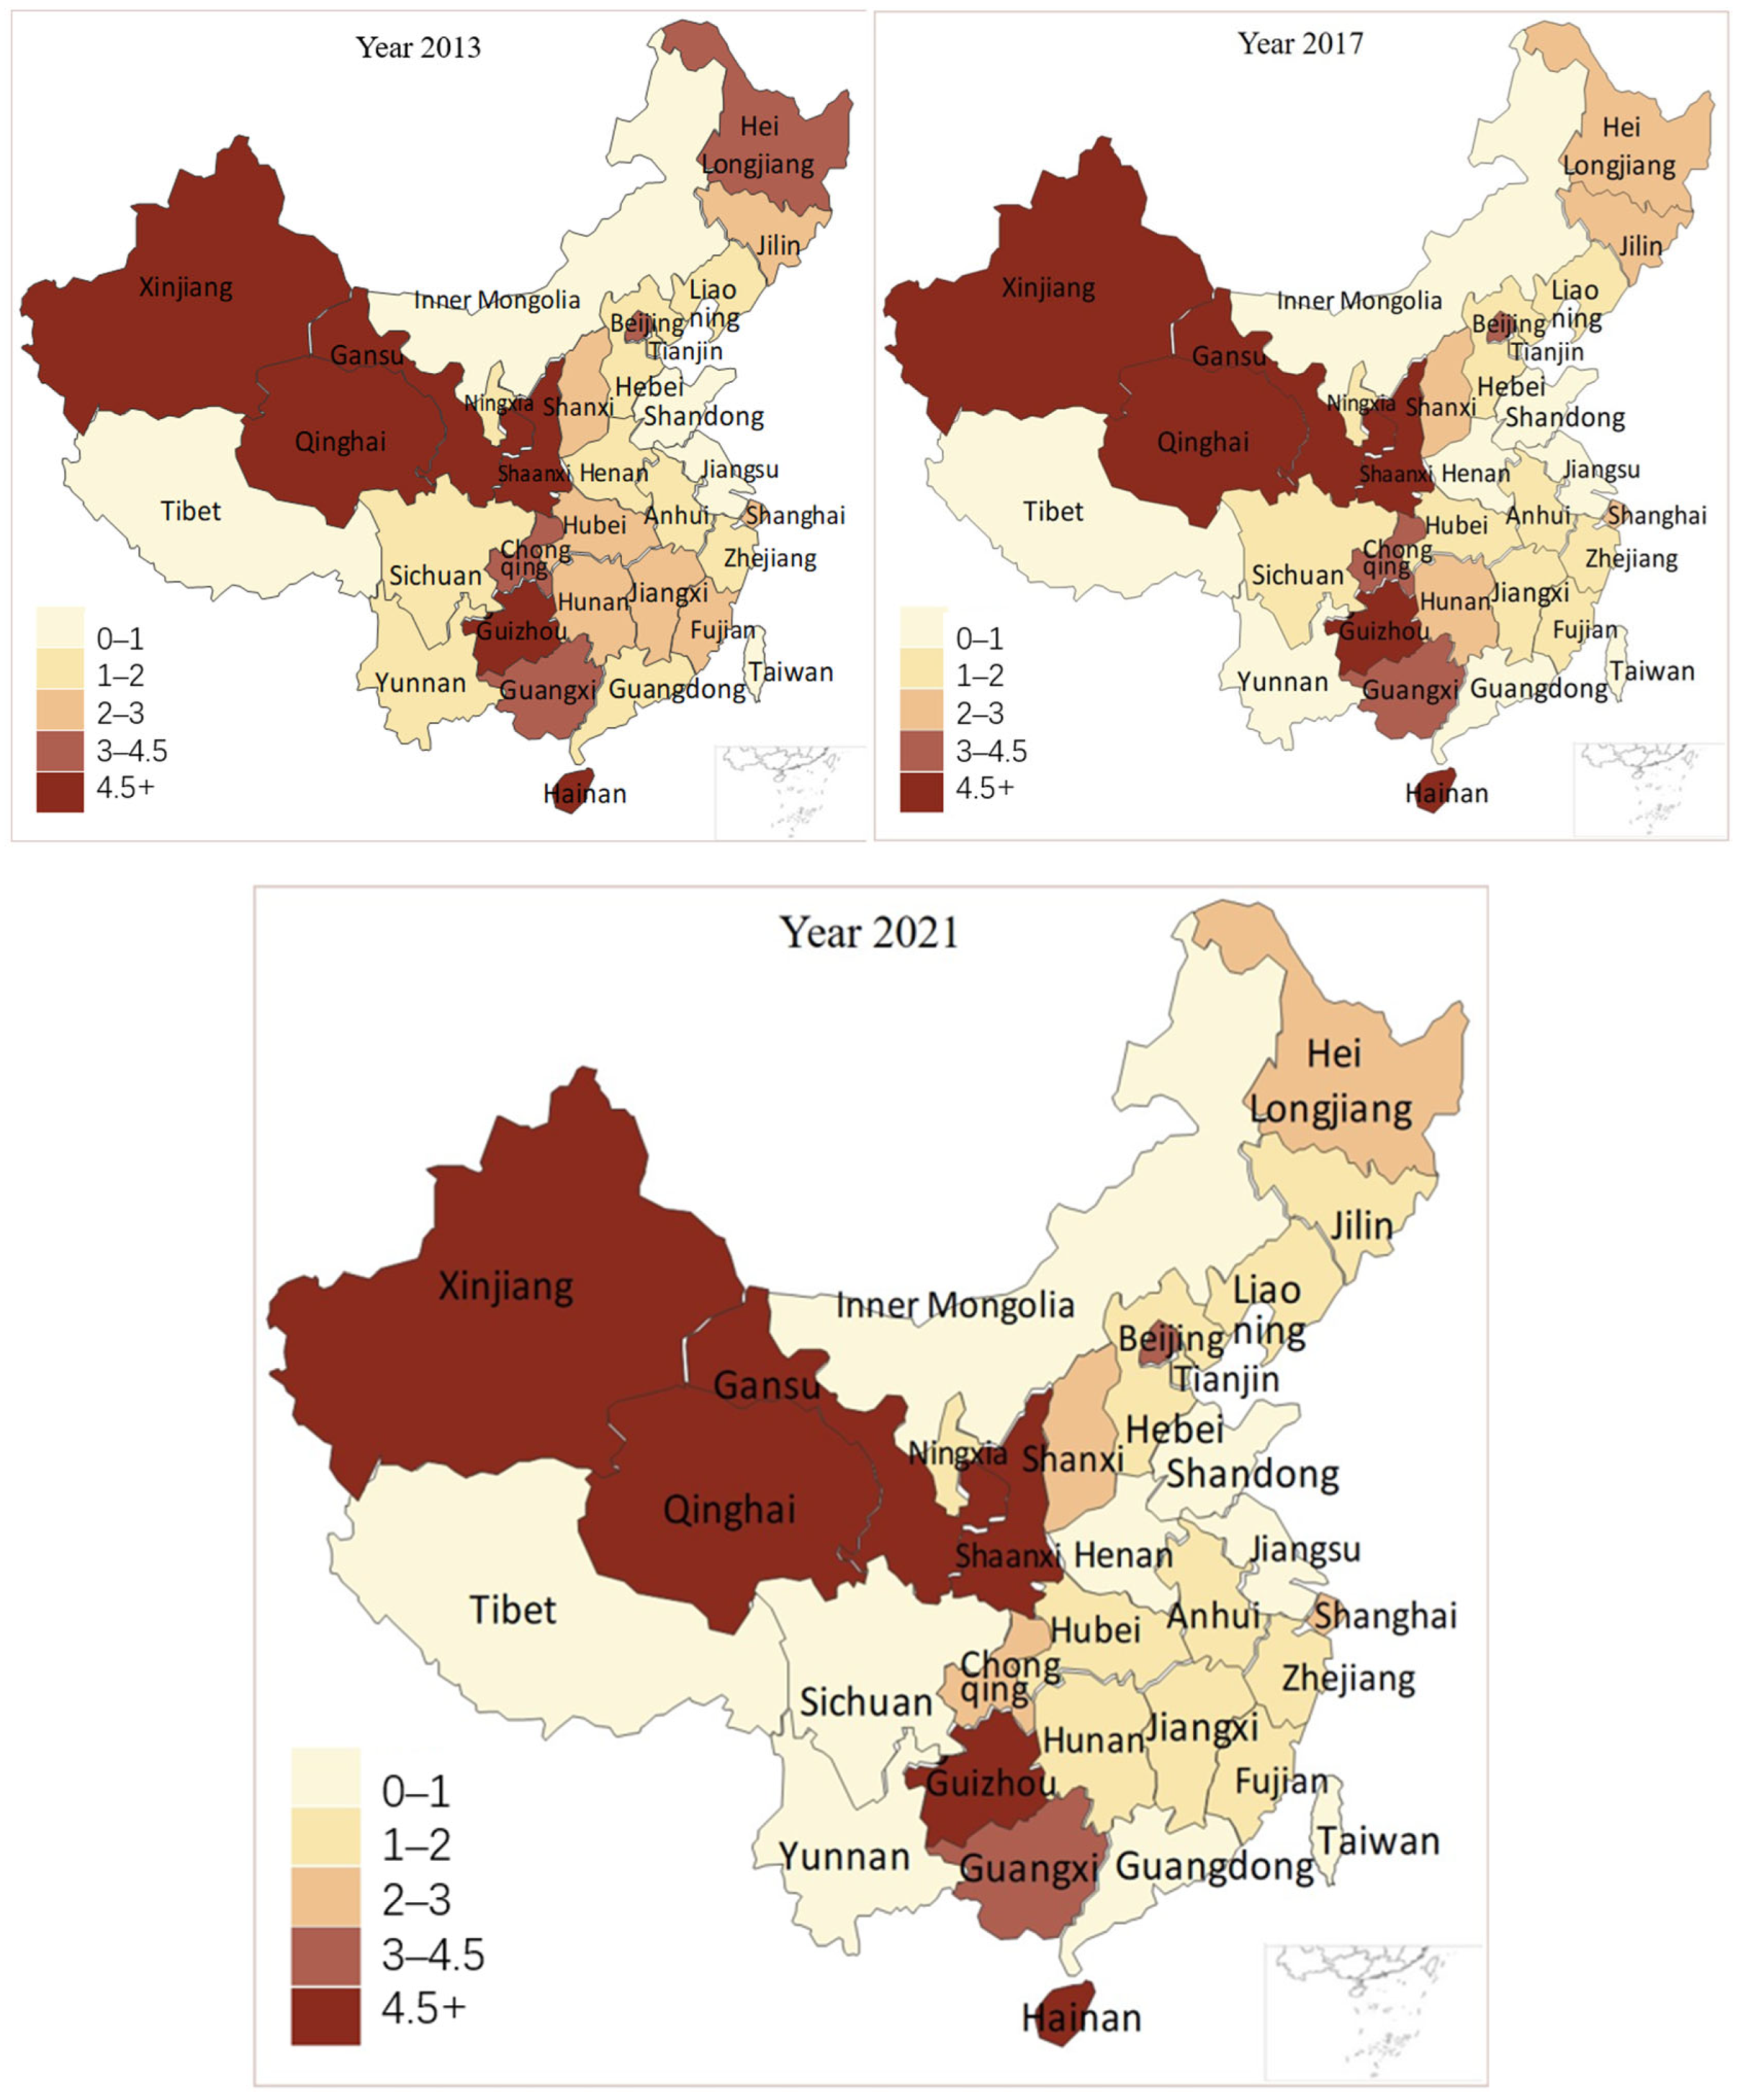
4.2.1. Dependent Variable

In our research, CEI is the dependent variable, which is the proportion of total CEs to GDP via referring to recent research [40]. CEI provides a more comprehensive assessment of a city’s energy and economic performance than total or per capita CEs. Municipal carbon emissions arise from both direct energy use, including gas and liquefied petroleum gas, and from electricity and heat consumption, as outlined in the literature [41]. The data used to calculate CEs primarily originates from the China Statistical Yearbook, China City Statistical Yearbook, China Regional Statistical Yearbook, and China Urban Construction Statistical Yearbook.
The spatial distributions of CEI of 30 regions of China in the years of 2013, 2017, and 2021 are illustrated in Figure 2. This figure illustrates significant variations in the temporal features of CEI. For instance, the CEI in Beijing decreased from CNY 4.31 million/100 tons in 2013 to CNY 3.30 million/100 tons in 2021, while the CEI in Qinghai increased from CNY 6.61 million/100 tons in 2013 to CNY 7.80 million/100 tons in 2021. The CEI in western China is comparatively larger than that in the east, likely owing to the coal-dependent energy and heating structures. Furthermore, regions with elevated CEI have transitioned from the northwest to the central Yellow River area.

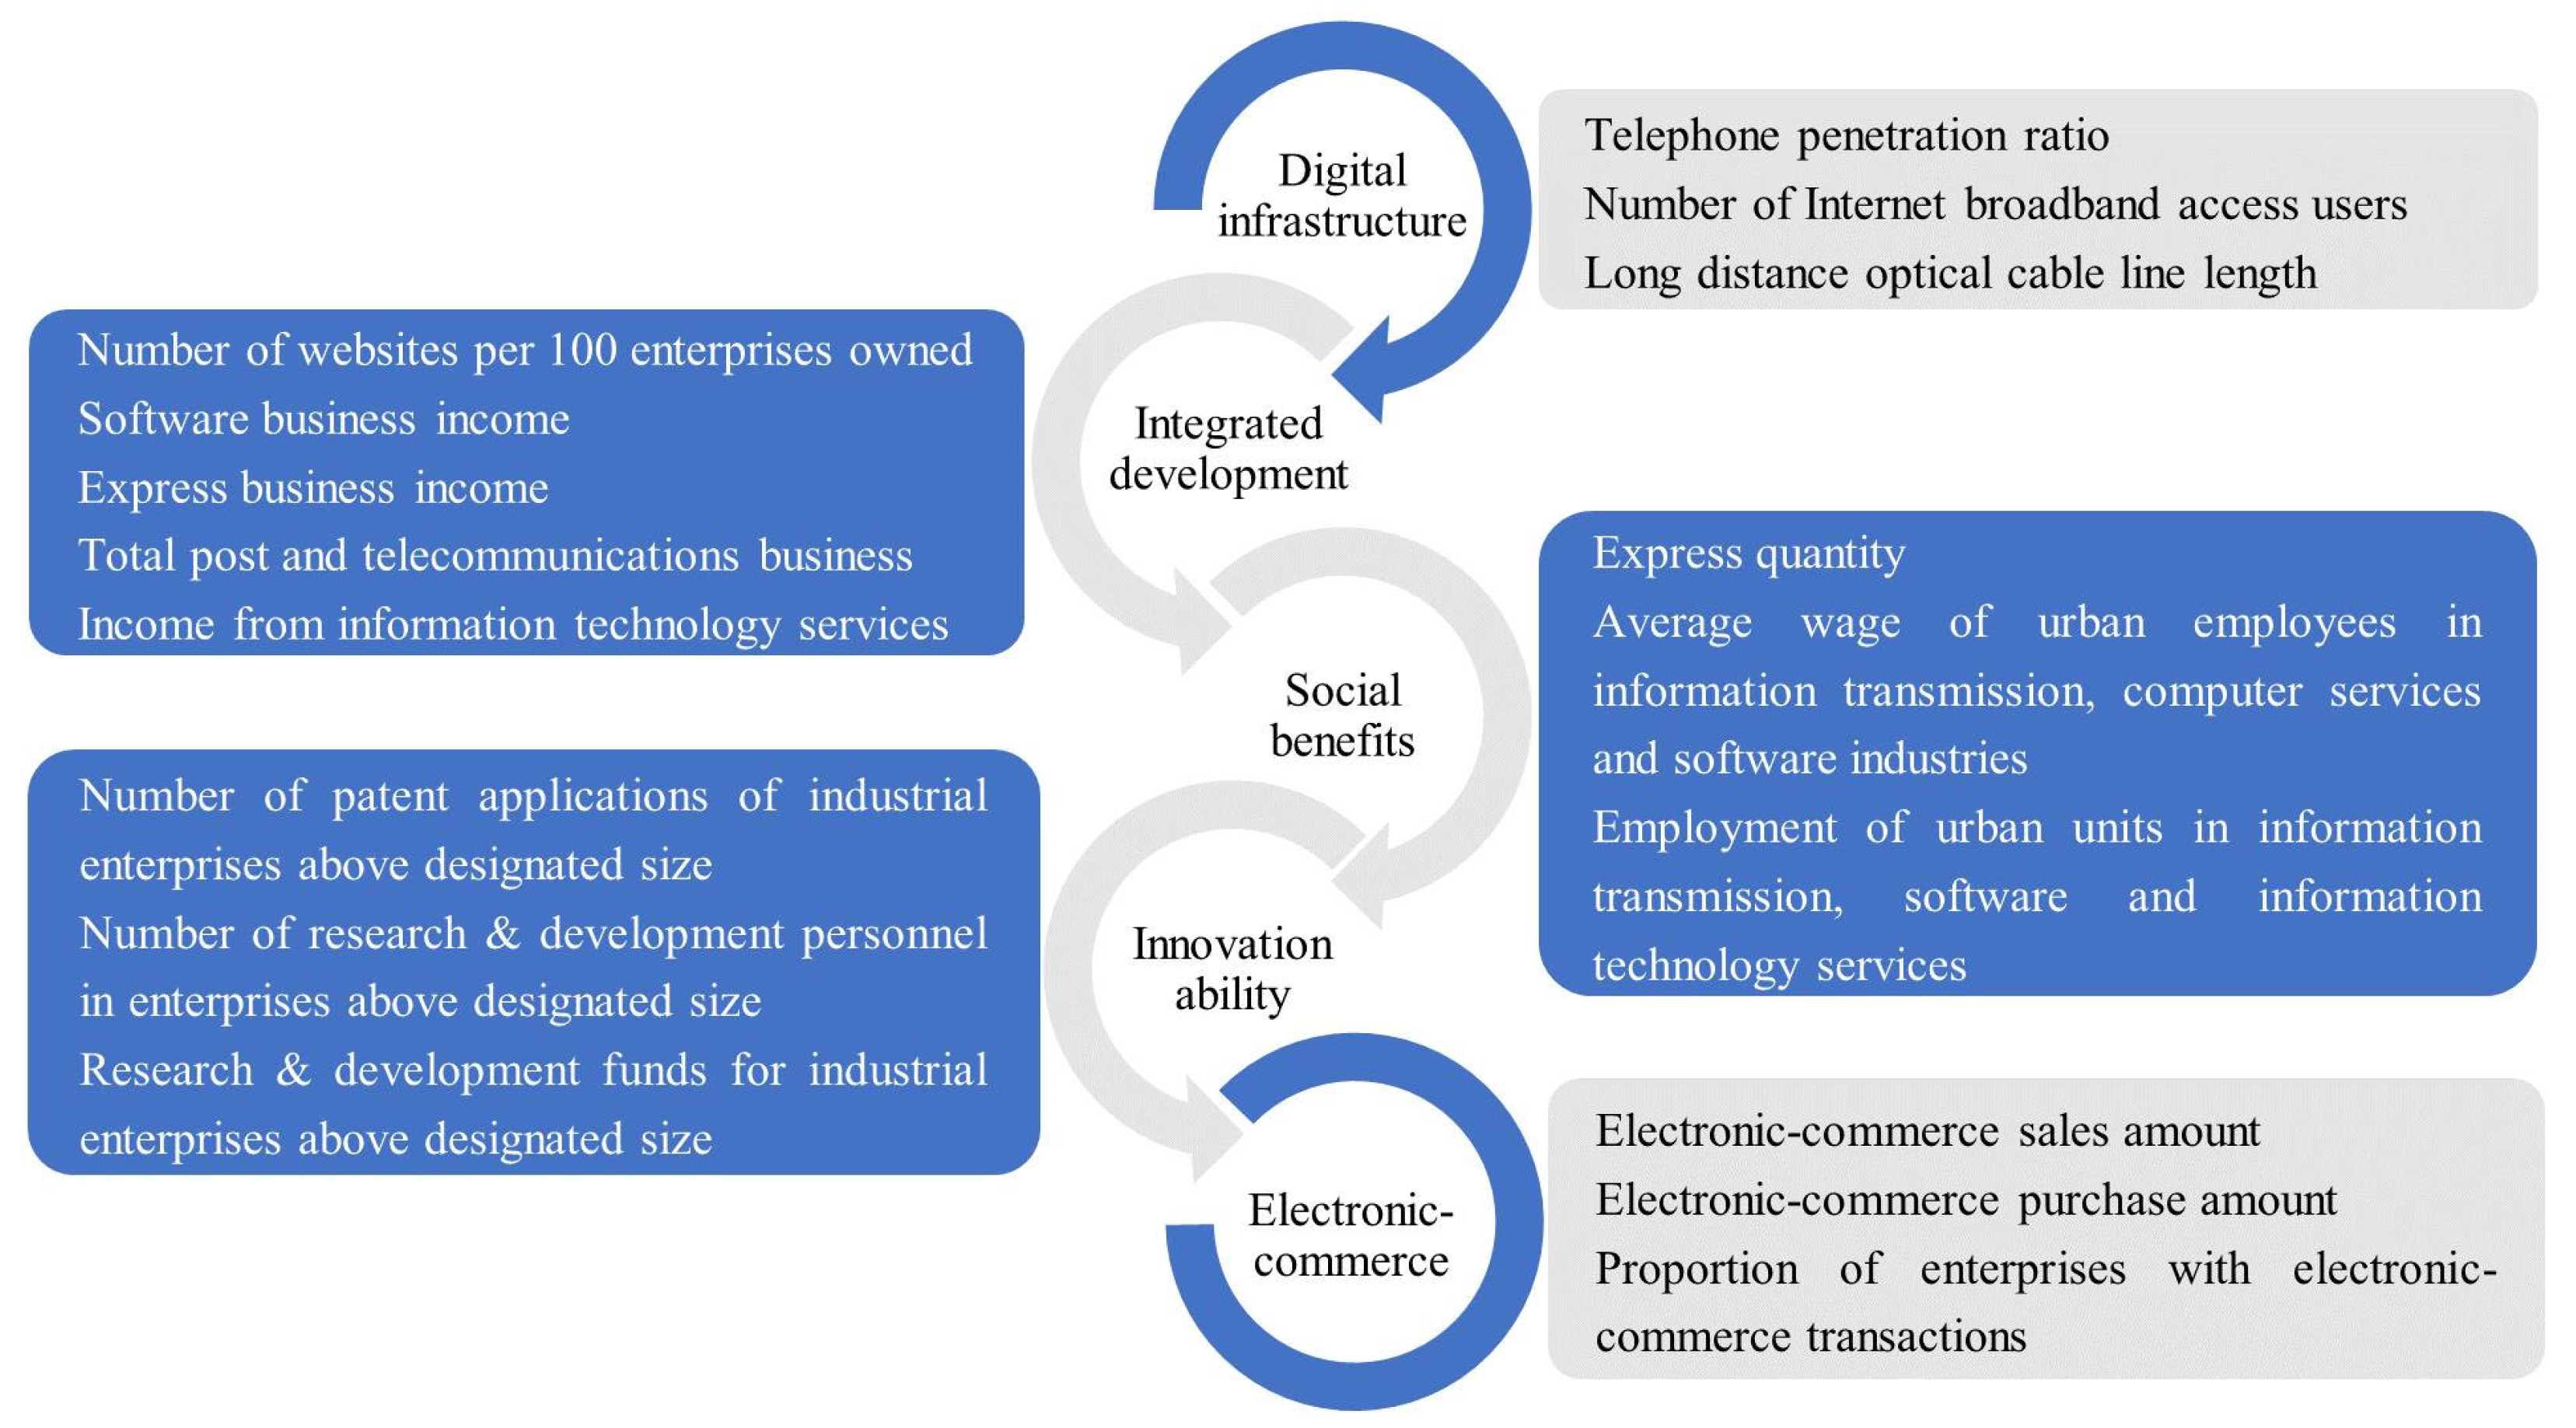
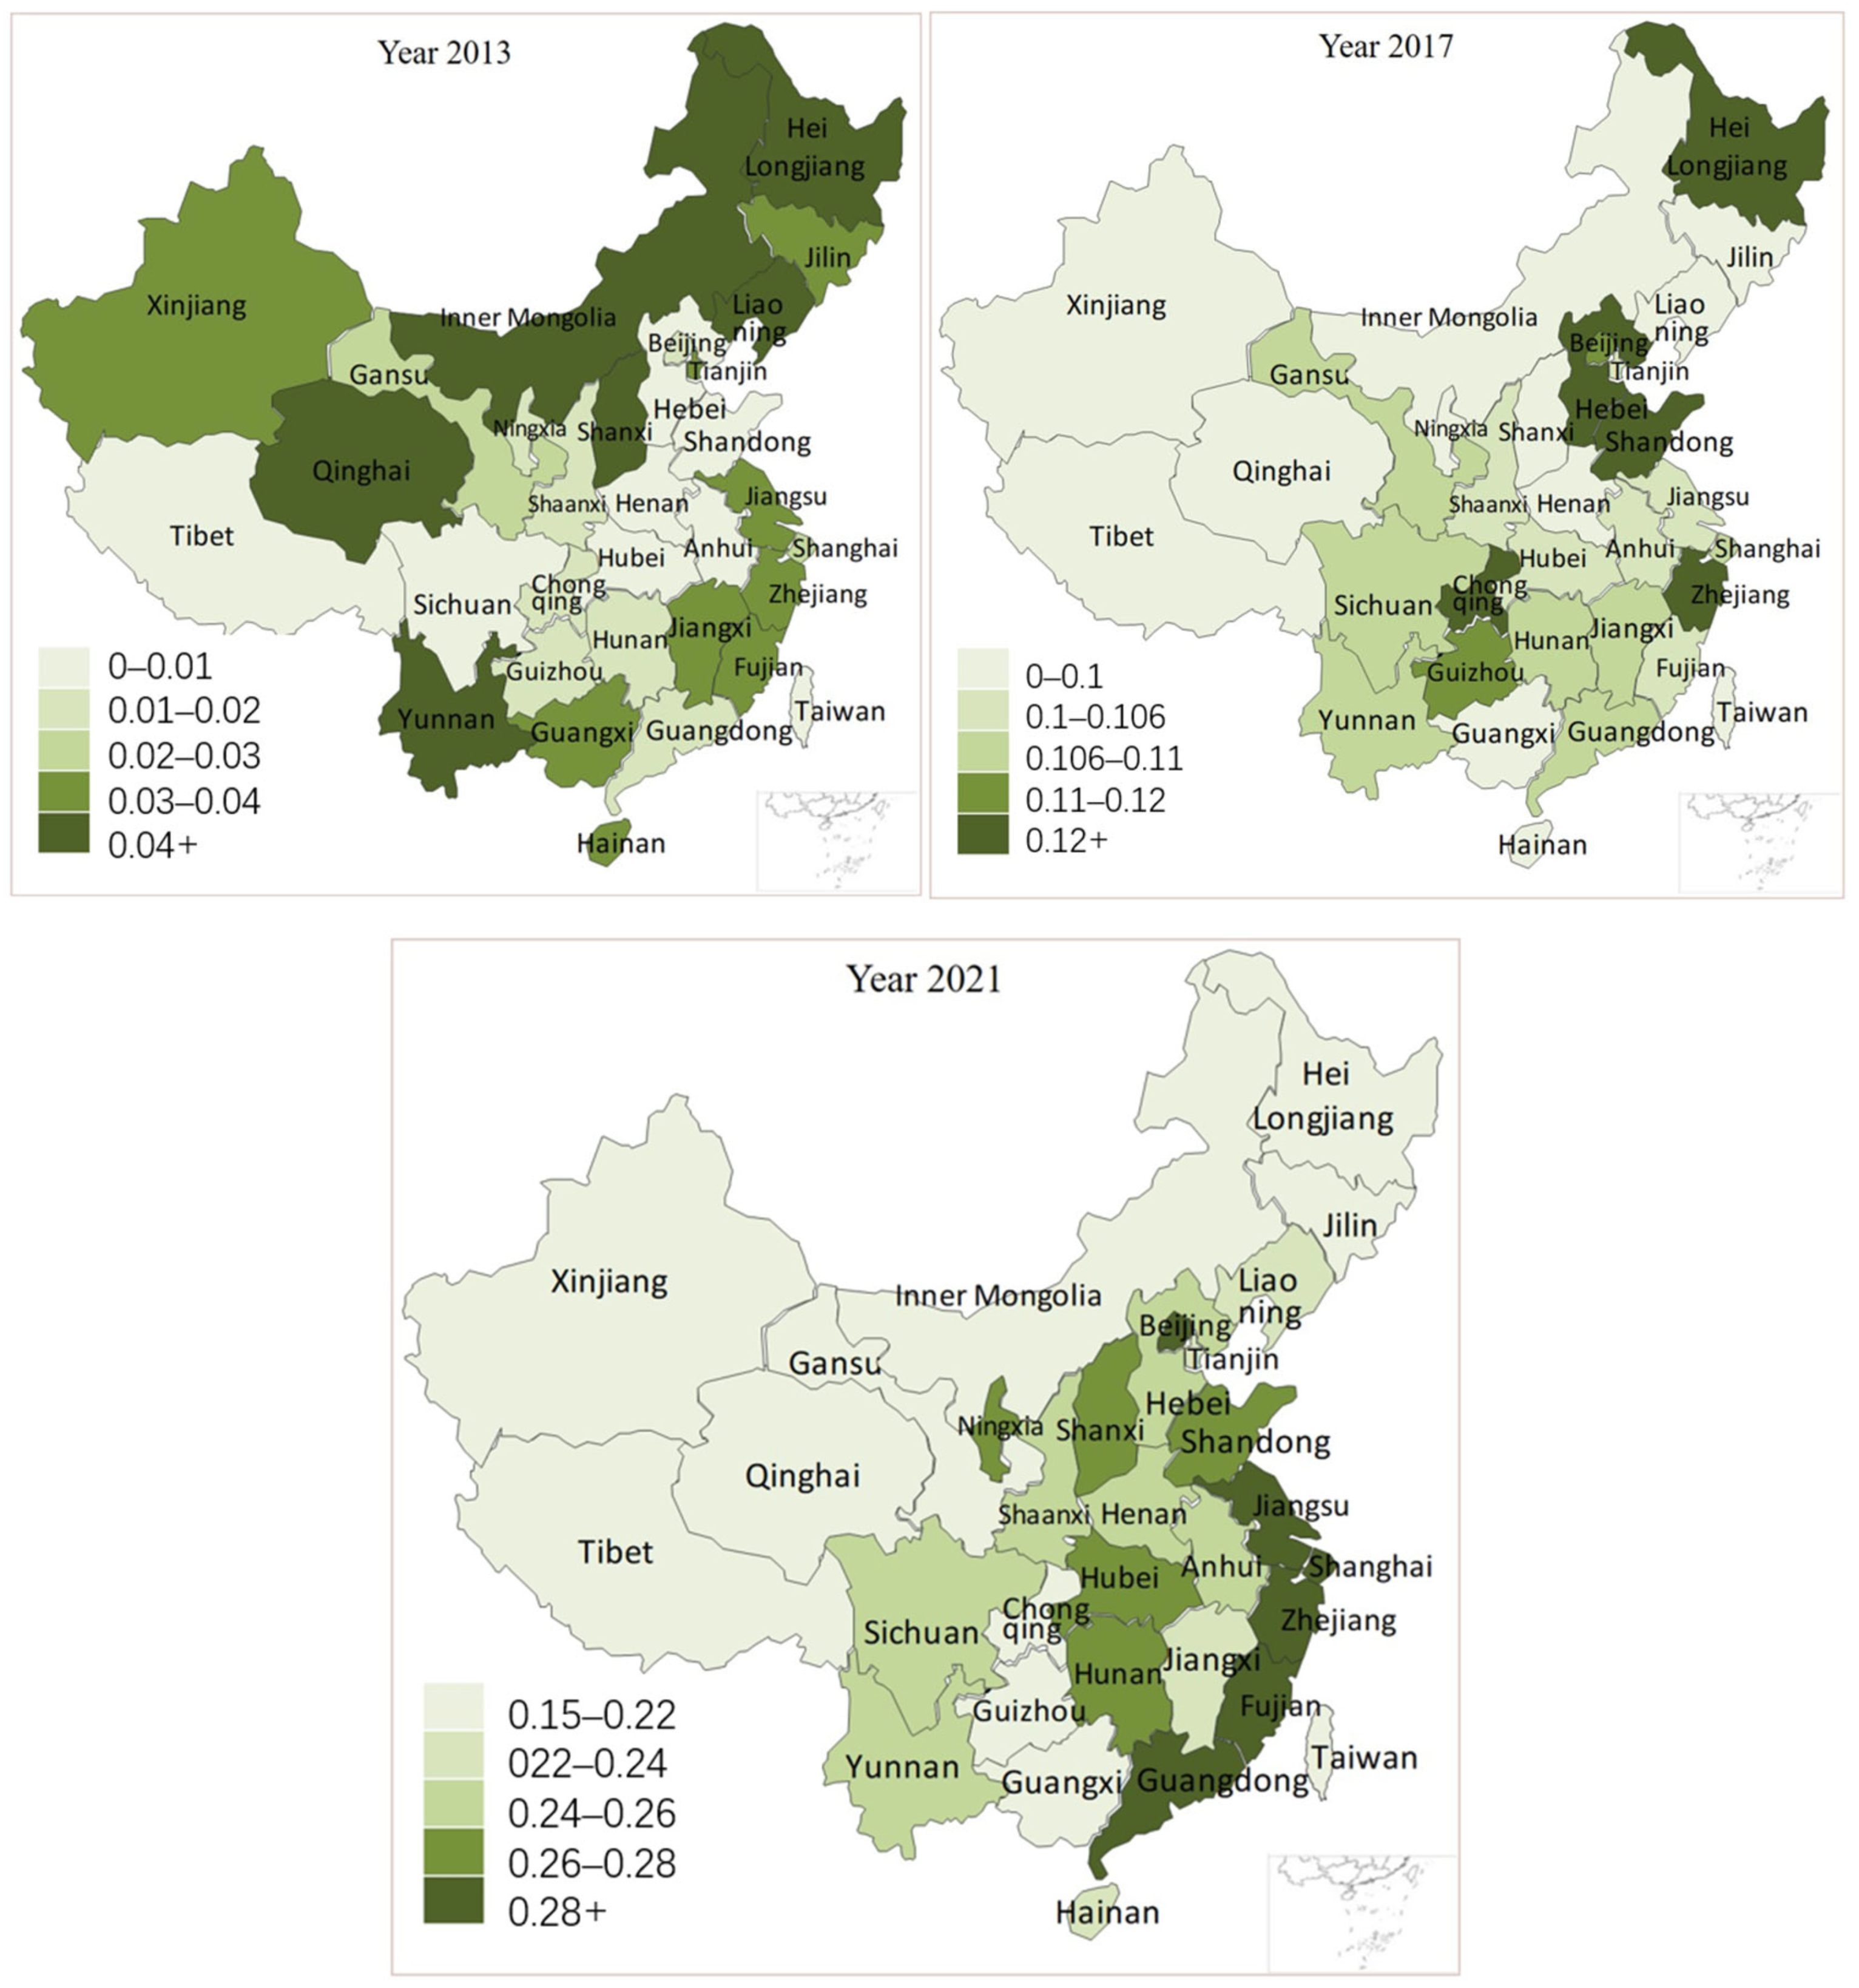
4.2.2. Explanatory Variable

The explanatory variable is represented by the DE development level. And considering the scarcity of relevant data of the DE preceding 2013, the research period ranging from 2013 to 2023 is selected. Building on prior studies [17,19,42,43,44,45], the development level of the DE generally evaluated from Internet penetration rate, personnel employed in related industries, the output of related industries, and mobile phone penetration rate dimensions, this research develops a DE indicator system encompassing five dimensions: digital infrastructure, integrated development, social benefits, innovation capability, and e-commerce. Seventeen secondary indicators are utilized to assess the DE as detailed in Figure 3. And relative data are collected from the China Statistical Yearbook.
Through referring to Zhao et al. [19,20], the entropy method, an information management algorithm, was used to calculate the DE development levels in 30 provincial regions from 2013 to 2023. This method’s computation process minimizes human interference and objectively assesses each indicator’s significance within the entire index system using actual data. The specific steps of this approach are as below.
Step 1: Normalize all indicators. According to 17 indicators employed to assess the DE development level listed in Table 1, indicators are estimated via various dimensions. To avoid measurement deviations, all indicators must be normalized. Positive and negative indicators are normalized via
For   positive   indicator Z i j = x i j min ( x j ) max ( x j ) min ( x j )
For   negative   inidcator :   Z i j = max ( x j ) x i j max ( x j ) min ( x j )
In the formulas above, max ( x j ) and min ( x j ) are the maximum and minimum values of indicators of 30 regions of China from 2013 to 2023, respectively. And Z i j is the normalized results.
Step 2: Compute the proportion of the j-th indicator in the year of i-th expressed by p i j :
p i j = Z i j i = 1 m Z i j
Step 3: Determine the information entropy e j of the indicator:
e j = k i = 1 m p i j ln ( p i j )
where k = 1 ln ( m ) , m is the assessment year.
Step 4: Obtain the information entropy redundancy d j :
d j = 1 e j
Step 5: Identify the index weight w j on the basis of the information entropy redundancy:
w j = d j i = 1 n d j
Step 6: Determine the comprehensive score s i of the DE:
s i = j = 1 n w j p i j
Thus, s i indicates the DE of i province. A higher value of s i demonstrates a higher level of the DE. Figure 4 illustrates the spatial distribution of DE development levels across 30 regions in China for the years 2013, 2017, and 2021. In 2017, the top three DE development provincial regions are Heilongjiang, Chongqing, and Shandong, while the last three regions are Xinjiang, Ningxia, and Guangxi. The spatial distribution of the DE transitions from scattered to clustered, eventually forming cores in the Beijing–Tianjin–Hebei area, Pearl River Delta, and Yangtze River Delta. Moreover, the DE levels in eastern regions are higher than those in western regions.

4.2.3. Mediating Variables

Building on prior investigations [3,46], the DE primarily influences economic growth, IS optimization, as well as the facilitation of STI. Therefore, we choose real GDP to indicate economic growth, patent application acceptance volume to represent STI, and the proportion of provincial tertiary to secondary industry output to signify industrial structural upgrading as the mediating variables. Data for the three mediating variables from 2013 to 2023 were sourced from the China Statistical Yearbook.
Real GDP is often a better indicator of regional economic development than nominal GDP, as it accounts for changes in regional output. This study calculates the real GDP of 30 regions from 2013 to 2023, applying the year 2000 as the base period.
The number of patent applications, encompassing inventions, utility models, and designs within a year, serves as a direct indicator of STI. This metric reflects regional innovation capability and vitality. Hence, patent application acceptance volume is adopted to express technical innovation.
In the model, IS is influenced via the advancement of the DE, which promotes the growth of the tertiary sector and eliminates outdated production capacities in the secondary sector. The industrial structural upgrading is represented in terms of the proportion of provincial tertiary industry output to secondary industry output.
Data for the three mediating variables were sourced from the China Statistical Yearbook.

4.2.4. Control Variables

Considering that the CEI is affected by various factors, our investigation selected energy structure (ES), government management (GOV), the level of external openness (TRD), urbanization process (UR), and environmental regulation (ER) as control variables based on relevant research. The ES, indicated by the proportion of coal in total primary energy consumption, negatively impacts CEI reduction [47]. GOV is assessed by the ratio of fiscal spending on STI to total fiscal expenditure [48]. TRD is assessed via the proportion of total exports and imports relative to GDP [6]. UR is evaluated by the urbanization rate determined by dividing the urban population by the total population [49]. ER is represented by the percentage of forest cover [22]. Data for the five control variables were sourced from the China Statistical Yearbook.
Descriptive statistics for all data are listed in Table 1.

5. Results and Discussion

5.1. Benchmark Regression Analysis

Firstly, aiming at validating Hypothesis 1 and discussing the direct effect of the DE on CEI, our investigation conducted benchmark Ordinary Least Squares (OLS) regression analysis. To ensure accurate regression results, this study performed a Hausman examination to decide between a fixed effect model and a random effects model. The result showed a p-value of 0.0073, demonstrating that the random effects should be rejected. Consequently, this article employs a fixed effect model to construct the benchmark regression. To address endogeneity and enhance the accuracy of regression results, this study employs a time and province dual fixed effect model. The regression results of gradually adding control variables are depicted in Table 2.
The second column of Table 3 reveals the DE is negatively correlated with the CEI. After further adding control variables, although the regression coefficients of the DE fluctuate, it still shows a significant negative correlation overall. This demonstrates the robustness of the estimation results, thereby supporting Hypothesis 1 from our study. This suggests that within China’s institutional framework, the advancement of the DE can effectively mitigate CEs. This could be attributed to the extensive advancements and implementations of DT in China. The application of DT enhances energy utilization efficiency and decreases energy loss and CEs in energy management, while also improving efficiency in transportation and logistics, thereby further reducing CEs. At the same time, this also provides the Chinese government with ideas and plans to reduce CEs. Government departments should actively utilize the DE to mitigate CEs, harness its development benefits, and employ it as a strategic tool to tackle climate and environmental challenges posed by rising CEs, thereby enhancing economic growth while preserving the ecological environment.
The two-way fixed effect analysis listed in columns four and five in Table 3 indicates that TRD is not significant, suggesting no notable impact on CEI after controlling for time and provincial variables. Furthermore, the coal consumption ratio to total primary energy and the urbanization rate both positively correlate with the CEI. That is because the consumption of coal energy will emit more carbon dioxide and the urbanization process will accelerate the continuous gathering of secondary and tertiary industries into cities, thus increasing CEs. However, GOV and ER both show a negative correlation with CEI. This indicates that technical innovations and the higher forest coverage can decrease the CEI.

5.2. Analysis of Spatial Spillover Effects

This investigation first uses the MI introduced earlier to verify whether there is a spatial correlation of CEI and the DE. The MI for the DE and CEI is shown in Table 3. From the perspective of the MI of CEI, the p-value of CEI in each year is less than 0.05, and the MI values in each year are all positive, indicating a significant positive spatial correlation between CE levels in various provincial-level regions in China. This means cities with high emission levels will also increase CEs in neighboring provinces. The MI of the DE shows a high p-value in the early research phase, suggesting no statistically significant positive correlation. This phenomenon primarily occurs because the development prospects of the DE are uncertain during the initial research phase. Coastal provinces with advanced economic development are well-positioned for DE growth, whereas other provinces lack the essential conditions for such development. Consequently, the DE development level in most provinces remains low, resulting in minimal spatial spillover effects in only a few cities. Hence, the spatial correlation of the DE is not significant. Nevertheless, with the accelerating growth of the DE, the benefits caused by the vigorous development of the DE were measured by local governments. Improvements in infrastructure and market conditions have notably advanced since the initial research phase, with spillover effects increasingly benefiting neighboring regions and enhancing the DE level in adjacent provinces. Therefore, the MI of the DE is relatively significant in the mid-term and later term of the research phase.
According to the MI results above, it is verified that CEI and the DE both have significant spatial correlation in China. Therefore, utilizing the spatial panel model is suitable for examining spatial spillover effects and testing Hypothesis 2. Before conducting spatial econometric regression analysis, we need to perform LM (Lagrange multiplier), LR (likelihood ratio), RLM (robust Lagrange multiplier), and RLR (robust likelihood ratio) tests on the set regression equations to choose the most suitable model among SEM, SAR, and SDM. Specifically, we first select an SDM that includes independent variable correlation and dependent variable correlation as the basic model, and then test and observe whether it could degenerate into the SEM or SAR model. Tests indicated that the regression model did not simplify into the other two models. The Hausman test indicated the necessity of using a fixed effect model. Hence, our investigation ultimately chose the temporal and spatial two-way fixed effects SDM. Table 4 illustrates the regression outcomes of the SDM. The DE significantly suppresses local CE levels. The positive spatial lag and indirect effect coefficients of the DE suggest that its development in one province influences both local and neighboring regions’ CE levels.
Building on prior research, our study employs the partial differential approach [50] to thoroughly analyze the spatial spillover effect. Table 4 reveals that the DE’s indirect effect on CEI is markedly positive at the 10% level, suggesting that the DE positively influences CEI in adjacent areas. The primary reason is that as the local DE develops, the industrial chain will expand, attracting enterprises and capital from other provinces. These enterprises and capital may increase trade and cooperation with neighboring provinces, indirectly increasing their CE levels. Secondly, the evolution of the DE could alter resource distribution. The rising demand for new energy and efficient production resources in the DE has resulted in a local concentration of low-emission resources, allowing neighboring regions to access more high-emission resources, thereby increasing their CEs. In addition, the improvement of the DE level in provincial regions has utilized more advanced technologies, forcing the transfer of high emission and high pollution outdated production capacity and technology to neighboring regions. The interregional industry transfer has elevated the CE levels in adjacent provinces. In terms of controlling variables, both GOV and TRD have significant negative spatial spillover effects. This indicates that with the enhancement in government investment in technological innovation, new technologies are constantly emerging to improve resource utilization efficiency, which will directly affect local CE levels and can also drive neighboring regions to reduce CE levels. Correspondingly, an increase in total trade volume means an increase in the degree of openness to the outside regions, allowing local areas to gain more opportunities for external exchanges and master more low-carbon technologies and carbon reduction methods. Simultaneously, the flow of these technologies and capital in adjacent areas also decreases the CE levels of corresponding neighboring areas.
The DE’s positive spillover effect on neighboring regions’ CEI offers fresh insights for government policy formulation. On the one hand, various governments need to take effective regional cooperation and policy measures. Enhancing inter-governmental cooperation can strengthen the regulation and standard setting of the DE, ensuring its environmentally friendly development. Conversely, implementing a unified carbon market in China can enhance coordinated carbon reduction efforts, mitigate the externalities of carbon emissions, and effectively control the rise in domestic carbon emission levels. Implementing policy measures like enhancing energy efficiency, fostering a low-carbon economy, and advancing clean energy can facilitate carbon reduction alongside DE development.

5.3. Analysis of Mediation Effect Regression Results

This study utilizes a mediation effect model regression to test Hypotheses 3–5 and investigate the mediation mechanism of the DE’s impact on CEI. The specific mediation effect model settings are shown in Equations (2) and (3). The mediating variables include real GDP, STI, and IS. The mediating effect requires two regressions, and if the key regression coefficients are not all significant, the mediating effect needs to be tested. Through a summary and analysis of the previous literature, it can be found that most scholars used Baron’s stepwise test method for mediating effects [51]. This method’s limitation is the unreliability of mediating effects test results, often leading to insignificant conclusions despite significant coefficients. Researchers later introduced the Bootstrap method [52] as an alternative to the traditional Sobel method for testing mediating effects. Consequently, our study employs the Bootstrap approach to assess the significance of the mediating effect. Table 5 presents the regression outcomes, while Table 6 displays the results from 1000 Bootstrap sampling tests.
Table 5’s second and fifth columns present the regression analysis results on how economic growth affects CEI. The positive and statistically significant coefficient at the 1% level between the DE and real GDP suggests that DE development significantly enhances economic growth. The regression coefficient between real GDP and CEI is negative but not significant. The Bootstrap examination results in Table 6 confirm that the DE reduces CEs by fostering economic growth, supporting Hypothesis 3. Table 5’s third and sixth columns present the regression analysis of how science and technical innovation influence CEI. The table shows a positive and statistically significant coefficient at the 1% level between the DE and STI, suggesting that DE development significantly enhances innovation levels. The regression analysis shows STI is negatively corelated with CEI at the 1% level. The Bootstrap test results in Table 6 confirm Hypothesis 4, implying that the DE reduces CEs by fostering innovation. Table 5’s fourth and seventh columns illustrate how IS upgrading affects CEI. The regression analysis reveals the DE is positively correlated with IS at the 10% level. IS is negatively correlated with CEI at the 5% confidence level. Bootstrap test results demonstrate that DE development facilitates IS upgrading, subsequently reducing CE levels. This finding aligns with our theoretical analysis and supports Hypothesis 5.
In Bootstrap, the calculation of p-value is relatively complex, so this study uses confidence intervals to determine significance. If the confidence interval does not include 0, it is considered that the mediating effect is significant. The confidence interval obtained through Bootstrap testing in the last column in Table 6 implies that the confidence interval does not contain 0, indicating significant direct effects and indirect effects. The development of the DE not only directly suppresses CEs but also does so by fostering economic development, industrial upgrading, and innovation. This motivates us to enhance the integration of DT in traditional sectors and actively promote the growth of emerging digital technologies into new industries. Industrial upgrading is facilitated by integrating traditional industries with DT, which helps phase out obsolete production capacities and enhances efficiency, thereby advancing overall industry development. Conversely, the emerging industry driven by DT signifies an impact on traditional industries and exemplifies industrial upgrading. The emergence of some emerging Internet companies, such as JingDong and Alibaba, represents the steady upgrading of China’s IS through their vigorous development. Secondly, leveraging DT in sectors like energy, transportation, and industry can enhance resource and energy efficiency, thus lowering CEI. Smart grid technology enables precise energy management and scheduling, enhancing power system efficiency and decreasing energy waste and CEs. Secondly, DT can advance the development and use of green energy. Utilizing smart grid and energy storage technologies enhances renewable energy use, leading to reduced CEs. The integration of DT in transportation, including shared travel and intelligent systems, can alleviate traffic congestion, decrease vehicle mileage, and lower CEI. DT facilitates green production and consumption by enabling sustainable management of production processes through digital supply chain management and intelligent manufacturing, thus reducing CEI. In short, the DE can reduce CEI in multiple fields and achieve sustainable development by promoting innovation and industrial upgrading. Hence, we can reduce CEI through promoting the development of the economy, economic industrial transformation, and science and technological innovation.

5.4. Regional Heterogeneity Discussion

The numerous provincial regions in China lead to considerable regional disparities in CEI and DE development levels. Therefore, this investigation further conducts regression across different regions to discuss their regional heterogeneity in detail. In our study, the eastern area comprises coastal provinces including Beijing, Tianjin, Hebei, Liaoning, Shanghai, Jiangsu, Zhejiang, Fujian, Shandong, Guangdong, and Hainan. The central area encompasses the provinces of Shanxi, Jilin, Heilongjiang, Anhui, Jiangxi, Henan, Hubei, and Hunan. And the remaining Inner Mongolia, Guangxi, Chongqing, Sichuan, Guizhou, Yunnan, Shaanxi, Gansu, Qinghai, Ningxia, and Xinjiang are divided into the western area. According to the DE development level analysis in Section 4.2.2, we can find that the DE development levels in eastern areas and central areas are higher than western regions. And the CEI level of the western region is higher than that in central and eastern regions.
Table 7 displays the regression outcomes for each area, with the first column showing the SDM results and the second column presenting the fixed effect model results. The benchmark fixed effect model regression results indicate that the DE exhibits varying inhibitory effects on CEI levels across the three major areas. The western area exhibits the most significant inhibitory effect on CEI, followed by the central area, whereas the eastern area’s DE has the least inhibitory impact. The limited impact on CEI in the eastern area may be attributed to the already high level of the DE, which restricts further development opportunities. Correspondingly, although the DE has increased in the middle and western areas, there is still significant room for growth. In contrast, the DE in the middle and western areas has a leading impact on CEI compared to the eastern area.
Table 7’s SDM regression results indicate that the direct coefficients of the DE on CEI are negative across all three major areas, aligning with the findings from the benchmark fixed effect model. This suggests that enhancing the DE in each area substantially lowers the local CEI. The direct effect coefficient (DE) significantly inhibits CEI in the middle and western areas, as indicated by a notable regression coefficient, whereas the DE in the eastern area is not significant. The central Chinese government’s policy support and successful implementation of strategies to improve the DE in recent years have notably enhanced the economic development and infrastructure in the western and middle areas. The integration of the DE with the traditional economy has maximized its potential, enhancing DE development and curbing the rise of CEs. Secondly, in terms of the indirect effect coefficient, the spatial spillover effect is most pronounced in the western area, followed by the eastern area, with the middle area showing no significant effect. The DE in the western area is low, highlighting substantial potential for market improvement. The advancement of the DE in a specific province can effectively integrate with local traditional industries and enhance the industrial standards in adjacent provinces. The DE in one region has provided a notable demonstration effect, reducing CEI in neighboring areas and generating substantial spillover effects. In the eastern area, the advanced DE development across various provinces results in limited radiation and driving effects on adjacent provinces. Consequently, the spatial spillover effect is weaker in the middle area compared to the western area, resulting in the lowest spillover effect in the middle area.

5.5. Robustness Test

To increase the reliability of the empirical conclusions, our study substitutes the explanatory variable with the Digital Inclusive Finance Index (DIFI) from the Digital Finance Research Center of Peking University, which partially indicates China’s DE. The second column of Table 8 demonstrates the results obtained through regression using the DIFI of the current year. The explanatory variable’s coefficient remains negative and significant at the 1% level. To account for potential lag effects of digitization on CEs, the model employs the previous period’s DIFI (denoted as L.DIFI) as the explanatory variable for regression analysis. Results in the third column showed that the coefficient of the explanatory variable was still negative and passed the significance test. Additionally, this study will replace the explanatory variable with the total CE level of the provincial regions, and then conduct regression. The fourth column of Table 8 presents results where the regression coefficient remains negative and significantly aligns with the benchmark regression outcomes at the 1% significance level. These regression findings further confirm the robustness of the previously obtained results.

5.6. Endogenous Processing

The endogenous problem is a significant issue that needs to be addressed in economic studies. Considering the research in our study, on the one hand, there may exist a certain causal endogenous nexus between the development level of the DE and CEI. On the other hand, CEI may be affected by many factors and it is hard for control variables contained in the current data to avoid the generation of missing variables. Owing to the possible existence of two-way causality and missing variables, our research chooses post and telecommunications (P&T) in 1984 as instrumental variables. This is because the distribution of telecommunications infrastructure and post offices in history can exert a specific impact on DE development in a certain region in the subsequent stage, and the total amount of such business in history indicates the lifestyle and consuming patterns of local residents. Hence, the selection of the amount of P&T offices and the total P&T business as the instrumental variables satisfies the correlation demands. And two-stage least squares are employed to verify endogeneity [53]. Considering the cross-sectional data form of two instrumental variables, they cannot be directly used in the panel data model. To solve this problem, we refer to the method of Nunn [54] and employ the time series variables to establish panel instrumental variables in our research. The number of P&T offices per 10,000 people in every provincial-level region and the total P&T business per capita in 1984 are utilized as interactive items separately with the number of Internet users in provincial-level regions in the previous year, which are utilized to be instrumental variables of DE development level.
Table 9 lists the results obtained via the two-stage least squares (2SLS) regression. Results illustrate that the effect of the DE on CEI decrease is significant. Moreover, the Kleibergen-Paap rk LM statistics in the second model obviously reject the null hypothesis that the equation is under-identified and the instrumental variable is irrelevant. The Hansen J test results accepted the null hypothesis, which demonstrates that all instrumental variables are exogenous instrumental variables. Hence, the instrumental variables employed in our investigation are effective.

6. Conclusions and Policy Implications

6.1. Conclusions

The ongoing intensification of environmental and climate issues has garnered global attention and increased the demands for sustainable societal development. In order to address this challenge, transforming development patterns and reducing pollution emissions have become important issues that must be faced and addressed. The rapid advancement of DE offers innovative solutions for transforming development models, reducing CEs, and promoting sustainable development. Based on this context, this study identified 17 secondary indicators across five dimensions to build a DE measurement indicator system for assessing the DE development level. Our study conducted a comprehensive analysis of the correlation between China’s DE and CEI utilizing panel data from 30 regions from 2013 to 2023. Applying fixed effect models, mediating effect models, and spatial Durbin models, the research examined this relationship across multiple dimensions. Mediating variables included real GDP, patent application volume, and the ratio of tertiary to secondary industry output. Control variables comprised the coal consumption ratio to total primary energy, government fiscal spending on STI, the share of exports and imports in GDP, urbanization rate, and forest cover percentage.
The research results are summarized below. Firstly, the degree of DE development has varied across different provincial areas in China. Secondly, the advancement of China’s DE significantly suppresses CEI, effectively lowering CE levels. Despite changes in coefficient size with the gradual addition of control variables, the conclusion remains significant in the robustness test when substituting the explanatory variable. However, the effectiveness of the DE in suppressing CEI shows regional heterogeneity, with the development of the DE in the western region having the greatest inhibitory impact on CEI, followed by the middle and eastern regions. Thirdly, the DE has effectively curbed CE growth through three mediating mechanisms: economic growth, STI, and IS upgrading. Fourthly, the DE exhibits a critical spatial spillover effect on CEI, and that effect also exhibits regional heterogeneity. The western region experiences the most pronounced negative spillover effect, followed by the eastern region, whereas the middle region shows no significant spillover effect.

6.2. Policy Implications

Based on the empirical results above, we propose the following policy recommendations to local related policy makers.
Firstly, local governments should enhance the DE infrastructure to establish a robust foundation for its advancement. The advancement of the DE is vital for economic growth and significantly influences CEs, as benchmark regression analysis and heterogeneity discussion implied that the direct coefficients of the DE on CEI are negative across all three major areas. The widespread adoption of DT enhances productivity, optimizes resource allocation, and decreases energy consumption and CEs through digital management and control. Additionally, integrating traditional industries with DT can fully harness its potential. The digitization and intelligence of traditional industries enhance production efficiency and product quality, decrease resource consumption and carbon emissions, and facilitate the transition and upgrading of these industries towards a low-carbon model. In conclusion, promoting the DE is essential for its continued growth and expansion into new application areas. Developing a stable DE is an effective strategy to manage the expansion of CEs.
Secondly, local governments should leverage the spatial spillover effect of the DE on CEI and related managers need to actively enhance regional dialogue and cooperation channels. Provinces should enhance cross-regional cooperation to leverage the development of the DE in neighboring areas and alleviate local CE reduction pressures, especially in western areas, according to heterogeneity results. In order to achieve regional cooperation and assistance, local governments can adopt various measures. Regions can create DE cooperation platforms to share the latest achievements and experiences, enhancing synergy in DE development. On the other hand, the government can increase its investment in the DE and provide sufficient financial support and policy guarantees for its development. Furthermore, regions can enhance collaboration along the DE industry chain, maximizing its impact on IS adjustment and optimization, fully utilize the advantages of DE in transmitting information and resource allocation, promote industrial collaboration and optimization between regions, and achieve coordinated CEs reduction between regions. We should avoid the phenomenon of digital divide, which will increase the degree of differences in DE development between regions.
Thirdly, governments are required to fully leverage the innovative and IS upgrading effects of the DE. They must pursue growth through innovation, establishing it as a perpetual catalyst for emerging industries development and achieving industrial expansion. The DE is fostering the emergence of industries like big data and artificial intelligence through technological and business model innovations. The emergence of these new industries can invigorate the DE’s growth, enhance the efficiency and competitiveness of traditional sectors, and concurrently curb the expansion of CEs. In developing the DE, it is crucial to emphasize innovation while effectively leveraging DE advancements to drive IS upgrades. It is crucial to facilitate IS upgrades by enhancing the DE and reinforcing policy guidance, promoting its application in traditional high-pollution, high-energy industries to achieve low-carbon transformation and reduce CEs.
Above all, there are still some limitations which can be improved in our future studies. First, our study only focused on the association of the DE with CEI, while in future research, we can study the relationship between the DE and other environmental indicators, such as ecological footprint. Hence, the empirical analysis can be verified through employing other environmental indicators. With the enrichment of the data, the study can expand the research period to deeply explore the change in the relationship between the DE and CEI or other environmental indicators. Moreover, future research will discuss whether carbon reduction schemes might influence our results and can also testify to the threshold effects for other countries or regions via novel econometric models, thus enriching the existing literature.

Author Contributions

Conceptualization, J.D. and H.Z.; methodology and software, Z.Z.; validation, C.J.; formal analysis and investigation, S.G.; data curation and writing—original draft preparation, J.D., H.Z. and Z.Z.; writing—review and editing, C.J. and S.G.; funding acquisition, H.Z. All authors have read and agreed to the published version of the manuscript.

Funding

This paper is supported by the National Natural Science Foundation of China, under Grant No. 72303022, and Qin Xin Talents Cultivation Program of Beijing Information Science & Technology University.

Institutional Review Board Statement

Not applicable.

Informed Consent Statement

Not applicable.

Data Availability Statement

Data are available upon reasonable request.

Conflicts of Interest

The authors declare no conflicts of interest.

References

  1. Sun, J.; Chen, J. Digital Economy, Energy Structure Transformation, and Regional Carbon Dioxide Emissions. Sustainability 2023, 15, 8557. [Google Scholar] [CrossRef]
  2. Li, X.; Liu, J.; Ni, P. The Impact of the Digital Economy on CO2 Emissions: A Theoretical and Empirical Analysis. Sustainability 2021, 13, 7267. [Google Scholar] [CrossRef]
  3. Sun, J.; Dong, F. Decomposition of carbon emission reduction efficiency and potential for clean energy power: Evidence from 58 countries. J. Clean. Prod. 2022, 363, 132312. [Google Scholar] [CrossRef]
  4. Zheng, J.; Wang, X. Can mobile information communication technologies (ICTs) promote the development of renewables?—Evidence from seven countries. Energy Pol. 2021, 149, 112041. [Google Scholar] [CrossRef]
  5. The Digital China Development Report (2022); National Internet Information Office: Beijing, China, 2023.
  6. Zhang, Y.; Yu, Z.; Zhang, J. Analysis of carbon emission performance and regional differences in China’s eight economic regions: Based on the super-efficiency SBM model and the Theil index. PLoS ONE 2021, 16, 0250994. [Google Scholar] [CrossRef] [PubMed]
  7. Sun, W.; Huang, C. How does urbanization affect carbon emission efficiency? Evidence from China. J. Clean. Prod. 2020, 272, 122828. [Google Scholar] [CrossRef]
  8. Yu, Y.; Zhang, N. Low-carbon city pilot and carbon emission efficiency: Quasi experimental evidence from China. Energy Econ. 2020, 96, 105125. [Google Scholar] [CrossRef]
  9. Weina, D.; Gilli, M.; Mazzanti, M.; Nicolli, F. Green inventions and greenhouse gas emission dynamics: A close examination of provincial Italian data. Environ. Econ. Pol. Stud. 2016, 18, 247–263. [Google Scholar] [CrossRef]
  10. Wang, Z.H.; Yin, F.C.; Zhang, Y.X.; Zhang, X. An empirical research on the influencing factors of regional CO2 emissions: Evidence from Beijing city, China. Appl. Energy 2012, 100, 277–284. [Google Scholar] [CrossRef]
  11. Geels, F.W.; Sovacool, B.K.; Schwanen, T.; Sorrell, S. Sociotechnical transitions for deep decarbonization accelerating innovation is as important as climate policy. Science 2017, 357, 1242–1244. [Google Scholar] [CrossRef]
  12. Dumont, B.; Groot, J.C.J.; Tichit, M. Review: Make ruminants green again—How can sustainable intensification and agroecology converge for a better future? Animal 2018, 12, 210–219. [Google Scholar] [CrossRef] [PubMed]
  13. Frenken, K.; Schor, J. Putting the sharing economy into perspective. Environ. Innov. Soc. Transit. 2017, 23, 3–10. [Google Scholar] [CrossRef]
  14. Tapscott, D. The Digital Economy: Promise and Peril in the Age of Networked Intelligence; McGraw-Hill: New York, NY, USA, 1996. [Google Scholar]
  15. China Academy of Information and Communication Research (CAICR). White Paper on the Development of China’s Digital Economy; CAICR: Beijing, China, 2020. (In Chinese) [Google Scholar]
  16. Bukht, R.; Heeks, R. Defining, conceptualising and measuring the digital economy development informatics. SSRN Electron. J. 2017, 13, 143–172. [Google Scholar]
  17. Zhang, W.; Liu, X.M.; Wang, D.; Zhou, J.P. Digital economy and carbon emission performance: Evidence at China’s city level. Energy Pol. 2022, 165, 112927. [Google Scholar] [CrossRef]
  18. Xu, X.C.; Zhang, M.H. Research on the scale measurement of China’s digital economy—Based on the perspective of international comparison. China Ind. Econ. 2020, 5, 23–41. [Google Scholar]
  19. Zhao, H.; Guo, S. A hybrid MCDM model combining Fuzzy-Delphi, AEW, BWM, and MARCOS for digital economy development comprehensive evaluation of 31 provincial level regions in China. PLoS ONE 2023, 18, e0283655. [Google Scholar] [CrossRef]
  20. Zhao, H.; Guo, S. Analysis of the non-linear impact of digital economy development on energy intensity: Empirical research based on the PSTR model. Energy 2023, 282, 128867. [Google Scholar] [CrossRef]
  21. Chen, L.; Lu, Y.; Meng, Y.; Zhao, W. Research on the nexus between the digital economy and carbon emissions-Evidence at China’s province level. J. Cleaner Prod. 2023, 413, 137484. [Google Scholar] [CrossRef]
  22. Haseeb, A.; Xia, E.; Saud, S.; Ahmad, A.; Khurshid, H. Does information and communication technologies improve environmental quality in the era of globalization? An empirical analysis. Environ. Sci. Pollut. Res. 2019, 26, 8594–8608. [Google Scholar] [CrossRef]
  23. Dong, F.; Hu, M.; Gao, Y.; Liu, Y.; Zhu, J.; Pan, Y. How does digital economy affect carbon emissions? Evidence from global 60 countries. Sci. Total Environ. 2022, 852, 158401. [Google Scholar] [CrossRef]
  24. Yi, M.; Liu, Y.; Sheng, M.S.; Wen, L. Effects of digital economy on carbon emission reduction: New evidence from China. Energy Policy 2022, 171, 113271. [Google Scholar] [CrossRef]
  25. Zhou, X.; Zhou, D.; Wang, Q.; Su, B. How information and communication technology drives carbon emissions: A sector-level analysis for China. Energy Econ. 2019, 81, 380–392. [Google Scholar] [CrossRef]
  26. Salahuddin, M.; Alam, K. Information and Communication Technology electricity consumption and economic growth in OECD countries: A panel data analysis. Int. J. Electr. Power Energy Syst. 2016, 76, 185–193. [Google Scholar] [CrossRef]
  27. Sun, Y.W.; Hu, Z.H. Digital economy, industrial upgrading and improvement of urban environmental quality. Statist. Decis. 2021, 37, 91–95. (In Chinese) [Google Scholar]
  28. Ding, Y.L.; Zhang, Z.N.; Zhang, W.L. Empirical study on information and communication technology and technological innovation—Based on digital economy. J. North China Univ. Sci. Technol. (Soc. Sci. Ed.) 2022, 22, 22–26. (In Chinese) [Google Scholar]
  29. Ren, S.; Hao, Y.; Xu, L.; Wu, H.; Ba, N. Digitalization and energy: How does internet development affect China’s energy consumption? Energy Econ. 2021, 98, 105220. [Google Scholar] [CrossRef]
  30. Li, Z.G.; Wang, J. How does the digital economy affect spatial carbon emissions under economic agglomeration? J. Xi’an Jiao Tong Univ. (Soc. Sci.) 2022, 42, 1–16. (In Chinese) [Google Scholar]
  31. Yilmaz, S.; Haynes, K.E.; Dinc, M. Geographic and network neighbors: Spillover effects of telecommunications infrastructure. J. Reg. Sci. 2002, 42, 339–360. [Google Scholar] [CrossRef]
  32. Liu, Q.; Wu, S.; Lei, Y.; Li, S.; Li, L. Exploring spatial characteristics of city-level CO2 emissions in China and their influencing factors from global and local perspectives. Sci. Total Environ. 2021, 754, 142206. [Google Scholar] [CrossRef]
  33. Godwin, M.; Mehmet, K.; Justus, H. Determinants of digitalization and digital divide in Sub-Saharan African economies: A spatial Durbin analysis. Telecommun. Pol. 2021, 45, 102224. [Google Scholar]
  34. Xu, Q.; Zhong, M.; Cao, M. Does digital investment affect carbon efficiency? Spatial effect and mechanism discussion. Sci. Total Environ. 2022, 827, 154321. [Google Scholar] [CrossRef] [PubMed]
  35. Kenny, C. The internet and economic growth in less-developed countries: A case of managing expectations? Oxf. Dev. Stud. 2003, 31, 99–113. [Google Scholar] [CrossRef]
  36. Zhu, H.L.; Wang, C.J. Digital economy leads high-quality development of industry: Theory, mechanism and path. Theory Pract. Financ. Econ. 2020, 41, 2–10. (In Chinese) [Google Scholar]
  37. Qin, J.; Liu, Y.; Grosvenor, R. Data analytics for energy consumption of digital manufacturing systems using Internet of Things method. In Proceedings of the 2017 13th IEEE Conference on Automation Science and Engineering (CASE), Xi’an, China, 20–23 August 2017; pp. 482–487. [Google Scholar]
  38. Vassileva, I.; Wallin, F.; Dahlquist, E. Understanding energy consumption behavior for future demand response strategy development. Energy 2012, 46, 94–100. [Google Scholar] [CrossRef]
  39. Wen, Z.; Zhang, L. The Test Procedure and Its Application of Mediating Effect. Acta Psychol. Sin. 2004, 36, 614–620. [Google Scholar]
  40. Zhao, F.; Luo, L. The impact of industrial agglomeration on urban carbon emissions in the Yangtze River economic belt: Heterogeneity and action mechanism. Reform 2022, 35, 68–84. [Google Scholar]
  41. Wu, J.; Guo, Z. Research on the convergence of carbon dioxide emissions in China: A continuous dynamic distribution approach. Stat. Res. 2016, 33, 54–60. [Google Scholar]
  42. Li, Z.; Wang, J. The dynamic impact of digital economy on carbon emission reduction: Evidence city-level empirical data in China. J. Clean. Prod. 2022, 351, 131570. [Google Scholar] [CrossRef]
  43. Zhu, W.J.; Chen, J.J. The Spatial Analysis of Digital Economy and Urban Development: A Case Study in Hangzhou, China. Cities 2022, 123, 103563. [Google Scholar] [CrossRef]
  44. Ding, C.; Liu, C.; Zheng, C.; Li, F. Digital economy, technological innovation and high-quality economic development: Based on spatial effect and mediation effect. Sustainability 2022, 14, 216. [Google Scholar] [CrossRef]
  45. Xue, Y.; Tang, C.; Wu, H.T.; Liu, J.M.; Hao, Y. The emerging driving force of energy consumption in China: Does digital economy development matter? Energy Pol. 2022, 165, 112997. [Google Scholar] [CrossRef]
  46. Gao, D.; Li, G.; Yu, J. Does digitization improve green total factor energy efficiency? Evidence from Chinese 213 cities. Energy 2022, 247, 123395. [Google Scholar] [CrossRef]
  47. Yu, B.; Fang, D.; Yu, H.; Zhao, C. Temporal-spatial determinants of renewable energy penetration in electricity production: Evidence from EU countries. Renew. Energy 2021, 180, 438–451. [Google Scholar] [CrossRef]
  48. Yao, X.; Zhang, X.; Guo, Z. The tug of war between local government and enterprises in reducing China’s carbon dioxide emissions intensity. Sci. Total Environ. 2020, 710, 136140. [Google Scholar] [CrossRef] [PubMed]
  49. Sun, Y.; Li, H.; Andlib, Z.; Genie, M.G. How do renewable energy and urbanization cause carbon emissions? Evidence from advanced panel estimation techniques. Renew. Energ. 2022, 185, 996–1005. [Google Scholar] [CrossRef]
  50. Pace, R.K.; Lesage, J.P. A sampling approach to estimate the log determinant used in spatial likelihood problems. J. Geogr. Syst. 2009, 11, 209–225. [Google Scholar] [CrossRef]
  51. Baron, R.M.; Kenny, D.A. The moderator-mediator variable distinction in social psychological research: Conceptual, strategic, and statistical considerations. J. Personal. Soc. Psychol. 1999, 51, 1173. [Google Scholar] [CrossRef]
  52. Preacher, K.J.; Hayes, A.F. SPSS and SAS procedures for estimating indirect effects in simple mediation models. Behav. Res. Methods Instrum. Comput. 2004, 36, 717–731. [Google Scholar] [CrossRef]
  53. Huang, Q.; Yu, Y.; Zhang, S. Internet development and productivity growth in manufacturing industry: Internal mechanism and China experiences. China Ind. Econ. 2019, 8, 5–23. [Google Scholar]
  54. Nunn, N.; Qian, N. US food aid and civil conflict. Am. Econ. Rev. 2014, 104, 1630–1666. [Google Scholar] [CrossRef]
Figure 1. The mechanism of the DE on CEs reduction.
Sustainability 17 06877 g001
Figure 2. The spatial distribution of CEI of 30 provincial regions of China in the years of 2013, 2017, and 2021.
Sustainability 17 06877 g002
Figure 3. Seventeen indicators employed to evaluate the DE.
Sustainability 17 06877 g003
Figure 4. The spatial distribution of DE in 30 regions of China in the years of 2013, 2017, and 2021.
Sustainability 17 06877 g004
Table 1. Descriptive statistic for all variables.
VariableUnitMeanStd. Dev.MinMax
CEICNY 1 million/100 tons3.95925.39290.585531.4710
DE-0.12760.08230.00160.4720
Real GDPCNY 1 trillion1.87801.54160.05357.7743
STI105 terms1.18981.61230.01109.8063
IS%1.37450.74290.66015.2332
ES%0.91830.48370.01322.5184
GOV%0.02200.01510.00540.0676
TRD%0.25290.26390.00761.3418
UR%0.60880.11460.37890.8960
ER%0.34850.18390.04240.6680
Table 2. Benchmark fixed effects regression results.
VariablesY = CEIY = CEIY = CEIY = CEI
DE−12.809 ***−13.262 ***−14.901 ***−14.632 ***
(−6.681)(−6.786)(−6.113)(−5.924)
ES 3.005 *3.013 *3.026 *
(−3.308)(−4.201)(−4.373)
GOV −4.301 *−5.275 *−5.547 *
(−3.878)(−4.010)(−4.132)
TRD −1.012−0.098
(−1.201)(−1.155)
UR 5.687 **4.388 **
(4.376)(4.002)
ER −1.153 *
(3.851)
Constant9.105 ***30.286 ***31.147 ***31.645 ***
(13.467)(4.631)(5.519)(6.509)
Year FEYESYESYESYES
Province FEYESYESYESYES
R-squared0.8680.8860.8930.912
Note: ***, **, and * represent significance at the 1%, 5%, and 10% levels, respectively. Figures in () indicate the standard errors.
Table 3. Moran’s index for CEI and DE.
YearCEIDE
MIp-ValueMIp-Value
20130.3210.0020.0980.102
20140.3570.0010.1320.090
20150.3290.0030.1450.089
20160.3320.0040.1460.083
20170.3430.0030.1520.079
20180.3260.0030.1430.072
20190.3250.0020.1520.051
20200.3180.0030.1610.044
20210.3290.0030.1630.045
20220.3270.0020.1580.044
20230.3280.0020.1600.045
Table 4. Regression results of spatial Durbin model.
VariablesMainWxLR DirectLR IndirectLR Total
DE−14.623 ***0.892−15.393 ***5.983 *−9.305 ***
(−6.312)(0.256)(−6.837)(1.895)(−2.968)
ES0.323 *0.531 *0.346 *0.312 *0.293 *
(−1.578)(1.686)(−1.672)(−1.713)(−1.689)
GOV−6.036 ***−9.163 ***−6.912 ***−9.132 ***−15.283 ***
(−3.897)(−4.312)(−4.493)(−5.012)(−6.334)
TRD−2.893 **−4.386 ***−1.567 **−2.889 **−4.032 ***
(−2.931)(−3.012)(−2.991)(−2.983)(−3.245)
UR0.343 *0.267 *0.361 *0.406 *0.372 *
(−2.875)(−2.797)(−2.838)(−2.873)(−2.779)
ER−0.096 *0.002−0.099 *−0.089 *−0.099 **
(−2.901)(0.015)(−2.788)(−2.989)(−3.301)
Year FEYESYESYESYESYES
Province FEYESYESYESYESYES
R-squared0.2860.2860.2860.2860.286
Note: ***, **, and * represent significance at the 1%, 5%, and 10% levels, respectively. Figures in () indicate the standard errors.
Table 5. Mediation effect regression results.
VariablesY = Real GDPY = STIY = ISY = CEIY = CEIY = CEI
DE0.497 ***0.512 ***0.301 *−13.301 ***−12.301 ***−13.102 ***
(−3.416)(−3.879)(−2.979)(−4.397)(−4.998)(−3.899)
Real GDP −3.697
(−1.901)
STI −5.679 ***
(−4.126)
IS −2.012 **
(−2.991)
ES0.301−0.209 *0.309 *3.096 ***0.0040.889 *
(0.802)(−2.796)(−2.836)(−4.012)(0.034)(−2.913)
GOV0.526 **0.312 *−0.687 *−2.978 **−2.937 ***−0.030
(−3.034)(−3.001)(−2.999)(−3.012)(−5.012)(1.003)
TRD0.332 **0.798 **0.401 *−1.089 *0.123−2.030 *
(−2.996)(−3.112)(−3.011)(−2.869)(1.053)(−2.997)
UR0.103 *0.1120.208 *1.030 *0.3022.012 *
(−2.578)(0.859)(−2.902)(−2.997)(0.879)(−3.001)
ER−0.568 *0.3730.102−2.301 *0.1030.011
(−2.779)(0.105)(1.034)(−2.889)(0.206)(0.978)
Constant−0.968 *30.937 *15.337 **6.887 *32.668 ***4.991 **
(−2.999)(−3.039)(3.357)(4.012)(6.798)(3.238)
Year FEYESYESYESYESYESYES
Province FEYESYESYESYESYESYES
R-squared0.9180.9290.9050.9260.7070.779
Note: ***, **, and * represent significance at the 1%, 5%, and 10% levels, respectively. Figures in () indicate the standard errors.
Table 6. Bootstrap testing results.
VariablesEffectsCoefficientz-Valuep-ValueConfidence Interval
Real GDPDirect effect−1.073−3.7980.003(−1.55, −0.15)
Indirect effect−0.937−4.0360.000(−1.23, −0.20)
STIDirect effect−2.373−2.9680.041(−3.06,−0.18)
Indirect effect−1.408−2.0350.030(−2.04, −0.16)
ISDirect effect−8.937−5.3180.000(−9.55, −5.15)
Indirect effect−3.012−4.3860.000(−4.02, −1.18)
Table 7. Regression results of regional heterogeneity.
VariablesEastern AreaMiddle AreaWestern Area
DE−2.012−2.033 ***−48.013 **−26.014 ***−57.366 ***−26.307 ***
(−1.083)(−3.038)(−3.351)(−6.332)(−6.782)(−3.819)
Wx−7.036 *** 36.281 −80.683 ***
(−4.627) (1.039) (−5.297)
LR Direct−0.833 −34.792 ** −49.283 ***
(−0.307) (−2.987) (−5.709)
LR Indirect−6.737 ** 35.728 −32.809 **
(−3.024) (1.303) (−3.012)
LR Total−7.637 ** −1.986 −72.039 ***
(−2.997) (−0.613) (−6.037)
ρ−0.327 *** 0.102 −0.638 ***
(−3.949) (1.013) (−7.025)
Control VariablesYesYesYesYesYesYes
R-squared0.4920.3300.5500.6980.0100.648
Note: ***, ** represent significance at the 1%, 5% levels, respectively. Figures in () indicate the standard errors.
Table 8. Robustness test results.
VariablesY = CEI
X = DIFI
Y = CEI
X = L.DIFI
Y = CE
X = DE
X−1.178 ***−1.182 ***−1.806 ***
(−6.309)(−6.256)(−6.319)
ES0.301 *0.331 *0.346 *
(−1.137)(−1.908)(−1.872)
GOV−3.036 ***−6.623 ***−7.831 ***
(−3.927)(−5.312)(−5.493)
TRD−1.992 **−2.839 ***−3.567 **
(−3.277)(−4.886)(−3.125)
UR0.313 **0.217 *0.331 *
(−3.875)(−3.011)(−2.768)
ER−0.196 *−0.003 *−0.089 *
(−2.801)(2.015)(−2.988)
Constant19.270 ***28.377 ***7.688 ***
(−6.268)(−7.319)(−4.399)
Year FEYESYESYES
Province FEYESYESYES
R-squared0.4860.4760.763
Note: ***, **, and * represent significance at the 1%, 5%, and 10% levels, respectively. Figures in () indicate the standard errors.
Table 9. Endogenous test results.
Variables2SLSregression Model 1Model 2
X−1.033 ***−1.193 ***
(−5.112)(−5.603)
ES 0.301 *
(−2.708)
GOV −5.313 ***
(−4.932)
TRD −2.734 ***
(−4.906)
UR 0.215 *
(−3.135)
ER −0.002 *
(1.056)
Constant 14.867 ***
(−6.194)
Kleibergen-Paap rk LM statistics2.438
0.162
16.835
0.000
Hansen J statistics2.736
0.082
2.437
0.082
R-squared0.9960.0.957
Note: ***, and * represent significance at the 1%, and 10% levels, respectively. Figures in () indicate the standard errors.
Disclaimer/Publisher’s Note: The statements, opinions and data contained in all publications are solely those of the individual author(s) and contributor(s) and not of MDPI and/or the editor(s). MDPI and/or the editor(s) disclaim responsibility for any injury to people or property resulting from any ideas, methods, instructions or products referred to in the content.

