Article

Complement or Crowd Out? The Impact of Cross-Tool Carbon Control Policy Combination on Green Innovation in Chinese Cities

Collaborative Innovation Center for Resource-Based Economy Transformation, Shanxi University of Finance and Economics, Taiyuan 030006, China
*
Author to whom correspondence should be addressed.
Sustainability 2025, 17(15), 6881; https://doi.org/10.3390/su17156881
Submission received: 31 May 2025 / Revised: 11 July 2025 / Accepted: 15 July 2025 / Published: 29 July 2025

Abstract

In order to fulfill the commitment to the “dual carbon goal” at an early date, China has implemented a series of carbon control policies. However, the actual impact of these policy combinations on green innovation in Chinese cities remains unknown. Taking the implementation of the low-carbon pilot policy (LCP) and the carbon emission trading pilot policy (CET) as the research opportunity, this paper uses panel data from 276 prefecture-level cities and a multiple-period difference-in-differences (DID) model to explore the impact of carbon control policy combination on green innovation in China and their mechanisms. The results indicate the following: A single LCP or CET can significantly boost green innovation. However, the impact of cross-tool carbon control policy combination on green innovation is notably greater than that of a single policy, with a trend of increasing effectiveness over time. Even after a series of robustness tests, this conclusion remains valid. Heterogeneity analysis shows that the promotion effect is more significant in the eastern region and high-level administrative cities. The policy combination incentivizes green innovation through fiscal technology expenditure and public environmental awareness, focusing more on fostering strategic green innovation. Consequently, the Chinese government should tailor policy combinations to specific contexts, expand their implementation judiciously, and consistently drive forward green innovation.

1. Introduction

Faced with increasingly severe climate issues, controlling and reducing greenhouse gas emissions has become a global consensus among countries [1]. As one of the world’s largest carbon emitters, China actively participates in international environmental protection affairs and has taken a series of specific actions. During the general debate of the 75th session of the United Nations General Assembly, Chinese President Xi Jinping emphasized that the Paris Agreement, in addressing climate change, represents the overarching direction for a global green and low-carbon transformation. It is the minimum action required to protect our planet. Countries must take decisive steps. China will enhance its nationally determined contributions, implement more robust policies and measures, and aim to achieve peak carbon dioxide emissions before 2030, striving for carbon neutrality before 2060. In order to achieve these ambitious goals, the Chinese government has implemented a series of proactive carbon control policies, including a low-carbon pilot policy, carbon emission trading pilot policy, and emission trading pilot policy [2]. These policies not only help to reduce China’s carbon emissions but also provide important demonstrations and leadership for global climate change mitigation.
As a “testing ground” for carbon control policies, pilot cities adhere to development concepts such as innovation, coordination, greenness, and sharing in the construction process, aiming to achieve the dual goals of reducing pollution emissions and promoting urban innovation. Consequently, environmental policies and urban innovation have garnered extensive attention from both governmental authorities and academic scholars. Most scholars believe that carbon control policies can promote enterprise innovation, drive the development and application of clean technologies, and thus promote the transformation and upgrading of related industries. Under the pressure of carbon emission control, companies actively seek technological innovation and industrial upgrading, promoting the development of the green economy [3]. Conversely, some scholars argue that carbon control policies may increase companies’ operating costs, thereby reducing their profitability [4,5], which could lead to a reduction in R&D and innovation investment, thus inhibiting the development of innovation activities. In addition, the scope of policy pilots, the intensity of default penalties, government intervention, etc., will also have an impact on the innovation activities of enterprises [6]. It can be observed that, despite the substantial body of existing research, there are significant discrepancies in the conclusions, with some findings potentially even being mutually contradictory. The causes of this issue may be multifaceted. However, an important reason lies in the fact that the environmental policy in these studies is predominantly singular and isolated in nature. The study of singular policies often analyzes the effects of a specific policy in isolation, neglecting the synergistic or compensatory interactions among various policy instruments, thereby failing to capture the interactive effects of policies [7]. The significant disparities in economic levels, resource endowments, and environmental carrying capacities across different regions render singular policies inadequate in addressing differentiated needs. Policy combinations, through the interplay of multiple tools, can effectively reconcile innovation incentives with environmental constraints [
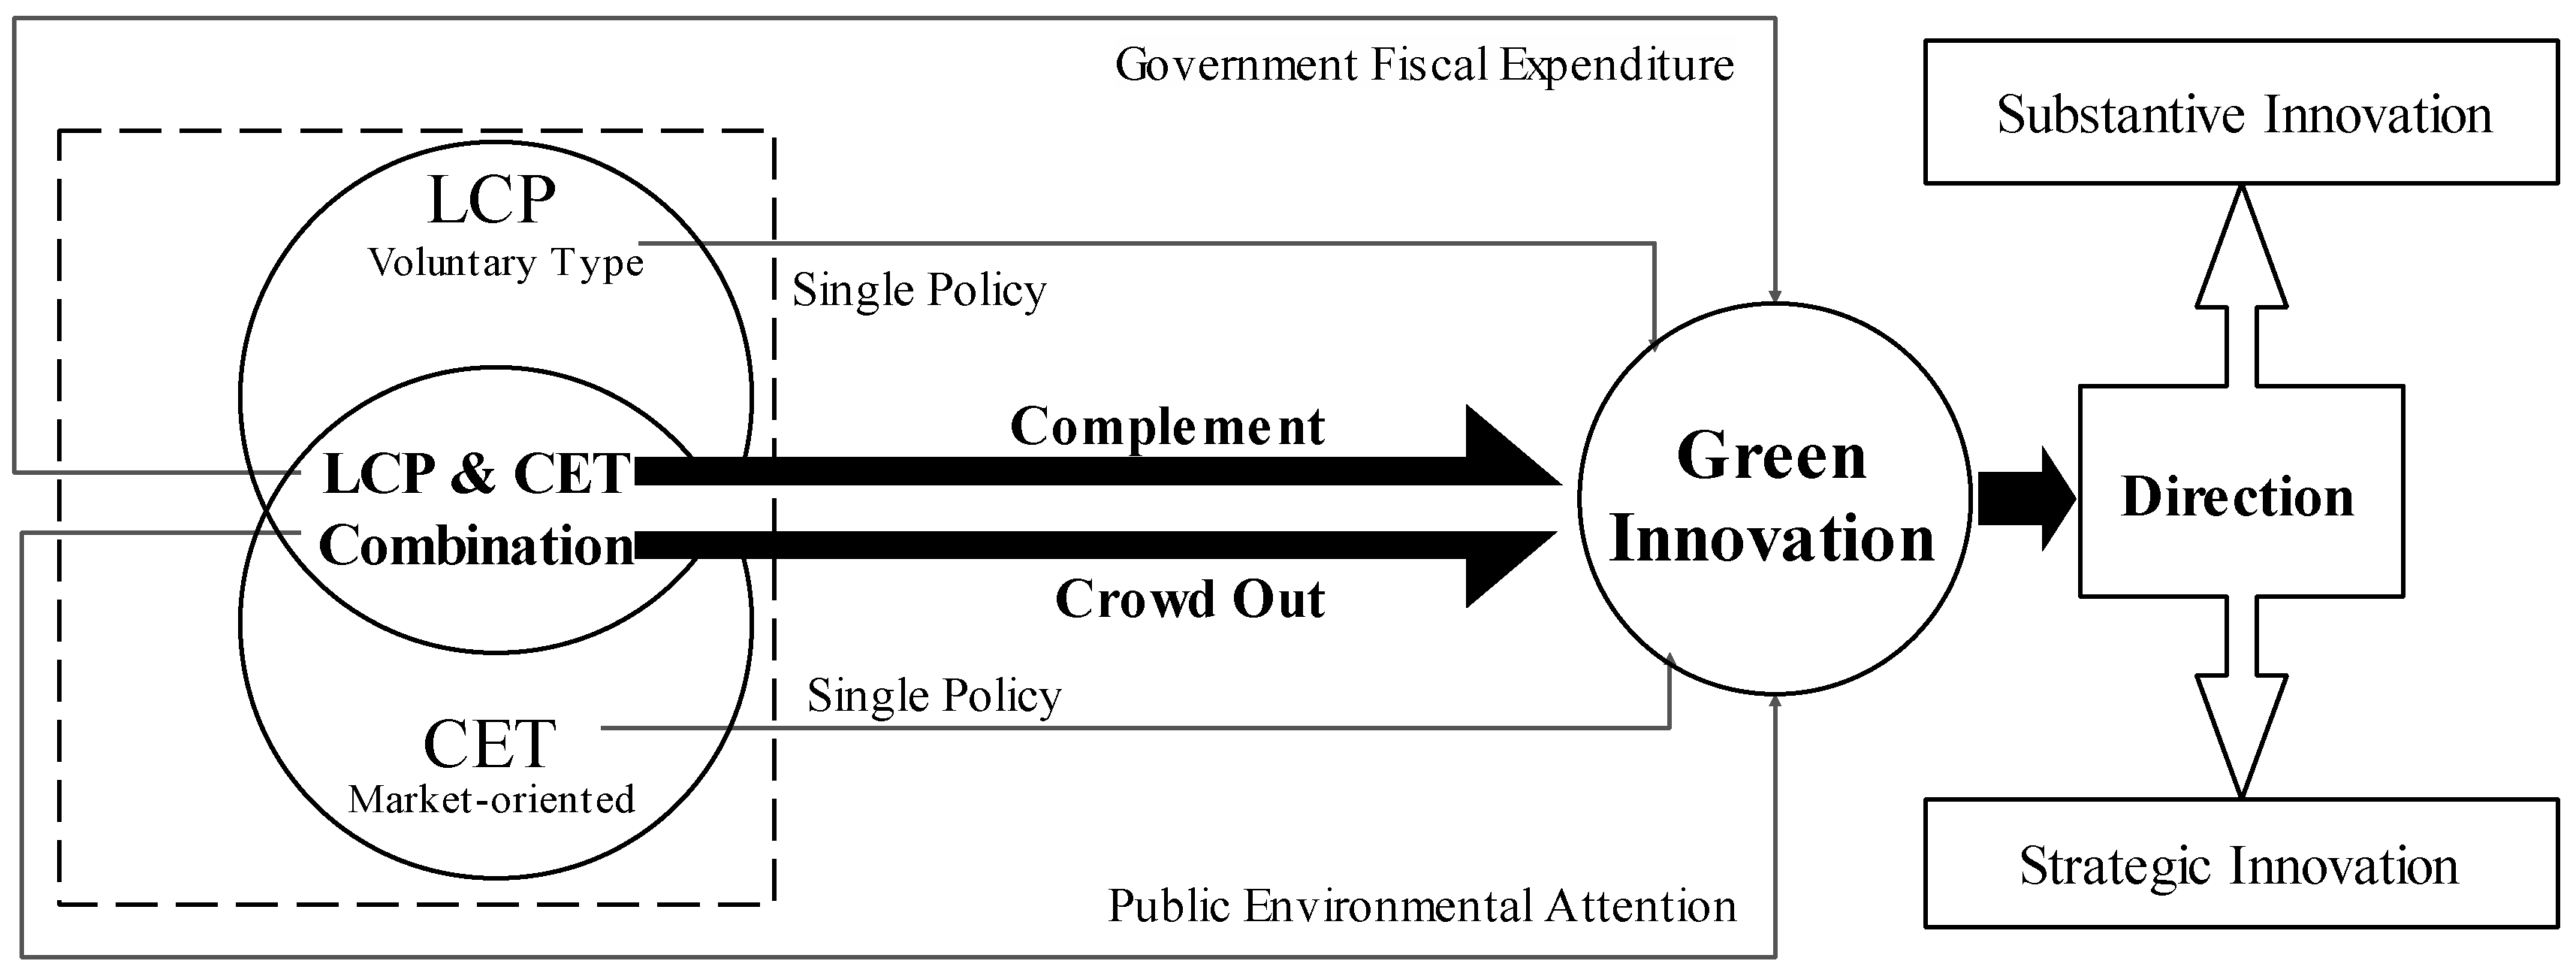
8]. Furthermore, policy combinations can facilitate the coordination of competition and cooperation among enterprises, amplifying the effects of technological spillovers. In addition, through multidimensional regulation, combined policies can mitigate the negative impacts of policy fluctuations on innovation.
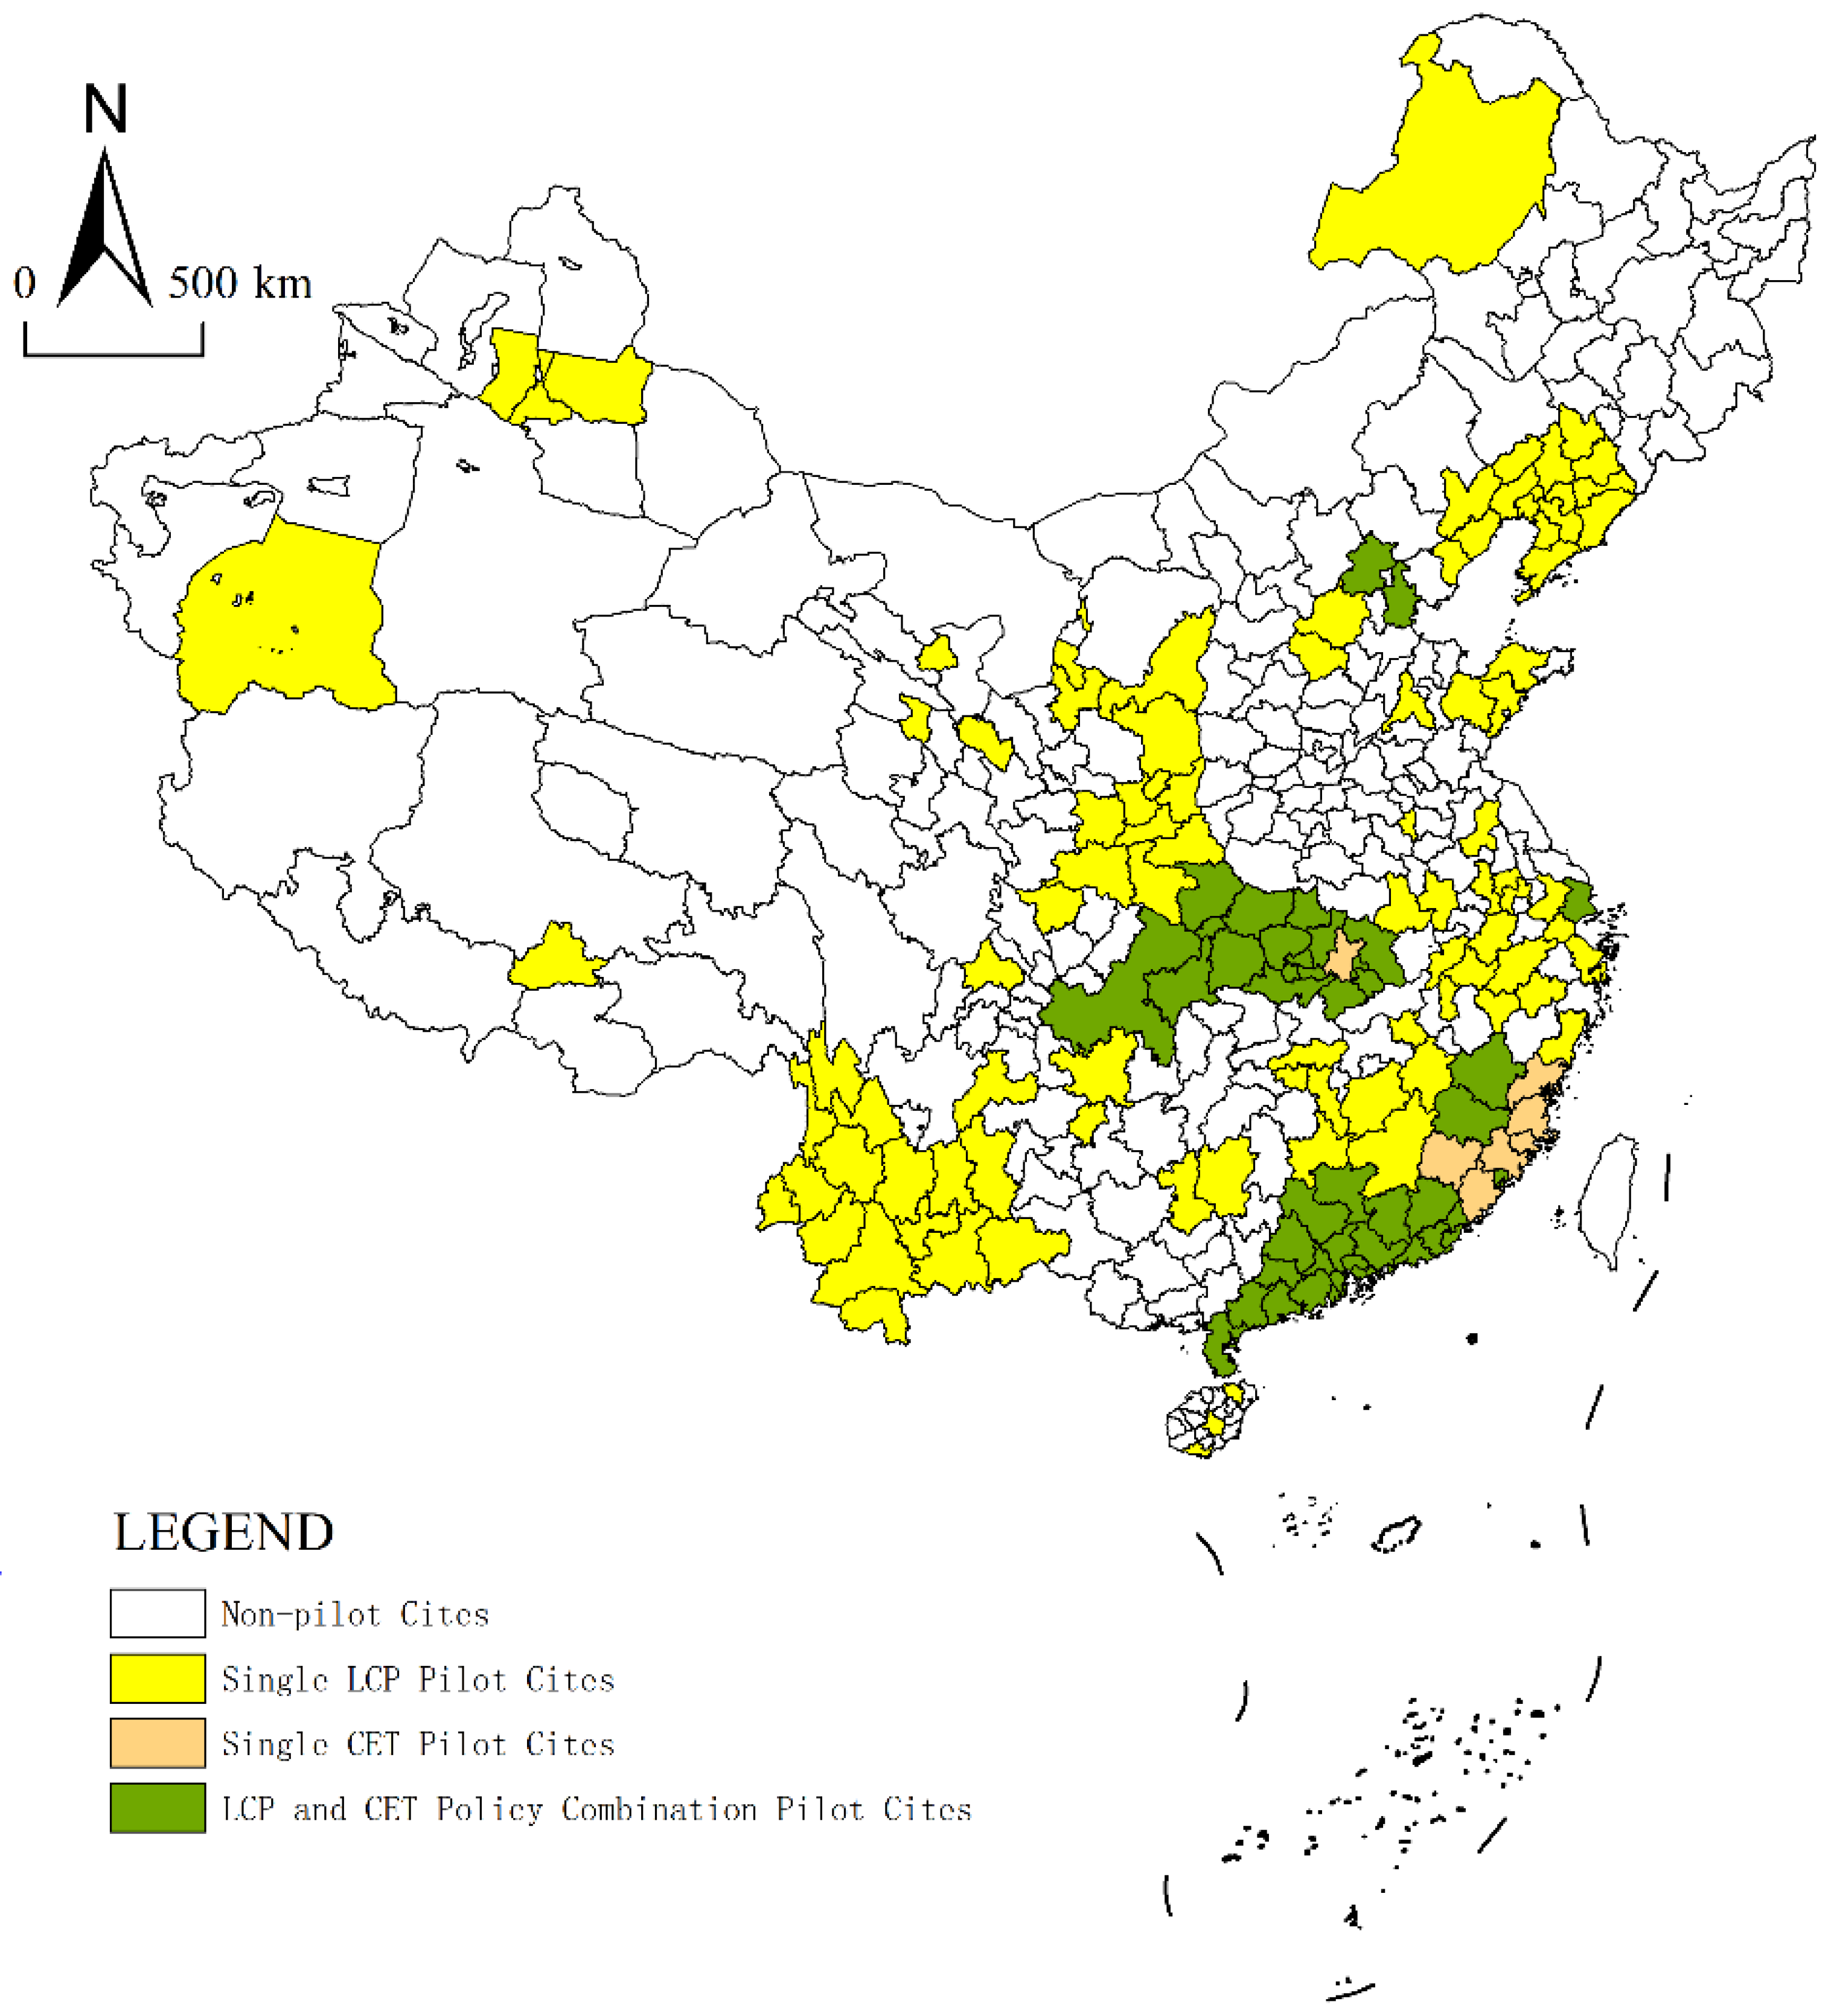
It is noteworthy that China’s carbon control policies do not operate in isolation but rather intersect and influence one another. Together, they constitute a comprehensive package of environmental-protection measures. (Since 2011, the Chinese government has implemented a series of environmental policies in the field of ecological environment, such as the carbon emission trading pilot policy (CET), the environmental protection law (EPL), the low-carbon city pilot policy (LCP), and the new energy vehicle pilot city policy (NEVP). This series of policies together form the “combination punch” of China’s government environmental protection system) Therefore, when studying the effectiveness of carbon control policies, it is necessary to consider the effects of policy combinations. The increasing emphasis on policy combinations arises from the difficulty that singular policy instruments often face in achieving the desired policy outcomes [9]. Policy combinations are designed to address issues of market failure and government dysfunction, compensating for and enhancing the shortcomings of individual policy tools while improving efficiency and equity [10]. However, it is important to note that policy combinations may not always be wholly effective. The interactions between different policies can be complementary, competitive, or neutral [11,12,13]. When various policy instruments are not well coordinated, there may be crowding-out effects, leading to policy confusion [14]. Conversely, if the objectives of policy combinations are well coordinated, complementary effects can be achieved, potentially achieving a multiplier effect of policy effects [15]. Therefore, some scholars do not recommend conducting simple single-policy evaluations but instead encourage the analysis of possible interactions between policy combinations [16]. The interaction of policy combinations is crucial for understanding the effectiveness of policies [17]. However, previous analyses of policy combinations have focused on command and market tools, while our research advances literature on cross-tool policy collaboration between the voluntary LCP and market-based CET. This dual tool combination addresses a key gap: existing work either views policies as isolated tools [18,19] or studies homogeneous policy combinations [20], ignoring the unique interactions between behavioral incentives (LCP) and market signals (CET). This distinction is crucial: voluntary policies (LCP) establish social legitimacy, while market instruments (CET) enforce efficiency discipline, creating a new synergy that neither type can achieve alone. Therefore, we focus on the cross-tool control carbon policy combination of the LCP and CET as the research object to analyze its impact on green innovation in Chinese cities and attempt to answer the following questions: (1) Can single LCP or CET carbon control policies promote green innovation? (2) Is the impact of the cross-tool control carbon policy combination on green innovation complementary or crowding out? (3) Does the policy combination effect vary with characteristics such as geographical location and urban administrative level? (4) Does the policy combination lean towards substantive innovation or strategic innovation?
The marginal contributions are as follows: First, most existing research on environmental regulation only explores the effects of a single policy, with little consideration of policy combination effects, which may contribute to inconsistencies in research findings. This study explores green innovation from the perspective of cross-tool policy combinations, comparing the differing impacts of a single policy versus policy combinations, thereby enhancing the relevant research within the field of environmental policy. Second, different geographical locations, old industrial bases, transportation efficiency, and city administrative levels can also affect policy implementation effectiveness. This paper explores the impact of heterogeneity on the policy combination. Third, this paper clarifies and validates the underlying mechanisms between policy combination and green innovation. Finally, under the pressure of policy combination, we also discuss issues related to the direction of enterprise green innovation.

2. Literature Review

2.1. LCP and Green Innovation

Current research on the correlation between LCPs and green innovation is predominantly categorized into macro and micro perspectives. However, there remains a lack of consensus within the academic community regarding their interrelationship. At the macro level, most scholars suggest that LCPs effectively stimulate green innovation. Chen et al. [21] demonstrates that LCPs can notably boost green technological innovation in specific regions and resource-abundant urban areas. Through strategic fund allocation and structural enhancements, LCPs serve as incentives for green innovation initiatives. Zou et al. [22] indicate that LCPs contribute to enhancing overall technological innovation in cities, particularly emphasizing their significant role in fostering green innovation. Nonetheless, divergent viewpoints exist among scholars. Tian et al. [23] contend that while LCPs may hinder non-green innovation in urban areas, they do not significantly affect green innovation. At the micro level, some studies indicate that LCP effectively stimulate the level of green technological innovation among enterprises in pilot cities [24]. Conversely, other research suggests that LCPs promote an increase in the quantity of green technological innovations among enterprises but may compromise the quality of such innovations [25].

2.2. CET and Green Innovation

In examining the influence of CETs on green innovation, numerous scholars have conducted substantial empirical studies. Some researchers have focused on the EU Emissions Trading System and the Korean Emissions Trading Scheme to investigate the impact of carbon emissions trading markets on innovation [26,27]. Research outcomes suggest that these policies have limited stimulating effects on innovation and do not significantly foster the advancement of green innovation. In a study by Mo and management [28], analyzing the interplay between innovation activities of enterprises under the Korean Emissions Trading Scheme and carbon emissions, it was observed that the trading scheme exerts a certain adverse influence on the innovation drive of enterprises. In contrast, Borghesi et al. [29] analyzed data from the 2006–2008 Community Innovation Survey to examine the impact of the Italian carbon emissions trading system on innovation. The findings suggest that it exerts a certain promotional effect on innovation, albeit with potential regional variations. According to Zhang et al. [30], CETs play a positive role in promoting green innovation, with more favorable outcomes observed in less competitive markets compared to highly competitive ones.

2.3. Policy Combination and Green Innovation

The concept of policy combinations originates from economic policy debates, indicating interdependencies among policies [31]. Within environmental policy research, scholars have increasingly recognized the significance of policy combinations [32]. Studies suggest that the synergistic effect of combining carbon taxes with coal capacity reduction policies surpasses that of individual policies [33]. Research on waste recycling policies in India has demonstrated that integrated policy combinations are more effective in addressing waste management challenges than standalone policies [34]. However, in the practical implementation of policy combinations, their impacts may either reinforce or conflict with each other. Existing literature has also delved into the green innovation effects of policy combinations. Some researchers have observed that policies driven by market demand, when combined with technology-focused policies, can effectively complement each other, leading to a more robust promotion of green innovation [35]. However, an overabundance of policy combinations may greatly diminish their efficacy [36]. Another study suggests that the amalgamation of environmental and innovation policies is less effective than standalone policies, potentially resulting in policy conflicts, particularly evident in cities with lower administrative levels and lacking high-speed rail connections, where this effect is more pronounced [15]. However, there is a scarcity of research literature on cross-tool policy combinations involving market-driven incentives and voluntary participation policies. Consequently, this paper opts to combine the LCP and CET to investigate the impact of cross-tool carbon control policy combinations on green innovation.

3. Background and Hypotheses

3.1. Policy Background

In order to explore a low-carbon development plan tailored to its own needs, the NDRC has successively implemented the LCP in six provinces and 81 cities and counties. The initial phase of pilots commenced in 2010, employing a “top-down” and “designated” model, conducting pilot programs in five provinces, namely Guangdong, Hubei, Shaanxi, Yunnan, and Liaoning, and eight cities including Tianjin, Hangzhou, Xiamen, and Shenzhen. Subsequently, the second phase of pilots was initiated in 2012, utilizing a “top-down” and “declaration + selection” framework, selecting the entire province of Hainan and 28 other cities including Beijing. In 2017, following a similar approach, the cities of Nanjing, Hefei, and 45 others were designated as the third wave of pilot cities (Figure 1). The LCP initiative aims to establish a more robust low-carbon development framework, optimize energy utilization systems, establish a low-carbon industry ecosystem, advance the management of low-carbon urban–rural development, promote the research and application of low-carbon technologies, and foster a low-carbon lifestyle and green consumption model. This program serves as a guiding example for nationwide low-carbon development efforts.
To mitigate the impact of global warming on human life and the environment, the “Kyoto Protocol” proposed treating “carbon dioxide emission rights” as tradable commodities to reduce carbon emissions. By 2013, Shenzhen, Shanghai, Beijing, Guangdong, Tianjin, and five other provinces and cities had formally launched the CET. Furthermore, Hubei and Chongqing have also joined the pilot program. Subsequently, in 2016, the CET expanded to include Fujian Province (Figure 1). The initiation of online trading in the national CET market in 2021 (limited to the electricity sector), signifies China’s progression towards becoming the world’s largest CET market. The difference between China’s CET and the EU and the United States is that the EU CET requires each member state to submit a carbon emission allocation plan, which is approved by the European Commission to determine the total quota and then allocated by each country to its own enterprises. The CET in the United States is mainly piloted at the state level, with quota allocation centered around auctions and the establishment of price reserve accounts to stabilize market fluctuations and avoid carbon price failures. China’s CET first determines the total carbon emission target for a certain period of time through government departments and then divides the total amount into several specific credit quotas, which are allocated to enterprises that need to reduce emissions through free distribution. Enterprises can trade carbon credit quotas in the market.

3.2. Research Hypotheses

3.2.1. LCP/CET and Green Innovation

Under the constraints of the LCP, the government will reduce the pursuit of economic development at the expense of the environment [35]. At the same time, the LCP can attract foreign investment and promote green innovation [37]. The LCP can facilitate the emergence of inter-regional competition in emission reduction, encouraging local governments to incentivize corporate innovation through subsidies, tax incentives, and other measures. Furthermore, the LCP enhances public awareness of low-carbon practices through a carbon-inclusive mechanism, thereby generating social supervisory pressure that indirectly promotes the establishment of a green corporate image and investment in technology by enterprises.
The CET will constrain the pollution emissions of enterprises. If enterprises continue to use their original production techniques, they can only meet government requirements by purchasing excess emission rights or reducing production, which will lead to a decrease in profits and a weakening of competitiveness. The CET makes the cost of carbon emissions explicit through market pricing mechanisms, compelling enterprises to internalize environmental externalities. In order to reduce compliance costs, companies tend to invest in the research and development of low-carbon technologies (such as clean energy and carbon capture), thereby promoting green innovation. Therefore, under the CET, the profit-seeking instinct of enterprises will drive them to continuously increase investment in technological innovation to improve production processes, thereby promoting green innovation [38]. Based on this, we put forward the following hypothesis:
Hypothesis 1. 
Single LCPs or CETs have a positive stimulative effect on green innovation.

3.2.2. Cross-Tool Control Policy Combination and Green Innovation

Combining different policies can lead to either complementary effects or crowding-out effects. Complementary effects arise when the total benefits generated by combining two or more policies surpass the benefits of a single policy [39]. Market failures can result in externalities, which policy tools can effectively mitigate. Enterprises face dual information asymmetry in green technology innovation. On one hand, the government struggles to monitor actual emission data; on the other hand, enterprises find it challenging to predict the returns on technological pathways. Policy combinations reduce transaction costs through a multidimensional signaling mechanism. For instance, market incentive policies such as carbon markets provide explicit price benchmarks, while voluntary participation policies like green certification convey implicit signals regarding technological capabilities. The synergistic effect of these two mechanisms can mitigate strategic manipulation by enterprises. Given the dual externalities associated with green innovation, employing a variety of policy tools may be necessary to address these externalities when promoting green innovation [40].
China’s LCP and CET constitute a “voluntary-market hybrid” carbon governance policy combination. Implemented as a cross-instrument regulatory approach across multiple cities, this combination addresses various market failures. As a voluntary environmental regulation tool, the LCP establishes benchmark cases to create replicable “technology-policy” templates, thereby reducing the knowledge acquisition costs for non-pilot regions and mitigating the insufficient incentives resulting from the spillover of innovative outcomes. Conversely, as a market-based policy, the CET internalizes environmental negative externalities into the production costs of enterprises through carbon pricing signals. However, due to the limited resources and capacities of local governments, they may struggle to adequately address the pressures of multiple external factors. Implementing multiple policies from higher authorities without effective coordination can result in policy displacement effects [41]. Additionally, the unclear boundaries of policy combinations may hinder the coordination of policy objectives [42]. Therefore, given the dual pressures of the LCP and CET, the ability of local governments to effectively coordinate carbon control policy combinations is crucial for promoting urban green innovation. Based on this, we put forward the following hypotheses:
Hypothesis 2a. 
The cross-tool carbon control policy combination has complementary effects on green innovation.
Hypothesis 2b. 
The cross-tool carbon control policy combination has crowding-out effects on green innovation.

3.2.3. Fiscal Technology Expenditure and Public Environmental Awareness

Carbon control policies inevitably influence the operational development of businesses, primarily through increased operating costs. The increase in fiscal technology expenditure helps alleviate the cost pressure on enterprises and enhances their enthusiasm for green innovation. Fiscal technology expenditures enhance corporate innovation motivation by reducing the marginal costs and uncertainties associated with research and development activities. Additional funding also enables companies to upgrade technologies and enhance production processes, driving advancements in green technology. The increase in fiscal technology expenditure can also support and motivate researchers to innovate, leading to faster technological advancements.
As a cross-tool carbon control policy combination, the implementation of the LCP and CET is certain to draw extensive attention from the public. Heightened environmental awareness will lead the public to reject and resist enterprises that neglect their environmental responsibilities. The public’s opinion pressure, formed through channels such as environmental petitions and public interest litigation, significantly enhances the intensity of government regulation. To cultivate a positive societal image, businesses are inclined to leverage green technologies to gain a competitive edge. According to Klemetsen et al. [43], in a free-market economy, the profit-driven nature of capital and the established technological pathways of enterprises create a natural bias against clean technologies. Therefore, relying solely on market mechanisms is insufficient to drive technological advancements towards sustainability. In such scenarios, public oversight becomes crucial to effectively incentivize the innovation of green technologies. Based on this, we put forward the following hypotheses:
Hypothesis 3a. 
Carbon control policy combination influence green innovation through fiscal technology expenditure.
Hypothesis 3b. 
Carbon control policy combination influence green innovation through public environmental awareness.

3.2.4. Substantive Innovation and Strategic Innovation

From the perspective of corporate motivation, environmental regulations do not necessarily promote all types of innovation but rather exhibit bias. The impact of environmental regulations on corporate innovation behavior is not a unidirectional linear relationship; rather, it may stimulate both substantive innovation and strategic innovation through multiple mechanisms. This differentiation arises from the interplay of the attributes of policy instruments, the heterogeneity of corporate motivations, and the dynamics of the market. Based on the perspective of patents, the research literature has found that corporate innovation behavior measured by patent applications sometimes manifests as a strategic behavior [44]. This suggests that corporate “innovation” may primarily serve as a managerial strategy, rather than a genuine effort to enhance the company’s technological competitiveness. Corporate innovation is often driven by the pursuit of specific benefits, leading to a tendency to align with government policies and regulations. Jiang et al. [45] pointed out that voluntary environmental regulations (such as environmental certification) drive companies to engage in strategic innovation through reputation incentives and legitimacy building, which focuses more on regulatory compliance rather than technological breakthroughs. For example, companies may use green patent packaging to enhance their brand image, but actual technological improvements are limited. Based on this, we put forward the following hypothesis:
Hypothesis 4. 
Compared to substantive green innovation, the combination of carbon control policies is more inclined to promote strategic green innovation.
Figure 2 illustrates the hypothetical framework of our study.

4. Research Design

4.1. Models and Methods

As a quasi-experimental design method, the DID method is commonly employed to evaluate the effects of policies or interventions. Its fundamental premise lies in comparing the changes over time between the treatment group (the population affected by the policy) and the control group (the population not affected by the policy) before and after the implementation of the policy, thereby isolating the net effect of the policy [46]. Through its quasi-natural experimental design, difference-in-differences control, and dynamic analytical capabilities, DID has emerged as a mainstream method for assessing environmental policies. Considering the significant variations in the pilot areas and implementation timelines of China’s LCP and CET policies, traditional DID models may not be applicable; thus, a multi-period DID model is warranted [47]. The multi-period DID model allows for the implementation of policies at different points in time across various regions, aligning more closely with the complexities of phased and multi-batch policy implementation in practice. Additionally, the multi-period DID model, by employing flexible temporal and individual fixed effects, enables more precise identification of the net effects of policy combinations, making it particularly suitable for evaluating long-term and multi-stage environmental policy combination in China. The model specifications are as follows:
G I i t = α 1 + β 1 D i t L C P + β 2 C o n t r o l i t + μ i + σ t + ε i t
G I i t = α 1 + β 1 D i t C E T + β 2 C o n t r o l i t + μ i + σ t + ε i t
G I i t = α 1 + β 1 D i t L C P + C E T + β 2 C o n t r o l i t + μ i + σ t + ε i t
where i denotes the city and t signifies time, and GI serves as the dependent variable representing urban innovation. D i t L C P ,   D i t C E T , and D i t L C P + C E T correspondingly stand for dummy variables indicating the LCP, CET, and combined LCP and CET. A value of 1 is assigned if region i is part of the policy pilot in year t; otherwise, it is 0. Control encompasses a series of variables that could potentially influence urban green innovation; μ i and σ t denote individual and time fixed effects, respectively; ε i t represents the random error term. The parameters α 1 represents the intercept term of the model. β 1 denotes the regression coefficient, which corresponds to the treatment effect estimated by the DID method and is used to capture the net effect of the policy intervention.

4.2. Variable Selection

Dependent variable: green innovation (GI). GI refers to the practice of advancing sustainable development through innovations in technology, products, processes, or management models, with the objective of reducing negative environmental impacts. Its core focus is on minimizing resource consumption and pollutant emissions, while promoting a circular economy. The World Intellectual Property Organization (WIPO) launched a tool in 2010 aimed at facilitating the retrieval of patent information related to environmentally friendly technologies, known as the “International Patent Classification Green Inventory”. According to the United Nations Framework Convention on Climate Change, this tool categorizes green patents into seven subcategories: alternative energy production, transportation, energy conservation, waste management, agriculture and forestry, administrative supervision and design, and nuclear energy, which provides the possibility for accurately identifying and tracking green technological innovations at the city level. Based on the classification numbers of IPC green inventory, we retrieved the number of green patent applications in various cities as a basic indicator to measure green technology innovation.
Core explanatory variables carbon control policies, including single LCP ( D L C P ), single CET ( D C E T ), and the policy combination of LCP and CET ( D L C P + C E T ). Carbon control policies are regulations, economic instruments, or technological promotion measures established by governments or international organizations to reduce carbon emissions and address climate change, with the aim of facilitating a low-carbon transition. These variables are all dummy variables, specifically, they are the product of time dummy variables and region dummy variables. After policy implementation, the time dummy variable takes a value of 1; otherwise, it takes a value of 0. If the region belongs to the pilot area, the region dummy variable takes a value of 1; otherwise, it takes a value of 0.
In addition, we also selected 5 control variables, including economic development (PGDP), foreign direct investment (FDI), government intervention (GVI), human capital (HC), and urbanization (UB). Among them, economic development is represented by the per capita GDP of each region. Foreign direct investment is represented by the ratio of actual foreign direct investment to local GDP. PGDP represents the scale of regional economies and the capability of resource allocation, which is characterized by the per capita GDP of various regions. FDI reflects the effects of technological spillovers and market competition pressures, influencing green innovation through technology transfer. FDI is represented by the proportion of actual utilized foreign capital to the local GDP. GVI measures the intensity of policy support, including direct intervention methods such as subsidies to promote innovation. The degree of GVI is characterized by the proportion of local government fiscal expenditure to the GDP of the current year. HC represents the level of education, determining the capacity for technology absorption and research and development. HC is represented by the proportion of students with a college degree or higher to the total population. UR represents the degree of aggregation, with agglomeration effects promoting knowledge spillovers and the diffusion of green technologies. UR is characterized by the proportion of urban population to the total population in various regions.
Furthermore, fiscal technology expenditure (FTE) and public environmental awareness (PEA) were selected as instrumental variables. Fiscal technology expenditure is represented by the natural logarithm of per capita government technology expenditure. Public environmental awareness is represented by the natural logarithm of the annual average Baidu search index for “haze” (both mobile and PC search volumes). Variables, symbols, definitions, and descriptive statistics are shown in Table 1.

4.3. Data Sources

To ensure the scientific rigor and accuracy of this research, we excluded cities that were merged or newly established after 2012 during the selection of urban samples, thereby ensuring the continuity of administrative divisions. Additionally, cities with excessive missing values for key variables were also removed to guarantee the integrity of the research data. Ultimately, we selected 276 cities in China from 2003 to 2022 as the research sample. The number of green patent applications and the number of green invention patent grants are derived from the Green Patent Database of CNRDS [48]. and WIPO [49], while the remaining data mainly come from the “China Urban Statistical Yearbook” and the China Economic Network statistical database.

5. Results and Discussion

5.1. Benchmark Regression

Table 2 reports the baseline regression results of carbon control policies on green innovation. Models (1)–(3) represent the estimated effects of the single LCP, the single CET, and the policy combination of LCP and CET on green innovation when no control variables are included. It can be seen that the carbon control policy coefficients in each model are significantly positive at the 1% level. On this basis, we incorporate control variables into the model constructed above. From models (4) and (5), it can be seen that the coefficient of carbon control policy has decreased but remains significantly positive at the 1% level, indicating that single LCPs or CETs do promote green innovation, thus verifying Hypothesis 1. On the one hand, LCP can attract investment for green innovation research and development [50], promoting green innovation. On the other hand, the implementation of the CET will compel enterprises to continuously increase innovation investment to improve production processes and stimulate green innovation [51].
In addition, we can also see that the coefficient of D C E T (1.063) is greater than the coefficient of D L C P (0.725), which indicates that the CET has a greater promoting effect on green innovation than the LCP. The CET belongs to market incentive policies, while the LCP belongs to voluntary participation policies. Market incentive policies have stronger constraints on enterprises, and the innovation willingness generated for cost reduction is also greater out of profit-seeking instinct; thus, the impact on green innovation is also broader. The CET more effectively stimulates corporate innovation motivation through market mechanisms, rigid constraints, and synergistic effects [52,53], whereas the LCT has a relatively weaker impact due to its singular incentive tools and limited coverage [53]. As a market signal, the carbon price can dynamically reflect the costs of emissions reduction, prompting enterprises to adjust their production structures. During the second compliance period of China’s carbon market, the carbon price increased by 66%, leading to a 50% rise in the proportion of participating enterprises and a simultaneous increase in the number of green patent applications [54].
By comparing the carbon control policy coefficients in model (6) with models (4) and (5), it is evident that the policy combination exhibits a more significant promotional impact on green innovation than individual pilot policies, confirming Hypothesis 2a. While some studies suggest potential mutual crowding-out effects from policy combination, the synergy between the CET and LCP, as a cross-tool policy combination, allows for mutual complementarity, leading to enhanced cooperative effects. In addition, the study by [9] indicates that the impact of environmental policy combinations on renewable energy innovation is more significant than that of individual policies, further corroborating the research findings.
By comparing model (6) with models (4) and (5), we can find that the policy combination has a significantly greater effect (coefficient of 1.221, significant at the 1% level) on promoting green innovation than the effect of single policy, thus supporting Hypothesis 2a. While some studies suggest that policy combinations may lead to crowding out effects, the policy combination of the LCP and CET can complement each other’s shortcomings and generate better synergistic effects. Additionally, Lee et al. [55]’s research also suggests that synergistic policy combinations have better effects than single policies, which supports our conclusions.

5.2. Parallel Trends and Dynamic Effects

The parallel trend test requires that carbon control policy combinations have similar time trends in green innovation between pilot and non-pilot areas before policy implementation. Figure 3 shows the changing trends in green patent applications between pilot and non-pilot areas cities. The vertical axis represents the number of green patent applications per 10,000 R&D personnel, while the horizontal axis represents time. It can be observed that before policy implementation, the number of green patent applications in pilot and non-pilot areas had similar changing trends. However, after policy implementation, the number of green patent applications in pilot cities experienced a significant increase.
To further enhance the credibility of the model, we apply the event study method to analyze the parallel trends and dynamic effects of green innovation in pilot and non-pilot regions [56]. The model is set as follows:
G I i t = α 1 + s = 5 5 β 1 e v e n t i t s + β 2 C o n t r o l i t + μ i + σ t + ε i t
Among them,   e v e n t   i t s represents a series of dummy variables, and the remaining variables are consistent with Formula (3). Specifically, s = 0 indicates the year in which the policy is implemented. s < 0 indicates the s-th year before the policy is implemented. s > 0 indicates the s-th year after the policy is implemented. When the polit group is in the s-th year before or after the policy implementation, the value is 1; otherwise, the value is 0.
The results of parallel trends and dynamic effects are shown in Figure 4. It can be seen that the regression coefficients β 1   are not significant before policy implementation. This indicates that there were no significant differences between pilot and non-pilot cities before policy implementation, and the sample passed the parallel trend test. After policy implementation, the regression coefficients are significantly positive and show an increasing trend year by year, which indicates that the policy combination significantly promotes green innovation and shows an annual increasing effect.

5.3. Robustness Testing

5.3.1. Placebo Test

The above parallel trend test has, to some extent, ruled out endogeneity and ensured the accuracy of the results. However, the selection of pilot cities may not be completely random. Therefore, this study conducts a placebo test through a fictitious experimental group [57]. Specifically, we randomly select pilot cities from all cities as the experimental group, repeating this process 500 times to observe the trend of the regression coefficient distribution. If the coefficient is close to 0, it means that green innovation in a city is not influenced by other unobserved random factors.
As shown in Figure 5, the curve reflects the kernel density distribution of the estimated regression coefficients, which is concentrated around 0 and follows a normal distribution, deviating significantly from the true regression coefficient (1.221). It can be observed that the randomly assigned “false policies” exert no systematic influence on the target variable. Based on this, it can be basically ruled out that the baseline regression results in this paper are caused by unobservable factors. At the same time, it also indicates that the policy combination is significantly effective for green innovation.

5.3.2. PSM-DID

In order to alleviate endogeneity issues that may arise from sample selection bias, this study employs the propensity score matching–difference-in-differences (PSM-DID) model for robustness testing. The specific steps are as follows: First, identify covariates that have a significant impact on the treatment group samples. Then, based on the characteristics of the covariates, match as many samples as possible in the control group to select available samples that meet the common trends assumption. Finally, use the DID method to test the green innovation effects of the policy combination.
Currently, there are two main methods for propensity score matching. One is to treat panel data as cross-sectional data for mixed matching, and the other is period-by-period matching. Due to the advantages and disadvantages of these two methods, this study presents the results of both methods. Meanwhile, by changing the matching methods, we employ kernel matching and radius matching to further test robustness. In addition, more stringent K-nearest neighbor matching is also used to minimize potential selection bias. Table 3 shows the regression estimation results under different matching methods, indicating that all models pass robustness tests and are significant at the 1% level, further confirming the robustness of the regression results.

5.3.3. Endogeneity Test

The aforementioned research has partially addressed potential endogeneity issues from multiple perspectives. However, there may still be biases in the estimation results due to reverse causality or omitted variable problems. For instance, regions with a high level of green innovation may respond more effectively to policies, thereby enhancing the synergistic effects between the LCP and CET. To address the issues of reverse causality and omitted variables, we further attempt to employ an instrumental variable approach, conducting a two-stage least squares (2SLS) test to examine potential endogeneity concerns. In this study, we select the lagged carbon control policy combination as the instrumental variable. On one hand, this historical variable serves as a predetermined variable, thus avoiding reverse causality issues. On the other hand, the lagged variable exhibits a strong correlation with the current carbon control policy combination, satisfying the relevance and exogeneity conditions required for an instrumental variable.
Table 4 presents the results of the endogeneity test. As indicated in column (1), the regression coefficient of the IV is significant at the 1% level, and the F-statistic for the first stage exceeds the threshold of 10 recommended by conventional rules of thumb. Therefore, there exists a strong correlation between the endogenous variable and the instrumental variable, and the issue of weak instruments is not present. Column (2) displays the results of the second stage regression. It is evident that the regression coefficient for the carbon control policy combination remains significantly positive. This indicates that, after addressing the issue of endogeneity, the carbon control policy combination continues to exert a significant positive influence on green innovation, thereby affirming the reliability of the baseline regression results presented in this study.

5.3.4. Other Robustness Tests

The robustness was further tested from three other aspects in this study. First, we replaced the dependent variable. The dependent variable was changed to the number of green patent grants to conduct a multiple-period DID regression. As shown in column (1) of Table 5, the coefficient of policy combination is significantly positive at the 1% level. Second, we excluded special samples. Sichuan Province and Fujian Province, as non-pilot provinces, initiated a CET market in 2016. In order to avoid contamination of the DID model, the samples of these two provinces were excluded. The results in column (2) show that the regression coefficient is significantly positive at the 1% level. Third was tail truncation. In order to mitigate the impact of outliers on the benchmark regression results, the sample was truncated at the 1% level based on the variable GI. The estimation results in column (3) show that after excluding outliers, the coefficient estimates of the policy combination pass the significance test at the 1% level.

6. Further Analysis

6.1. Heterogeneity Analysis

Geographical location, city administrative level, old industrial bases, and transportation hubs also have an impact on green innovation, and heterogeneity analysis was conducted based on these city characteristics. Geographical location can be divided into east, west, and central regions. Cities can also be categorized into high and low levels based on administrative levels. The classification of old industrial bases is delineated according to official documents issued by the Chinese government [58]. Transportation hubs are categorized based on the planning of the Chinese railway network [59]. Building on Formula (3), this study introduces interaction terms between category variables (CVs) and the policy combination to analyze the heterogeneity.
Table 6 reports the results of heterogeneity analysis. In terms of geographical location (column (1)), the coefficient of the interaction term is significantly positive, indicating that the policy combination has a greater promoting effect on green innovation in eastern cities than in central and western cities. The possible reason is that the economic development in eastern cities is faster, and the environmental protection policies and legal system are relatively sound [60], leading to well-realized innovation compensation for environmental regulation. The innovation compensation of enterprises exceeds the costs of technological development, promoting green innovation [61]. In contrast, most enterprises in central and western cities still adopt extensive production methods [62], and they cannot break away from this production mode in the short term. The policy effect of environmental regulation is weaker, and its promoting effect on innovation is far less than that of eastern cities. From the perspective of city administrative levels (column (2)), the coefficient of the interaction term is significantly positive, indicating that the policy combination has a more significant promoting effect on green innovation in cities with higher administrative levels. The reason for this may be that cities with higher administrative levels often have more financial resources and human resources, enabling them to invest more funds and talents in green innovation projects. These cities are usually able to attract and retain high-skilled talents, providing necessary human resources support for green innovation.
The results in column (3) indicate that the carbon control policy combinations in NOIB cities have a positive effect on green innovation. This is primarily due to the fact that these cities are typically dominated by the service sector and high-tech industries, resulting in a more lightweight and low-carbon industrial structure. Under the synergistic effects of carbon control policy combinations, such cities can more rapidly convert policy pressures into demands for green technologies. Furthermore, NOIB cities tend to have a high concentration of university resources (e.g., Suzhou and Shenzhen), which enhances their collaborative capabilities in industry–academia–research partnerships, thereby accelerating the transition of green technologies from the laboratory to the market. The coefficient in column (4) is significantly positive, indicating that the carbon control policy combinations in TH cities promote green innovation. This may be attributed to the substantial demand for passenger transport, which provides commercial application scenarios for green technologies (such as hydrogen fuel buses and shared mobility platforms), thereby accelerating technological iterations. Additionally, passenger flow data empower intelligent traffic management (e.g., real-time scheduling optimization), which not only reduces carbon emissions per passenger but also stimulates the generation of green patents related to big data.
Based on the aforementioned analysis of heterogeneity, we find that in cities with higher administrative levels, the carbon control policy combination significantly promotes green innovation compared to other cities. However, the pathways through which this effect operates remain unclear. Cities with higher administrative levels are typically granted greater permissions for pioneering initiatives [63], as well as access to special financial support from the central government [64] and prioritized allocation of technological resources. Leveraging these institutional advantages, high-level administrative cities guide the phasing out of energy-intensive industries, cultivate green industrial clusters, and accelerate industrial structure upgrading, thereby creating an innovation ecosystem characterized by upstream and downstream linkages. Furthermore, these cities attract high-end resources by introducing talent [65] and concentrating higher education resources, which enhances technological capabilities, accelerates the development of clean energy technologies, and significantly reduces the costs associated with green innovation. Therefore, we focus on cities with high administrative levels to systematically analyze the theoretical logic by which policy combinations drive green innovation through two core mechanisms: industrial structure upgrading and technological advancement.
From Table 7, it can be observed that the regression coefficient in column (1) is significantly positive, indicating that the carbon control policy combination can facilitate the upgrading of industrial structures. Through environmental regulations and policy guidance, traditional industries such as steel and petrochemicals are compelled to undergo intelligent and low-carbon transformations, thereby forcing enterprises to upgrade their processes and engage in green innovation. Consequently, the carbon control policy combination can promote green innovation in cities with higher administrative levels through industrial structure upgrading. Similarly, the regression coefficient in column (2) is also significantly positive, suggesting that the carbon control policy combination can enhance technological levels. The advancement of technological levels directly reduces the costs of green innovation and optimizes policy execution efficiency by driving breakthroughs in clean energy technologies and the application of digital technologies. Meanwhile, high technological levels accelerate industrial upgrading, thereby forming a collaborative ecosystem among industry, academia, and research, which provides technical reserves and commercial scenarios to support green innovation. Therefore, the carbon control policy combination can stimulate green innovation in cities with higher administrative levels by enhancing technological capabilities.

6.2. Intermediary Mechanism

In order to analyze the internal mechanism of carbon control policy combination on green innovation, we chose the “two-step method” to conduct the intermediary mechanism test [66]. Considering the relationship between fiscal technology expenditure, public environmental awareness, and green innovation (Figure 2), this study, based on Formula 3, further constructs the following intermediary effect model:
M i t = α 1 + β 1 D i t L C C + C E T + β 2 C o n t r o l i t + μ i + σ t + ε i t
Among them, M i t is the intermediate variable, including fiscal technology expenditure and public environmental awareness. This study uses per capita fiscal technology expenditure as a proxy variable for fiscal technology expenditure, and the annual average of Baidu’s “haze” search index as a proxy variable for public environmental awareness. Table 6 reports the results of the intermediary mechanism, with column (1) showing the baseline regression results. It can be observed that the coefficient of the policy combination is 0.2913 and significant at the 1% level (column (2)), indicating that the carbon control policy combination can incentivize green innovation by increasing fiscal technology expenditure, thus supporting Hypothesis 3a. One of the important indicators for the central government to inspect local governments is environmental quality. In order to improve local environmental governance level, local governments are inclined to increase fiscal technology expenditure to incentivize enterprise green innovation, thereby achieving a win–win situation for environmental benefits and government performance [67,68].
In column (3) of Table 8, the coefficient of the carbon control policy combination is significantly positive, indicating that the policy combination can promote green innovation by increasing public environmental awareness, thus supporting Hypothesis 3b. With the increase in public environmental awareness, companies are under pressure from the public to actively take on environmental protection responsibilities. In addition, creating a positive social image is also an important means for companies to develop and enhance their competitiveness [69]. Therefore, the increase in public environmental awareness can effectively motivate companies to engage in green innovation.
Based on the previous analysis of the intermediary mechanisms, it can be observed that the carbon control policy combination promotes green innovation by increasing fiscal expenditure. However, how does fiscal expenditure facilitate green innovation? To explore this issue, we focus on the direct effects of fiscal expenditure on the mechanism variables, delving into the intrinsic reasons through the analysis of the proportion of the secondary industry and environmental protection expenditure.
From Table 9, it can be observed that the regression coefficient for fiscal technological expenditure in column (1) is significantly positive at the 1% level, indicating that an increase in fiscal technological expenditure can expand the proportion of secondary industry. A high proportion of secondary industry typically signifies a concentration of manufacturing and industrial activities, which exhibit scale effects in the realm of green innovation. For instance, industrial agglomeration can reduce the marginal costs of environmental protection technologies and promote technological upgrades. Concurrently, regions with a high proportion of secondary industry often face stricter environmental regulations, which can compel enterprises to engage in green technological innovation, such as the development of energy-saving technologies or clean production processes. Therefore, fiscal technological expenditure can facilitate green innovation by enhancing the proportion of secondary industry. In column (2), the regression coefficient for fiscal technological expenditure is also significantly positive, suggesting that an increase in fiscal technological expenditure can intensify environmental protection expenditure. Environmental protection expenditure may directly promote research and development activities through financial support. On one hand, government subsidies can lower the R&D costs for enterprises, motivating them to invest in green technologies. On the other hand, environmental protection expenditure may serve as a policy signal, guiding enterprises and markets to focus on the environmental sector, thereby driving innovation. Furthermore, environmental protection expenditure may also foster technological exchange and collaboration through infrastructure development, such as establishing environmental protection parks or providing public R&D platforms. Consequently, fiscal expenditure can promote green innovation by increasing environmental protection expenditure.

6.3. Innovation Direction Testing

Even when facing the same environmental regulations, companies may have significant differences in their innovation directions. Furthermore, we classify green innovation into substantive innovation and strategic innovation. Substantial innovation refers to innovative activities that significantly enhance the performance of products or processes through fundamental technological breakthroughs or major improvements, thereby exerting a profound impact on the industry or society. Its characteristics include long-term orientation, high investment, and high risk. In contrast, strategic innovation is an innovative strategy employed by enterprises to respond to competition or market changes by adjusting their business models, organizational structures, or resource allocations in order to gain a competitive advantage. The essence of strategic innovation lies in strategic flexibility rather than purely technological breakthroughs. In this study, green invention patents are used as a proxy variable for substantive innovation, while green utility model patents are used as a proxy variable for strategic innovation. Because design patents have low technological requirements and do not require examination during the application process, they rely more on self-regulation [70]. Therefore, the design patent was not taken into consideration.
Table 10 shows the regression results of the impact of carbon control policy combination on green innovation directions. The results from columns (1) and (2) indicate that the policy combination has a positive promoting effect on substantive innovation and strategic innovation. However, compared to substantive innovation, the regression coefficient of strategic innovation is larger, indicating that under the pressure of carbon control policy combination, companies are more inclined to engage in strategic innovation, thereby supporting Hypothesis 4. This result may be due to the fact that many Chinese companies are still in the stage of imitation and learning, with relatively weak independent innovation capabilities. In addition, substantive innovation requires more financial and human resources, which conflicts with the profit-oriented nature of companies, as they are usually unwilling to invest heavily in these innovations.
Compared to substantive green innovation, the carbon control policy combination exerts a more pronounced effect on strategic green innovation, which can be explored from two perspectives. First, at the policy implementation level, local government environmental performance assessments are often based on easily quantifiable indicators such as the “number of patents” and “emission reduction compliance rates,” rather than the actual technical effectiveness of emissions reductions. For instance, the “China Environmental Policy Implementation Report 2022” indicates that 72% of local environmental protection departments include the “green patent growth rate” in their performance evaluations, while only 18% track the commercialization rate of patents [71]. This leads enterprises to prefer filing low-threshold technology patents (such as utility models) to meet regulatory requirements rather than investing in high-risk substantive research and development. Second, regarding corporate behavioral dynamics, substantive innovation necessitates long-term research and development investments (with an average cycle of 5–8 years), whereas the costs associated with strategic innovation (such as design patents and minor technical adjustments) are only 10–15% of those for substantive innovation. Zhang et al. [72] found that following the imposition of an environmental tax, the number of green patent applications by publicly listed companies increased by 40%. However, 70% of these were utility model patents, which are characterized by a lower technological content.

7. Conclusions and Recommendations

7.1. Research Conclusion

The scholarly community is gradually turning its attention to the impact of policy combination on green innovation, yet research in this area remains scarce. Currently, it remains unclear whether market incentive policies and voluntary participation policies work in synergy or conflict in incentivizing green innovation. This study focuses on China’s LCP and CET combination, utilizing a multi-period DID model to assess the influence of cross-tool carbon control policy combinations on green innovation. This study also delves into the heterogeneous effects of geographical location and city administrative level, while investigating intermediary mechanisms and the direction of green innovation. Main findings include the following: (1) Single LCPs or CETs significantly boost green innovation. Notably, the impact of cross-tool carbon control policy combination on green innovation surpasses that of single policy, with a trend of increasing effectiveness. Following rigorous testing, this study’s conclusions remain robust. (2) Heterogeneity analysis shows that the promotion effect of policy combinations on green innovation is more significant in the eastern region and high-level administrative cities. (3) Intermediary mechanism analysis uncovers that carbon control policy combination drive green innovation through fiscal technology expenditure and public environmental awareness. (4) Carbon control policy combination foster both substantial and strategic green innovation, with a preference towards advancing strategic green innovation.

7.2. Policy Recommendations

(1)
Continue to expand the implementation scope of carbon control policies and promote green innovation. This study confirms that the LCP and CET can promote green innovation, demonstrating that these policies can be promoted and implemented nationwide, while also providing experience and reference for the Chinese government to implement other similar carbon control policies in the future. It also has certain reference value for other developing countries. It is important to note that implementing policy combination from the outset is not feasible for regions that have not yet initiated any carbon control measures. Policymakers should determine the priority strategies for the CET and LCP based on their specific circumstances. High-energy-consuming industries, such as steel and cement, should establish rigid emission reduction targets through the LCP, supplemented by the CET to provide flexibility. Technology-intensive industries may prioritize leveraging innovation potential via the CET, supported by the LCP to ensure long-term strategic direction. As policy implementation progresses, policymakers may consider adopting policy combination approach to enhance effectiveness.
(2)
Develop tailor-made policies and scientifically design carbon control policy combinations. Governments should formulate distinctive carbon control policies based on the characteristics of different regions when developing policies. In the research of this article, the policy combination effect of the LCP and CET is positive and greater than a single policy, indicating that cross-tool policy combination can achieve complementary policy effects. However, it should be noted that simply arbitrary policy combination may not necessarily produce better results. In regions characterized by a high degree of marketization and significant disparities in the cost of emissions reduction among enterprises, the promotion of the CET should be prioritized. This approach leverages price signals to stimulate enterprises’ autonomous motivation for emissions reduction, while simultaneously utilizing the revenues from carbon quota trading to reinvest in the research and development of green technologies. Conversely, in areas with a singular industrial structure and weak technological foundations, it is essential to initially adopt an LCP as the primary strategy to rapidly establish a framework for emissions reduction. Subsequently, a gradual introduction of a CET can be implemented to form a cohesive policy combination. Therefore, when issuing various policy tools, governments need to scientifically and reasonably plan policy combinations. Because the combination of policies may lead to ineffective coordination between departments, on the one hand, conflicts in policy objectives and differences in policy orientation among different departments may result in execution contradictions, and on the other hand, unclear division of responsibilities and unclear boundaries of cross-departmental accusations may easily lead to buck passing. Therefore, when customizing policies involving multiple departments, they must be approved by a joint meeting before implementation. At the same time, a “List of Responsibilities for Cross departmental Policy Implementation” should be formulated to clarify the responsible parties for policy formulation, implementation, and supervision.
(3)
Design targeted incentive mechanisms to enhance the substantive innovation tendency. Enhance the protection of green technology patents while establishing public technology platforms to facilitate the diffusion of low-carbon technologies. Encourage enterprises to disclose data on their carbon footprints and innovation investments, integrating these metrics into the ESG rating system to guide capital markets in supporting substantive innovation. Since many Chinese enterprises are still in the stage of imitation and learning, the government should consider adding some targeted incentive measures in policy making to promote the independent innovation capability, for example, providing innovation funds, technical support, and training to help enterprises break through the imitation stage and enhance the endogenous driving force of green innovation. Implement targeted subsidy policies that provide a high proportion of subsidies for breakthrough technologies, while adopting a “post-reward” model for incremental improvements. Under the synergy of cross policy tools, governments and businesses promote substantive innovation by increasing technology spending and raising public environmental awareness. The government will establish a “Green Technology Innovation Fund” and allocate 1–2% of annual fiscal revenue towards targeted investment, focusing on supporting enterprises in key technology research and increasing subsidy ratios. Enterprises and universities jointly establish a “Green Technology Joint Laboratory” and agree to send engineers from the enterprise to participate in the project. The laboratory results will be given priority authorization to cooperative enterprises. At the same time, develop a “Green Innovation Supervision APP” and establish a social supervision network, where the public can report environmental violations and receive point rewards.

7.3. Limitations

This study only focused on data from Chinese prefecture-level cities, which can be expanded to the micro level in the future. Using enterprises as research samples can help discover different conclusions. Additionally, this study belongs to cross-tool policy combination, and more types of policy combinations can be considered in the future.

Author Contributions

Conceptualization, J.S. and J.H.; Methodology, J.S. and J.H.; Resources, X.L. and Q.S.; Data curation, J.H.; Writing—original draft, J.H.; Writing—review & editing, J.S.; Visualization, J.S.; Supervision, X.L.; Funding acquisition, X.L. and Q.S. All authors have read and agreed to the published version of the manuscript.

Funding

This research was funded by National Natural Science Foundation of China [No. 72274114; No. 72474123; Grant No. 42001257; Grant No. 42301346] and Shanxi Scholarship Council of China [Grant No. 2024-096].

Institutional Review Board Statement

Not applicable.

Informed Consent Statement

Not applicable.

Data Availability Statement

The data presented in this study are available on request from the corresponding author.

Conflicts of Interest

The authors declare no conflicts of interest.

References

  1. Kleinebrahm, M.; Weinand, J.M.; Naber, E.; McKenna, R.; Ardone, A. Analysing municipal energy system transformations in line with national greenhouse gas reduction strategies. Appl. Energy 2023, 332, 120515. [Google Scholar] [CrossRef]
  2. Qi, Y.; Zhang, J.; Chen, J. Tax incentives, environmental regulation and firms’ emission reduction strategies: Evidence from China. J. Environ. Econ. Manag. 2023, 117, 102750. [Google Scholar] [CrossRef]
  3. Demirel, P.; Kesidou, E.J.E.E. Stimulating different types of eco-innovation in the UK: Government policies and firm motivations. Ecol. Econ. 2011, 70, 1546–1557. [Google Scholar] [CrossRef]
  4. Leonard, H.J. Pollution and the Struggle for the World Product: Multinational Corporations, Environment, and International Comparative Advantage; Cambridge University Press: Cambridge, UK, 2006. [Google Scholar]
  5. Stoever, J.; Weche, J.P.J.E.; Economics, R. Environmental regulation and sustainable competitiveness: Evaluating the role of firm-level green investments in the context of the Porter hypothesis. Environ. Resour. Econ. 2018, 70, 429–455. [Google Scholar] [CrossRef]
  6. Anouliès, L. Heterogeneous firms and the environment: A cap-and-trade program. J. Environ. Econ. Manag. 2017, 84, 84–101. [Google Scholar] [CrossRef]
  7. Yu, H.; Peng, F.; Yuan, T.; Li, D.; Shi, D. The effect of low-carbon pilot policy on low-carbon technological innovation in China: Reexamining the porter hypothesis using difference-in-difference-in-differences strategy. J. Innov. Knowl. 2023, 8, 100392. [Google Scholar] [CrossRef]
  8. Wang, L.; Zhan, Y. Does cross-policy mix work on digital innovation: Analyzing by the impact of open government data and low-carbon city pilot policies in China. J. Clean. Prod. 2025, 491, 144842. [Google Scholar] [CrossRef]
  9. Shen, J.; He, J.; Liu, X.; Shi, Q. Complementarity or crowding out? The impact of environmental policy combination on renewable energy technology innovation. Renew. Energy 2025, 248, 123196. [Google Scholar] [CrossRef]
  10. Howlett, M.; Rayner, J.J. Design principles for policy mixes: Cohesion and coherence in ‘new governance arrangements’. Policy Soc. 2007, 26, 1–18. [Google Scholar] [CrossRef]
  11. Gao, K.; Yuan, Y. Government intervention, spillover effect and urban innovation performance: Empirical evidence from national innovative city pilot policy in China. Technol. Soc. 2022, 70, 102035. [Google Scholar] [CrossRef]
  12. Blanchard, O.; Gollier, C.; Tirole, J. The portfolio of economic policies needed to fight climate change. Annu. Rev. Econ. 2023, 15, 689–722. [Google Scholar] [CrossRef]
  13. Ma, Y.; Sha, Y.; Wang, Z.; Zhang, W. The effect of the policy mix of green credit and government subsidy on environmental innovation. Energy Econ. 2023, 118, 106512. [Google Scholar] [CrossRef]
  14. Crespi, F.; Ghisetti, C.; Quatraro, F. Environmental and innovation policies for the evolution of green technologies: A survey and a test. Eurasian Bus. Rev. 2015, 5, 343–370. [Google Scholar] [CrossRef]
  15. Zhang, P.; Zhou, D.; Guo, J. Policy complementary or policy crowding-out? Effects of cross-instrumental policy mix on green innovation in China. Technol. Forecast. Soc. Chang. 2023, 192, 122530. [Google Scholar] [CrossRef]
  16. Ossenbrink, J.; Finnsson, S.; Bening, C.R.; Hoffmann, V.H. Delineating policy mixes: Contrasting top-down and bottom-up approaches to the case of energy-storage policy in California. Res. Policy 2019, 48, 103582. [Google Scholar] [CrossRef]
  17. Oberthür, S.; Von Homeyer, I. From emissions trading to the European Green Deal: The evolution of the climate policy mix and climate policy integration in the EU. J. Eur. Public Policy 2023, 30, 445–468. [Google Scholar] [CrossRef]
  18. Han, Y.; Zhe, C.; Liu, X. Is the carbon emissions trading system conducive to the urban green technology innovation level? Evidence from China. Energy Rep. 2023, 9, 3787–3799. [Google Scholar] [CrossRef]
  19. Qu, F.; Xu, L.; He, C. Leverage effect or crowding out effect? Evidence from low-carbon city pilot and energy technology innovation in China. Sustain. Cities Soc. 2023, 91, 104423. [Google Scholar] [CrossRef]
  20. Guo, R.; Zhang, Y.; Chen, K.; Wang, Y.; Ning, L. Heterogeneous impact of green finance instruments on firms’ green innovation novelty: Policy mix or mess? Energy Econ. 2025, 144, 108315. [Google Scholar] [CrossRef]
  21. Chen, C.; Lin, Y.; Lv, N.; Zhang, W.; Sun, Y. Can government low-carbon regulation stimulate urban green innovation? Quasi-experimental evidence from China’s low-carbon city pilot policy. Appl. Econ. 2022, 54, 6559–6579. [Google Scholar] [CrossRef]
  22. Zou, C.; Huang, Y.; Wu, S.; Hu, S. Does “low-carbon city” accelerate urban innovation? Evidence from China. Sustain. Cities Soc. 2022, 83, 103954. [Google Scholar] [CrossRef]
  23. Tian, Y.; Song, W.; Liu, M. Assessment of how environmental policy affects urban innovation: Evidence from China’s low-carbon pilot cities program. Econ. Anal. Policy 2021, 71, 41–56. [Google Scholar] [CrossRef]
  24. Liu, B.; Gan, L.; Huang, K.; Hu, S. The impact of low-carbon city pilot policy on corporate green innovation: Evidence from China. Financ. Res. Lett. 2023, 58, 104055. [Google Scholar] [CrossRef]
  25. Wang, Y.; Yao, J. Innovation or introduction? Impacts of the low-carbon city pilot policy on the pathways toward green technology progress. Heliyon 2024, 10, e28745. [Google Scholar] [CrossRef]
  26. Joltreau, E.; Sommerfeld, K. Why does emissions trading under the EU Emissions Trading System (ETS) not affect firms’ competitiveness? Empirical findings from the literature. Clim. Policy 2019, 19, 453–471. [Google Scholar] [CrossRef]
  27. Hermwille, L.; Obergassel, W.; Arens, C. The transformative potential of emissions trading. Carbon Manag. 2015, 6, 261–272. [Google Scholar] [CrossRef]
  28. Mo, J.Y. Technological innovation and its impact on carbon emissions: Evidence from Korea manufacturing firms participating emission trading scheme. Technol. Anal. Strateg. Manag. 2022, 34, 47–57. [Google Scholar] [CrossRef]
  29. Borghesi, S.; Cainelli, G.; Mazzanti, M. Linking emission trading to environmental innovation: Evidence from the Italian manufacturing industry. Res. Policy 2015, 44, 669–683. [Google Scholar] [CrossRef]
  30. Zhang, L.; Cao, C.; Tang, F.; He, J.; Li, D. Does China’s emissions trading system foster corporate green innovation? Evidence from regulating listed companies. Technol. Anal. Strat. Manag. 2019, 31, 199–212. [Google Scholar] [CrossRef]
  31. Flanagan, K.; Uyarra, E.; Laranja, M. Reconceptualising the ‘policy mix’ for innovation. Res. Policy 2011, 40, 702–713. [Google Scholar] [CrossRef]
  32. Gunningham, N.; Sinclair, D. Regulatory pluralism: Designing policy mixes for environmental protection. In Environmental Law; Routledge: London, UK, 2019; pp. 463–490. [Google Scholar]
  33. Li, X.; Yao, X. Can energy supply-side and demand-side policies for energy saving and emission reduction be synergistic?—A simulated study on China’s coal capacity cut and carbon tax. Energy Policy 2020, 138, 111232. [Google Scholar] [CrossRef]
  34. Dhanshyam, M.; Srivastava, S.K. Effective policy mix for plastic waste mitigation in India using System Dynamics. Resour. Conserv. Recycl. 2021, 168, 105455. [Google Scholar] [CrossRef]
  35. Zhou, D.; Zhou, F.; Wang, X. Impact of low-carbon pilot policy on the performance of urban carbon emissions and its mechanism. Resour. Sci. 2019, 41, 546–556. [Google Scholar]
  36. Costantini, V.; Crespi, F.; Palma, A. Characterizing the policy mix and its impact on eco-innovation: A patent analysis of energy-efficient technologies. Res. Policy 2017, 46, 799–819. [Google Scholar] [CrossRef]
  37. He, C.; Wang, Y.-P.; Tang, K. Impact of low-carbon city construction policy on green innovation performance in China. Emerg. Mark. Financ. Trade 2023, 59, 15–26. [Google Scholar] [CrossRef]
  38. Yang, S.; Lu, T.; Huang, T.; Wang, C. Re-examining the effect of carbon emission trading policy on improving the green innovation of China’s enterprises. Environ. Sci. Pollut. Res. 2023, 30, 7696–7717. [Google Scholar] [CrossRef]
  39. Ozusaglam, S.; Kesidou, E.; Wong, C.Y. Performance effects of complementarity between environmental management systems and environmental technologies. Int. J. Prod. Econ. 2018, 197, 112–122. [Google Scholar] [CrossRef]
  40. Bennear, L.S.; Stavins, R.N. Second-best theory and the use of multiple policy instruments. Environ. Resour. Econ. 2007, 37, 111–129. [Google Scholar] [CrossRef]
  41. Jones, B.D.; Baumgartner, F.R. The Politics of Attention: How Government Prioritizes Problems; University of Chicago Press: Chicago, IL, USA, 2005. [Google Scholar]
  42. Magro, E.; Wilson, J.R. Policy-mix evaluation: Governance challenges from new place-based innovation policies. Res. Policy 2019, 48, 103612. [Google Scholar] [CrossRef]
  43. Klemetsen, M.E.; Bye, B.; Raknerud, A. Can direct regulations spur innovations in environmental technologies? A study on firm-level patenting. Scand. J. Econ. 2018, 120, 338–371. [Google Scholar] [CrossRef]
  44. Tong, T.W.; He, W.; He, Z.-L.; Lu, J. Patent regime shift and firm innovation: Evidence from the second amendment to China’s patent law. In Proceedings of the 2014 Academy of Management Annual Meeting, Philadelphia, PA, USA, 1–5 August 2014; p. 14174. [Google Scholar]
  45. Jiang, Z.; Wang, Z.; Lan, X. How environmental regulations affect corporate innovation? The coupling mechanism of mandatory rules and voluntary management. Technol. Soc. 2021, 65, 101575. [Google Scholar] [CrossRef]
  46. Baker, A.; Callaway, B.; Cunningham, S.; Goodman-Bacon, A.; Sant’Anna, P.H.C. Difference-in-differences designs: A practitioner’s guide. arXiv 2025, arXiv:2503.13323. [Google Scholar]
  47. Chernozhukov, V.; Chetverikov, D.; Demirer, M.; Duflo, E.; Hansen, C.; Newey, W.; Robins, J. Double/Debiased Machine Learning for Treatment and Structural Parameters; Oxford University Press: Oxford, UK, 2018. [Google Scholar]
  48. CNRDS-Chinese Research Date Services Platform. Available online: https://www.cnrds.com/Home/Login (accessed on 21 December 2024).
  49. WIPO-World Intellectual Property Organization. Available online: https://patentscope2.wipo.int/search/en/detail.jsf?docId=WO2023123456 (accessed on 21 October 2024).
  50. Central Committee of the Communist Party of China and State Council. Encourage Various Types of Capital to Increase the Proportion of Investment in Green and Low-Carbon Fields. Available online: https://www.xinhuanet.com/money/20240812/aa78126abe8b468e9055849567e22ff0/c.html (accessed on 21 October 2024).
  51. Li, T.; Meng, X.; Wang, L.; Gong, Y. Will China’s Carbon Emission Trading Regulation Really Decrease the Green Investment of Firms? A Microperspective on Corporate Governance. Bus. Strat. Environ. 2025, 34, 2222–2238. [Google Scholar] [CrossRef]
  52. Zhou, X.; Dai, M.; Liu, L. Green credit, carbon emission trading and corporate green innovation: Evidence from China. Pac.-Basin Financ. J. 2024, 86, 102445. [Google Scholar] [CrossRef]
  53. Huang, H.; Yi, M. Impacts and mechanisms of heterogeneous environmental regulations on carbon emissions: An empirical research based on DID method. Environ. Impact Assess. Rev. 2023, 99, 107039. [Google Scholar] [CrossRef]
  54. Financial Headlines: The Ministry of Ecology and Environment of China Has Indicated That a National Unified Carbon Market Is Currently Under Construction. Available online: https://cj.sina.com.cn/articles/view/5182171545/134e1a99902001pp5p (accessed on 28 October 2024).
  55. Lee, K.; Leung, J.Y.; Pinedo, M.L. Coordination mechanisms with hybrid local policies. Discret. Optim. 2011, 8, 513–524. [Google Scholar] [CrossRef]
  56. Alder, S.; Shao, L.; Zilibotti, F. Economic reforms and industrial policy in a panel of Chinese cities. J. Econ. Growth 2016, 21, 305–349. [Google Scholar] [CrossRef]
  57. Cai, X.; Lu, Y.; Wu, M.; Yu, L. Does environmental regulation drive away inbound foreign direct investment? Evidence from a quasi-natural experiment in China. J. Dev. Econ. 2016, 123, 73–85. [Google Scholar] [CrossRef]
  58. National Development and Reform Commission of China. Notice on Issuing the National Plan for the Adjustment and Transformation of Old Industrial Bases (2013–2022). Available online: https://www.gov.cn/gongbao/content/2013/content_2441018.htm (accessed on 1 October 2024).
  59. National Development and Reform Commission of China. Medium- and Long-Term Railway Network Plan. Available online: https://www.gov.cn/xinwen/2016-07/20/content_5093165.htm (accessed on 1 October 2024).
  60. Luo, J.; Jin, X.; Hu, Y. Top-down or bottom-up? Government policies, public awareness and carbon reduction. Econ. Anal. Policy 2024, 83, 118–129. [Google Scholar] [CrossRef]
  61. Zhang, M.; Hong, Y.; Zhu, B. Does national innovative city pilot policy promote green technology progress? Evidence from China. J. Clean. Prod. 2022, 363, 132461. [Google Scholar] [CrossRef]
  62. National Office of Philosophy and Social Sciences. Optimization Path for Industrial Transformation and Upgrading in Ecologically Fragile Areas in the Western Region. Available online: http://www.nopss.gov.cn/n1/2018/0313/c405352-29864627.html (accessed on 1 October 2024).
  63. Zhao, X.; Xu, Y.; Vasa, L.; Shahzad, U. Entrepreneurial ecosystem and urban innovation: Contextual findings in the lens of sustainable development from China. Technol. Forecast. Soc. Chang. 2023, 191, 122526. [Google Scholar] [CrossRef]
  64. China Finance and Economics. Central Government Innovates Ways to Support Urban Renewal. Available online: https://finance.china.com.cn/news/20240514/6117397.shtml (accessed on 11 October 2024).
  65. Finance Bureau of Zoucheng City. Ministry of Finance: Based on the “Three Focuses” to Support Urban Renewal. Available online: http://www.zoucheng.gov.cn/art/2025/5/26/art_24172_2847996.html (accessed on 18 October 2024).
  66. Xu, Y.; Yang, L.; Hossain, M.E.; Haseeb, M.; Ran, Q. Unveiling the trajectory of corporate green innovation: The roles of the public attention and government. J. Clean. Prod. 2024, 444, 141119. [Google Scholar] [CrossRef]
  67. Milani, S. The impact of environmental policy stringency on industrial R&D conditional on pollution intensity and relocation costs. Environ. Resour. Econ. 2017, 68, 595–620. [Google Scholar]
  68. Phdungsilp, A. Integrated energy and carbon modeling with a decision support system: Policy scenarios for low-carbon city development in Bangkok. Energy Policy 2010, 38, 4808–4817. [Google Scholar] [CrossRef]
  69. Li, Y.; Yaacob, M.H.; Xie, T. Effects of China’s low carbon pilot city policy on corporate green innovation: Considering the mediating role of public environmental concern. Financ. Res. Lett. 2024, 65, 105641. [Google Scholar] [CrossRef]
  70. Huang, C. Estimates of the value of patent rights in China. In Innovation and IPRs in China and India: Myths, Realities and Opportunities; Springer: Berlin/Heidelberg, Germany, 2016; pp. 181–209. [Google Scholar]
  71. The Website of Ministry of Ecology and Environment of the People’s Republic of China. The Ministry of Ecology and Environment Released the “Annual Report on China’s Policies and Actions to Address Climate Change 2022”. Available online: https://www.mee.gov.cn/ywgz/ydqhbh/syqhbh/202210/t20221027_998171.shtml (accessed on 15 October 2024).
  72. Zhang, C.; Zou, C.F.; Luo, W.; Liao, L. Effect of environmental tax reform on corporate green technology innovation. Front. Environ. Sci. 2022, 10, 1036810. [Google Scholar] [CrossRef]
Figure 1. Geographical distribution of LCP and CET pilot cities.
Sustainability 17 06881 g001
Figure 2. The correlation between cross-tool carbon control policy combination and green innovation.
Sustainability 17 06881 g002
Figure 3. The changing trends of green patents in pilot and non-pilot cities.
Sustainability 17 06881 g003
Figure 4. The parallel trends and dynamic effects. The horizontal axis represents time, with current time indicating the policy implementation point. The intervals pre_1 to pre_5 denote the five years preceding the policy’s enactment, while post_1 to post_5 represent the five years following its implementation. The vertical axis illustrates the regression coefficients β 1 , which range from −1 to 3. The range above and below the scatter points drawn with dashed lines represents the 95% confidence interval.
Sustainability 17 06881 g004
Figure 5. The placebo test. The horizontal axis represents the estimated coefficients of the simulated policy effects, ranging from −1.5 to 1.5, encompassing potential values for spurious effects. The vertical axis indicates the probability density of the estimated coefficients, with a range from 0.0 to 6.0.
Sustainability 17 06881 g005
Table 1. Variable definition and descriptive statistics.
SymbolsDefinitionMeanS.D.MinMax
GIGreen innovation0.72981.91570.000035.4066
D L C P Dummy, 1 = city implementing the LCP0.22930.42050.00001.0000
D C E T Dummy, 1 = city implementing the CET0.07840.26890.00001.0000
D L C P + C E T Dummy, 1 = city implementing the LCP and CET0.07070.25630.00001.0000
PGDPEconomic development10.37672.50814.5951185.8675
FDIForeign direct investment0.01810.02320.00000.3758
GVIGovernment intervention0.16950.08920.03131.4852
URUrbanization0.51280.17580.11171.2160
HCHuman capital0.01740.02400.0000651.6921
FTEfiscal technology expenditure3.71101.65030.00009.4091
PEAPublic environmental awareness44.524864.46270.00001118.2082
Table 2. Benchmark regression results.
Models(1)(2)(3)(4)(5)(6)
D L C P 0.918 *** 0.725 ***
(14.271) (11.424)
D C E T 1.313 *** 1.063 ***
(15.349) (12.540)
D L C P + C E T 1.475 *** 1.221 ***
(16.324) (13.631)
PGDP −0.009−0.010−0.010
(−1.355)(−1.443)(−1.420)
FDI −11.259 ***−11.132 ***−10.877 ***
(−11.863)(−11.762)(−11.508)
GI −3.743 ***−3.767 ***−3.855 ***
(−9.912)(−10.009)(−10.282)
UR −1.761 ***−1.500 ***−1.445 ***
(−6.772)(−5.748)(−5.548)
HC 0.002 ***0.003 ***0.003 ***
(3.603)(4.277)(4.271)
Cons6.986 ***6.727 ***6.647 ***9.417 ***9.017 ***8.900 ***
(25.383)(24.370)(24.117)(27.521)(26.080)(25.761)
N552055205520552055205520
F31.00431.29031.56833.38333.63833.908
Adj. R20.6160.6180.6200.6380.6400.641
Note: The values in parentheses are t-test values. ***, **, * represent significance levels of 1%, 5%, and 10% respectively. The following table is the same.
Table 3. The test results of PSM-DID.
ModelsMixed MatchingPeriod-by-Period Matching
(1)(2)(3)(4)(5)(6)
RMKMKNMRMKMKNM
D L C C + C E T 1.1395 ***1.2209 ***0.9995 ***0.8019 ***1.2164 ***1.0126 ***
(12.8986)(13.6307)(7.4668)(9.1699)(13.3049)(7.0355)
ControlsYYYYYY
City FEYYYYYY
Year FEYYYYYY
N530155202354411552212273
F133.343899.075059.890795.4585121.757058.9722
Adj. R20.66770.64140.65110.64660.65120.6382
Note: RM, KM, KNM, respectively, represent radius matching, kernel matching, and K-nearest neighbor matching.
Table 4. Endogeneity test results.
Models(1)(2)
First-StageSecond-Stage
D L C P + C E T GI
IV0.988 ***
(200.92)
D L C P + C E T 1.749 ***
(18.51)
ControlsYY
City FEYY
Year FEYY
N55205520
Anderson canon. corr. LM4641.81
Cragg–Donald Wald F40,368.21
Note: IV represents the instrumental variable, characterized by the lagged carbon control policy combination.
Table 5. Other robustness test results.
Models(1)(2)(3)
RDVESSATT
D L C P + C E T 0.1918 ***1.2065 ***0.6772 ***
(5.1879)(11.1310)(11.1310)
ControlsYYY
City FEYYY
Year FEYYY
N552049805520
F92.697292.6972118.0124
Adj. R20.94380.64270.7018
Note: RDV, ESS, ATT, respectively, represent replacing the dependent variable, exclusion of special samples, and the application of tail truncation.
Table 6. Heterogeneity analysis results.
Models(1)(2)(3)(4)
GLCALNOIBTH
D L C P + C E T × CV2.4514 ***5.3766 ***6.8747 ***5.6258 ***
(10.5962)(28.1703)(18.3508)−27.2735
D L C P + C E T 0.8672 ***0.1536 *1.2146 ***0.4787 ***
(9.1571)(1.6763)(13.5137)−5.1886
ControlsYYYY
City FEYYYY
Year FEYYYY
N5520552055205520
F102.7719211.184733.928238.5073
Adj. R20.64890.68870.64170.6681
Note: GL, CAL, NOIB and TH, respectively, represent geographical location, city administrative level, non-old industrial bases, and transportation hubs. If the city belongs to the eastern region, is a city with a high administrative level, is classified as a non-old industrial base, or belongs to transportation hub, then the value of CV is 1; otherwise, it is 0.
Table 7. In-depth analysis of cities with high administrative levels.
Models(1)(2)
IUTL
D L C P + C E T 0.5943 ***0.0366 ***
−34.2778−11.8741
ControlsYY
City FEYY
Year FEYY
N55205520
F139.790736.6319
Adj. R20.88260.6588
Note: IU indicates industrial structure upgrade. TL represents technological level.
Table 8. The test results of intermediary mechanisms.
ModelsGIFTEPEA
(1)(2)(3)
D L C C + C E T 1.221 ***0.2913 ***27.3039 ***
(13.631)(7.4671)(6.7455)
ControlsYYY
City FEYYY
Year FEYYY
N552055203312
F33.90866.092410.3441
Adj. R20.6410.90840.7617
Note: FTE and PEA represent financial technology expenditure and public environmental awareness, respectively.
Table 9. In-depth analysis of financial technology expenditures.
Models(1)(2)
SPEP
FTE0.0083 ***0.0028 ***
−6.2092−6.1072
ControlsYY
City FEYY
Year FEYY
N55204416
F79.14518.6504
Adj. R20.80940.339
Note: SP and EP represent financial technology expenditures, the proportion of secondary industry and environmental protection expenditure, respectively.
Table 10. The direction test of green innovation.
Models(1)(2)
SUBSTG
D L C C + C E T 0.0013 ***0.0017 ***
(65.5381)(72.5248)
ControlsYY
City FEYY
Year FEYY
N55205520
F768.4007921.8984
Adj. R20.00330.8214
Note: SUB and STG, respectively, represent substantive green innovation and strategic green innovation.
Disclaimer/Publisher’s Note: The statements, opinions and data contained in all publications are solely those of the individual author(s) and contributor(s) and not of MDPI and/or the editor(s). MDPI and/or the editor(s) disclaim responsibility for any injury to people or property resulting from any ideas, methods, instructions or products referred to in the content.

