Article

Exploring the Spatial Coupling Characteristics and Influence Mechanisms of Built Environment and Green Space Pattern: The Case of Shanghai

College of Landscape Architecture and Art, Fujian Agriculture and Forestry University, Fuzhou 350002, China
*
Authors to whom correspondence should be addressed.
These authors contributed equally to this work.
Sustainability 2025, 17(15), 6828; https://doi.org/10.3390/su17156828 (registering DOI)
Submission received: 26 June 2025 / Revised: 12 July 2025 / Accepted: 23 July 2025 / Published: 27 July 2025
(This article belongs to the Special Issue Urban Planning and Sustainable Land Use—2nd Edition)

Abstract

Urban expansion will squeeze the green space system and cause ecological fragmentation. The question of how to expand cities more scientifically and build eco-cities has become an important topic of sustainable urban construction. This paper takes Shanghai as a research case. A deep neural network combined with an attention mechanism model measures the comprehensive level of the built environment and green space pattern of urbanization and quantitatively analyzes the coordinated relationship between the two using the coupled degree of coordination model. Subsequently, the K-Means clustering model was used for spatial clustering to determine the governance and construction directions for different spatial areas and was, finally, combined with the LightGBM model plus SHAP to analyze the importance and threshold effect of the indicators on the degree of coupled coordination. The results of the study show that (1) the core area of the city shows a high state of coordination, indicating that Shanghai has a better green space construction in the central city, but the periphery shows different imbalances; (2) three different kinds of areas are identified, and different governance measures as well as the direction of urbanization are proposed according to the characteristics of the different areas; and (3) this study finds that the structural indicators of the built environment, such as Average Compactness, Weighted Average Height, and Land Use Diversity, have a significant influence on the coupling coordination degree and have different response thresholds. The results of the study provide theoretical support for regional governance and suggestions for the direction of urban expansion for sustainable urbanization.

1. Introduction

With the rapid advancement of China’s economy, the national urbanization process has accelerated dramatically [1]. Large-scale urban expansion has profoundly reshaped land use patterns [2], driving a high degree of built environment agglomeration. However, past urban development has often failed to reconcile the tension between spatial expansion and ecological sustainability [3,4], resulting in ecological degradation and environmental pollution [5,6]. Unregulated and rapid urban sprawl frequently leads to the fragmentation, marginalization, and functional weakening of urban green spaces [7,8,9]. Haase [10] demonstrated that urban green space exhibits pronounced ecological vulnerability in the face of expansion, particularly with substantial ecosystem service losses in peripheral zones. While urbanization serves as a key driver of economic and social progress, enhancing infrastructure and public welfare, it concurrently intensifies resource depletion and environmental stress [11]. Consequently, a growing body of research has emphasized the ecological impacts of urban spatial growth and the imperative to identify synergetic pathways between urban development and ecological conservation [12,13]. From an urban ecological perspective, green space systems play a strategic role in enhancing urban resilience and mitigating climate-related risks [14]. Therefore, identifying the coupled spatial patterns and interactive mechanisms between the built environment and green space is not only a critical issue in urban spatial governance but also a key indicator for guiding sustainable urban expansion.
The relationship between urbanization and the ecological environment remains a central concern in the discourse on sustainable urban development. A deeper exploration of the interactive mechanisms between the built environment and green space pattern serves as a critical entry point for understanding the dynamics of urban spatial expansion and ecosystem evolution [15]. In recent years, growing scholarly attention has focused on the impacts of urbanization on ecosystem patterns and service functions [16,17], with extensive research addressing issues such as land cover transformation induced by urban expansion [18], landscape fragmentation [19,20], and changes in ecosystem services [21,22]. Within these studies, the built environment is frequently employed as a key indicator to characterize urban spatial morphology and its externalities [23]. Meanwhile, green space configuration is widely regarded as a visible manifestation of urban ecosystem health and sustainability [24], as its spatial distribution, structural composition, and ecological connectivity directly influence ecosystem services [25] and residents’ environmental well-being [26,27].
The spatial coupling between built-up areas and green space essentially reflects the dynamic balance—or potential conflict—between urban development and ecological preservation [28]. Unregulated expansion of urban spaces and the over-concentration of the built environment inevitably encroach upon green spaces and disrupt their spatial integrity [29]. In contrast, scientifically planned urban expansion and well-maintained green spatial patterns can enhance urban resilience and support the broader goals of sustainable urban development [30]. While existing studies have explored the coupling coordination between the built environment and green space from perspectives such as spatial matching [31], supply–demand coordination of ecosystem services [32], and land use response relationships [33], several critical gaps remain. These include (1) limited attention to the influence mechanisms and threshold effects of coupling factors; (2) insufficient consideration of spatial heterogeneity across different urban units; and (3) a lack of fine-scale, micro-level analysis. Therefore, investigating the coupling characteristics and driving mechanisms between the built environment and green space patterns—along with the identification of their spatial differentiation patterns—holds significant theoretical and practical value. It provides essential insights for advancing sustainable urban development and optimizing the synergy between ecological and built-up spaces [34].
In recent years, machine learning models have been increasingly applied to studies of urban spatial structure, remote sensing monitoring, and urban ecosystems, owing to their powerful nonlinear fitting capabilities and automatic feature extraction advantages [35,36,37]. In the context of weighting coefficient computation, Deep Neural Networks (DNNs) exhibit strong capacity for multi-layered abstraction and can effectively capture nonlinear interactions among complex variables [38]. By incorporating an attention mechanism, the model can autonomously learn and assign weights to each feature, thereby enhancing the representation power of key indicators.
For spatial classification, the K-Means clustering algorithm, as a classical unsupervised machine learning technique [39], is widely used to identify spatial units with similar characteristics at a micro-urban scale [40]. This allows for the segmentation of urban space into functionally distinct zones [41,42], providing strategic support for ecological zoning and planning governance [43]. In addition, the Light Gradient Boosting Machine (LightGBM), a state-of-the-art gradient boosting algorithm, is renowned for its high computational efficiency, scalability to high-dimensional data, and robustness to noise [44]. It is increasingly employed in the identification of urban system driving factors and predictive modeling [45]. When integrated with SHAP (SHapley Additive exPlanations), LightGBM facilitates interpretable analyses of model outputs by quantifying the marginal effects [46], threshold responses [47], and interaction dynamics [48] of different influencing factors [49], thereby providing a more explainable decision-making foundation for the coordinated optimization of built and ecological environments.
Shanghai serves as one of the most representative megacities in China [50]. Since the onset of reform and opening-up, the city has experienced accelerated urbanization, with rapid expansion of built-up areas [51], continuous transformation of land use structures [52], and increasing compression and fragmentation of green space systems [53]. These trends have produced a complex pattern of spatial coupling between urban development and ecological systems [54,55], making Shanghai an ideal case for examining the interactions between built environments and green space patterns under conditions of intensive urbanization. Under the national strategies of “ecological civilization” and “resilient cities,” Shanghai has actively advanced its green transition, urban resilience renewal, and ecological city-building initiatives [56,57]. The city has accumulated substantial experience in ecological corridor reconstruction and urban boundary control, demonstrating strong policy-driven and governance-responsive characteristics [58]. Consequently, Shanghai not only provides theoretical insight and empirical depth for studies on urban construction and green space patterns, but also offers valuable lessons for other large-scale metropolitan regions.
To summarize, this paper takes Shanghai as a research case and focuses on the following three scientific questions: (1) How can the spatial characteristics of the built environment and green space patterns in the urbanization process, as well as the coupling and coordination relationship between the two, be identified? (2) Based on the spatial relationship between the built environment and green space patterns, how can urban spatial development policies be formulated in a manner appropriate to local conditions? (3) What are the differences in the importance of different built environment and green space pattern indicators for regional coupling coordination, and what is the threshold effect? In order to solve the above problems, this paper uses a deep neural network (DNN) combined with the Attention Mechanism’s weight calculation method to realize the quantification of the comprehensive index of urban construction level and green space pattern, and uses the coupling coordination degree model to identify different coordination degree relationship regions. Meanwhile, the K-Means clustering method is used to classify urban spatial units. As well as combining the LightGBM model and the SHAP interpretation algorithm, the importance and threshold effects of different influencing factors are systematically quantified to reveal the key regulatory mechanisms of different indicators. Finally, differentiated urban space optimization strategies and spatial expansion directions for urbanization development are proposed to guide the construction of sustainable cities.

2. Materials and Methods

2.1. Study Area

Shanghai is located at the estuary of the Yangtze River in eastern China (30°40′–31°53′ N, 120°52′–122°12′ E) and serves as a major national hub and an international center for finance and commerce (Figure 1). Situated within the northern subtropical monsoon climate zone, Shanghai experienced an average annual temperature of approximately 18.5 °C and a total annual precipitation of about 1414.2 mm in 2023 [59]. These favorable climatic conditions provide essential ecological support for maintaining biodiversity and ecosystem services within the city’s green space system.
To explore the coupling relationship and spatial heterogeneity between the built environment and green space pattern at a finer scale, we partitioned the entire municipal area of Shanghai into 81,619 grid units, each measuring 300 m × 300 m, using ArcGIS spatial analysis tools.

2.2. Data Sources and Preprocessing

To accurately reflect its spatial heterogeneity, this study endeavors to obtain high-precision data. The boundaries of Shanghai are sourced from the National Geographic Information Public Service Platform (https://www.tianditu.gov.cn/), while the building vector data is obtained from the Figshare website. This data was measured by Zhang et al. between 2022 and 2024 and represents building vector data with a resolution of 0.3–1 m (0.5 m in the core area) [60]. The population data is sourced from the Landscan website for the year 2023, road data is sourced from the 2023 road vector data on the OSM website, POI data and bus stop data are sourced from the 2023 Gaode Maps, and land use data is sourced from the Zenodo website, provided by Li et al. as 1 m land use data for China [61]. Green space pattern data is based on 1 m urban land use data, calculated using the landscapemetrics package in R. The obtained or calculated indicator data is scaled and converted to 300 m by 300 m grid cells.

2.3. Construction of Research Indicators

To comprehensively assess the spatial coupling relationship between the built environment and green space patterns in cities, this study developed the Built Environment Index (BEI) and the Green Space Pattern Index (GSPI) based on an indicator system. The BEI reflects built environment characteristics such as building density, road traffic, and human activity within urban areas, measuring the intensity of urban development and the concentration of human activity. We developed a comprehensive set of BEI indicators based on the 5D framework proposed by Ewing and Cervero [62]. The GSPI is used to measure the spatial structure, scale, and connectivity of urban green spaces, reflecting the integrity and ecological functions of the green space system. This index is based on the objectives of spatial heterogeneity analysis [63]. All candidate indicators selected to reflect the GSPI have undergone multiple collinearity screening, and variables with a variance inflation factor (VIF) exceeding 5 have been excluded.
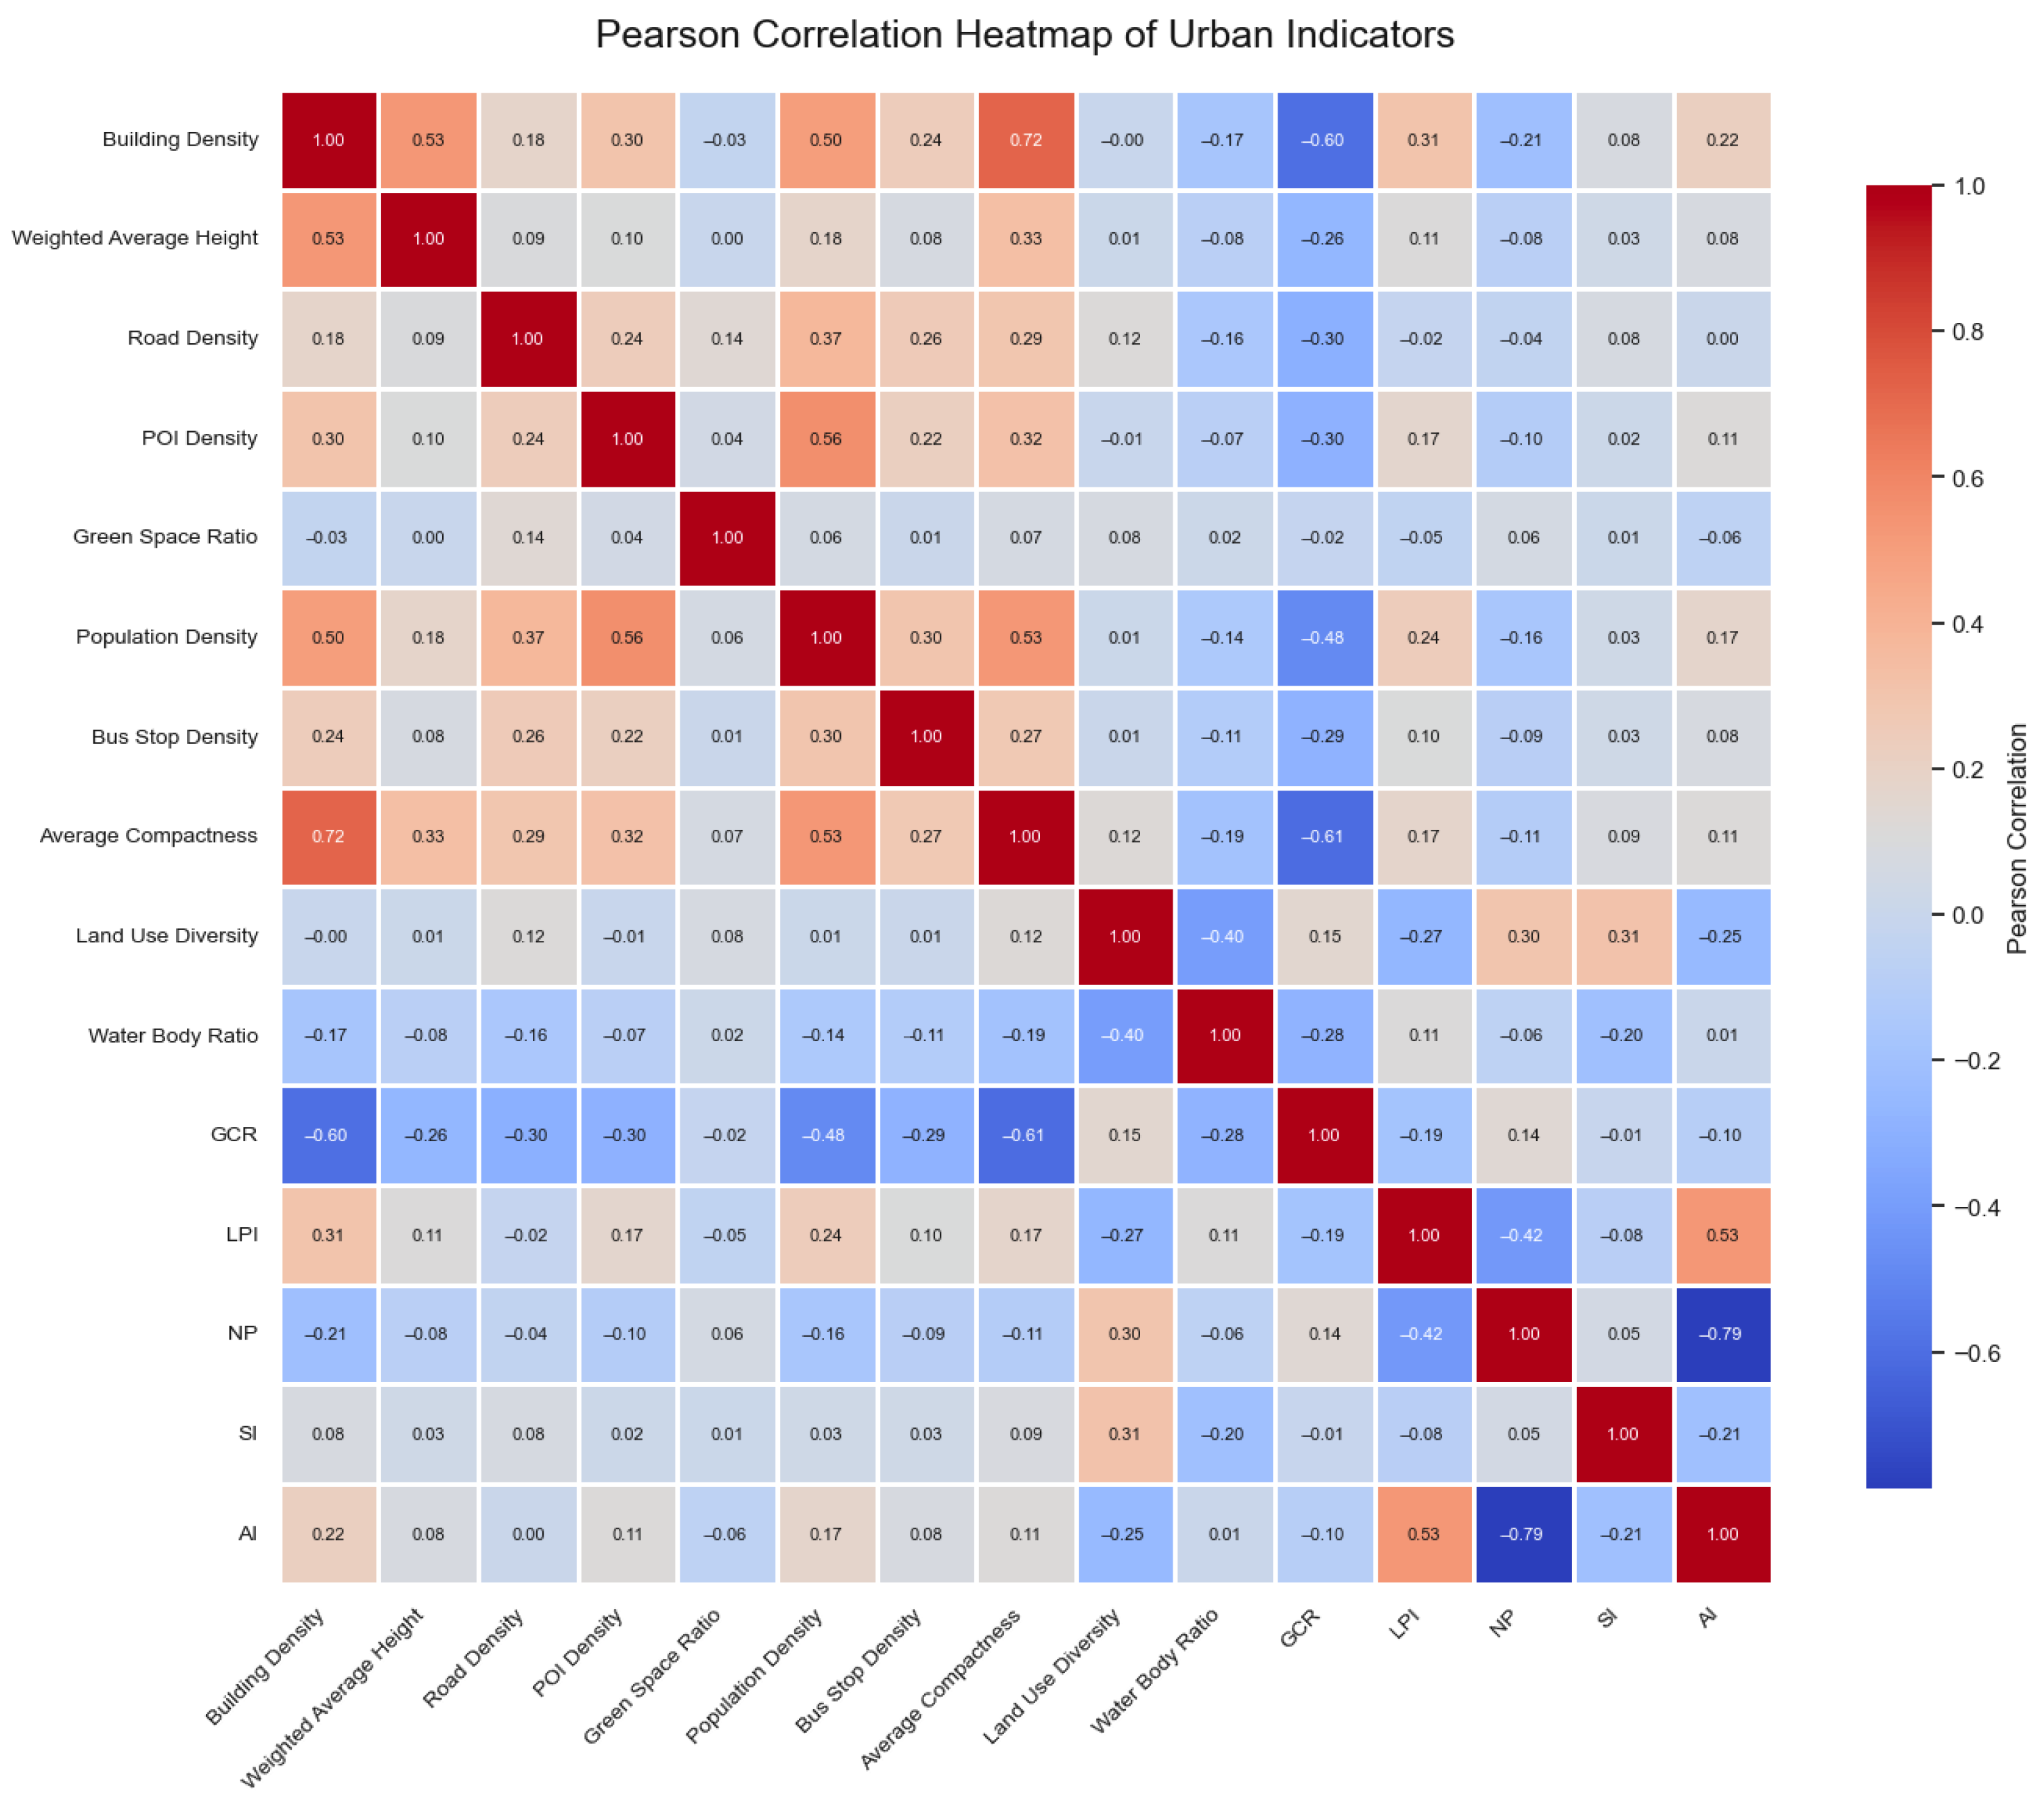
The final indicator system is summarized in Table 1. To further ensure the independence of variables used in clustering and modeling, we visualized the inter-variable correlation structure using a Pearson correlation heatmap (Figure 2). The results indicate that most variables fall within a moderate to low correlation range (between −0.5 and 0.5), suggesting minimal linear redundancy and acceptable discriminative capacity. Although some variables (e.g., building density and average compactness) exhibit moderate correlation, they remain within reasonable limits and do not pose significant multicollinearity concerns.
Among these, building density is calculated as the ratio of building floor area to the area of the unit grid, road density is calculated as the ratio of road length to the area of the unit grid, POI density is calculated as the number of POIs divided by the area of the unit grid, population density is converted from raw data to the unit grid, bus stop density is calculated as the number of bus stops divided by the area of the unit grid, and water body ratio is calculated as the ratio of water body area to the area of the unit grid. Land use diversity refers to the number of land use types within a unit grid. Weighted average height refers to the average building height within a unit grid, calculated using building area weighting to prevent extreme outliers from being exaggerated. Average compactness refers to the complexity of building shapes, with the specific calculation formula as follows:
C a v g = 1 n i = 1 n 4 π A i P i 2
Theorem 1.
In the formula, C a v g is the average compactness, A is the building area, n is the number of buildings within the unit grid, A i is the area of the i -th building, P i is the boundary length of the i -th building, and 4 π A i P i 2 is the compactness of the i -th building (with a circle as the ideal type).

2.3.1. Attention Mechanism and Deep Neural Network (DNN) for Weight Calculation

To determine the weights of each indicator and construct the comprehensive indices (BEI and GLPI), this study integrates the attention mechanism into a deep neural network framework (DNN-Attention), following a data-driven and interpretable modeling approach [64]. Unlike traditional methods such as the Entropy Weight Method (EWM) or Principal Component Analysis (PCA), which rely on the distributional characteristics of variables, the DNN-Attention model captures the nonlinear relationships among high-dimensional indicators and adaptively learns their contribution to the overall performance.
The Coupling Coordination Model (CCM) is an effective method for characterizing the interaction dynamics among different subsystems within urban systems [65]. It has been widely applied to assess the co-evolution and synergy among natural, social, and economic systems [66].
In this study, the CCM is employed to quantitatively evaluate the degree of coordination between the Built Environment Index (BEI) and the Green Space Pattern Index (GSPI), with the Coupling Coordination Degree (CCD) being calculated to reveal the interaction state between urban development (built environment) and ecological space (green space pattern) [67]. The CCD is a composite metric that reflects both the intensity of interaction (coupling) and the level of harmonious development (coordination) between two subsystems. A higher CCD value indicates better synergy and balance between urban construction and green space, while a lower value implies spatial mismatch or lack of integration.
The model consists of three main computational steps:
Coupling Degree (C)
The coupling degree function is first established to quantify the intensity of interaction between systems. It is defined as:
C = U 1 × U 2 U 1 + U 2 2 / 4 0.5
Theorem 2.
Here, U1 and U2 represent the normalized composite indices of the built environment and green space patterns in Shanghai, respectively. Both range within [0, 1]; A higher value of C indicates a stronger degree of interaction between the two subsystems.
Comprehensive Benefit Index (T)
T = a × U 1 + b × U 2
Theorem 3.
In this study, both the built environment and green space patterns are assumed to hold equal importance in the urban system. Therefore, the weights are set as a = b = 0.5, reflecting a balanced development perspective.
Coupling Coordination Degree (D)
The final coordination level D is determined by integrating the coupling degree C and the comprehensive benefit index T:
D = C × T
Theorem 4.
The value of DDD, also known as the coupling coordination degree (CCD), lies within [0, 1]. A value closer to 1 indicates a higher level of coordinated development between the built environment and the green space pattern. CCD provides a quantitative basis for understanding the synergetic evolution of urban spatial and ecological subsystems.

2.3.2. K-Means Clustering Analysis

The K-Means algorithm is an unsupervised learning method based on distance metrics, capable of classifying spatial units based on their similarity in high-dimensional feature space. It iteratively minimizes intra-cluster variance while maximizing inter-cluster variance, ultimately assigning each spatial unit to the most similar cluster. In this study, we do not reduce the dimensionality of the original indicators. Instead, we directly input the full set of built environment and green space pattern indicators into the clustering model, preserving as much original spatial coupling information as possible. This high-dimensional approach enables finer-grained detection of coupling relationships. Then, we went through the elbow coefficient analysis, and the results showed that the K value decreases sequentially in the interval from 2 to 10 and the SSE decreases significantly for K = 3–4. Combined with the results of silhouette coefficient analysis, 2–3 values are high-value intervals, so K = 3 is a statistically reasonable and spatially interpretable choice.
Three coupling types were identified:
  • Dispersed Natural Zone: Low in both urban and ecological development; includes scattered natural areas like wetlands and grasslands with weak spatial integration.
  • Urban Dominated Coordination Zone: High built environment intensity with moderate green land support; coordination is maintained through compact development and vertical greening.
  • Green-Oriented Transition Zone: Rich in green space but underdeveloped in urban infrastructure; low coordination reflects untapped synergy potential.

2.3.3. Nonlinear Modeling and Interpretation

LightGBM, a gradient boosting framework developed by Ke et al. [68], is known for its high efficiency and strong robustness to outliers and noise. It is especially suitable for modeling complex urban systems with many variables and high-dimensional features. However, as machine learning models are often treated as “black boxes,” this study adopts SHAP (SHapley Additive Explanations) to interpret the marginal contribution of each input variable. Derived from cooperative game theory, the SHAP method attributes feature importance based on Shapley values, allowing for a consistent and transparent explanation of model predictions. Through SHAP value ranking and distribution analysis, the key drivers, variable interactions, influence strengths, and sensitivity intervals can be clearly identified.
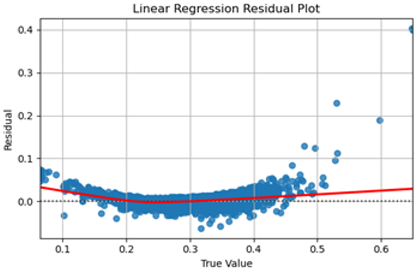
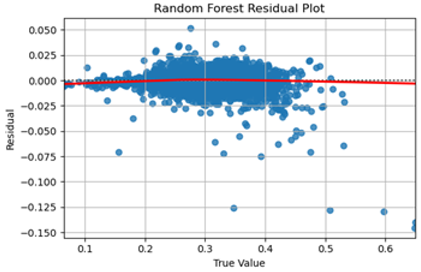
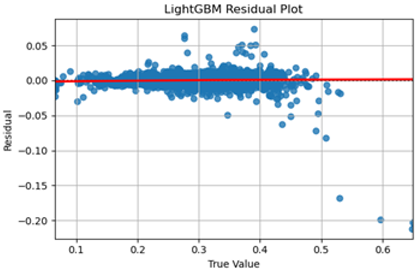
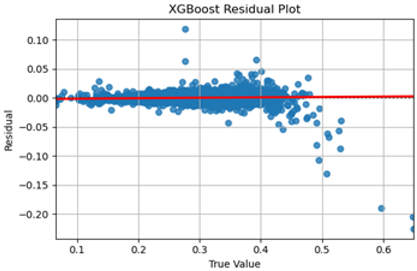
Before selecting the final prediction model, we compared linear regression, Random Forest, LightGBM, and XGBoost using the study data. As shown in Table 2, LightGBM demonstrated the highest R2 value and the lowest errors in other evaluation metrics, confirming its superior performance. Residual plots for LightGBM and XGBoost also showed stable, symmetric distributions centered around zero across the fitting range. Based on a comprehensive evaluation of all performance indicators, LightGBM was chosen as the modeling tool for further analysis.

2.4. Research Technical Framework Roadmap

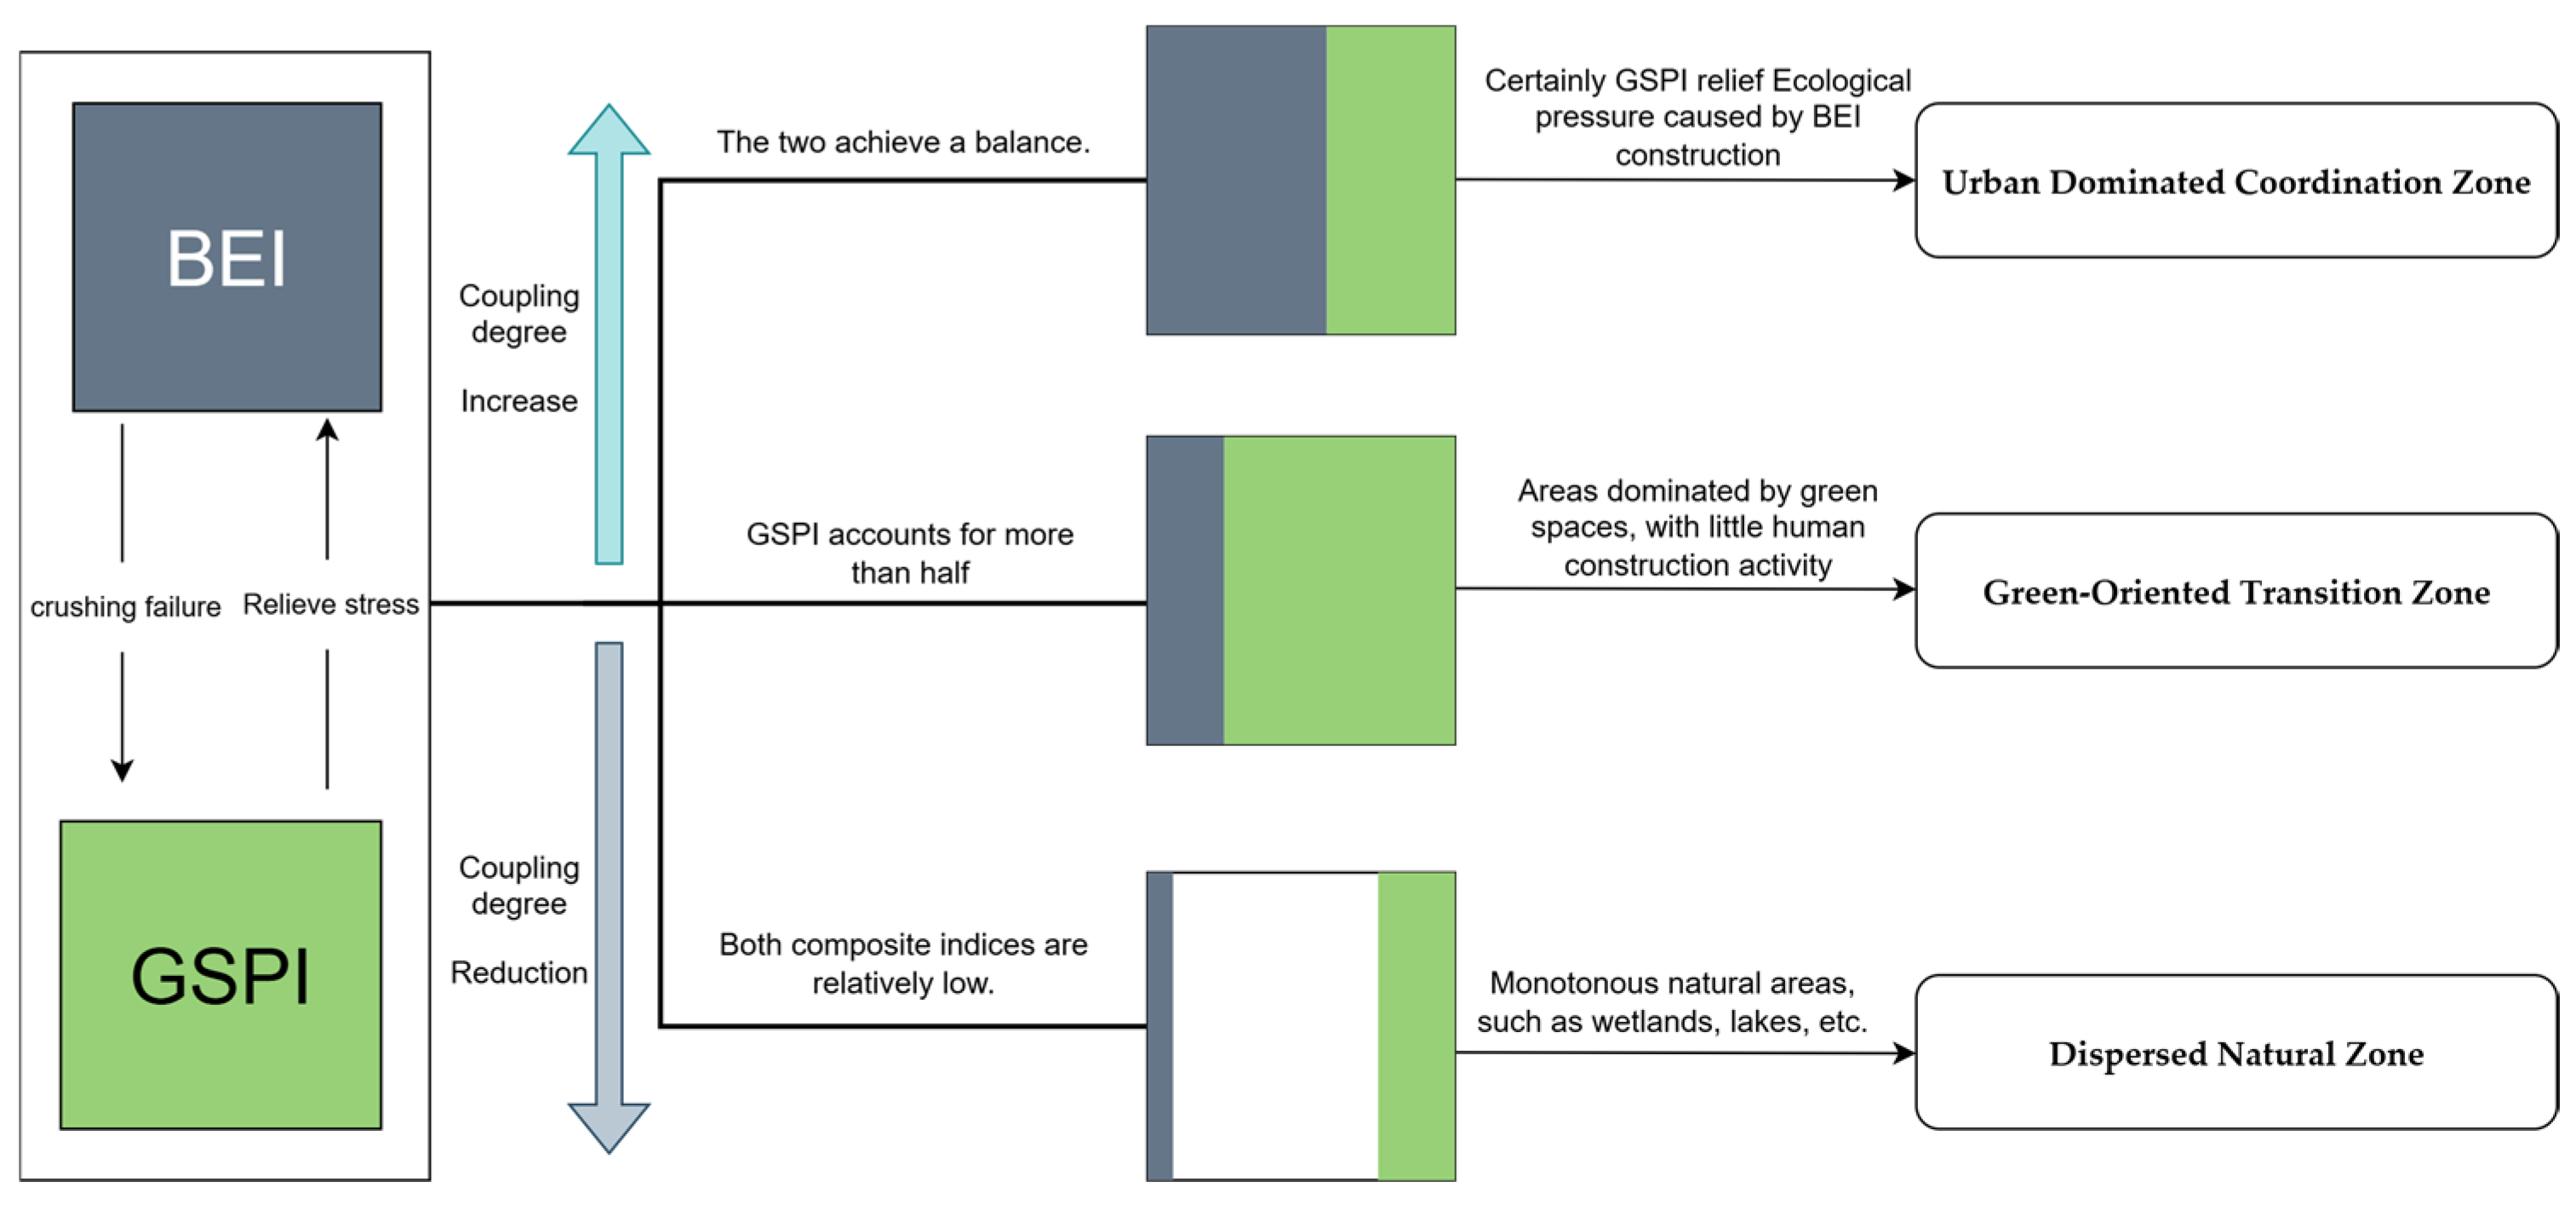
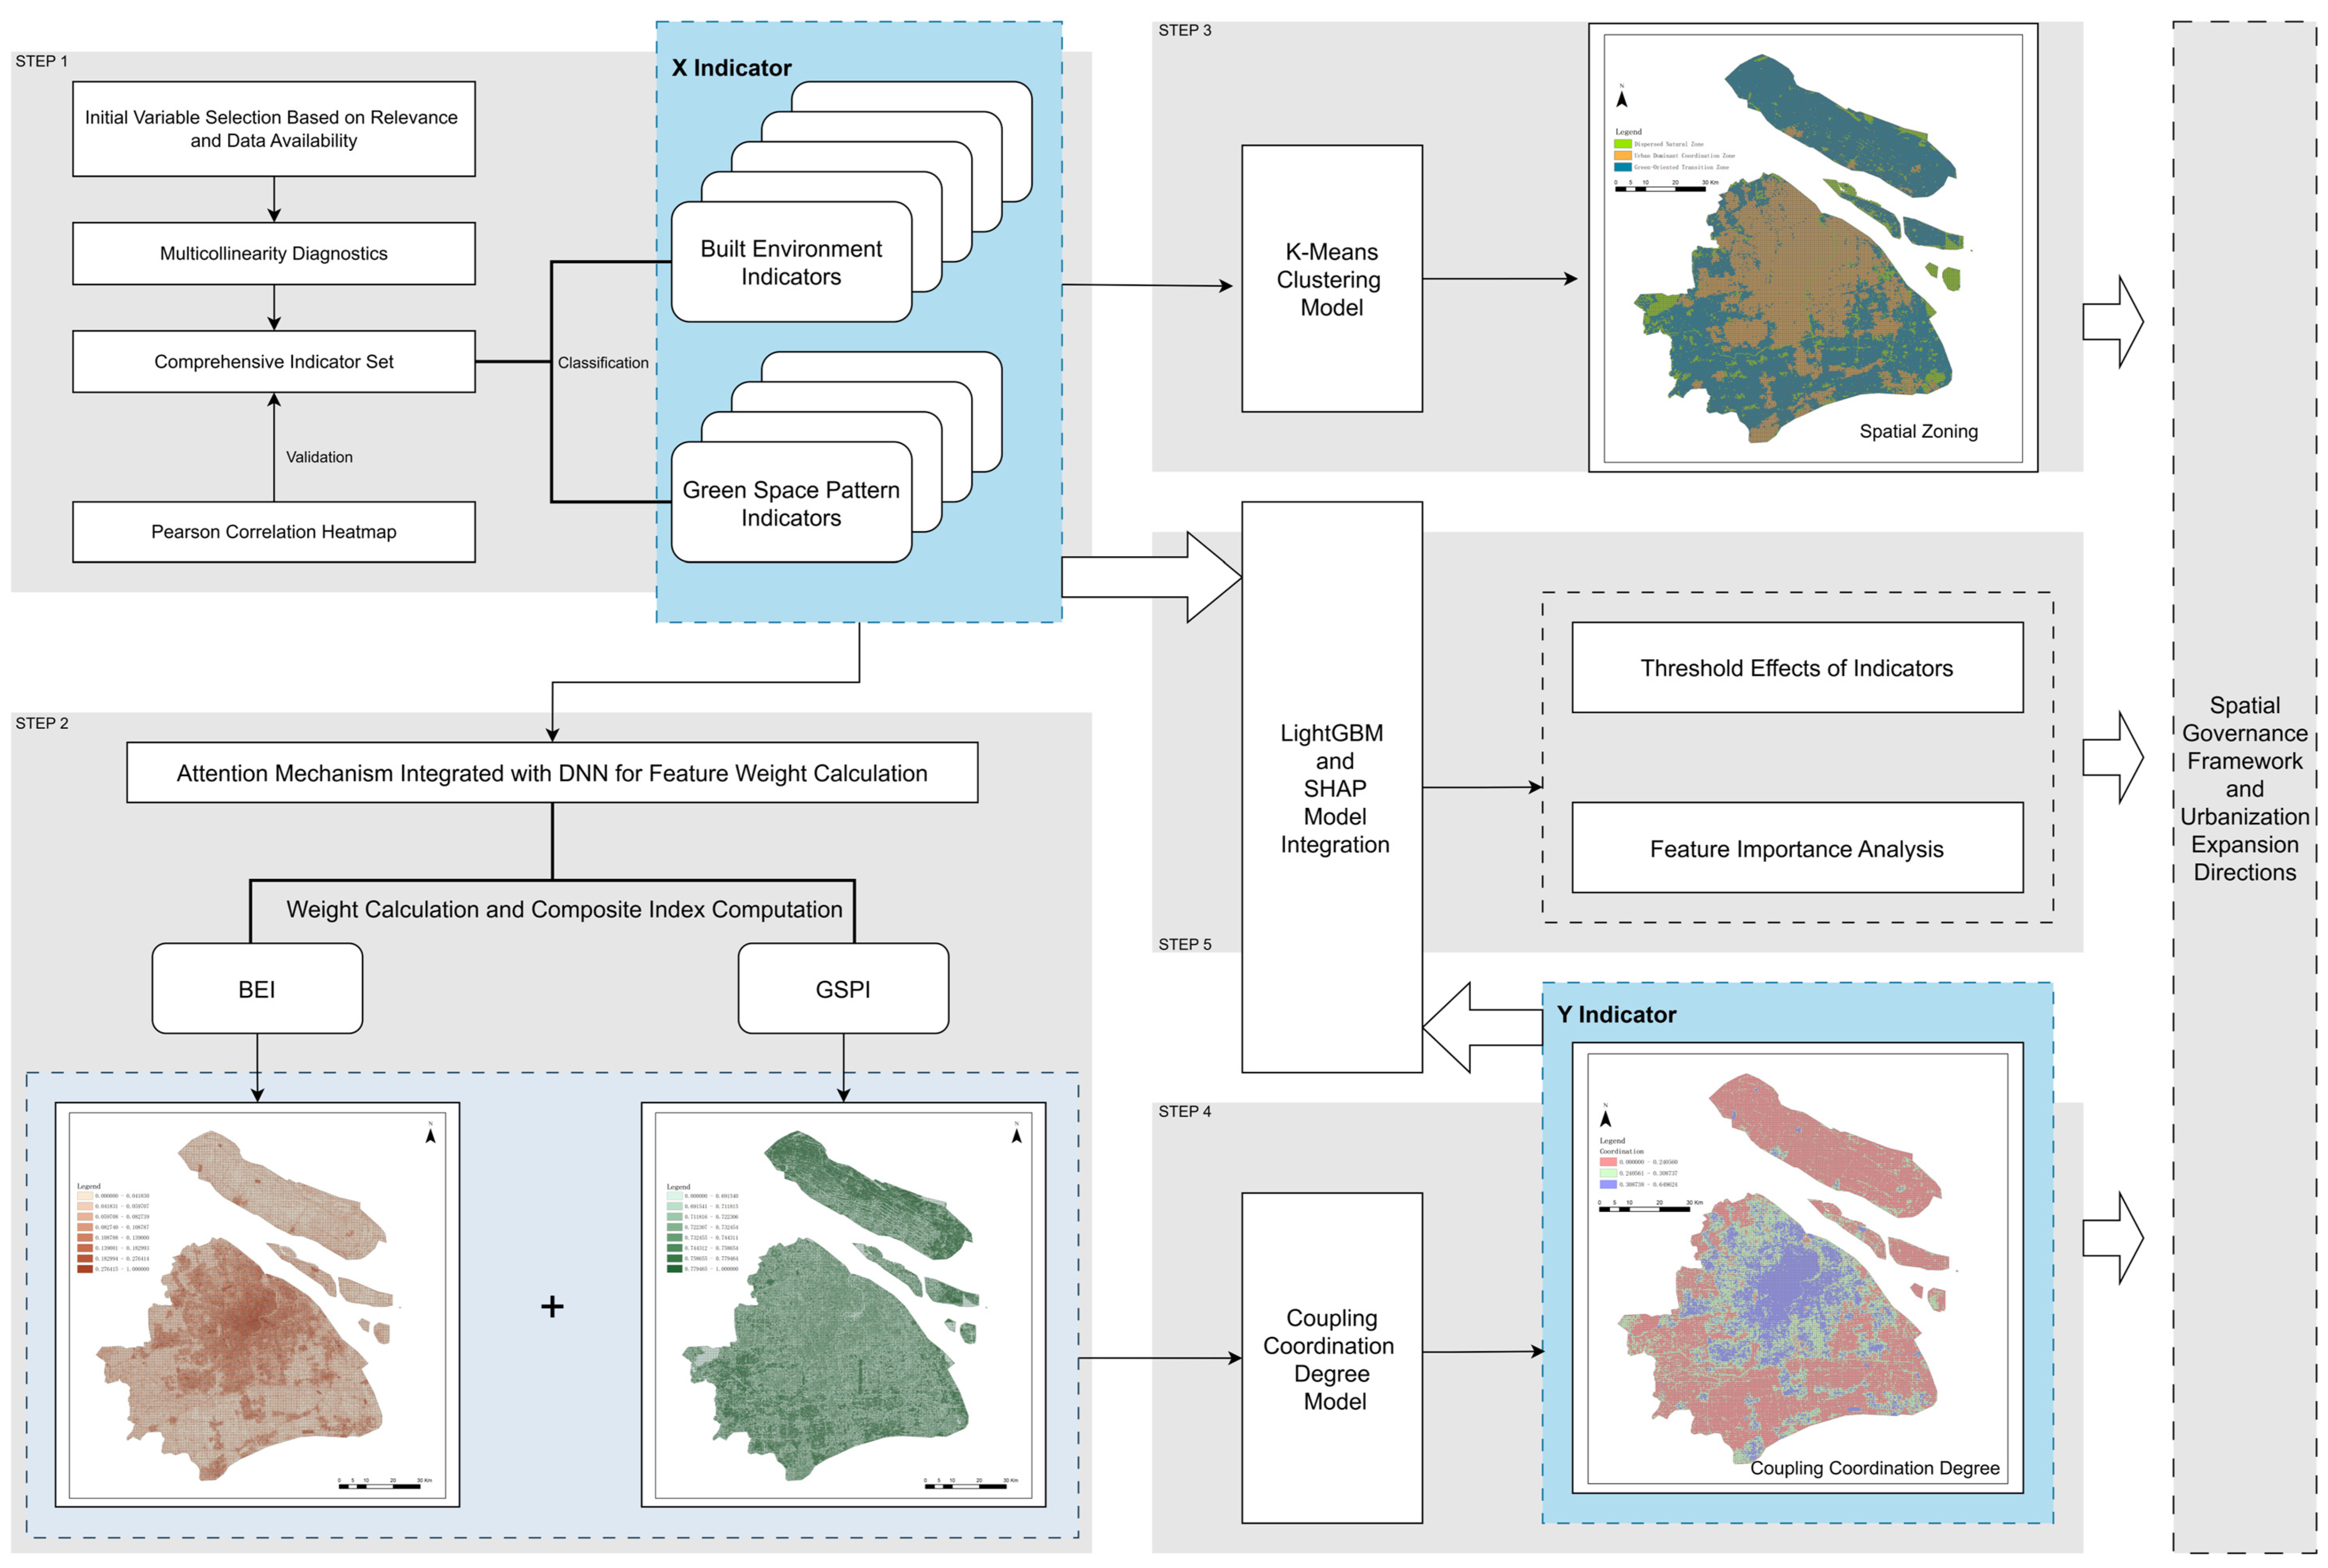
This paper first constructs the Built Environment Index (BEI) and the Green Space Pattern Index (GSPI), then uses the DNN + Attention model to calculate their composite index. Based on their spatial coupling logic relationship (Figure 3), we use the coupling coordination degree model to calculate their coordination degree and employ the K-Means clustering model to identify three distinct regions. By combining the composite index and coordination degree, we analyze the characteristics of different clustering regions. Finally, we use the lightGBM + SHAP model to analyze the influence mechanisms of each indicator on coordination. Based on all research results, we propose spatial governance measures and urban development directions for different cluster regions (Figure 4).

3. Results

3.1. Spatial Distribution Characteristics of the Comprehensive Indices for Built Environment and Green Space Pattern

After developing the computational code for the DNN-Attention model, we utilized Python 3.12.7 to calculate the composite indices for both the built environment and green space pattern. The weight calculation results are presented in Table 3 and Table 4. Among the built environment indicators, the top five contributors are the proportion of water bodies, weighted average building height, density of bus stops, average compactness, and proportion of green space, each with a weight coefficient of around 0.1. For the green space pattern indicators, the Largest Patch Index (LPI) holds the highest weight, followed by the Green Coverage Ratio (GCR), and then the Aggregation Index (AI), with all three indicators assigned weights exceeding 0.2.
In the weight analysis of building environment indicators, the water body ratio exhibits the highest attention weight (approximately 0.115), indicating that water bodies have a significant influence on the comprehensive assessment of urban built environment quality. This phenomenon is primarily due to water bodies being a key component of urban ecosystems, not only enhancing the ecological service functions of cities but also significantly influencing the surrounding building forms and spatial layout. The presence of water bodies is often associated with higher environmental quality and livability, hence their higher weighting in deep neural network models.
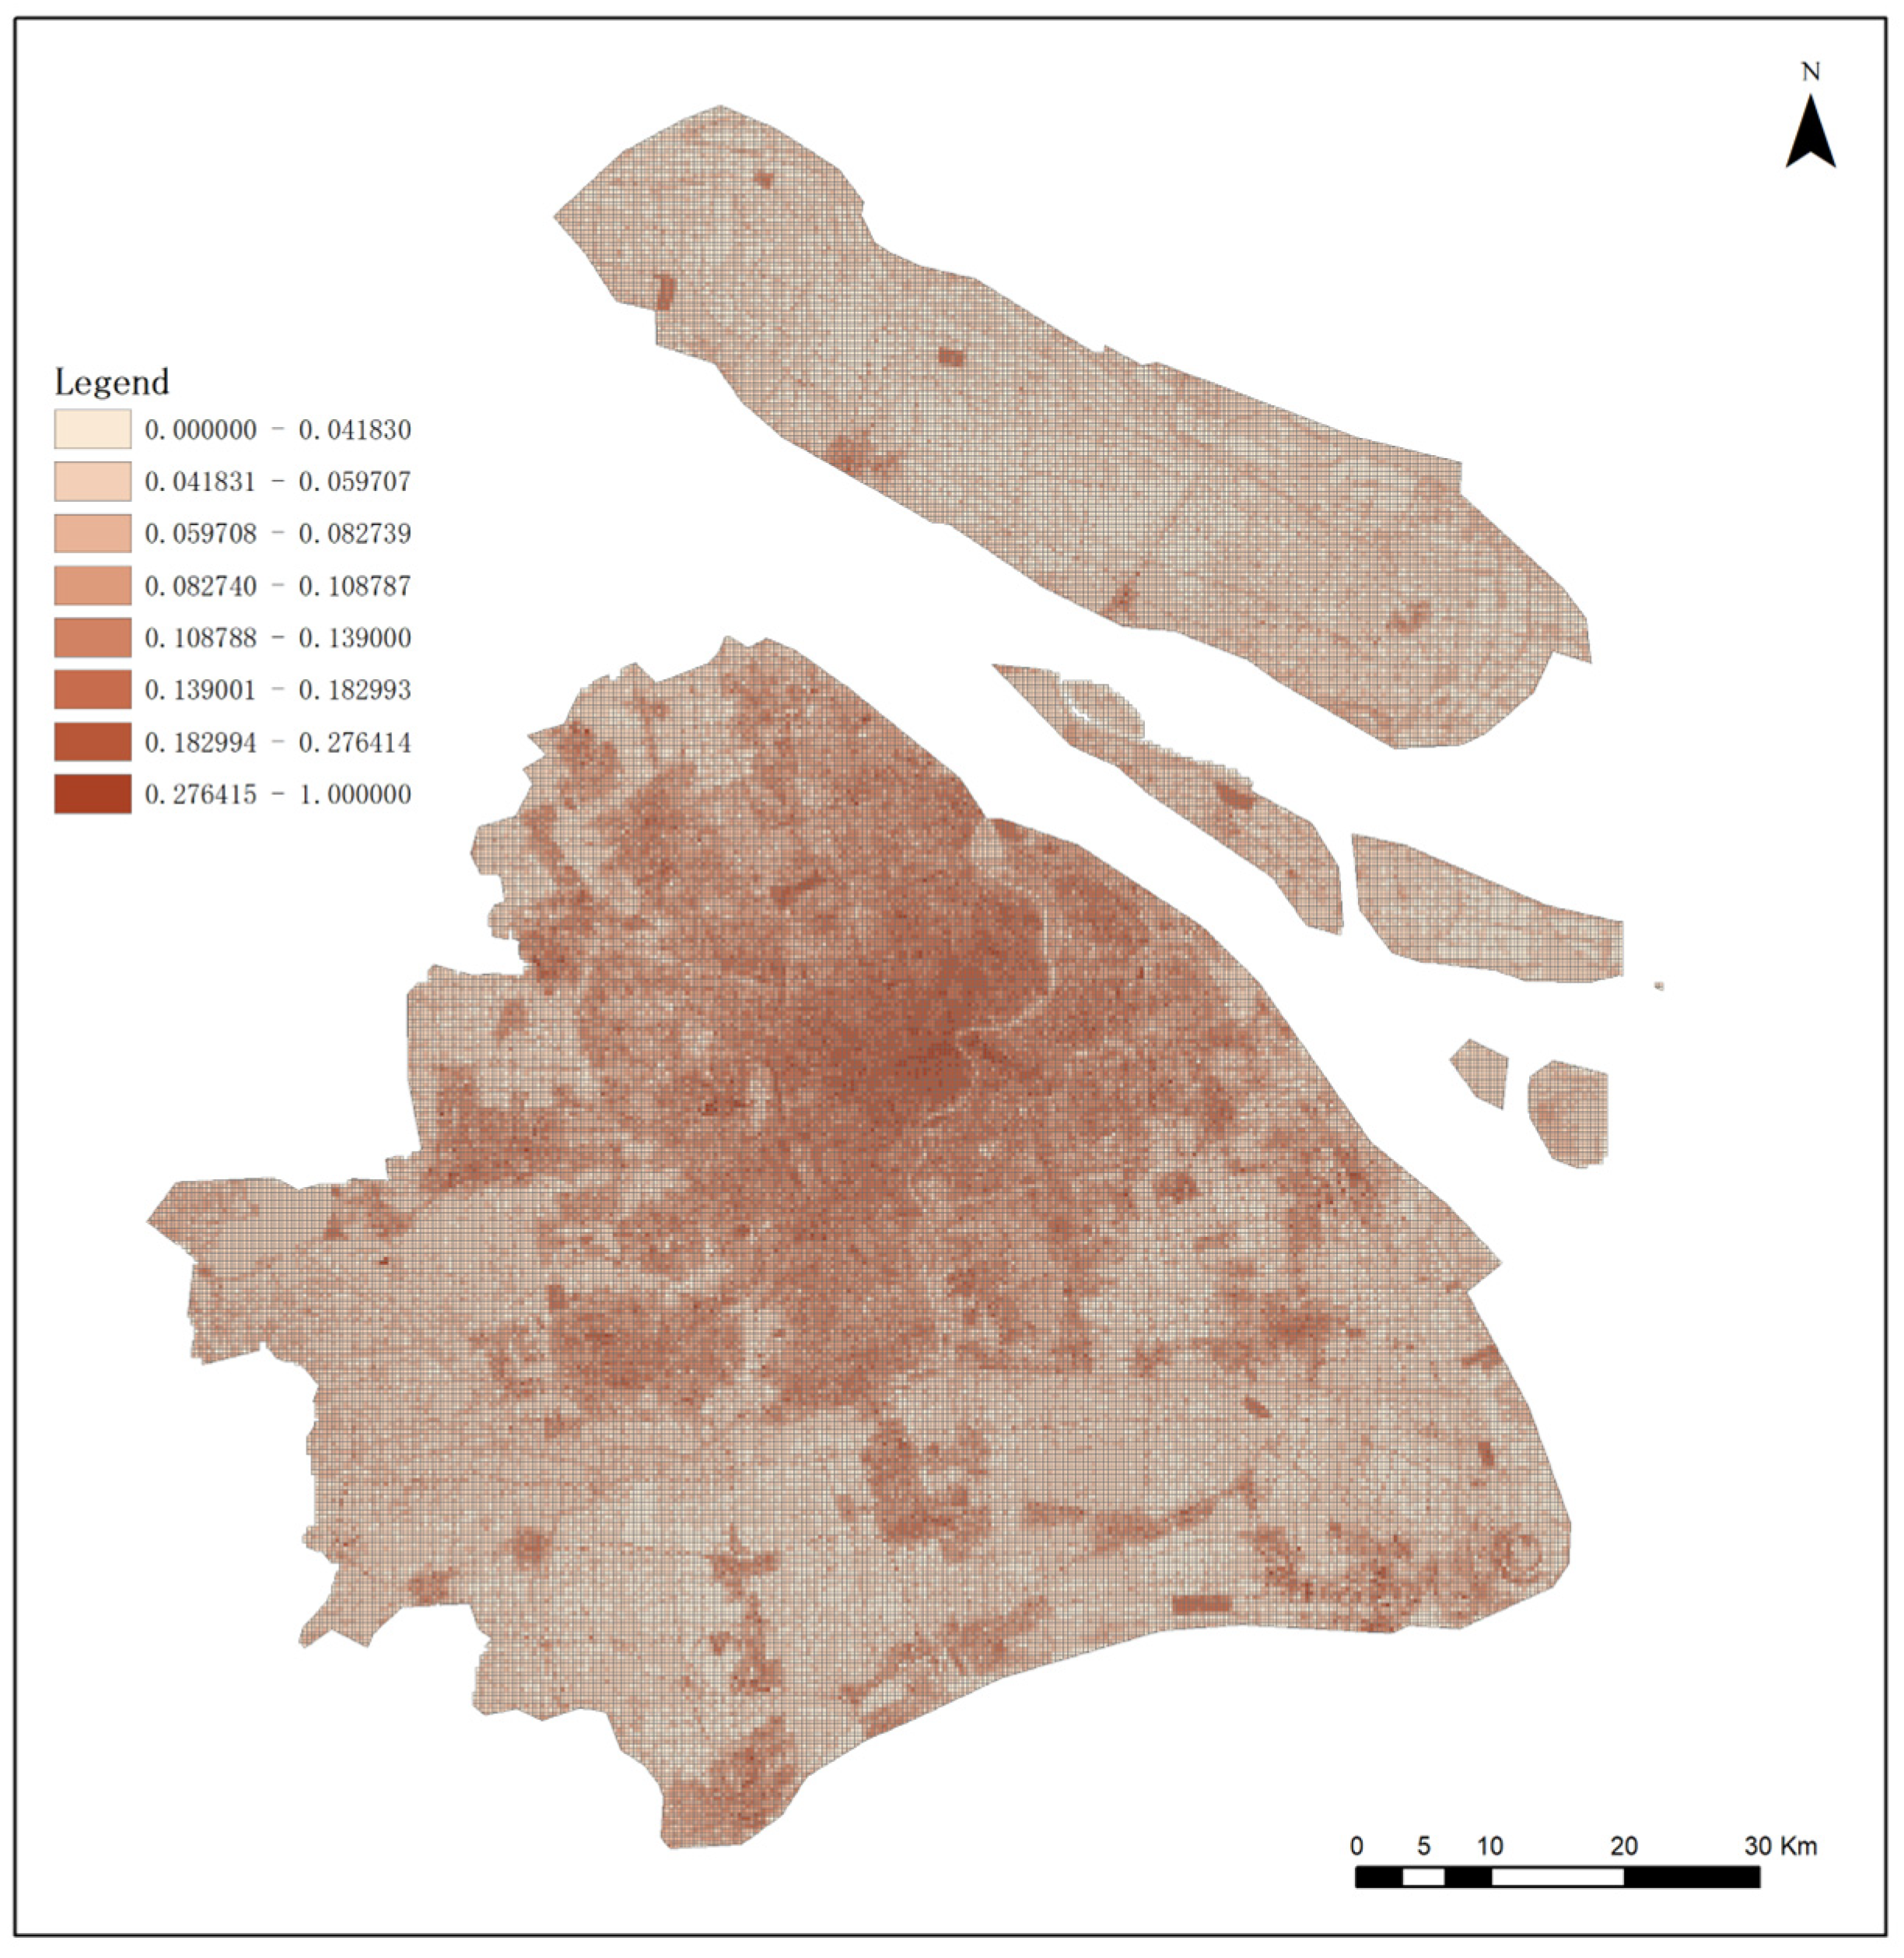
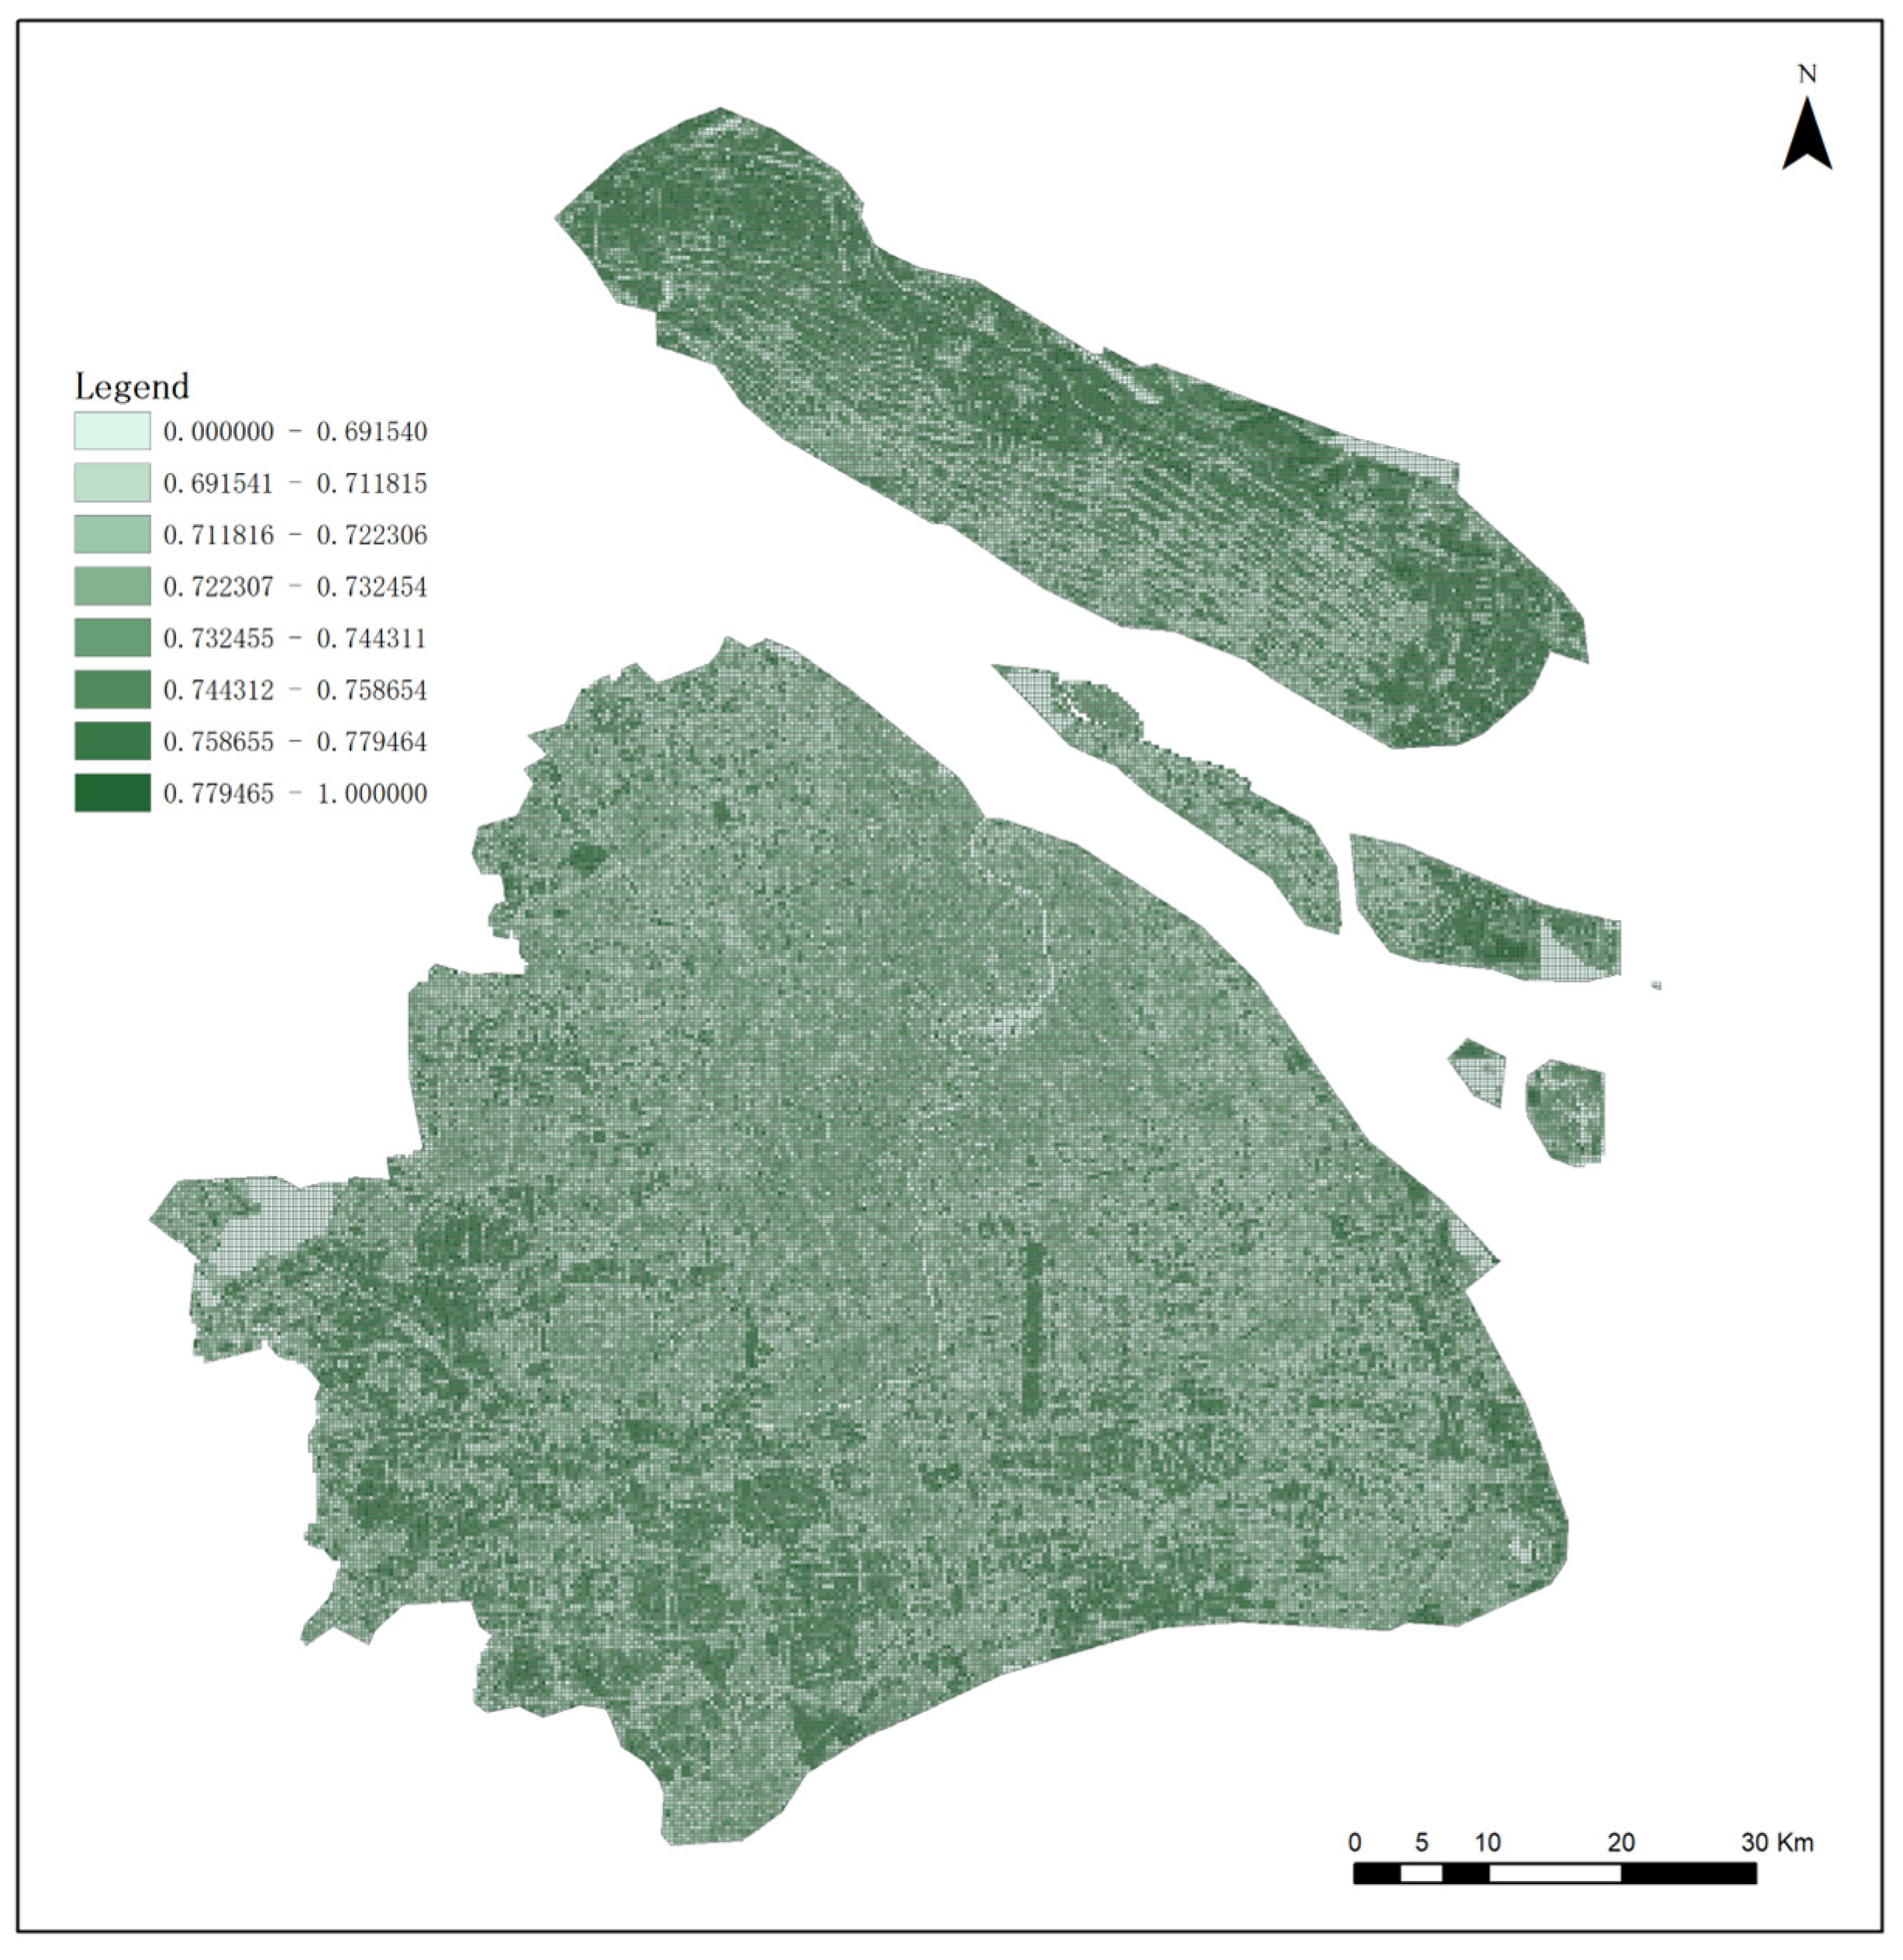
We integrated a composite index calculation module into the code, and after normalizing the resulting composite indices, imported them into ArcGIS 10.8.1 software for visualization using the natural breaks classification method, divided into eight levels. The results are shown in Figure 5 and Figure 6. The spatial variation in the composite Built Environment Index is pronounced, with high-value areas largely coinciding with the built-up urban zones [69]. The highest index values are concentrated in the northeastern city center, exhibiting a distinct clustering pattern consistent with the direction of urban development [70]. In contrast, the green space pattern in Shanghai predominantly exhibits moderate index values across most regions. High-value areas are distributed mainly in the peripheral suburban zones in the southwest and northeast. The high-value zones in the southwest are fragmented, while those in the northeast display a more linear spatial pattern. The central urban areas show a mixture of moderate and lower index values, with moderate values predominating.

3.2. Spatial Clustering Patterns and Coupling Relationship Identification

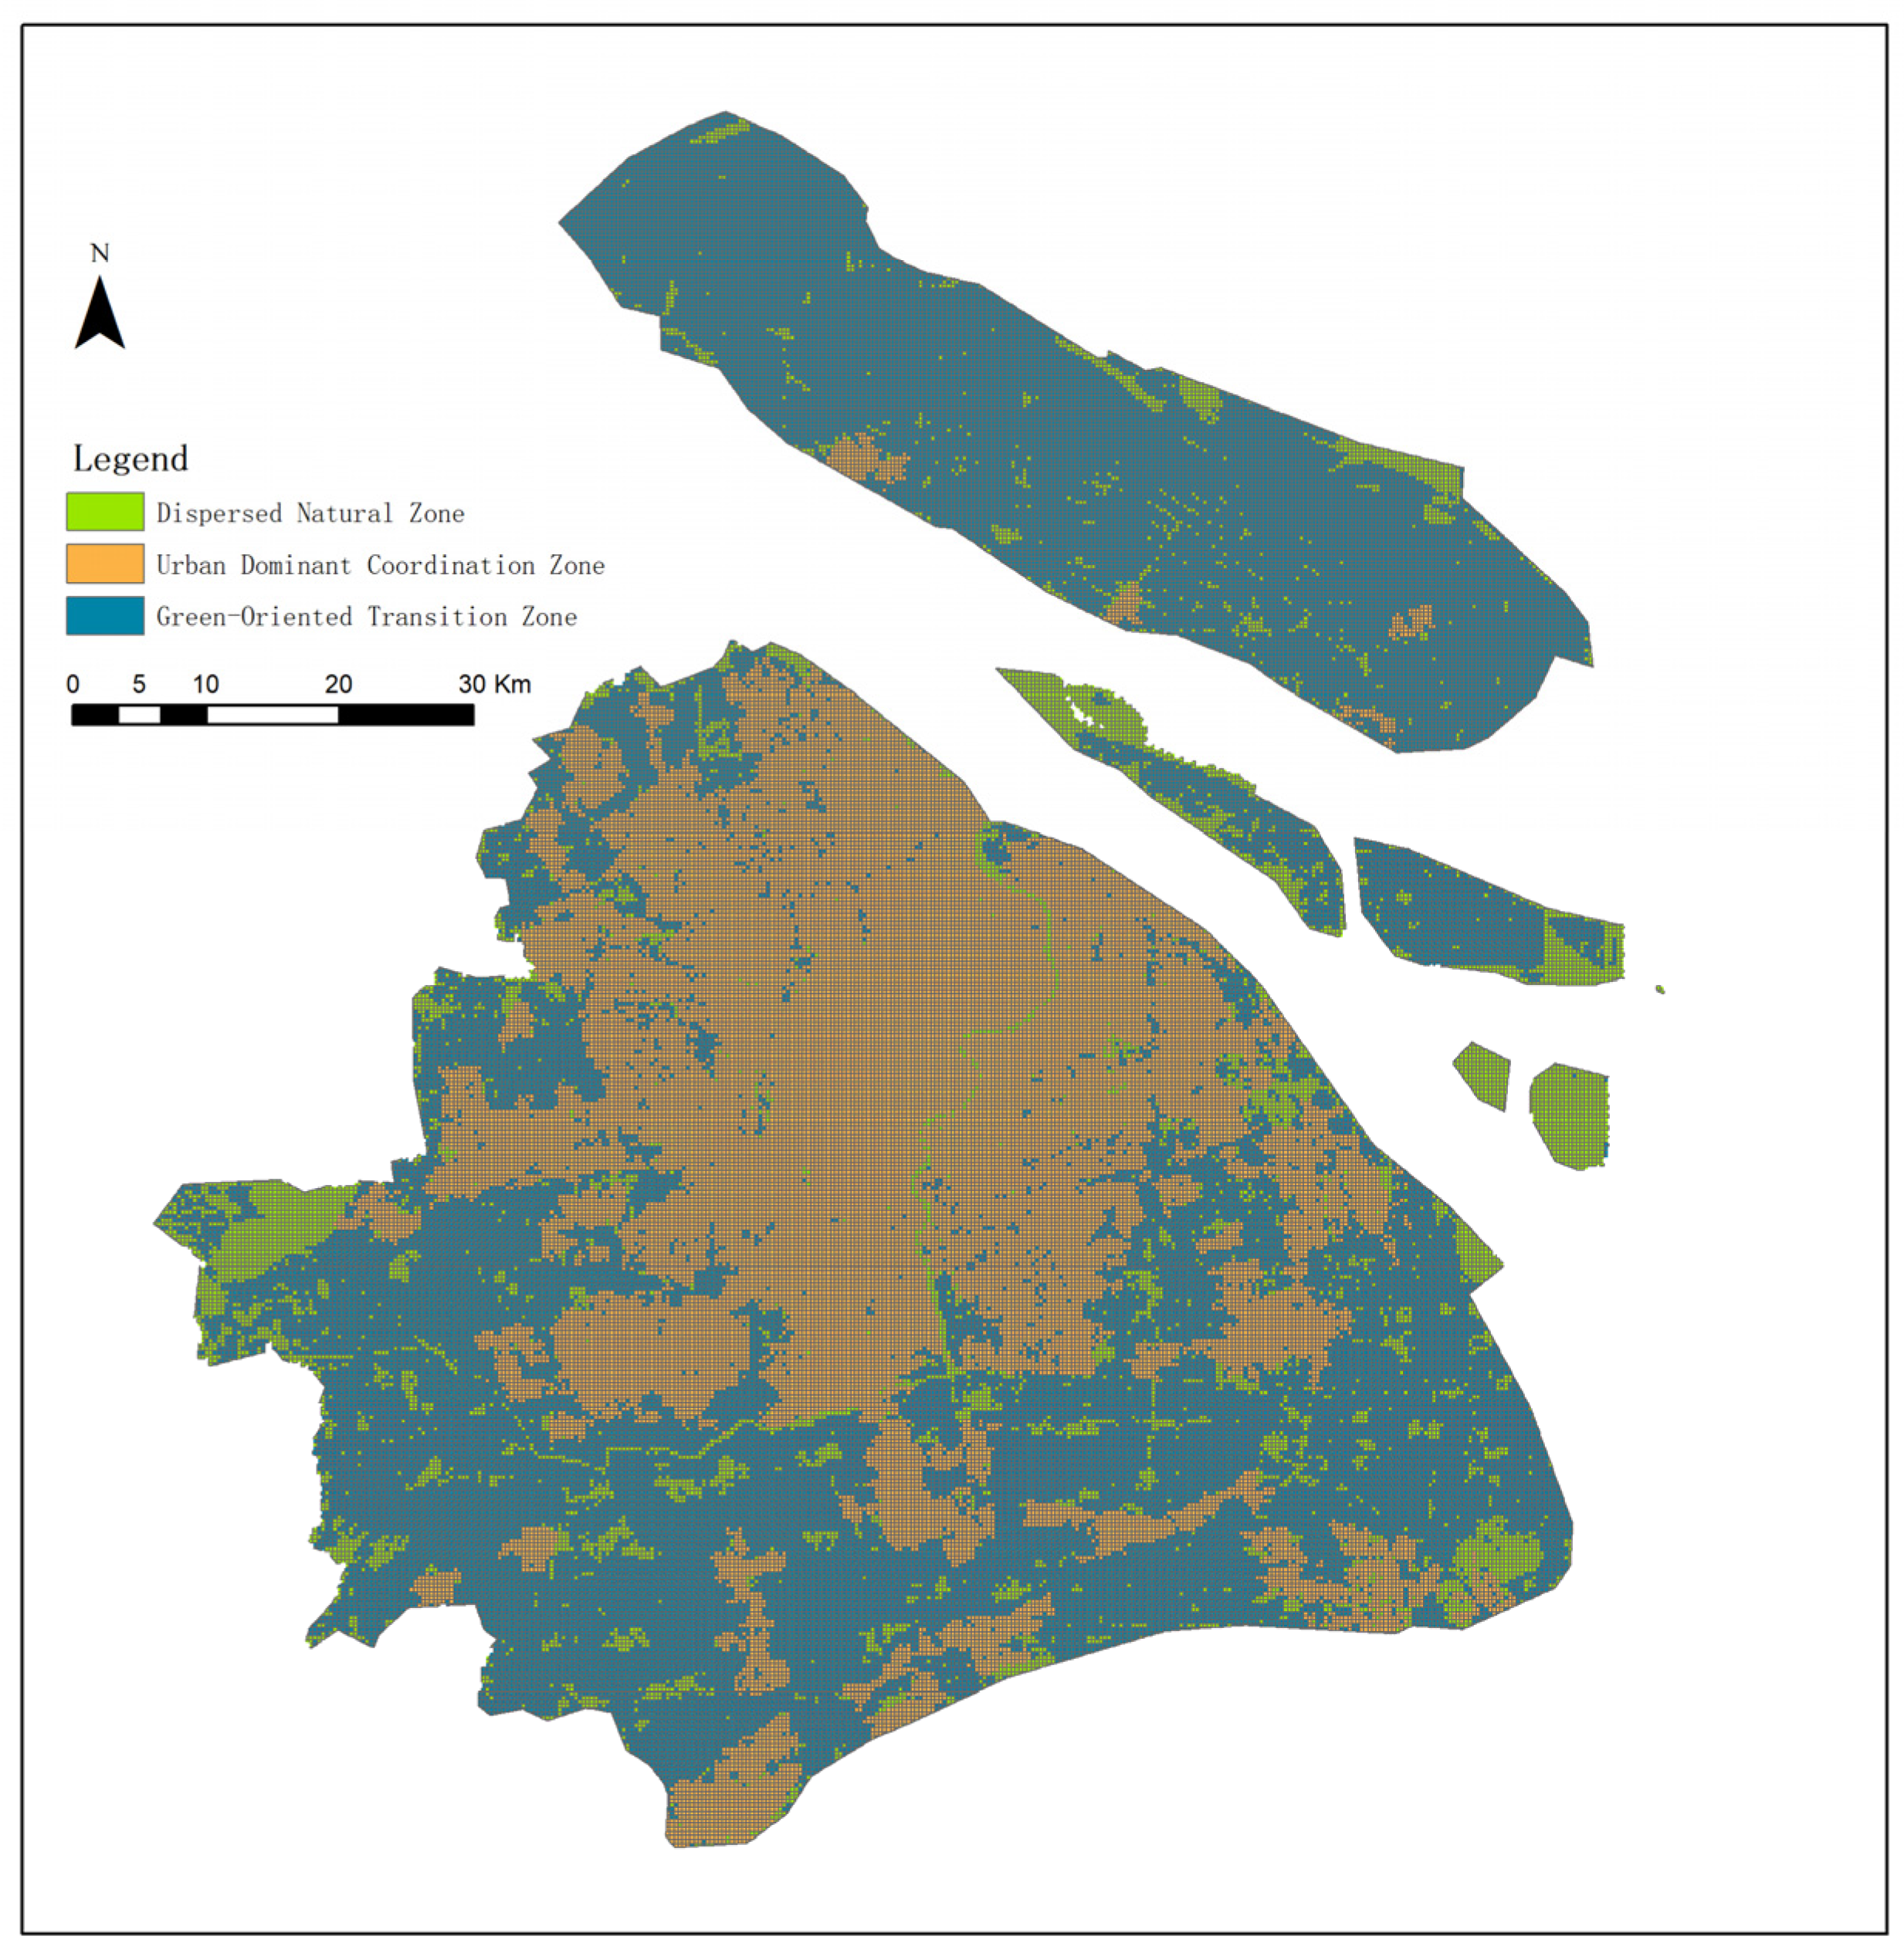
K-Means, an unsupervised machine learning algorithm, was applied using Python to classify the spatial units into three distinct clusters: the Dispersed Natural Zone, Urban Dominant Coordination Zone, and Green-Oriented Transition Zone (Figure 7). Visualization conducted in ArcGIS revealed that the Dispersed Natural Zone is scattered primarily across the urban periphery, with some clusters observed in the eastern, western, and northern outskirts, while the remaining areas exhibit a dispersed distribution. The Green-Oriented Transition Zone is also located mainly in suburban areas, showing clustered patterns in the northern region and a tendency for aggregation in the south, but overall remains relatively dispersed. Comparison with the spatial distribution of the Green Space Pattern Index indicates a strong spatial correspondence between high-value green space areas and this zone. The Urban Dominant Coordination Zone largely overlaps with areas exhibiting high Built Environment Index values, predominantly within the built-up urban core, where clustering is more pronounced compared to the Built Environment Index alone. Furthermore, using the coupling coordination degree (CCD) model to analyze the coordination between the built environment and green space patterns, the CCD values were classified into three levels via the natural breaks method: low coordination (0–0.240560), medium coordination (0.240561–0.308737), and high coordination (0.308738–0.649624). The spatial distribution of these levels, shown in Figure 8, indicates that high coupling primarily concentrates within the Urban Dominant Coordination Zone, with a central cluster radiating outward. Medium coordination areas are highly fragmented and predominantly located adjacent to high coordination zones. Conversely, low coordination zones form extensive clusters mainly in the northern and southern parts of Shanghai, largely coinciding with what we define as the Green-Oriented Transition Zone. The low level of harmonization in this region is mainly due to the fact that the ecological resources are abundant and the built environment is not yet developed, reflecting an “unsynergized” situation that contains a huge potential for ecological development and urban expansion, and therefore requires a different governance strategy.

3.3. Mechanism Analysis of Influencing Factors

3.3.1. Overall Feature Importance Analysis

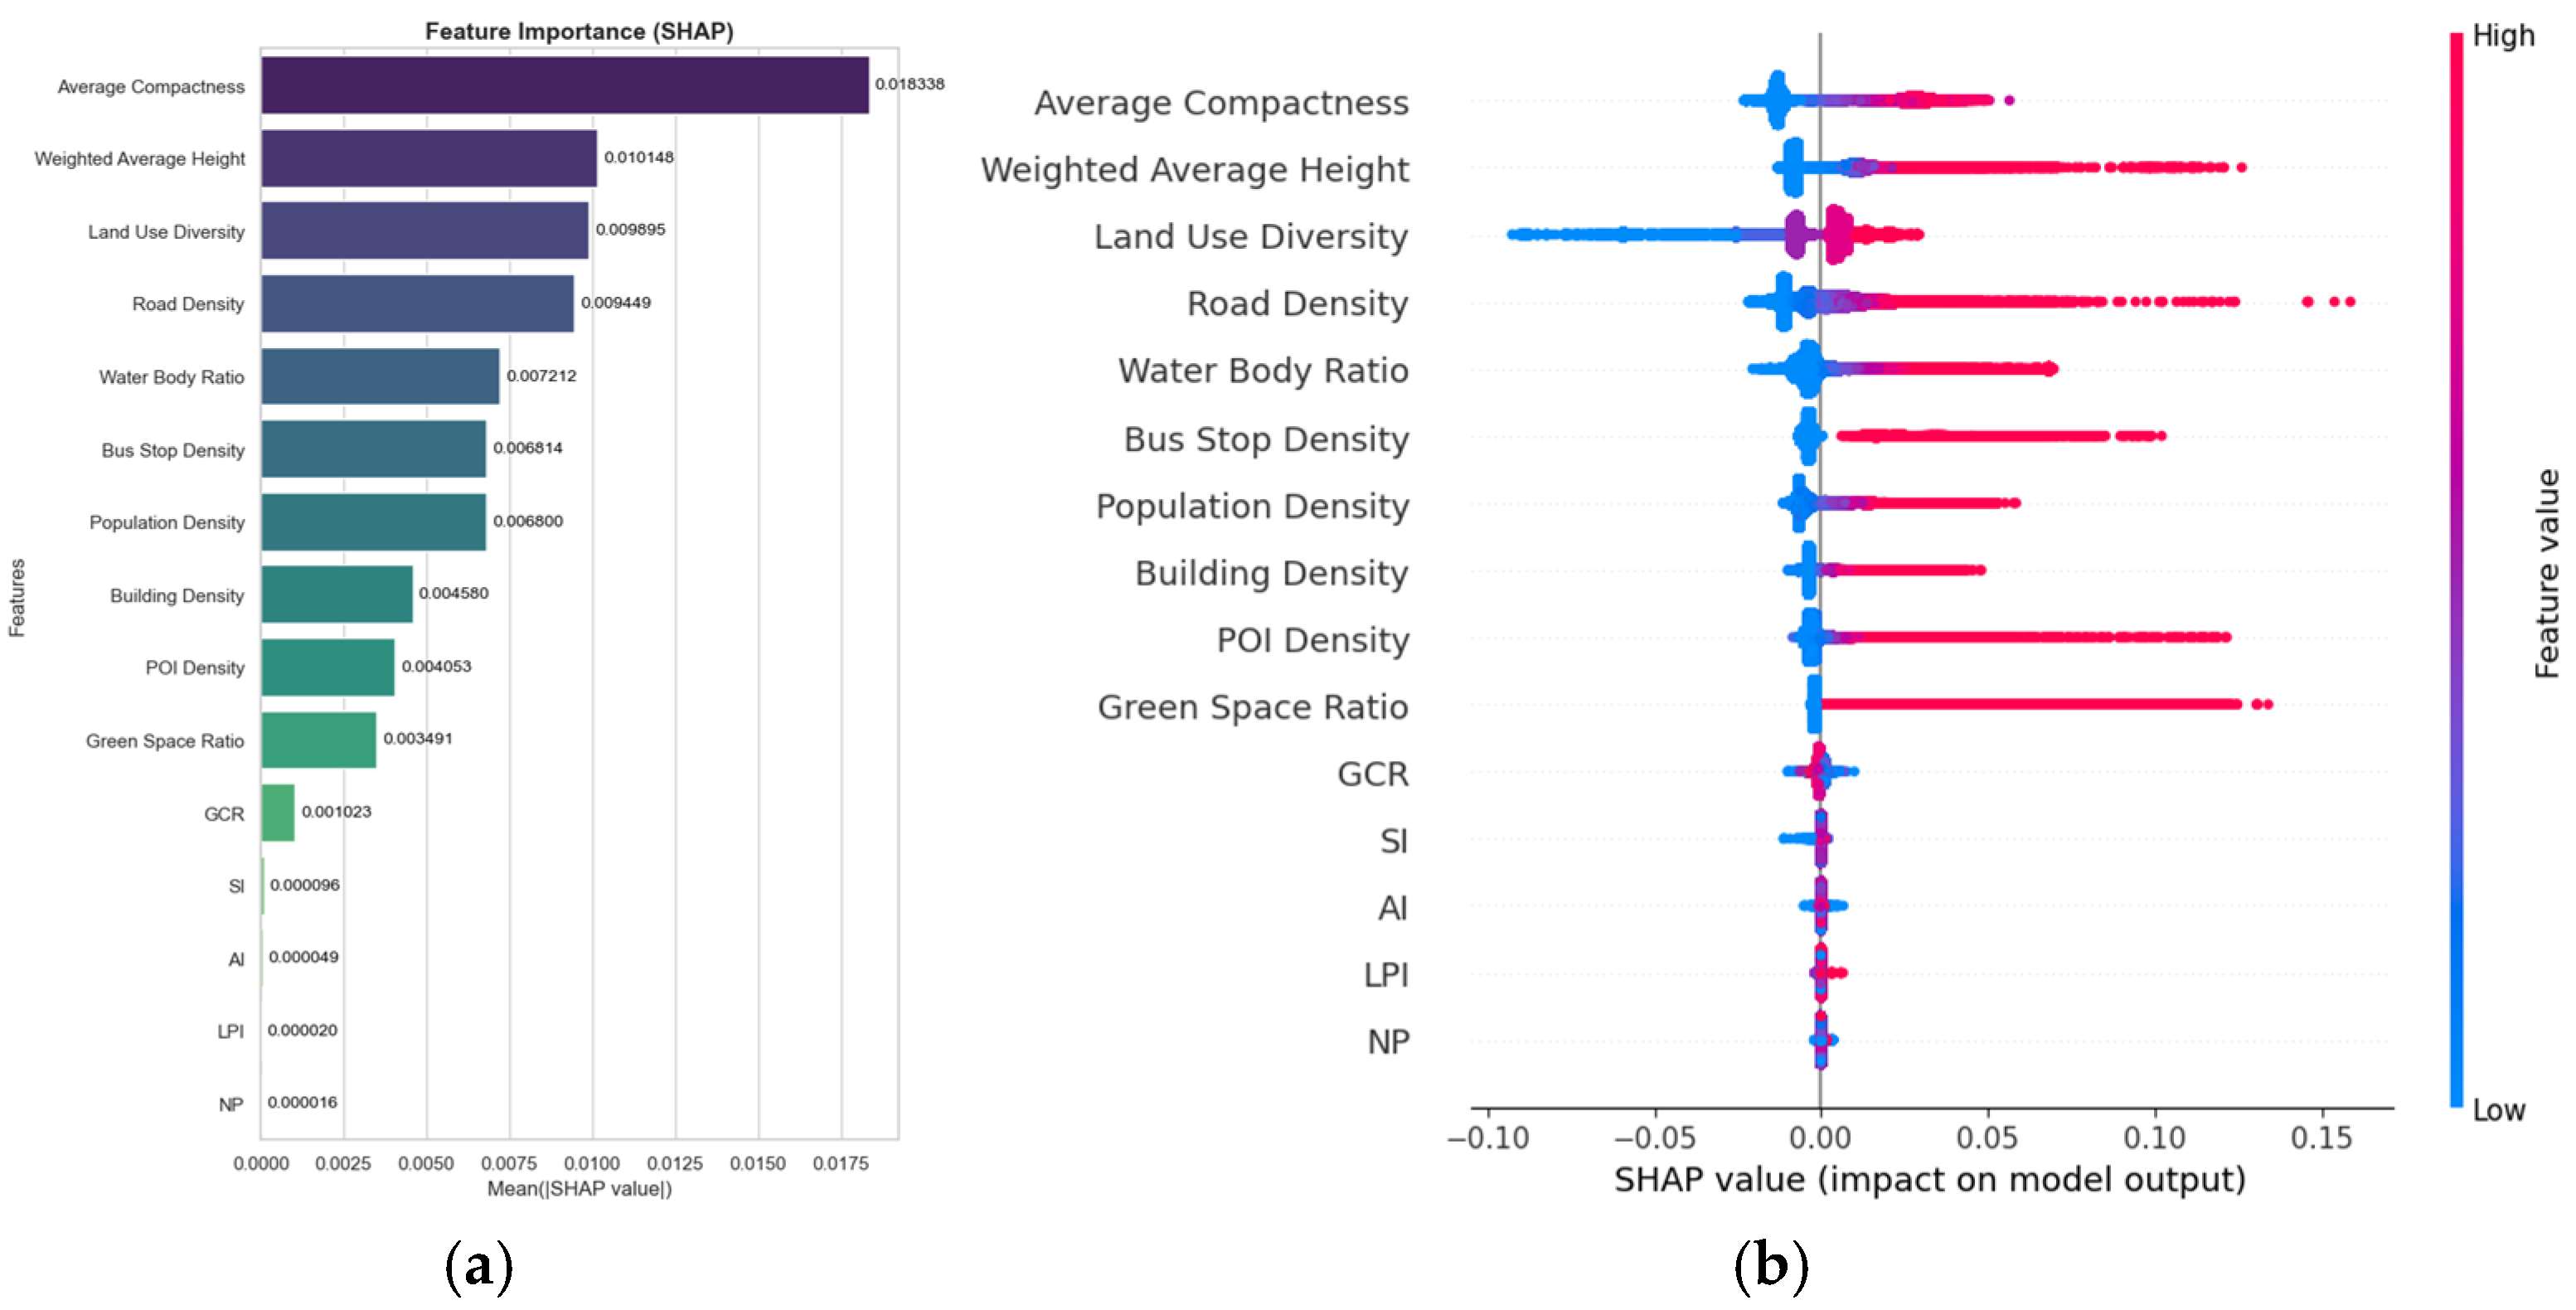
This study employs the LightGBM model combined with SHAP values to quantify and rank the contribution of each feature to the coupling coordination degree (CCD). As illustrated in Figure 9, the feature exerting the greatest influence on CCD is average compactness, with a SHAP value of 0.018338, followed by weighted average height (0.010148) and land use diversity (0.009895). The remaining features, in descending order of importance, include road density (0.009449), water body ratio (0.007212), bus stop density (0.006814), population density (0.0068), building density (0.004580), POI density (0.004053), Green Space Ratio (0.003491), GCR (0.001023), SI (0.000096), AI (0.000049), LPI (0.000020), and NP (0.000016). Notably, built environment indicators demonstrate substantially greater influence on CCD, with SHAP values consistently exceeding 0.001, whereas green space pattern indicators, except for GCR, present negligible effects with SHAP values mostly below 0.0001. The SHAP bee swarm plot reveals a positive correlation between higher values of built environment indicators and increased coupling coordination degree.

3.3.2. Threshold Effects

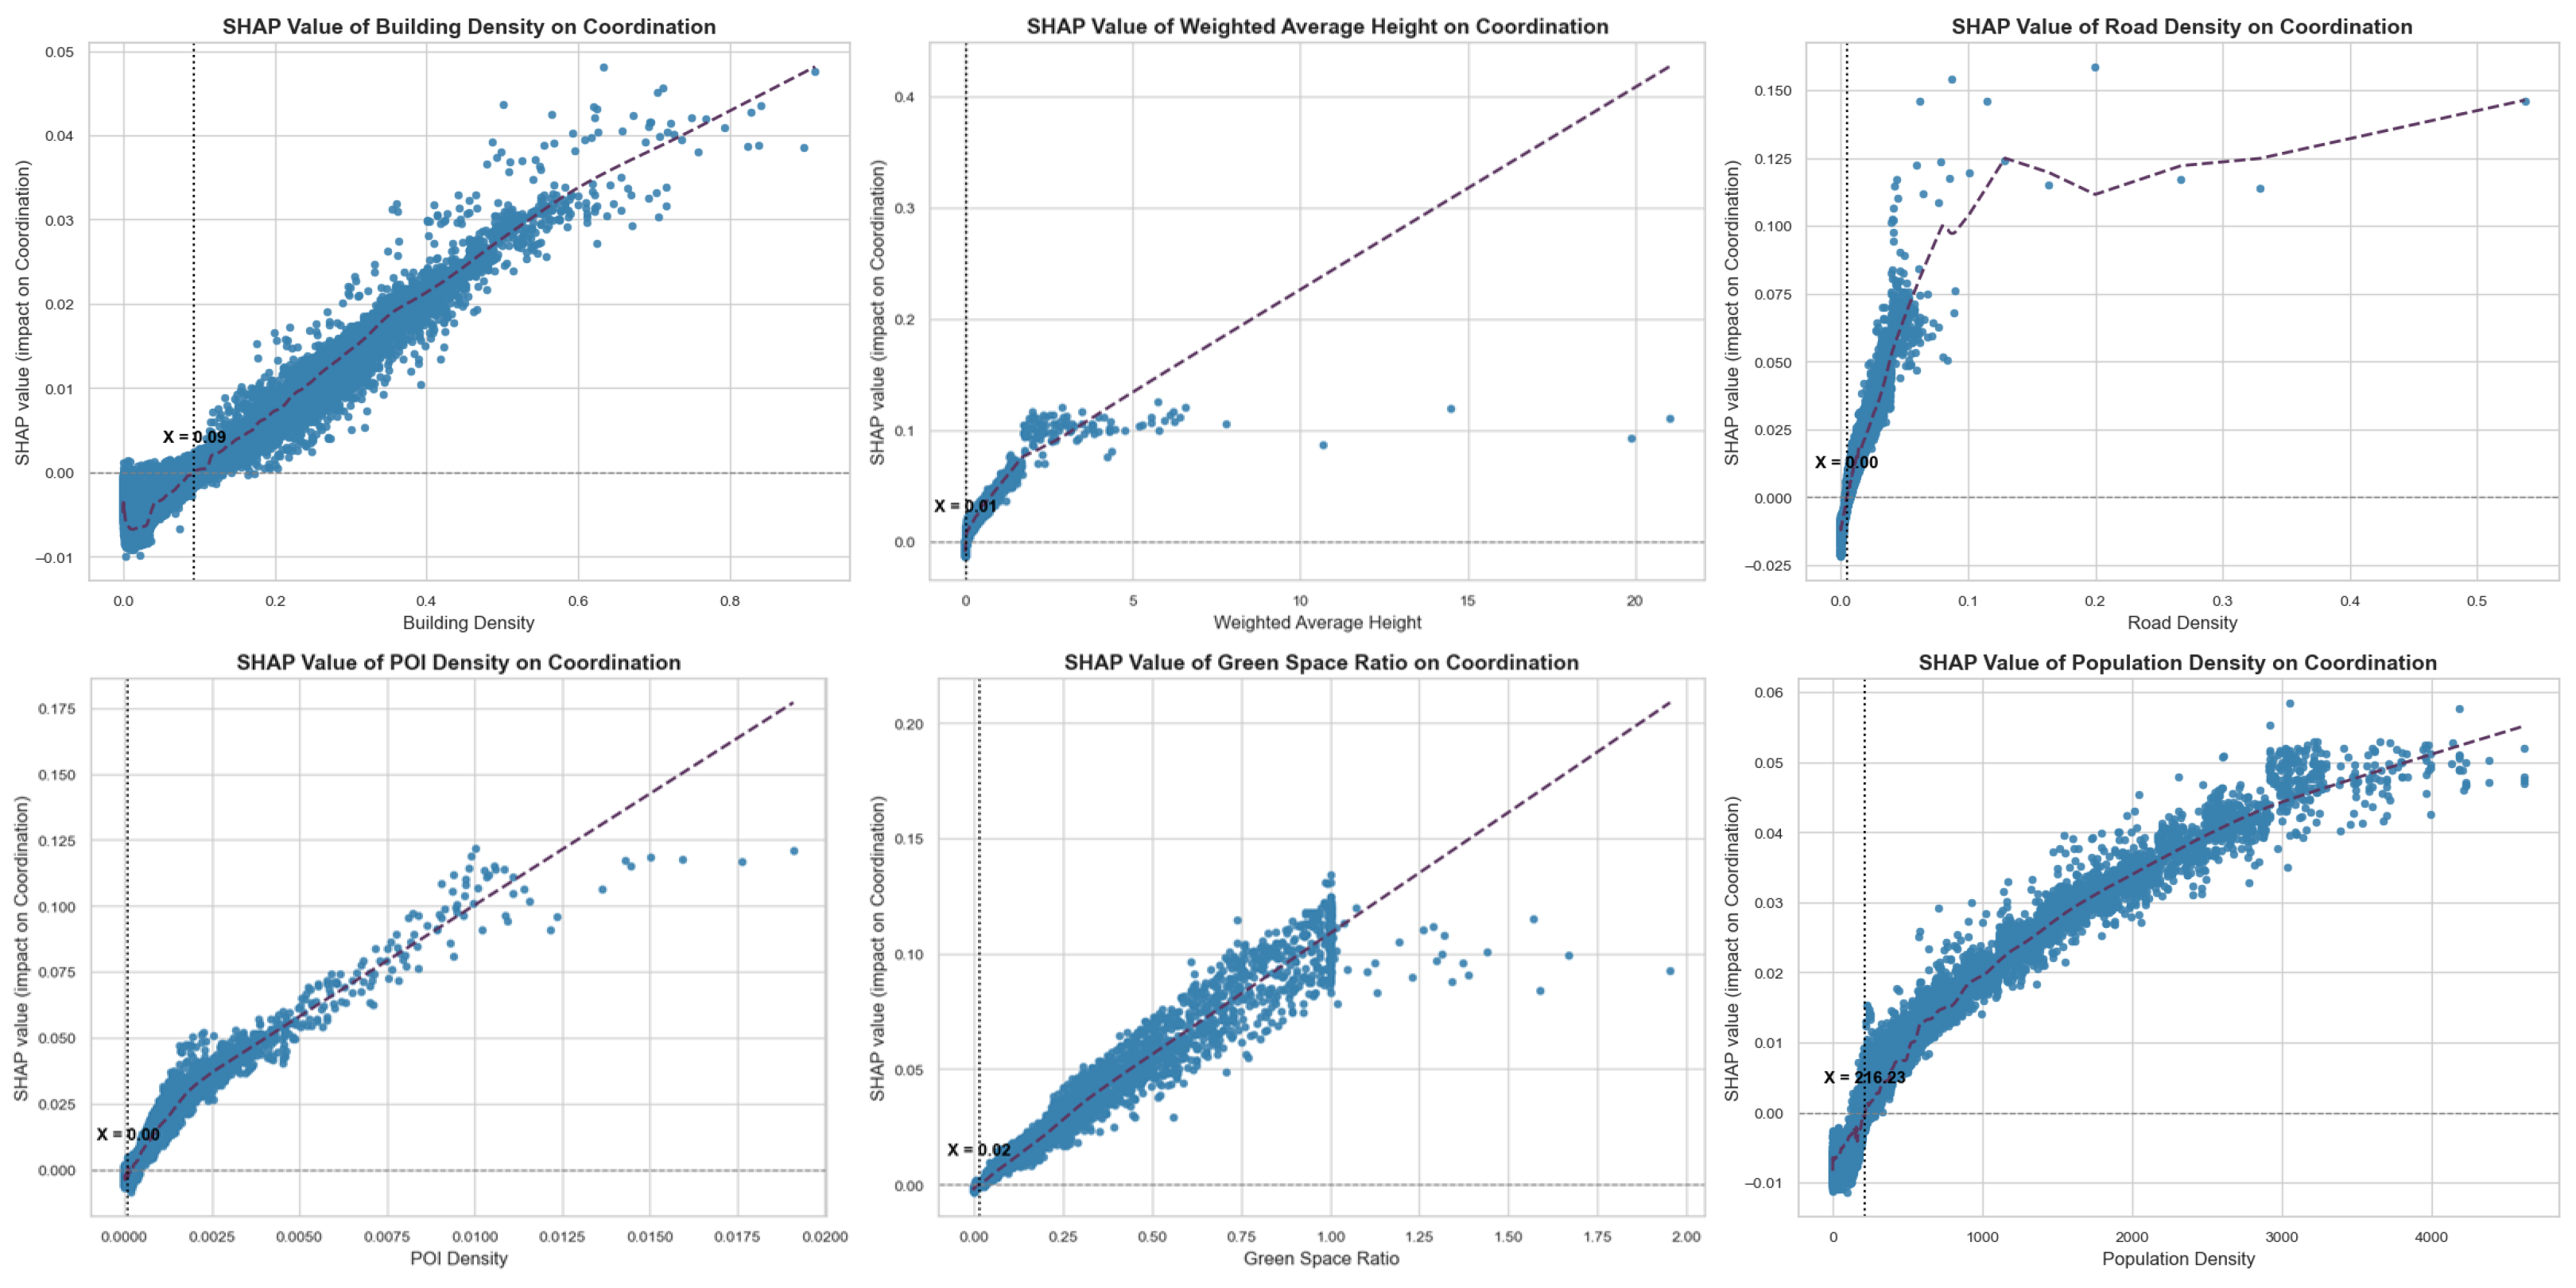
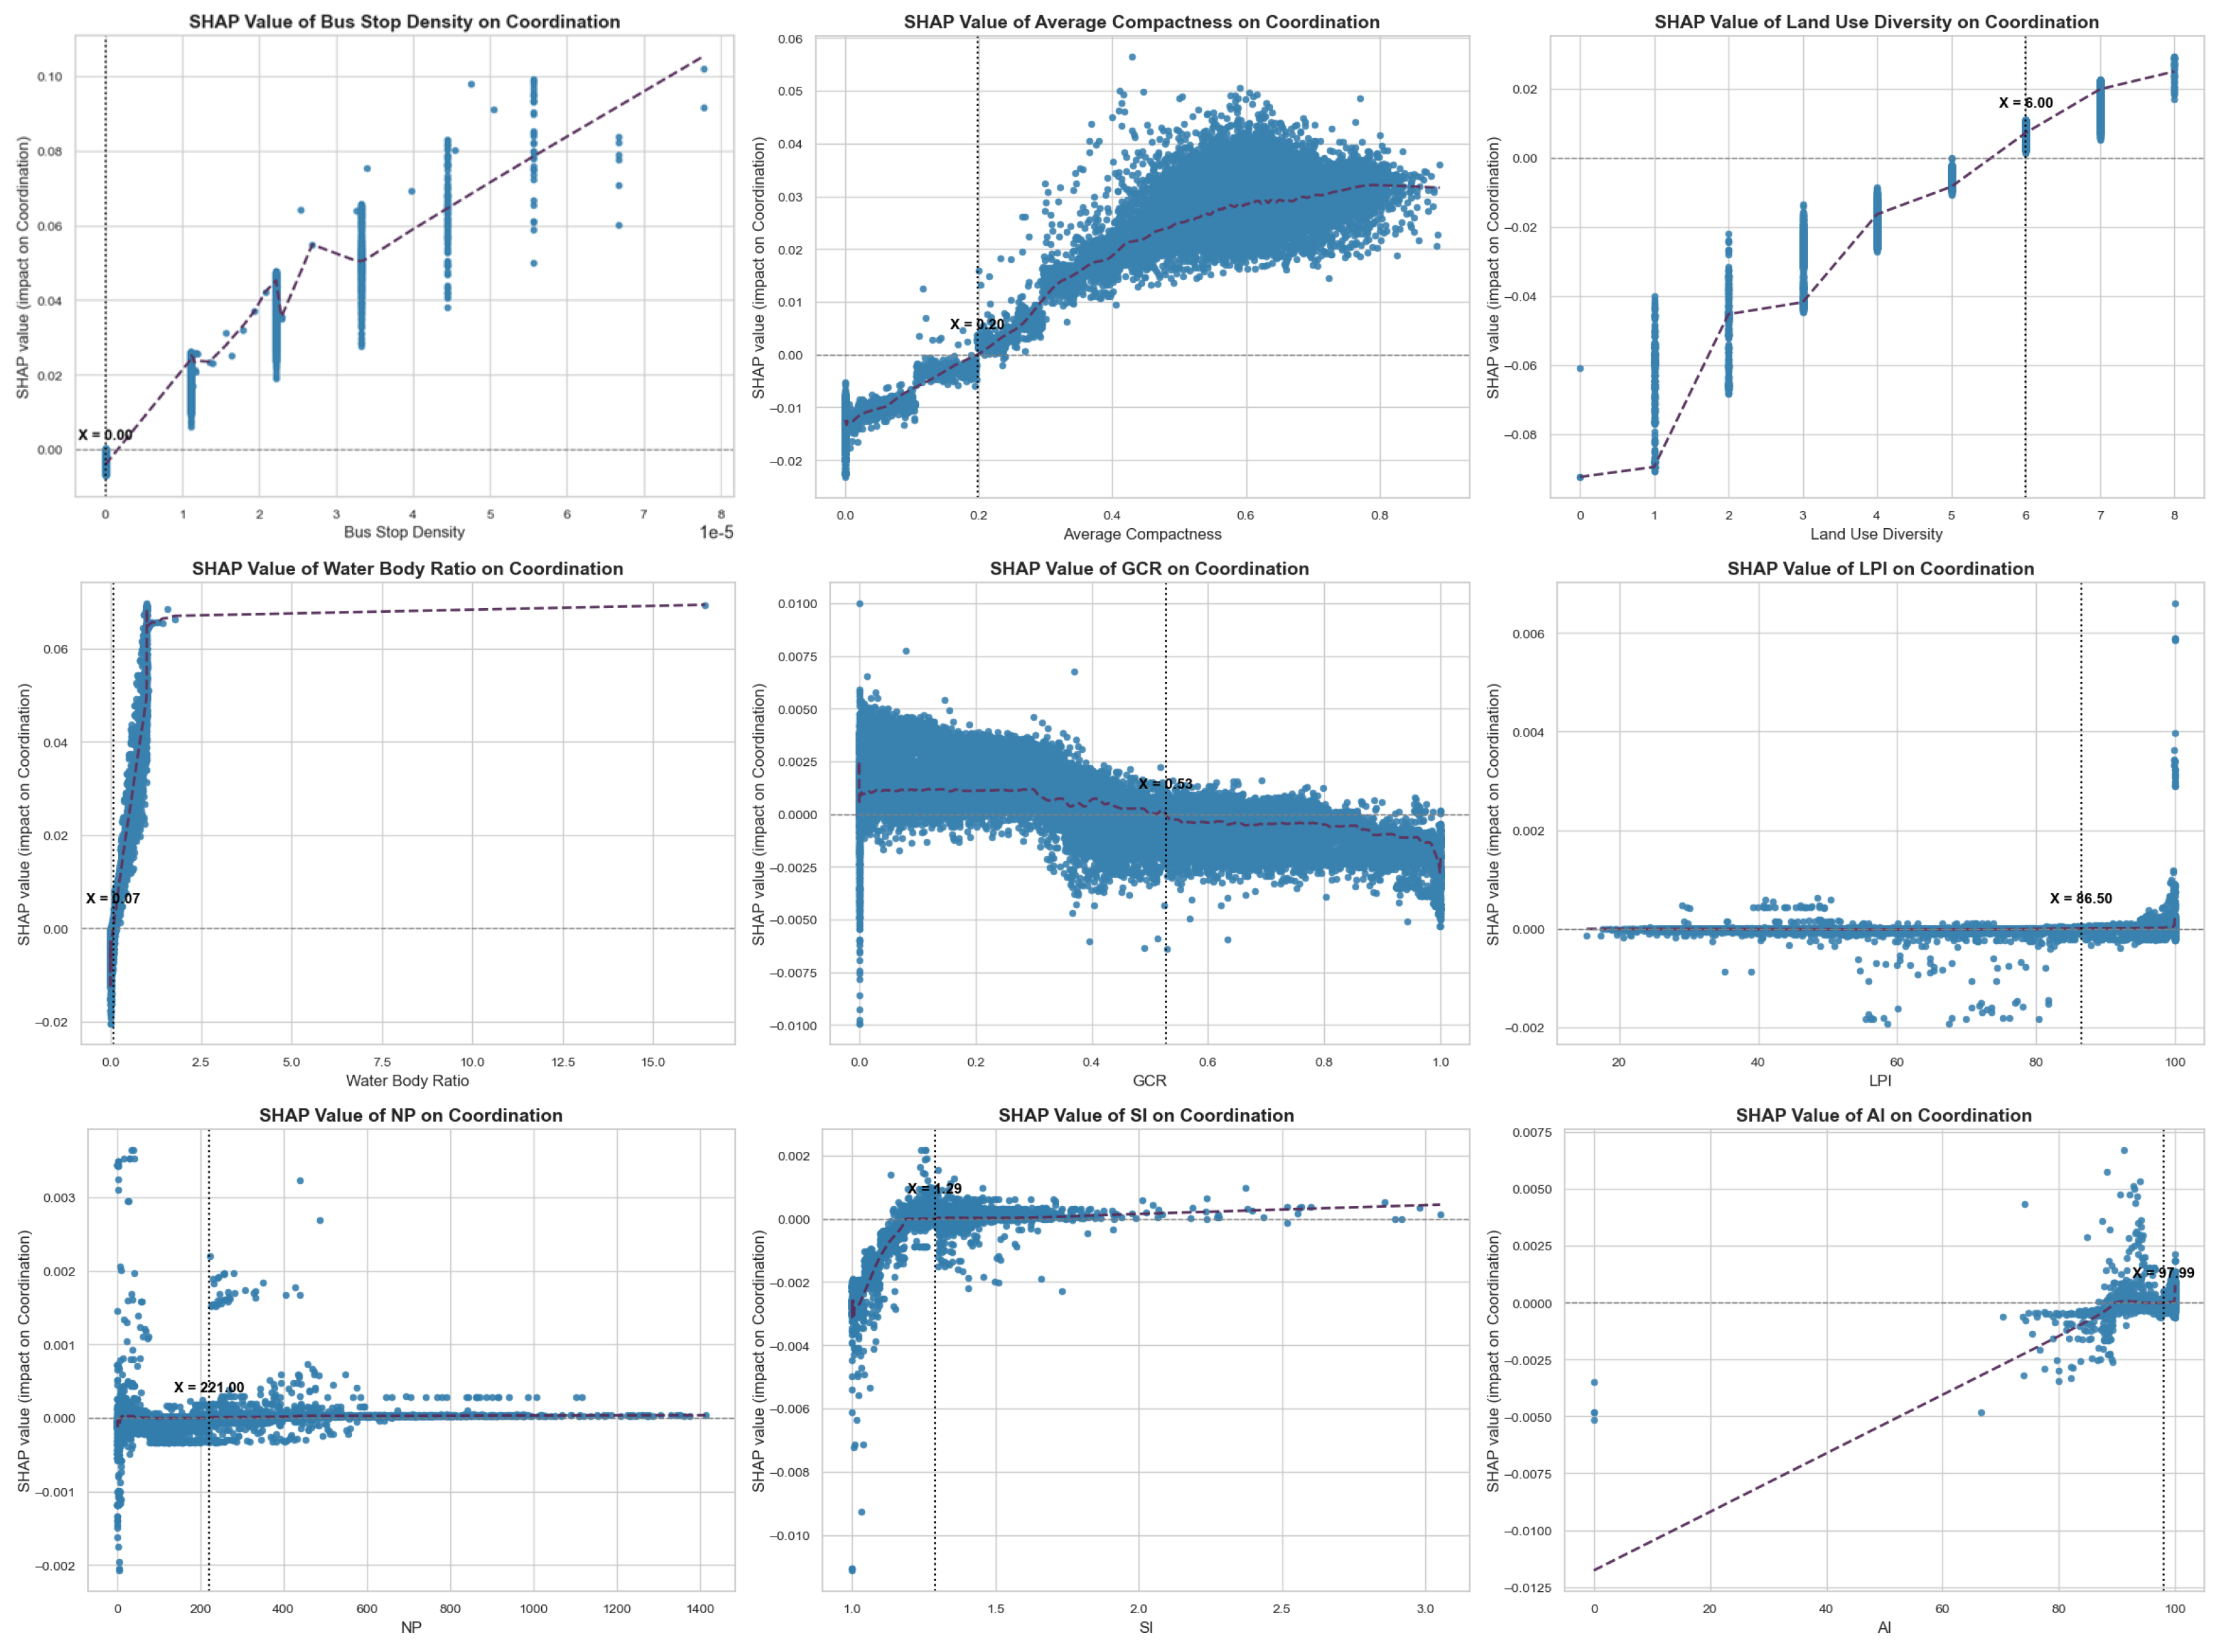
After analyzing the global significance of indicators related to the built environment and green space patterns, we further investigated the threshold effects of all variables. The results indicate that most indicators exhibit a linear correlation with coupling coordination and have a positive impact on coupling coordination once they exceed specific thresholds. Specifically, the thresholds that positively influence coupling coordination are as follows: building density > 0.09, point of interest density > 0, bus stop density > 0, green space ratio > 0.02, population density > 216.23, average compactness > 0.2, land use diversity > 6, water body ratio > 0.07, GCR < 0.53, and SI < 1.29. Meanwhile, the LPI, NP, and AI indicators fluctuate around the zero point (Y = 0), exhibiting a non-linear impact on coupling coordination. Additionally, when the weighted average height > 0.01 and road density > 0, the impact on SHAP decreases, and a dispersed point distribution phenomenon occurs (Figure 10).

4. Discussion

4.1. Spatial Distribution of Built Environment and Green Space Patterns

From the perspective of spatial distribution characteristics, the composite index of the built environment exhibits a pronounced pattern of spatial concentration. High-value areas are predominantly clustered within the city center and core urban districts, displaying a clear agglomeration pattern radiating outward from the urban core. This spatial configuration aligns with the centripetal concentration of population, industry, and transportation resources during urbanization [71,72,73] and is particularly driven by the dual forces of historical urban layouts and land-intensive development policies [74,75,76,77]. The urban core manifests spatial characteristics of high building density, intensive land use, and concentrated functional structures.
In contrast, the composite index of green space patterns is characterized by a more dispersed spatial distribution, predominantly exhibiting medium values across the urban landscape. High-value green space zones are primarily situated at the urban periphery, notably in the southwestern suburbs and the northeastern waterfront areas. The fragmented high-value patches in the southwest may be attributed to topographic constraints and higher ecological sensitivity, whereas the linear high-value distribution in the northeast likely reflects policy-driven ecological control corridors along rivers and coastal zones. Furthermore, with respect to coupling degree, green space pattern indices at medium-to-high levels appear to represent an optimal balance for harmonizing urbanization and ecological environment—corroborating findings by Kamble et al. [78] regarding ideal urban green space accessibility densities.
This spatial heterogeneity reflects a land-use logic dominated by urban expansion accompanied by green space retreat during city development [79,80,81]. The pattern of clustered high built environment indices in the core area juxtaposed with peripheral green space highs essentially embodies the spatial contradictions driven by rapid urban expansion and land commodification [82,83]. On one hand, dense development in the central city prioritizes economic and residential demands, marginalizing green spaces [84]; on the other hand, ecological policies promote the formation of “ecological belts” or “green wedges” on the urban fringe [53]. Recent policy measures have partially alleviated tensions between green space patterns and built environments. For example, Shanghai’s “Master Plan for Urban Development (2017–2035)” emphasizes the creation of a green, open ecological network, ensuring that ecological land (including green plazas) constitutes no less than 60% of the municipal land area, establishing a multi-tiered, interconnected, and multifunctional ecological spatial system described as “double rings, nine corridors, and ten zones” to mitigate development pressure. Moreover, in peripheral zones, regulatory planning and ecological redline protections safeguard ecological spaces from encroachment, thereby maintaining the connectivity and integrity of green spaces [85].

4.2. Coupling Relationships and Spatial Clustering

A comparative analysis of spatial clustering zones and coupling coordination degree reveals a notable spatial congruence and logical linkage between the two. The clustering results identify three distinct regional typologies that collectively reflect the coordination status of Shanghai’s grey–green urban spaces.
Urban Dominant Coordination Zones are mainly concentrated in core built-up areas. These zones usually correspond to redevelopment areas or functional core areas and are characterized by concentrated planning resources and strong policy orientation [86]. These zones generally show high to moderately high values for the Built Environment Index, while the Green Space Pattern Index tends to be moderate to slightly below average. The relatively high degree of central coupling and coordination in this region indicates that strong green support has been achieved through multi-level green space, vertical greening, pocket parks, etc., under the conditions of dense urban development [87,88,89,90], but the degree of coordination in the periphery is lower than that in the center, and comparing the Built Environment Index with the Green Space Pattern Index, we know that the lack of green leads to a lower degree of coupling. Therefore, the region needs to build more green space and other strategies to improve its green support capacity [91,92].
Green-Oriented Transition Zones have lower built environment value but higher green space pattern indices, reflecting strong ecological reserve capacity. Their level of coupling and coordination is moderately low, and most are located in ecological buffer zones at the urban–rural transition zone or the edge of urban expansion. These areas have low urbanization levels and relatively intact and large-scale green space systems. However, due to lagging infrastructure and low development intensity, synergies between the built environment and green space systems have not yet been established. Whether these areas require urbanization development, the construction of ecological green belts, or measures to protect farmland, among other policies, requires comprehensive consideration. In London, the Metropolitan Green Belt policy has successfully contained urban sprawl and preserved ecological buffers. However, it also constrains housing supply and may redirect suburban growth, raising spatial equity and governance concerns. Debates persist over balancing green-belt protection with sustainable urban densification.
The Dispersed Natural Zone is the area with the smallest spatial extent and the most significant ecological dominant features among all types. Its distribution is highly fragmented and shows a pattern of fragmentation, mainly consisting of natural landscapes such as wetlands, grasslands, and inland water bodies. There are few human development activities in the area, and the green space pattern is structurally deficient, resulting in a low Built Environment Index (BEI) and Green Space Pattern Index (GSPI) and a correspondingly low coupling coordination degree (CCD). This area does not represent a typical dysfunctional urban area but is closer to an ecological conservation area with strong natural attributes and ecological buffer functions. Therefore, ecological protection, habitat connectivity maintenance, and environmental buffer zone construction should be the focus of planning to avoid incorporating it into conventional urban construction paths.
But, due to the single-year data limitation, the current spatial patterns reflect a static snapshot of coupling coordination zones. However, as cities evolve, especially under rapid urbanization and planning policy shifts, these zones may change significantly over time. The absence of temporal analysis limits the capacity to observe such transformation trajectories or long-term impacts of planning interventions.

4.3. Policy Recommendations

This study identifies the coupling coordination relationship and spatial heterogeneity between the urban built environment and green space patterns and delineates distinct cluster zones. These findings reveal the developmental shortcomings and potential foundations across different spatial units, offering valuable insights for ecological optimization, urban expansion management, the enhancement of grey–green space synergy, and sustainable urban development. Based on these results, we propose the following strategic recommendations:

4.3.1. Zonal Differentiation and Tailored Spatial Governance Mechanisms

  • In the Urban Dominant Coordination Zone, due to its high coupling coordination, high-density built environment, and strong green space compensation characteristics, the future planning of the core area should prioritize enhancing the layered integration and multifunctional use of green infrastructure. In contrast, the surrounding areas with low coordination should focus on green space development. During the construction process, reference should be made to the threshold effects of indicator thresholds to set corresponding thresholds for each green space development, ensuring that construction achieves the optimal coordination range. Additionally, the promotion of vertical greening, rooftop gardens, and pocket parks is encouraged to facilitate micro-ecological renewal and quality improvement in densely populated urban core areas [93,94]. Simultaneously, protecting urban ecological red lines and achieving a sustainable development model that combines high-density built environments with green penetration is of critical importance. Taking Singapore as an example, the city implemented the “City in a Garden” strategy under extremely limited land resources and widely applied measures such as green roofs, three-dimensional green walls, and sky gardens. Since the launch of the “Sky Garden Incentive Programme” in 2009, Singapore has constructed over 100 hectares of green roofs and vertical greening as of 2023, effectively alleviating the urban heat island effect and improving air quality.
  • The Green-Oriented Transition Zones possess substantial green space resources but relatively underdeveloped built environments, resulting in moderate coupling coordination. In this zone, emphasis should be placed on preserving green space patterns and integrating urban development with green space planning to avoid fragmented urban sprawl that undermines existing ecological configurations. Priority should be given to planning green space, protecting ecological land, and constructing ecological corridors to enhance its ecological reserve function and support a smooth transition towards green and low-carbon urban districts [95].
  • The Dispersed Natural Zone is primarily composed of ecologically sensitive landscapes such as wetlands, grasslands, and water bodies, characterized by low built environment intensity and fragmented spatial distribution. Rather than reflecting development–ecology conflict, its low coupling coordination degree stems from minimal urban integration and functional disconnection. Therefore, planning in this zone should emphasize ecological protection over urban expansion. Strategic priorities include maintaining ecological integrity through strict land-use controls and redline enforcement, enhancing habitat quality via targeted ecological restoration, and improving spatial connectivity by integrating these dispersed patches into broader green space networks [96]. Where minimal development is unavoidable, eco-sensitive design and nature-based solutions should be adopted to ensure that ecological functions are not compromised. This approach ensures that the zone serves as a resilient ecological reserve, supporting regional biodiversity and landscape sustainability.

4.3.2. Urban Expansion Guidance and Institutional Support

We recommend establishing an integrated policy framework encompassing “coupling coordination–spatial classification–governance response,” incorporating coupling coordination degrees and spatial clustering outcomes into overarching urban renewal and spatial planning strategies. An indicator-based regulatory system can be implemented to establish zonal control benchmarks—such as maximum building density and minimum green space ratios—guided by the sensitivity and importance of key influencing indicators.
Notably, Urban Dominant Coordination Zones are predominantly located within central and adjacent high-density urban areas, where stable coordination between built environment and green space patterns has been achieved, reflecting mature urban functions and effective coupling mechanisms. Conversely, the Green-Oriented Transition Zones located in the southern and northeastern peripheries feature intact green space systems but currently underdeveloped built environments, representing significant potential for future urban expansion. However, the coupling coordination in the northeastern corridors and southwestern patches still requires improvement. These zones should be designated as strategic urban expansion belts, adopting an “ecological first, orderly development” approach to guide urban function spillover and population redistribution, while simultaneously strengthening green space preservation and green infrastructure construction. This approach aims to avoid repeating the mistakes of “build first, compensate later,” thereby facilitating a shift from incremental urban growth towards ecologically coordinated urbanization.
It is important to recognize that the coordinated relationship between the built environment and green space patterns is not only determined by physical spatial attributes but is also profoundly influenced by underlying institutional and planning mechanisms. For example, zoning regulations, ecological red lines, and strategic urban planning initiatives (such as green corridors and development boundaries) can significantly impact land use intensity and green space protection, thereby altering the spatial manifestation of coordinated integration. In some areas with higher coordination levels, this may not only reflect physical spatial matching but also the results of deliberate planning and control. Conversely, areas lacking systematic policy support may be more prone to green space fragmentation or ecological mismatch. Therefore, future research should consider incorporating institutional variables into coupling models to more comprehensively reveal the underlying drivers of spatial coordination mechanisms.

5. Conclusions

5.1. The Main Conclusions of This Sdy

This study first utilizes the DNN-Attention model to analyze the spatial characteristics of composite indicators of built environment and green space patterns in urban spaces. Secondly, it introduces the coupling coordination model and K-Means clustering method to classify and identify urban spatial units and analyze their coordination levels, thereby revealing the heterogeneity of urban spaces. Finally, by combining the LightGBM and SHAP analysis models, the dominant driving factors of coupling coordination are identified. It is found that structural indicators of the built environment (such as average compactness, weighted average height, and land use diversity) have a significant impact on the degree of coupling coordination, while the influence of green space indicators is relatively minor. The study draws the following main conclusions:
(1)
There are significant spatial differences between the built environment and green space patterns. High values of the Built Environment Index (BEI) are concentrated in central urban areas, while high values of the Green Space Pattern Index (GLPI) are predominantly distributed in peripheral ecological zones, revealing the typical contradiction between the expansion of urban grey infrastructure and the retreat of green spaces.
(2)
The coupling coordination degree (CCD) exhibits obvious spatial heterogeneity. Areas with high built environments and moderate green space patterns (such as urban core areas) demonstrate higher coordination levels, while areas rich in ecological resources but underdeveloped built environments show lower coordination levels. Peripheral areas with fragmented infrastructure and incomplete green space layouts exhibit the lowest coupling coordination degree.
(3)
K-Means clustering analysis identified three main spatial types, which were analyzed in conjunction with coupling coordination degree and the spatial heterogeneity of built environment and green space patterns to examine the characteristics of different spatial types. These are: first, the Urban Dominant Coordination Zone, characterized by dense built environment and well-developed green space configuration, exhibiting mature coordination mechanisms; second, the Green-Oriented Transition Zone, rich in ecological resources but with weak built environment, offering significant development potential but low coordination levels; Third, the Dispersed Natural Zone: both built environment and green space pattern indices are low, with minimal ecological intervention, presenting a natural preservation state.
(4)
Machine learning analysis based on LightGBM and SHAP indicates that structural indicators of the built environment (such as average compactness, weighted height, and land use diversity) are the primary drivers of coupling coordination, while green space pattern indicators, though ecologically significant, have a relatively minor influence in the model.
Finally, based on the K-Means clustering results, we analyzed the built environment, green space patterns, and coupling coordination characteristics of the clustered areas, analyzed the development directions of the regions, and proposed corresponding optimization policies in conjunction with the driving mechanisms.

5.2. Limitations and Future Research

This study is based on static cross-sectional data, which limits our ability to capture the temporal dynamics of urbanization and the evolving interactions between the built environment and green space patterns. Urbanization is inherently a long-term and gradual process, and the spatial relationships between the built environment and green space patterns are also in a state of constant change. Relying on cross-sectional static data may lead to the overestimation or underestimation of the coordination degree of certain areas. For example, areas undergoing urban renewal or ecological restoration may have phased spatial patterns, and data from a single year may only reflect temporary improvements in coordination rather than long-term stable trends. Conversely, some areas that are gradually advancing green space patterns may have low CCD values at present, but their coordination levels are on an improving trajectory. Future research should employ multi-temporal datasets to develop dynamic coupling-coordination models that trace the evolutionary trajectories of different spatial zones, thereby enabling more precise urban intervention strategies. Although qualitative discussions on urban policy directions are included, institutional, policy, or governance variables were not incorporated into the modeling process, which may introduce biases in understanding urban evolution and policy implications. Subsequent studies are encouraged to integrate spatial governance variables—such as land-use regulations, urban renewal projects, and planning intensity—to explore the real regulatory effects of urban management actions on coupling relationships, thereby enhancing the policy relevance and decision-making value of the research.
In addition, although this study selected a 300 m × 300 m grid as the basic spatial unit to achieve a balance between accuracy and computational efficiency, the selection of this fixed scale may still obscure spatial heterogeneity at finer (e.g., neighborhood level) or coarser (e.g., administrative district-level) scales. Spatial processes such as green space fragmentation, land use intensity, and policy interventions often operate through multi-scale mechanisms, and some local coupling relationships may be diluted or exaggerated as a result, thereby affecting the interpretability of analysis results. Future research could consider incorporating multi-scale comparative analysis, integrating street-level or neighborhood-level data on top of the existing grid scale to obtain higher-resolution local features, while also combining administrative district scales to align with actual policy and governance units. This approach could explore the sensitivity of coupled coordination relationships to scale changes, thereby enhancing the robustness and practical value of research conclusions.

Author Contributions

Conceptualization, R.C., M.X., K.C., and S.C.; methodology, R.C., K.C., and Z.C.; software, R.C. and M.X.; validation, Z.C., K.C., and S.C.; formal analysis, R.C. and Z.C.; investigation, R.C., K.C., and ZhiYuan. Chen.; resources, R.C., M.X., and R.S.; data curation, R.C. and R.S.; writing—original draft preparation, R.C., Z.C., M.X., and K.C.; writing—review and editing, R.C., K.C., and S.C.; visualization, R.C. and M.X.; supervision, K.C. and S.C.; project administration, S.C.; funding acquisition, Z.C. and M.X. All authors have read and agreed to the published version of the manuscript.

Funding

This research was supported by the General Project of Humanities and Social Sciences Research, Ministry of Education of China (Grant No. 23YJA760016); the Youth Project of the Social Science Foundation of Fujian Province (Grant No. FJ2024C162); and the Educational Science Planning Project of Fujian Agriculture and Forestry University (Grant No. 11423025).

Data Availability Statement

No new data were created or analyzed in this study. Data sharing is not applicable to this article.

Acknowledgments

This research was generously supported by national and provincial funding programs, including the Ministry of Education of China and Fujian Agriculture and Forestry University.

Conflicts of Interest

The authors declare no conflicts of interest. The funders had no role in the design of the study; in the collection, analyses, or interpretation of data; in the writing of the manuscript; or in the decision to publish the results.

References

  1. Chan, C.K.; Yao, S.M. Urbanization and sustainable metropolitan development in China: Patterns, problems and prospects. GeoJournal 1999, 49, 269–277. [Google Scholar] [CrossRef]
  2. Liu, F.; Zhang, Z.X.; Zhang, X.L.; Liu, B.; Wang, X.; Yi, L.; Zuo, L.J.; Xu, J.Y.; Hu, S.G.; Sun, F.F.; et al. Urban expansion of China from the 1970s to 2020 based on remote sensing technology. Chin. Geogr. Sci. 2021, 225, 765–781. [Google Scholar] [CrossRef]
  3. Peng, L.; Huang, K.X.; Zhang, H.J.; Sun, W. Exploring the impacts of urbanization on vegetation growth from the perspective of urban expansion patterns and maturity: A case study on 40 large cities in China. Sustain. Cities Soc. 2024, 115, 105841. [Google Scholar] [CrossRef]
  4. Wu, J.; Yang, S.; Zhang, X. Interaction analysis of urban blue-green space and built-up area based on coupling model—A case study of Wuhan central city. Water 2020, 12, 2185. [Google Scholar] [CrossRef]
  5. Wang, Y.Q.; Chen, S.S.; Zheng, G.H.; Zhou, S.L.; Zhou, Y.J. Risk assessment and zoning of soil microplastics in a typical megacity, China. J. Hazard. Mater. 2025, 495, 138870. [Google Scholar] [CrossRef]
  6. Hu, Y.N.; Cheng, H.F. Water pollution during China’s industrial transition. Environ. Dev. 2013, 8, 57–73. [Google Scholar] [CrossRef]
  7. Wang, J.; Zhang, Y.Z.; Zhang, X.L.; Song, M.Q.; Ye, J.P. The spatio-temporal trends of urban green space and its interactions with urban growth: Evidence from the Yangtze River Delta region, China. Land Use Policy 2023, 128, 106598. [Google Scholar] [CrossRef]
  8. Kabisch, N.; Qureshi, S.; Haase, D. Human–environment interactions in urban green spaces—A systematic review of contemporary issues and prospects for future research. Environ. Impact Assess. Rev. 2015, 50, 25–34. [Google Scholar] [CrossRef]
  9. Zhao, S.Q.; Da, L.J.; Tang, Z.Y.; Fang, H.J.; Song, K.; Fang, J.Y. Ecological consequences of rapid urban expansion: Shanghai, China. Front. Ecol. Environ. 2006, 4, 341–346. [Google Scholar] [CrossRef]
  10. Haase, D.; Kabisch, S.; Haase, A.; Andersson, E.; Banzhaf, E.; Baro, F.; Brenck, M.; Fischer, L.K.; Frantzeskaki, N.; Kabisch, N.; et al. Greening cities—To be socially inclusive? About the alleged paradox of society and ecology in cities. Habitat Int. 2017, 64, 41–48. [Google Scholar] [CrossRef]
  11. Chen, Y.M.; Liu, Z.H.; Zhou, B.B. Population–environment dynamics across world’s top 100 urban agglomerations: With implications for transitioning toward global urban sustainability. J. Environ. Manag. 2022, 319, 115630. [Google Scholar] [CrossRef]
  12. Qiao, Z.H.; Xu, X.Y.; Zou, W.T.; Huang, Y.L. Urban sustainable development goals and ecosystem services: Pathways to achieving coordination. Land Use Policy 2024, 146, 107317. [Google Scholar] [CrossRef]
  13. Wang, Y.J.; Shinwari, R.; Payab, A.H.; Feng, J.Y. Harmonizing sustainability: Unveiling the nexus of public private investment, natural resources, and environmental dynamics by applying ARDL and machine learning approach. Ecol. Indic. 2024, 161, 111931. [Google Scholar] [CrossRef]
  14. Wu, J.G. Urban ecology and sustainability: The state-of-the-science and future directions. Landsc. Urban Plan. 2014, 125, 209–211. [Google Scholar] [CrossRef]
  15. Huang, Y.Y.; Lin, T.; Zhang, G.Q.; Jones, L.; Xue, X.Z.; Ye, H.; Liu, Y.Q. Spatiotemporal patterns and inequity of urban green space accessibility and its relationship with urban spatial expansion in China during rapid urbanization period. Sci. Total Environ. 2022, 809, 151123. [Google Scholar] [CrossRef]
  16. Song, X.X.; Liu, Y.Z.; Zhu, X.N.; Cao, G.; Chen, Y.; Zhang, Z.; Wu, D. The impacts of urban land expansion on ecosystem services in Wuhan, China. Environ. Sci. Pollut. Res. 2022, 29, 10635–10648. [Google Scholar] [CrossRef]
  17. Li, S.N.; He, Y.Y.; Xu, H.L.; Zhu, C.M.; Dong, B.Y.; Lin, Y.; Si, B.; Deng, J.S.; Wang, K. Impacts of urban expansion forms on ecosystem services in urban agglomerations: A case study of Shanghai–Hangzhou Bay urban agglomeration. Remote Sens. 2021, 13, 1908. [Google Scholar] [CrossRef]
  18. Yang, Y.M.; Zhang, D.; Nan, Y.; Liu, Z.F.; Zheng, W. Modeling urban expansion in the transnational area of Changbai Mountain: A scenario analysis based on the zoned Land Use Scenario Dynamics-urban model. Sustain. Cities Soc. 2019, 50, 101622. [Google Scholar] [CrossRef]
  19. Wang, K.; Li, Z.Y.; Zhang, J.J.; Wu, X.; Jia, M.; Wu, L. Built-up land expansion and its impacts on optimizing green infrastructure networks in a resource-dependent city. Sustain. Cities Soc. 2020, 55, 102026. [Google Scholar] [CrossRef]
  20. Chu, M.G.; Lu, J.Y.; Sun, D.Q. Influence of urban agglomeration expansion on fragmentation of green space: A case study of Beijing–Tianjin–Hebei urban agglomeration. Land 2022, 11, 275. [Google Scholar] [CrossRef]
  21. Zhao, Y.L.; Shi, Y.; Feng, C.C.; Gou, L. Exploring coordinated development between urbanization and ecosystem services value of sustainable demonstration area in China—Take Guizhou Province as an example. Ecol. Indic. 2022, 144, 109444. [Google Scholar] [CrossRef]
  22. Chen, W.; Wang, G.; Zeng, J. Impact of urban expansion on ecosystem services in different urban agglomerations in China. Int. J. Environ. Sci. Technol. 2023, 20, 12625–12644. [Google Scholar] [CrossRef]
  23. Han, J.J.; Zhao, X.; Zhang, H.; Liu, Y. Analyzing the spatial heterogeneity of the built environment and its impact on the urban thermal environment—Case study of downtown Shanghai. Sustainability 2021, 13, 11302. [Google Scholar] [CrossRef]
  24. Chen, Y.; Ge, Y.; Yang, G.F.; Wu, Z.P.; Du, Y.Y.; Mao, F.; Liu, S.; Xu, R.H.; Qu, Z.L.; Xu, B.; et al. Inequalities of urban green space area and ecosystem services along urban center–edge gradients. Landsc. Urban Plan. 2022, 217, 104266. [Google Scholar] [CrossRef]
  25. Yan, S.Y.; Tang, J. Optimization of green space planning to improve ecosystem services efficiency: The case of Chongqing urban areas. Int. J. Environ. Res. Public Health 2021, 18, 8441. [Google Scholar] [CrossRef]
  26. Enssle, F.; Kabisch, N. Urban green spaces for the social interaction, health and well-being of older people—An integrated view of urban ecosystem services and socio-environmental justice. Environ. Sci. Policy 2020, 109, 36–44. [Google Scholar] [CrossRef]
  27. Hu, Z.N.; Yang, X.; Yang, J.J.; Yuan, J.; Zhang, Z.Y. Linking landscape pattern, ecosystem service value, and human well-being in Xishuangbanna, southwest China: Insights from a coupling coordination model. Glob. Ecol. Conserv. 2021, 27, e01583. [Google Scholar] [CrossRef]
  28. Zhu, Z.P.; Li, J.Y.; Chen, Z.R. Green space equity: Spatial distribution of urban green spaces and correlation with urbanization in Xiamen, China. Environ. Dev. Sustain. 2023, 25, 423–443. [Google Scholar] [CrossRef]
  29. Liu, S.; Zhang, X.S.; Feng, Y.J.; Xie, H.; Jiang, L.; Lei, Z.K. Spatiotemporal dynamics of urban green space influenced by rapid urbanization and land use policies in Shanghai. Forests 2021, 12, 476. [Google Scholar] [CrossRef]
  30. Odhengo, P.; Lutta, A.I.; Osano, P.; Opiyo, R. Urban green spaces in rapidly urbanizing cities: A socio-economic valuation of Nairobi City, Kenya. Cities 2024, 155, 105430. [Google Scholar] [CrossRef]
  31. Lei, X.Q.; Liu, H.H.; Li, S.D.; Luo, Q.Q.; Chen, S.Z.; Hu, G.Y.; Wang, X.; Bai, W.Q. Coupling coordination analysis of urbanization and ecological environment in Chengdu-Chongqing urban agglomeration. Ecol. Indic. 2024, 161, 111969. [Google Scholar] [CrossRef]
  32. Hou, W.Y.; Hu, T.Z.; Yang, L.P.; Liu, X.C.; Zheng, X.Y.; Pan, H.Y.; Zhang, X.H.; Xiao, S.J.; Deng, S.H. Matching ecosystem services supply and demand in China’s urban agglomerations for multiple-scale management. J. Clean. Prod. 2023, 420, 138351. [Google Scholar] [CrossRef]
  33. Maimaiti, B.; Chen, S.S.; Kasimu, A.; Mamat, A.; Aierken, N.; Chen, Q.L. Coupling and coordination relationships between urban expansion and ecosystem service value in Kashgar City. Remote Sens. 2022, 14, 2557. [Google Scholar] [CrossRef]
  34. Zhang, H.L.; Xiu, H.; Nizamani, M.M.; Zhou, Q.; Long, K.J.; Quan, Y.F.; Fu, T.T.; Sun, Q.G. China’s urban green growth from 2000 to 2020 is influenced by legacy effects. Urban Ecosyst. 2024, 27, 1465–1476. [Google Scholar] [CrossRef]
  35. Yang, X.; Li, S.S.; Chen, Z.C.; Chanussot, J.; Jia, X.P.; Zhang, B.; Li, B.P.; Chen, P. An attention-fused network for semantic segmentation of very-high-resolution remote sensing imagery. ISPRS J. Photogramm. Remote Sens. 2021, 177, 238–262. [Google Scholar] [CrossRef]
  36. Ma, L.; Liu, Y.; Zhang, X.L.; Ye, Y.X.; Yin, G.F.; Johnson, B.A. Deep learning in remote sensing applications: A meta-analysis and review. ISPRS J. Photogramm. Remote Sens. 2019, 152, 166–177. [Google Scholar] [CrossRef]
  37. Olawade, D.B.; Wade, O.Z.; Ige, A.O.; Egbewole, B.I.; Olojo, A.; Oladapo, B.I. Artificial intelligence in environmental monitoring: Advancements, challenges, and future directions. Hyg. Environ. Health Adv. 2024, 12, 100114. [Google Scholar] [CrossRef]
  38. Gu, X.Z.; Zhang, Z.X.; Jiang, Y.C.; Lou, T.; Zhang, R.M.; Cui, S.G.; Li, Z. Hierarchical Weight Averaging for Deep Neural Networks. IEEE Trans. Neural Netw. Learn. Syst. 2024, 35, 12276–12287. [Google Scholar] [CrossRef]
  39. Jain, A.K. Data clustering: 50 years beyond K-means. Pattern Recognit. Lett. 2010, 31, 651–666. [Google Scholar] [CrossRef]
  40. Chen, W.; Huang, H.P.; Dong, J.W.; Zhang, Y.; Tian, Y.C.; Yang, Z.Q. Social functional mapping of urban green space using remote sensing and social sensing data. ISPRS J. Photogramm. Remote Sens. 2018, 146, 436–452. [Google Scholar] [CrossRef]
  41. Li, J.Q.; Li, C.S. Characterizing urban spatial structure through built form typologies: A new framework using clustering ensembles. Land Use Policy 2024, 141, 107166. [Google Scholar] [CrossRef]
  42. Bai, H.M.; Zhu, X.; Liu, Y.P.; Zhang, T.G.; Jia, C.; Cao, J.; Zhang, H.; Liu, X.R. Analysis of urban functional areas based on graph clustering neural networks. J. Urban Manag. 2025. [Google Scholar] [CrossRef]
  43. Lin, A.Q.; Huang, B.; Wu, H.; Luo, W.T. An MIU-based deep embedded clustering model for urban functional zoning from remote sensing images and VGI data. Int. J. Appl. Earth Obs. Geoinf. 2024, 128, 103689. [Google Scholar] [CrossRef]
  44. Zhou, C.Y.; Wang, Z.; Wang, X.L.; Guo, R.; Zhang, Z.; Xiang, X.W.; Wu, Y.Q. Deciphering the nonlinear and synergistic role of building energy variables in shaping carbon emissions: A LightGBM-SHAP framework in office buildings. Build. Environ. 2024, 266, 112035. [Google Scholar] [CrossRef]
  45. An, R.; Tong, Z.M.; Tan, B.; Xiong, Q.Q.; Lou, Y.Y.; Lin, Y.L.; Yang, L.C.; Yang, X.P. Revealing the relationship between 2D/3D built environment and jobs-housing separation coupling nonlinearity and spatial nonstationarity. J. Transp. Geogr. 2025, 123, 104112. [Google Scholar] [CrossRef]
  46. Wang, Z.; Zhou, R.; Rui, J.; Yu, Y. Revealing the impact of urban spatial morphology on land surface temperature in plain and plateau cities using explainable machine learning. Sustain. Cities Soc. 2025, 118, 106046. [Google Scholar] [CrossRef]
  47. Bi, S.B.; Tian, Z.; Zhang, Y.; Dai, F. The role of urban green space morphology and threshold in cooling efficiency: Evidence from five cities, China. J. Clean. Prod. 2025, 509, 145580. [Google Scholar] [CrossRef]
  48. Wang, Z.; Zhou, R.; Yu, Y. The impact of urban morphology on land surface temperature under seasonal and diurnal variations: Marginal and interaction effects. Build. Environ. 2025, 272, 112673. [Google Scholar] [CrossRef]
  49. Zhou, Y.N.; Wang, X.R. Analysis of influencing factors of terrestrial carbon sinks in China based on LightGBM model and Bayesian optimization algorithm. Sustainability 2025, 17, 4836. [Google Scholar] [CrossRef]
  50. Chiu, R.L.H. Urban sustainability and the urban forms of China’s leading mega cities: Beijing, Shanghai and Guangzhou. Urban Policy Res. 2012, 30, 359–383. [Google Scholar] [CrossRef]
  51. Wang, S.B.; Luo, X.L. The evolution of government behaviors and urban expansion in Shanghai. Land Use Policy 2022, 114, 105973. [Google Scholar] [CrossRef]
  52. Cui, L.L.; Shi, J. Urbanization and its environmental effects in Shanghai, China. Urban Clim. 2012, 2, 1–15. [Google Scholar] [CrossRef]
  53. Wu, Z.; Chen, R.S.; Meadows, M.E.; Sengupta, D.; Xu, D. Changing urban green spaces in Shanghai: Trends, drivers and policy implications. Land Use Policy 2019, 87, 104080. [Google Scholar] [CrossRef]
  54. Zhang, Z.H.; Sun, X.M.; Yu, X.Y.; Xiao, R. Decoupling urban development and ecological changes: A case study of Shanghai-Hangzhou Bay urban agglomeration. J. Urban Plan. Dev. 2024, 150, 05024010. [Google Scholar] [CrossRef]
  55. Du, H.Y.; Ai, J.Q.; Cai, Y.G.; Jiang, H.; Liu, P.D. Combined effects of the surface urban heat island with landscape composition and configuration based on remote sensing: A case study of Shanghai, China. Sustainability 2019, 11, 2890. [Google Scholar] [CrossRef]
  56. Dong, D.M.; Yu, Z.Y.; Xu, J.Z. A study on the characteristics and system construction of urban disaster resilience in Shanghai: A metropolis perspective. Sustainability 2025, 17, 248. [Google Scholar] [CrossRef]
  57. Wu, S.S.; Cheng, J.; Lo, S.M.; Chen, C.C.; Bai, Y.X. Coordinating urban construction and district-level population density for balanced development: An explorative structural equation modeling analysis on Shanghai. J. Clean. Prod. 2021, 312, 127646. [Google Scholar] [CrossRef]
  58. Yue, W.Z.; Fan, P.L.; Wei, Y.D.; Qi, J.G. Economic development, urban expansion, and sustainable development in Shanghai. Stoch. Environ. Res. Risk Assess. 2014, 28, 783–799. [Google Scholar] [CrossRef]
  59. Shanghai Municipal Bureau of Statistics. Shanghai Statistical Yearbook 2024; Shanghai Municipal Bureau of Statistics: Shanghai, China, 2024. Available online: https://tjj.sh.gov.cn/tjnj/20250331/9f8ec62cc2234485b0aa411b8d967c37.html (accessed on 23 June 2025).
  60. Zhang, Y.C.; Zhao, H.M.; Long, Y. CMAB: A multi-attribute building dataset of China. Sci. Data 2025, 12, 430. Available online: https://www.nature.com/articles/s41597-025-04730-5 (accessed on 25 June 2025). [CrossRef]
  61. Li, Z.H.; He, W.; Cheng, M.F.; Hu, J.X.; Yang, G.Y.; Zhang, H.Y. SinoLC-1: The first 1 m resolution national-scale land-cover map of China created with a deep learning framework and open-access data. Earth Syst. Sci. Data 2023, 15, 4749–4780. [Google Scholar] [CrossRef]
  62. Ewing, R.; Cervero, R. Travel and the built environment. J. Am. Plan. Assoc. 2010, 76, 265–294. [Google Scholar] [CrossRef]
  63. Peng, J.; Wang, Y.L.; Zhang, Y.; Wu, J.S.; Li, W.F.; Li, Y. Evaluating the effectiveness of landscape metrics in quantifying spatial patterns. Ecol. Indic. 2010, 10, 217–223. [Google Scholar] [CrossRef]
  64. Guang, Y.; Wang, W.H.; Song, H.W.; Mi, H.F.; Tang, J.L.; Zhao, Z.B. Prediction of external corrosion rate for buried oil and gas pipelines: A novel deep learning method with DNN and attention mechanism. Int. J. Press. Vessel. Pip. 2024, 209, 105218. [Google Scholar] [CrossRef]
  65. Li, C.X.; Gao, X.; He, B.J.; Wu, J.Y.; Wu, K.N. Coupling coordination relationships between urban-industrial land use efficiency and accessibility of highway networks: Evidence from Beijing-Tianjin-Hebei urban agglomeration, China. Sustainability 2019, 11, 1446. [Google Scholar] [CrossRef]
  66. Li, W.W.; Yi, P.T. Assessment of city sustainability—Coupling coordinated development among economy, society and environment. J. Clean. Prod. 2020, 256, 120453. [Google Scholar] [CrossRef]
  67. Fang, Y.P.; Fang, C.L.; Zhang, Q. Coupling coordinated development between social economy and ecological environment in Chinese provincial capital cities—Assessment and policy implications. J. Clean. Prod. 2019, 229, 289–298. [Google Scholar] [CrossRef]
  68. Ke, G.L.; Meng, Q.; Finley, T.; Wang, T.F.; Chen, W.; Ma, W.D.; Ye, Q.W.; Liu, T.Y. LightGBM: A highly efficient gradient boosting decision tree. In NIPS’17, Proceedings of the 31st International Conference on Neural Information Processing Systems, 4–9 December 2017, Long Beach, CA, USA; Neural Information Processing Systems Foundation, Inc.: San Diego, CA, USA, 2017; pp. 3149–3157. [Google Scholar] [CrossRef]
  69. Gong, P.; Li, X.C.; Wang, J.; Bai, Y.Q.; Chen, B.; Hu, T.G.; Liu, X.P.; Xu, B.; Yang, J.; Zhang, W.; et al. Annual maps of global artificial impervious area (GAIA) between 1985 and 2018. Remote Sens. Environ. 2020, 236, 111510. [Google Scholar] [CrossRef]
  70. Gao, C.; Feng, Y.J.; Wang, R.; Lei, Z.K.; Chen, S.R.; Tang, X.Y.; Xi, M.R. 50-Year urban expansion patterns in Shanghai: Analysis using impervious surface data and simulation models. Land 2023, 12, 2065. [Google Scholar] [CrossRef]
  71. Ye, Y.M.; Tang, Y.K.; Wang, J.T. The delineation and characterisation of Chinese urbanised areas using micro-scale population census data. Land 2024, 13, 763. [Google Scholar] [CrossRef]
  72. Yudhistira, M.H.; Tndriyani, W.; Pratama, A.P.; Sofiyandi, Y.; Kurniawan, Y.R. Transportation network and changes in urban structure: Evidence from the Jakarta Metropolitan Area. Res. Transp. Econ. 2019, 74, 52–63. [Google Scholar] [CrossRef]
  73. Gong, J.Z.; Chen, W.L.; Liu, Y.S.; Jie, J.Y. The intensity change of urban development land: Implications for the city master plan of Guangzhou, China. Land Use Policy 2014, 40, 91–100. [Google Scholar] [CrossRef]
  74. Yang, D.Y.; Liu, X.D. A framework for mapping urban spatial evolution: Quantitative insights from historical GIS and space syntax in Xi’an. Sustainability 2025, 17, 3113. [Google Scholar] [CrossRef]
  75. Lin, B.Q.; Wang, Z.Q.; Chai, J. Verifying the synthesized effects of intensive urban land use on quality of life, ecology, and urban-land-use scale in China. Land 2022, 11, 727. [Google Scholar] [CrossRef]
  76. Geng, B.; Zheng, X.Q.; Fu, M.C. Scenario analysis of sustainable intensive land use based on SD model. Sustain. Cities Soc. 2017, 29, 193–202. [Google Scholar] [CrossRef]
  77. Wang, J.; Chen, Y.Q.; Shao, X.M.; Zhang, Y.Y.; Cao, Y.G. Land-use changes and policy dimension driving forces in China: Present, trend and future. Land Use Policy 2012, 29, 737–749. [Google Scholar] [CrossRef]
  78. Kamble, T.; Bahadure, S.; Punglia, S. Availability and accessibility of urban green spaces in a high-density city: The case of Raipur, India. Prof. Geogr. 2022, 74, 290–303. [Google Scholar] [CrossRef]
  79. Li, Y.Y.; Ren, B.T.; Chen, Y.S.; Huang, L.C.; Sun, C.G. Multiscale spatiotemporal dynamics analysis of urban green space: Implications for green space planning in the rapid urbanizing Hefei City, China. Front. Ecol. Evol. 2022, 10, 998111. [Google Scholar] [CrossRef]
  80. Zheng, L.; Wang, J.P.; Zheng, Y.; Gu, T.C. Impacts of construction land expansion on cultivated land fragmentation in China, 2000–2020. Environ. Monit. Assess. 2025, 197, 300. [Google Scholar] [CrossRef]
  81. Zhou, X.L.; Wang, Y.C. Spatial–temporal dynamics of urban green space in response to rapid urbanization and greening policies. Landsc. Urban Plan. 2011, 100, 268–277. [Google Scholar] [CrossRef]
  82. Kuang, W.H.; Liu, J.Y.; Dong, J.W.; Chi, W.F.; Zhang, C. The rapid and massive urban and industrial land expansions in China between 1990 and 2010: A CLUD-based analysis of their trajectories, patterns, and drivers. Landsc. Urban Plan. 2016, 145, 21–33. [Google Scholar] [CrossRef]
  83. Basu, T.; Das, A.; Das, K.; Pereira, P. Urban expansion induced loss of natural vegetation cover and ecosystem service values: A scenario-based study in the Siliguri Municipal Corporation (Gateway of North-East India). Land Use Policy 2023, 132, 106838. [Google Scholar] [CrossRef]
  84. Li, G.D.; Sun, S.; Fang, C.L. The varying driving forces of urban expansion in China: Insights from a spatial-temporal analysis. Landsc. Urban Plan. 2018, 174, 63–77. [Google Scholar] [CrossRef]
  85. Shanghai Municipal Government. Shanghai Urban Master Plan (2017–2035); Shanghai Municipal Government: Shanghai, China, 2017. Available online: https://ghzyj.sh.gov.cn/cmsres/65/65a89e5a71aa44b1a7b8f45cbefaf414/0eb1d6b486b06ea9ed60decd246a4ee7.pdf (accessed on 25 June 2025).
  86. Wei, Y.H. Zone fever, project fever: Development policy, economic transition, and urban expansion in China. Geogr. Rev. 2015, 105, 156–177. [Google Scholar] [CrossRef]
  87. Lovell, S.T.; Taylor, J.R. Supplying urban ecosystem services through multifunctional green infrastructure in the United States. Landsc. Ecol. 2013, 28, 1447–1463. [Google Scholar] [CrossRef]
  88. Belmeziti, A.; Cherqui, F.; Kaufmann, B. Improving the multi-functionality of urban green spaces: Relations between components of green spaces and urban services. Sustain. Cities Soc. 2018, 43, 1–10. [Google Scholar] [CrossRef]
  89. Ghale, B.; Gupta, K.; Roy, A. Exploring the impact of urban planning on access to hierarchical green spaces: A comparative study between planned and unplanned cities. Urban For. Urban Green. 2025, 112, 128913. [Google Scholar] [CrossRef]
  90. Liu, R.X.; Yan, X.Y.Y.; Lin, X.L.; Sun, Y.C.; Zhang, T.; Xiao, J. Urban spontaneous plant richness in response to the 2D/3D building and green space patterns in a highly urbanized area. Ecol. Indic. 2023, 154, 110852. [Google Scholar] [CrossRef]
  91. Depietri, Y. Planning for urban green infrastructure: Addressing tradeoffs and synergies. Curr. Opin. Environ. Sustain. 2022, 54, 101148. [Google Scholar] [CrossRef]
  92. Aragonez, R.A.G.; Duran, A.M.; Martin, X. Green infrastructure for reintegrating fragmented urban fabrics: Multiscale methodology using space syntax and hydrologic modeling. Urban Sci. 2025, 9, 208. [Google Scholar] [CrossRef]
  93. Elsadek, M.; Liu, B.Y.; Xie, J.F. Window view and relaxation: Viewing green space from a high-rise estate improves urban dwellers’ wellbeing. Urban For. Urban Green. 2020, 55, 126846. [Google Scholar] [CrossRef]
  94. Littke, H. Planning the green walkable city: Conceptualizing values and conflicts for urban green space strategies in Stockholm. Sustainability 2015, 7, 11306–11320. [Google Scholar] [CrossRef]
  95. Wang, Z.; Yu, Y.; Zhou, R. A longitudinal exploration of the spatiotemporal coupling relationship and driving factors between regional urban development and ecological quality of green space. Ecol. Indic. 2024, 164, 112134. [Google Scholar] [CrossRef]
  96. Verdú-Vázquez, A.; Fernández-Pablos, E.; Lozano-Diez, R.V.; Lopez-Zaldivar, O. Green space networks as natural infrastructures in peri-urban areas. Urban Ecosyst. 2021, 24, 187–204. [Google Scholar] [CrossRef]
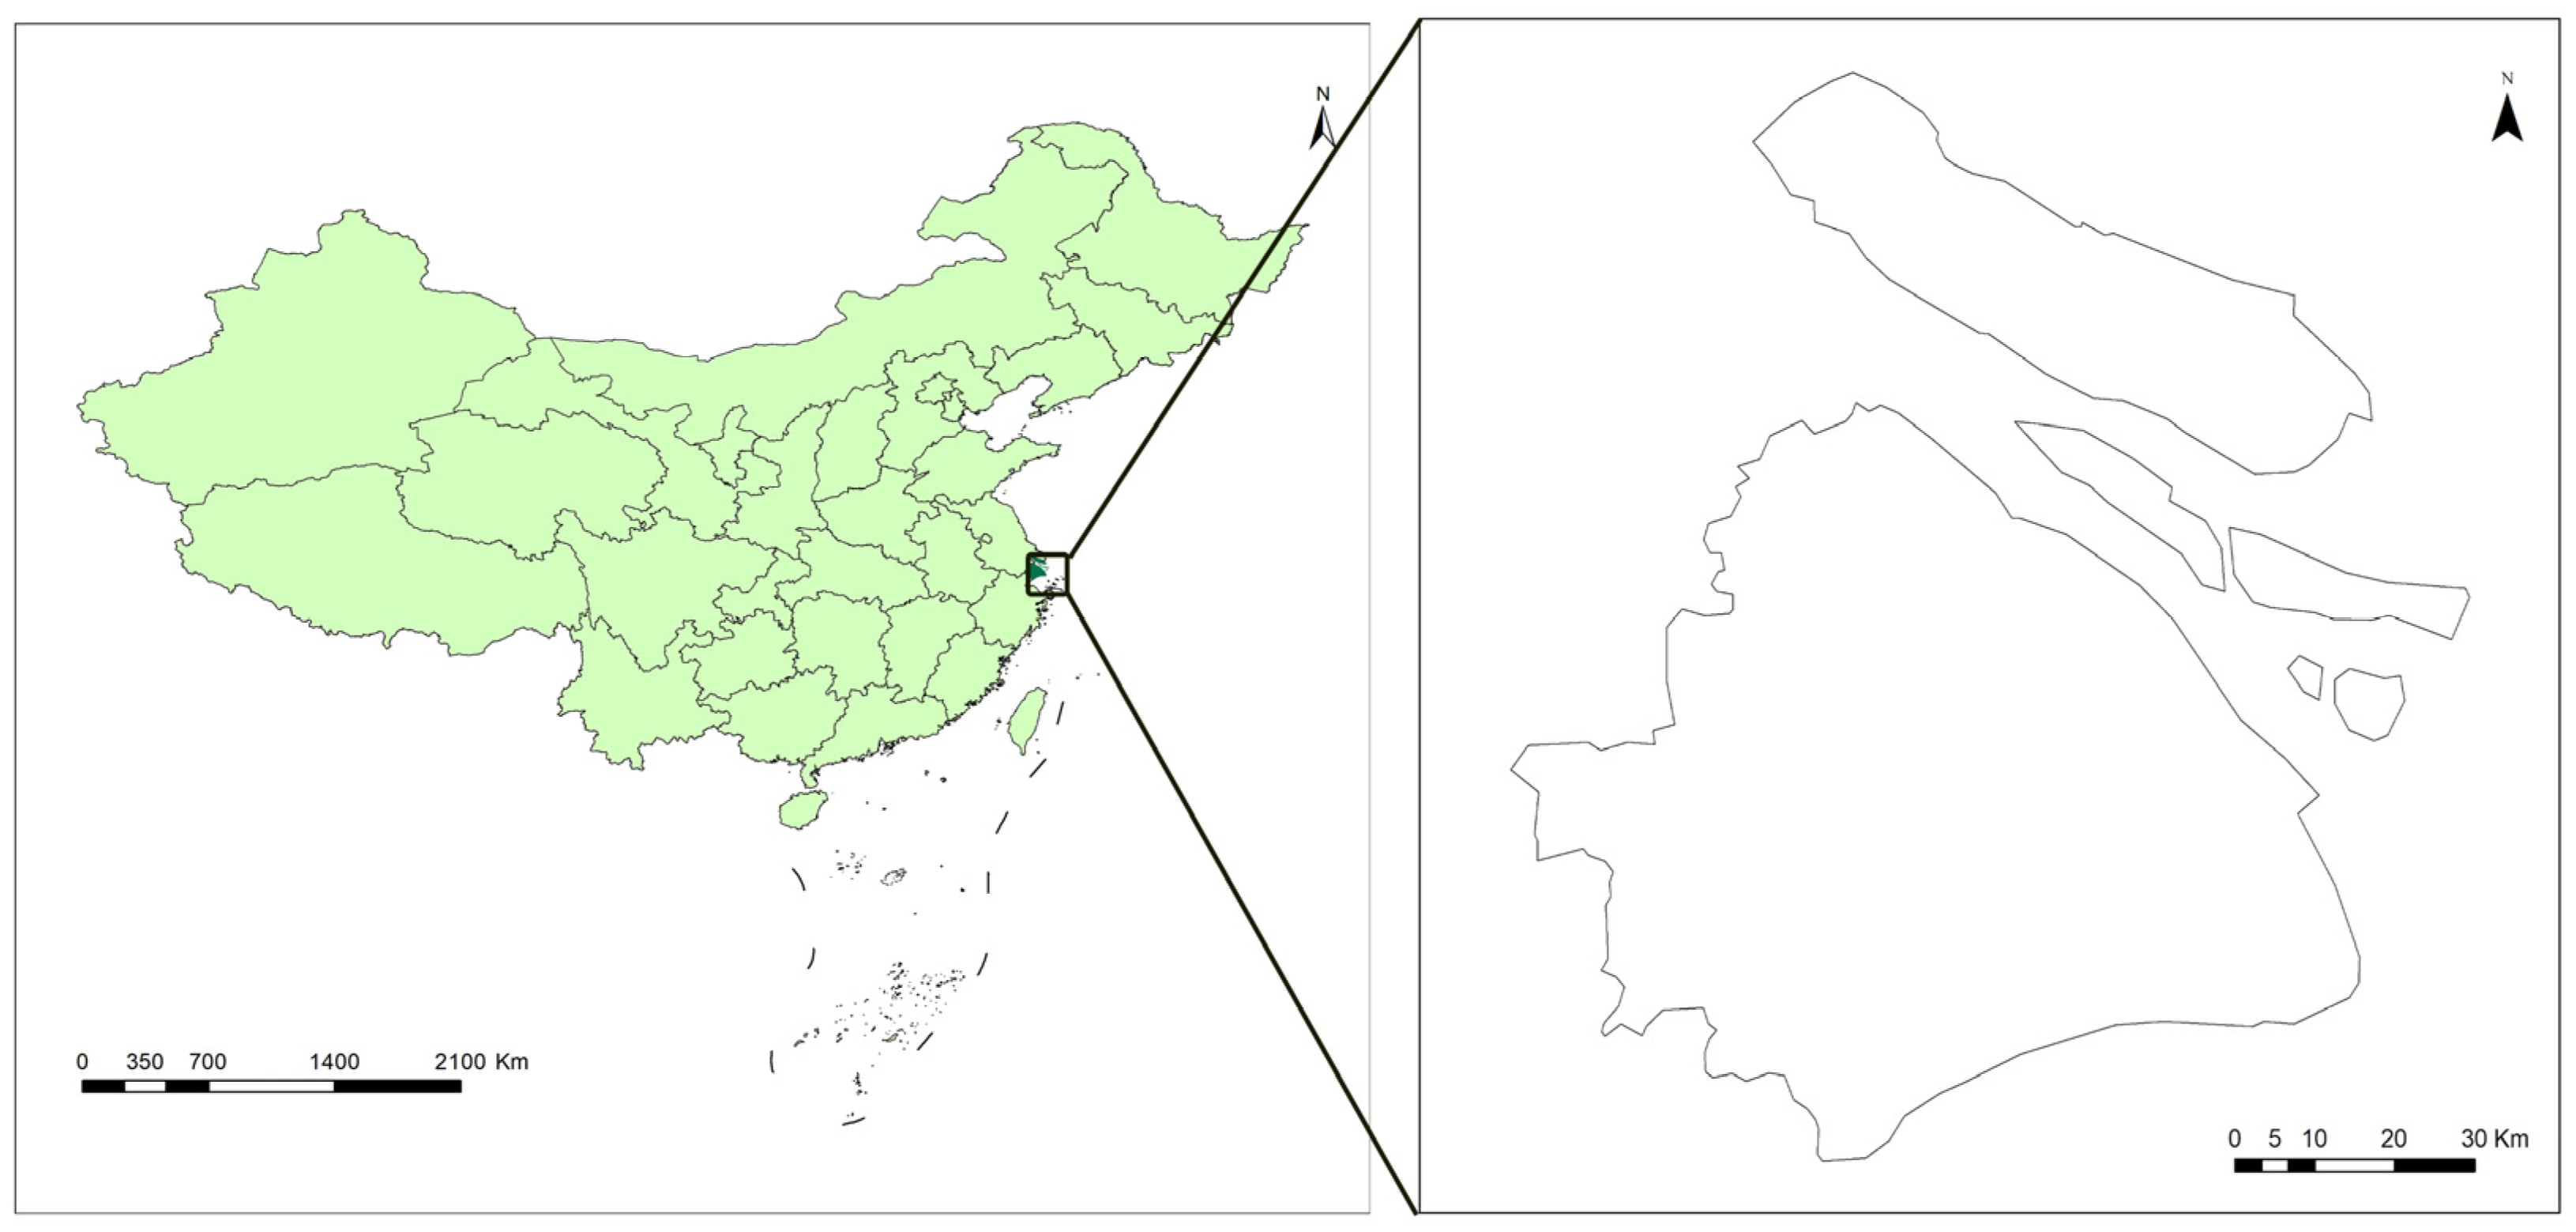
Figure 1. Geographical location of the study area: Shanghai, China. The map illustrates the administrative boundary and spatial extent of Shanghai, situated at the estuary of the Yangtze River.
Sustainability 17 06828 g001
Figure 2. Pearson correlation heatmap of the final indicator set.
Sustainability 17 06828 g002
Figure 3. BEI and GSPI coupling theoretical framework diagram. In the figure, the dark color represents BEI, the green color represents GSPI, and the three middle subfigures indicate the intensity levels of BEI and GSPI within a single cloud.
Sustainability 17 06828 g003
Figure 4. Research technical flowchart.
Sustainability 17 06828 g004
Figure 5. Composite Built Environment Index in Shanghai.
Sustainability 17 06828 g005
Figure 6. Composite Green Space Pattern Index in Shanghai.
Sustainability 17 06828 g006
Figure 7. Spatial distribution of clustering patterns in Shanghai.
Sustainability 17 06828 g007
Figure 8. Spatial distribution of the coupling coordination degree between the built environment and green space patterns in Shanghai.
Sustainability 17 06828 g008
Figure 9. Relative importance of green space pattern and built environment indicators. (a) shows the global importance of indicators, which calculates the average absolute SHAP value of all indicators, representing the degree of importance of the indicators; (b) shows the local importance of indicators, plotting the SHAP value of each feature of each indicator, representing the scope of influence on the dataset.
Sustainability 17 06828 g009
Figure 10. Threshold effects of green space pattern and built environment indicators. In the figure, the purple dashed line is a fitted curve, representing the overall trend of the scatter distribution; the black dashed line is an intersection marking line, and this intersection indicates the critical point (threshold) where the positive and negative impacts of the indicator features switch.
Sustainability 17 06828 g010aSustainability 17 06828 g010b
Table 1. Indicator system for the built environment and green space pattern, along with corresponding VIF values.
IndicatorsNo.VariableVIF
Built Environment Indicators (BEI)1Building Density3.418191
2Weighted Average Height1.430039
3Road Density1.342832
4POI Density1.471579
5Green Space Ratio1.043532
6Population Density2.111864
7Bus Stop Density1.189187
8Average Compactness2.710779
9Land Use Diversity1.488116
10Water Body Ratio1.869330
Green Space Pattern Indicators(GSPI)11Green Coverage Ratio2.965984
12Largest Patch Index1.584769
13Number of Patches2.914436
14Shape Index1.237455
15Aggregation Index3.330684
Table 2. Performance comparison of four machine learning models.
Linear RegressionRandom ForestLightGBMXGBoost
MAE0.0053210.0021670.0020860.002123
MSE0.0000880.0000270.0000240.000026
RMSE0.0093840.0052160.0048810.005097
R20.9731890.9917170.9927460.992090
Residual plotSustainability 17 06828 i001Sustainability 17 06828 i002Sustainability 17 06828 i003Sustainability 17 06828 i004
Table 3. Weight coefficients of built environment indicators.
VariableAttention_Weight
Building Density0.09701068
Weighted Average Height0.111377545
Road Density0.082808815
POI Density0.099431455
Green Space Ratio0.10096676
Population Density0.096694775
Bus Stop Density0.11039864
Average Compactness0.104573995
Land Use Diversity0.08181346
Water Body Ratio0.1149288
Table 4. Weight coefficients of green space pattern indicators.
VariableAttention_Weight
Green Coverage Ratio0.212185
Largest Patch Index0.269961
Number of Patches0.121384
Shape Index0.185129
Aggregation Index0.211341
Disclaimer/Publisher’s Note: The statements, opinions and data contained in all publications are solely those of the individual author(s) and contributor(s) and not of MDPI and/or the editor(s). MDPI and/or the editor(s) disclaim responsibility for any injury to people or property resulting from any ideas, methods, instructions or products referred to in the content.