Article

Evapotranspiration in a Small Well-Vegetated Basin in Southwestern China

1
Faculty of Geography, Yunnan Normal University, Kunming 650500, China
2
State Key Laboratory of Remote Sensing and Digital Earth, Faculty of Geographical Science, College of Global Change and Earth System Science, Beijing Normal University, Beijing 100875, China
3
State Key Laboratory of Earth Surface Processes and Disaster Risk Reduction, Faculty of Geographical Science, College of Global Change and Earth System Science, Beijing Normal University, Beijing 100875, China
4
National Climate Center, Beijing 100081, China
5
Beijing Hydrological Station, Beijing 100089, China
6
CAS Key Laboratory of Forest Ecology and Management, Institute of Applied Ecology, Chinese Academy of Sciences, Shenyang 110016, China
7
E’erguna Wetland Ecosystem National Research Station, Hulunbuir 022250, China
*
Authors to whom correspondence should be addressed.
Sustainability 2025, 17(15), 6816; https://doi.org/10.3390/su17156816
Submission received: 10 June 2025 / Revised: 22 July 2025 / Accepted: 24 July 2025 / Published: 27 July 2025

Abstract

Evapotranspiration (ET) crucially regulates water storage dynamics and is an essential component of the terrestrial water cycle. Understanding ET dynamics is fundamental for sustainable water resource management, particularly in regions facing increasing drought risks under climate change. In regions like southwestern China, where extreme drought events are prevalent due to complex terrain and climate warming, ET becomes a key factor in understanding water availability and drought dynamics. Using the SWAT model, this study investigates ET dynamics and influencing factors in the Jizi Basin, Yunnan Province, a small basin with over 71% forest coverage. The model calibration and validation results demonstrated a high degree of consistency with observed discharge data and ERA5, confirming its reliability. The results show that the annual average ET in the Jizi Basin is 573.96 mm, with significant seasonal variations. ET in summer typically ranges from 70 to 100 mm/month, while in winter, it drops to around 20 mm/month. Spring ET exhibits the highest variability, coinciding with the occurrence of extreme hydrological events such as droughts. The monthly anomalies of ET effectively reproduce the spring and early summer 2019 drought event. Notably, ET variation exhibits significant uncertainty under scenarios of +1 °C temperature and −20% precipitation. Furthermore, although land use changes had relatively small effects on overall ET, they played crucial roles in promoting groundwater recharge through enhanced percolation, especially forest cover. The study highlights that, in addition to climate and land use, soil moisture and groundwater conditions are vital in modulating ET and drought occurrence. The findings offer insights into the hydrological processes of small forested basins in southwestern China and provide important support for sustainable water resource management and effective climate adaptation strategies, particularly in the context of increasing drought vulnerability.

1. Introduction

Water resources are essential for sustaining agricultural activities and are critical factors in social and economic development [1,2]. Unlike most natural resources, a key characteristic of water is its renewability. Evapotranspiration (ET) transforms water from liquid to vapor, which then condenses and returns to the surface [3]. As a key link between the land surface and the atmosphere, ET plays a crucial role in regional water cycles and is an important indicator of the intensity of the water cycle [4,5]. It encompasses three main processes: evaporation from water bodies and soils, and transpiration by vegetation. ET serves as a vital mediator in the global water cycle, influencing the exchange of water between water bodies, soil, vegetation, and the atmosphere [6]. Investigating the temporal changes in ET helps to accurately estimate regional water balances and enhances our understanding of the hydrological interactions between land and atmosphere [7,8]. In recent years, with rapid changes in climate and human activities, global water cycles have exhibited significant spatial and temporal variability [9]. To understand the changes in basin water cycles under the influence of human activities and global warming, it is crucial to scientifically assess the impacts of climate and land use changes on basin ET for the effective integrated management of basin water resources.
Currently, ET is mainly assessed and calculated through ground observations and remote sensing inversion methods. Direct measurements include early lysimeters [10,11], the Bowen Ratio [12], and more widely used methods such as Eddy Covariance [13,14] and Large Aperture Scintillometers [15,16]. While these methods provide accurate point or field scale ET estimates, surface heterogeneity limits their scalability to large regions. For example, methods such as lysimeters and Bowen Ratio-based energy balance systems operate at point scales (ranging from a few meters to several hundred meters). In contrast to ground-based observations, remote sensing inversion of ET offers the possibility of estimating ET at regional scales [17,18]. Over recent years, scholars worldwide have developed and released remote sensing products for regional and global ET estimates at various spatial and temporal resolutions, such as the MOD 16, LSA-SAF, SSEBop, GLASS, ETMonitor, BESS, and GLEAM products. Significant advancements have been made in remote sensing-based ET estimation [19,20,21].
In addition to these methods, many researchers also use the water balance method to estimate ET. The water balance method assumes that ET over a given period is the difference between precipitation and runoff, with changes in water storage being negligible [22]. Hydrological models based on water balance, which simulate the movement of water between the land surface and the atmosphere based on the principles of mass, momentum, and energy conservation, could study the entire hydrological cycle as a comprehensive system. These models are powerful tools for studying global water cycle changes. Using hydrological models to explore ET helps to understand its role in the water cycle and allows for flexible exploration of the impact of other factors on ET [23,24]. Among these hydrological models, the SWAT (Soil and Water Assessment Tool) model is a widely used distributed hydrological model over globe. By integrating multi-source remote sensing data, the SWAT model shows advantages in ET simulation over complex topographic areas, especially in irrigated farmland and complex climate zones [25,26,27]. Continuous development of the SWAT model has significantly enhanced its dynamic ET simulation capabilities. Compared to conventional hydrological models such as the Variable Infiltration Capacity (VIC) and MIKE SHE, the SWAT achieves superior simulation accuracy and adaptability in regions like the Kangsabati River Basin of eastern India, owing to its refined representation of hydrological processes in paddy fields under Alternate Wetting and Drying irrigation practices [28,29].
Southwestern China is one of the most complex topography regions in the world. It is characterized by the highest and most intricate terrain on Earth, including the Qinghai–Tibet Plateau, the Yunnan–Guizhou Plateau, the Hengduan Mountains, and the Sichuan Basin, which form the primary continental landforms of the region. The diversity of topography and landforms results in unique weather and climate characteristics. Under the dual influence of the southwest and southeast monsoons, the region experiences distinct wet and dry seasons [30], with the rainy season arriving later than that in other regions at the same latitude. This delayed onset of the rainy season contributes to an increased frequency of spring droughts, as well as persistent dry periods during the winter–spring and spring–summer seasons. Furthermore, the region is home to numerous small basins, which play a vital supporting role in local agriculture and socio-economic development. Small basins exhibit heightened sensitivities to extreme climatic events, experiencing higher flood and drought frequencies than medium to large basins due to compact hydrological systems and rapid response mechanisms [31]. As socio-economic water demand increases and land use changes, the water scarcity in the region is likely to intensify [32,33].
Jizi Basin, which is located in southwestern China, is a small basin, covered by 71.21% forest, 9.67% grass, 15.06% crop, and other land use types. It is an internationally significant wetland designated under the Ramsar Convention, which serves as a core water source for Lashi Lake. Its water volume directly impacts the stability of the wetland ecosystem and the habitat quality of rare migratory birds such as black-necked cranes (Grus nigricollis) and bar-headed geese (Anser indicus). Additionally, its water resources support agricultural irrigation and the specialty potato seed industry, constraining local socio-economic development. Located on the southeastern edge of the Qinghai–Tibet Plateau, the basin is highly sensitive to climate change. However, hydrological cycle in this basin was less known, especially for ET, which is essentially important for well-vegetated basin.
Therefore, this study aims to develop a SWAT-based hydrological simulation system for the Jizi Basin, driven by meteorological forcing for 2016–2020. The model was tuned by the discharge in the outlet of the basin. Then, the variation in ET for 2016–2020 was investigated. In addition, the impacts of climate change and human activities on ET were studied. This research not only contributes to the rational allocation and planning of water resources in the region but also provides valuable insights into the general patterns of ET in small basins of southwestern China.

2. Materials and Methods

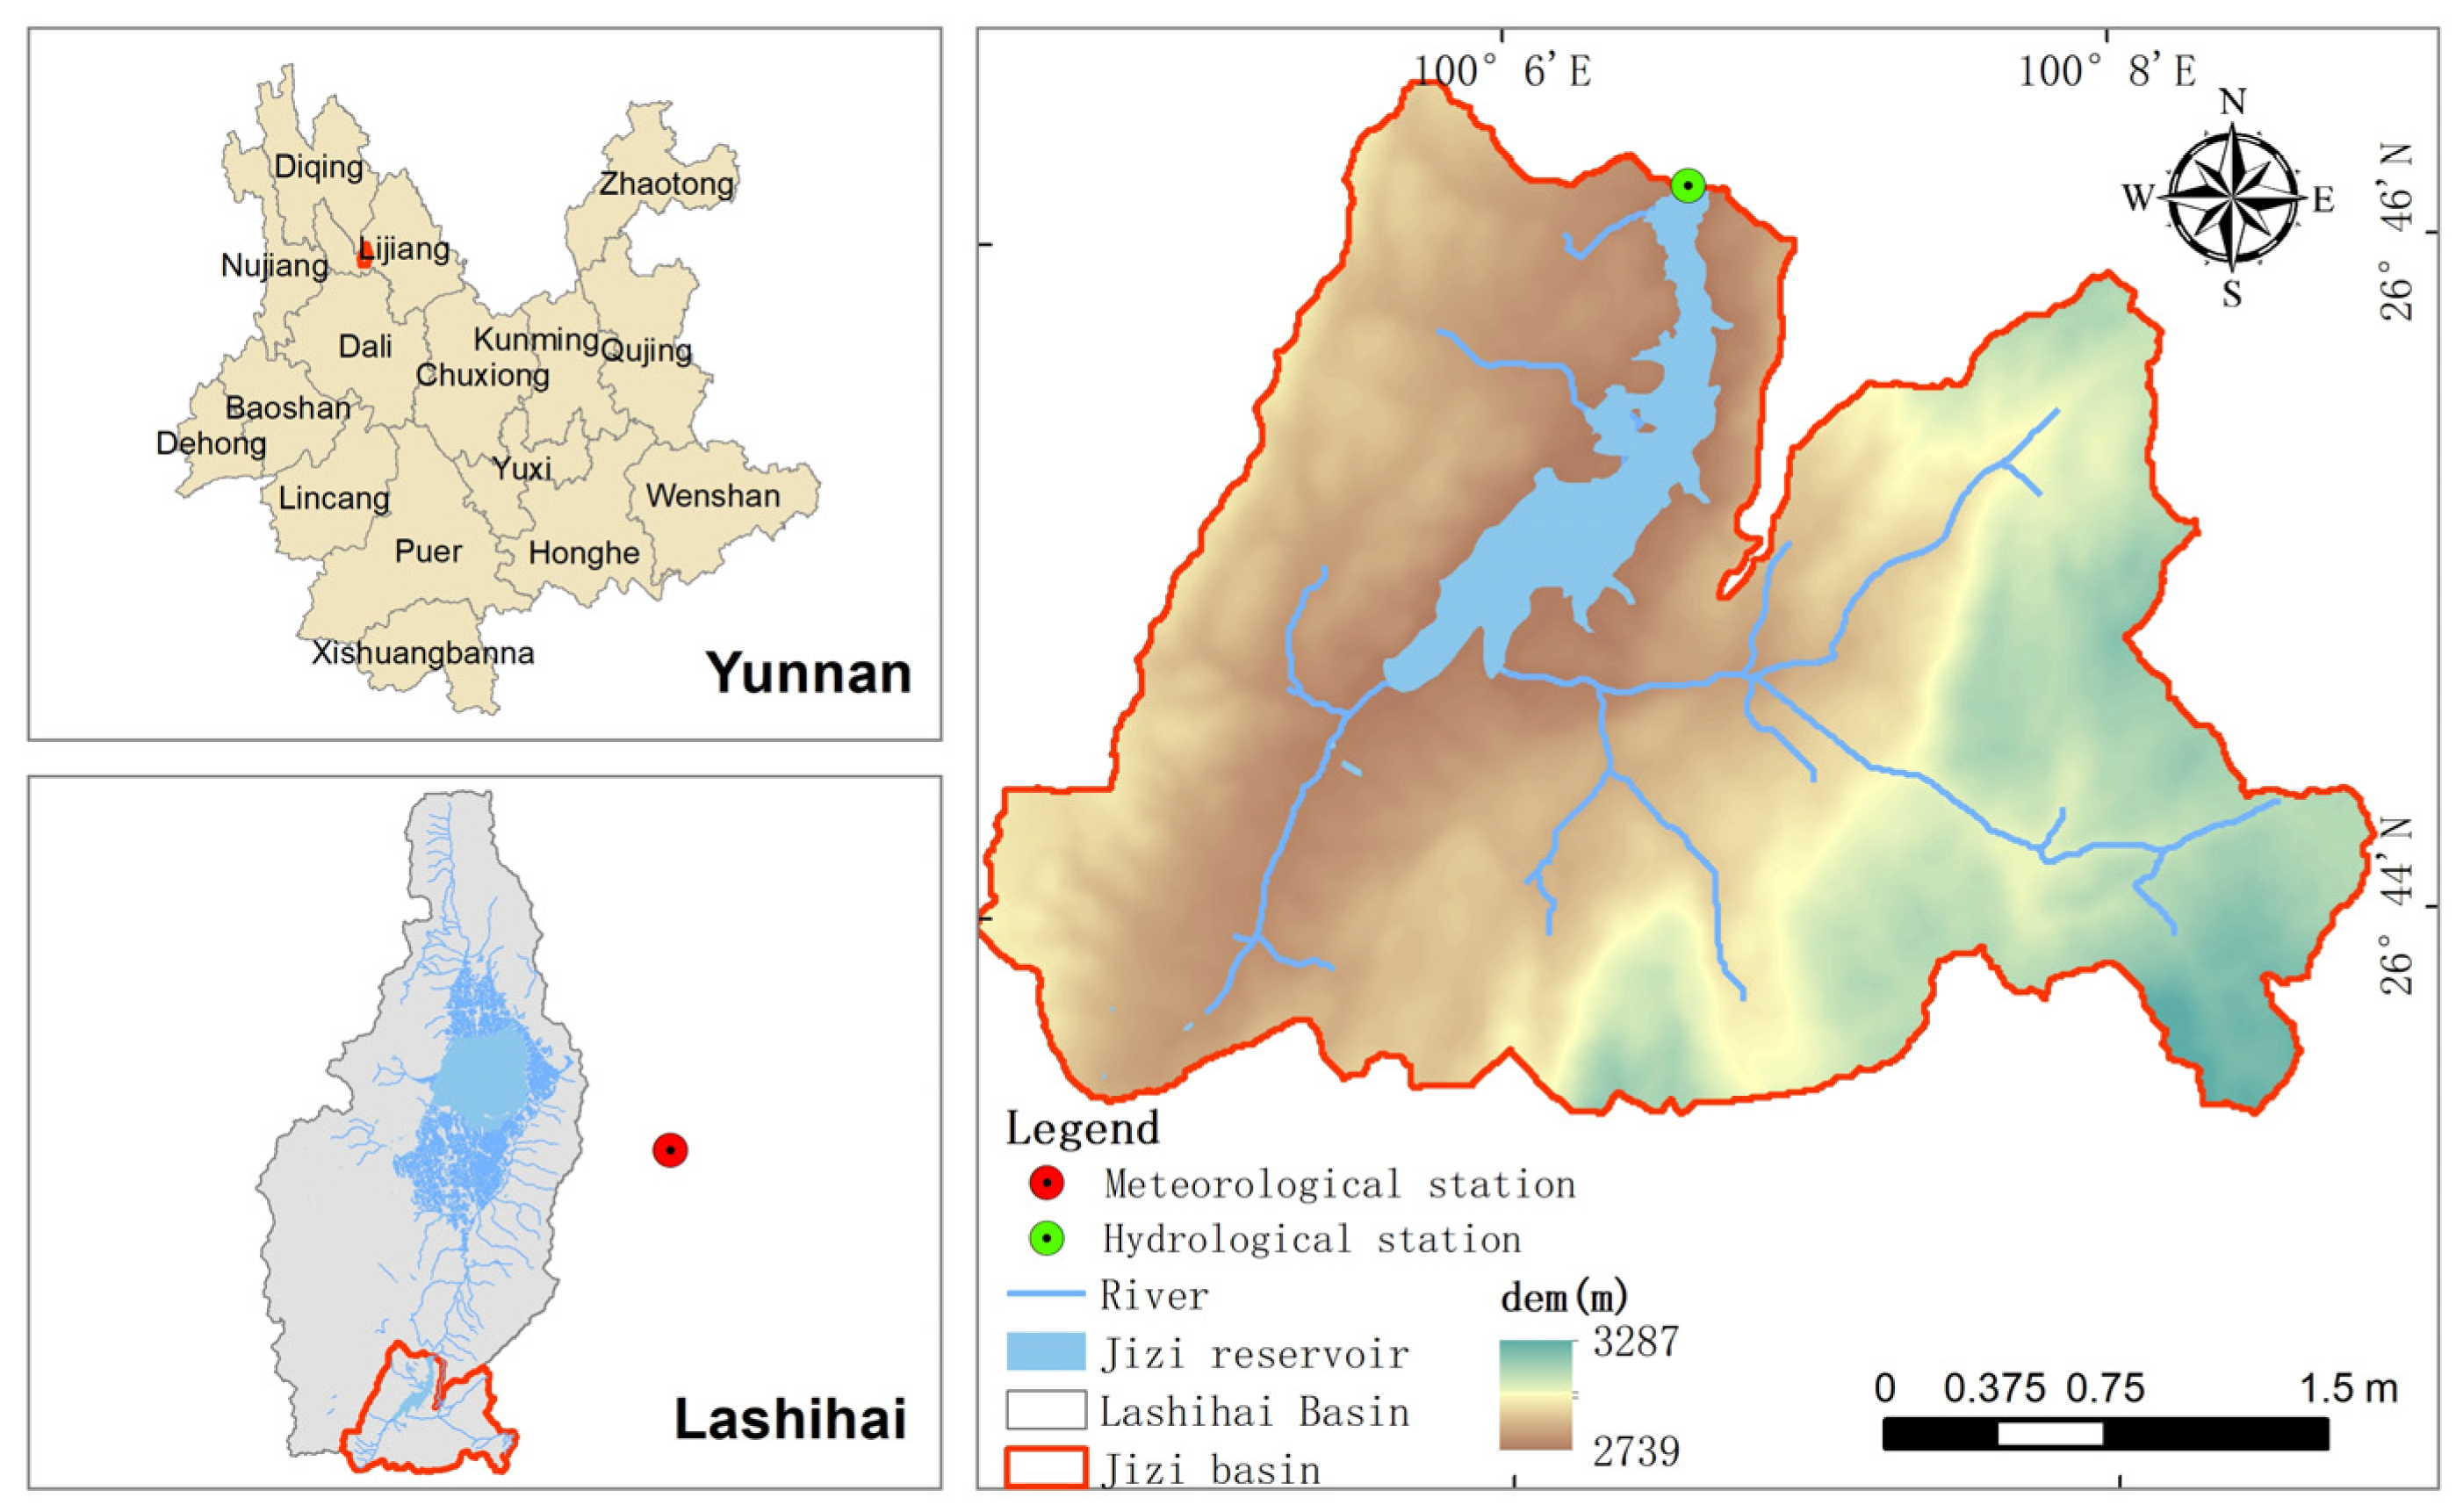
2.1. Study Domain and Materials

The Jizi Basin is located in the Yulong Naxi Autonomous County, Lijiang City, Yunnan Province, southwestern China (between 99°23′ E to 100°32′ E and 26°34′ N to 27°46′ N), and falls within the Lashi Lake Nature Reserve (Figure 1). The area is characterized by well-established vegetation cover. The Lashi Lake Nature Reserve features a unique wetland type, both closed and semi-closed, known as Lashi Lake, which is a typical plateau lake wetland in the Jinsha River system. It plays a crucial role in balancing water volumes and regulating water levels in the middle and lower reaches of the Jinsha River, as well as in biodiversity conservation. The Jizi Basin is located to the southwest of the core area of Lashi Lake within the reserve, in the eastern part of Taian Township, covering an area of 25.94 km2. It is one of the four key areas of the Lashi Lake Nature Reserve and a major source of water for the Lashi Lake wetland.
Jizi Basin is dominating by plateau mountain climate. The elevation of Jizi Basin ranges from 2739 m to 3287 m, with slopes varying from 0° to 45.97°. The region experiences an average annual precipitation of approximately 960 mm, with a distinct dry season from November to April and a rainy season from May to October. Nearly 50% of the annual rainfall occurs in July and August. The basin includes a variety of land use types, such as cropland (15.06%), forest (71.21%), grassland (9.67%), water bodies (3.77%), and bare land (0.21%). The widespread distribution of brown soil throughout the study area supports predominantly coniferous forests, such as pure alpine pine stands and mixed forests of pine–birch or pine–oak. Human activities in the basin are mainly centered on agriculture and animal husbandry, with potato being the primary cultivated crop. Overall, the intensity of human disturbance remains relatively low.
The data used to construct the SWAT model for the Jizi Basin and calibrate the model primarily include DEM (Digital Elevation Model) data, land use data, soil data, meteorological data, and hydrological observation data. The sources of all the data used in the article are listed in Table 1. Daily meteorological data (e.g., precipitation, temperature, humidity) were obtained from the CMA and subjected to strict quality control. Given the basin’s compact size (25.94 km2) and the absence of internal meteorological stations, we used data from the nearby Lijiang station. Validation against ERA5 and TRMM datasets showed strong consistency (temperature R2 = 0.99; precipitation R2 = 0.87; see Supplementary Figures S1 and S2), supporting its reliability for representing basin-scale climate conditions despite elevation differences (2739–3287 m). Daily discharge observations were obtained from hydrological stations and were generally of moderate to good quality (source: regional bureau).

2.2. Research Methods

2.2.1. SWAT Model Construction

In this study, the SWAT model was used to simulate the hydrological processes of the Jizi Basin. The SWAT model simulates the water balance based on climate inputs, land use, soil properties, and topography. The model framework calculates ET using the Penman–Monteith method by default, which is forced by radiation, air temperature, humidity, and wind speed. Land use and soil parameters affect ET through plant-specific characteristics such as leaf area index, root depth, and phenological growth stages, which vary across different land cover types. DEM data were used to analyze flow direction and generate the river network. Based on the local conditions, the basin was divided into 33 subbasins. In the SWAT, Hydrologic Response Units (HRUs) are defined as unique combinations of land use, soil type, and slope class within each subbasin. In our study, the pre-processed land use, soil, and slope datasets were overlaid and classified using a 5% threshold for each category. Through this spatial disaggregation process, the model generated a total of 253 HRUs. Meteorological and soil databases were also developed for model calibration. The meteorological data, including precipitation, temperature, wind speed, humidity, and solar radiation, were sourced from the Lijiang Meteorological Station, and a weather generator was used for simulation. The soil database, containing physical and chemical properties of various soil types, was primarily sourced from the HWSD database, with additional soil parameters (such as wet density, effective moisture content, and saturated hydraulic conductivity) calculated using the SPAW software (Version 6.02.75). The Universal Soil Loss Equation (USLE) was applied to calculate soil erosion factors [34]. Hydrological processes for the Jizi Basin from 2016 to 2020 were simulated on a monthly time step.

2.2.2. Climate Change and Land Use Change Scenario Setup

To project future climate trends at the basin scale, researchers often rely on indirect approaches. Commonly used methods comprise three primary approaches: (1) the climate scenario perturbation method, where temperature and precipitation are systematically perturbed within plausible future ranges to analyze hydrological responses; (2) GCM-based projections, which utilize General Circulation Model outputs to construct dynamically downscaled future climate scenarios; and (3) statistical trend analysis, identifying long-term patterns in historical climate data to project hydrological changes. Considering the small size of the study area, this study adopts the assumed climate scenario method. To explore the potential impact of climate warming on regional ET, we refer to the key global warming thresholds proposed in the IPCC Special Report on Global Warming of 1.5 °C [35], and set scenarios with temperature increases of 1 °C and 2 °C. Based on an analysis of annual precipitation at the Lijiang station from 2000 to 2020, which shows values mainly ranging from 800 to 1000 mm with notable interannual variability—precipitation is adjusted by ±10% and ±20%. Additionally, scenarios combining simultaneous changes in both temperature and precipitation are considered. In all cases, land use is held constant, and only meteorological data from 2016 to 2020 are modified. These scenarios are then input into the SWAT model to simulate long-term average changes in ET under different climate conditions.
Land Use Scenario Setup: Based on the actual land use in the study area, extreme scenario assumptions are used. In these scenarios, one land use type is entirely converted into another, while all other land use types remain unchanged. This allows for a comparison of ET changes under different land use conditions. The study area primarily consists of cropland, grassland, and forest, which together account for 95.74% of the basin. Forests cover 71.21%, croplands 15.06%, and grasslands 9.67%. Therefore, only these three land use types are considered in the analysis. Proportionally, converting grasslands to forests would have limited impact on the overall ecosystem and entail higher costs, making it impractical. Therefore, converting all grassland to forest (grassland–forest) was excluded from consideration. Given that 74.41% of forest-classified land and 45.18% of grassland-classified land areas exceeding 15% slope (≈8.5° incline), which is generally unsuitable for agricultural cultivation, scenario analysis involving converting all forest to cropland (forest–cropland) and converting all grassland to cropland (grassland–cropland) were also excluded. Three land use change scenarios are tested in this study: converting all cropland to forest (cropland–forest), converting all cropland to grassland (cropland–grassland) and converting all forest to grassland (forest–grassland). These scenarios correspond to potential real-world processes such as reforestation, cropland restoration to grassland, and forest degradation.

3. Results

3.1. Parameter Sensitivity Analysis

Parameter calibration and uncertainty analysis were conducted using the SUFI-2 algorithm implemented in SWAT-CUP. Each parameter was assigned an initial uncertainty range (Table 2), and SUFI-2 iteratively adjusted parameter values by minimizing the difference between observed and simulated discharge using the objective function of Nash–Sutcliffe Efficiency (NSE). During each iteration, a Latin Hypercube sampling method was used to generate parameter sets. The best-fitting parameter ranges were then refined based on the behavioral simulations falling within the 95% prediction uncertainty (95PPU) band. This process continued until convergence criteria were met, ensuring that parameter changes remained within physically meaningful limits while optimizing model performance. Based on the t-statistic and p-value, which evaluate the statistical significance of parameter sensitivity, 12 key parameters were selected in SWAT-CUP for sensitivity analysis, model calibration, and validation. The sensitivity ranking of these parameters is also presented in Table 2.
The initial SCS runoff curve number for moisture condition II (CN2) and available water capacity of the soil layer (SOL_AWC) were the most sensitive parameters. Studies have shown that both CN2 and SOL_AWC exhibit strong sensitivity in most basins [36,37]. CN2, as a composite parameter, reflects the basin characteristics before rainfall and directly affects the amount of surface runoff. A higher CN2 value results in greater runoff. SOL_AWC refers to the water released by the soil when its moisture content drops from field capacity to the permanent wilting point, indicating the effective water holding capacity of the soil. A higher SOL_AWC value indicates stronger soil water retention and lower runoff. The study area is in a humid region, with abundant rainfall and relatively well-developed vegetation and soil. This provides ample water sources for soil and groundwater, contributing significantly to groundwater runoff. Therefore, groundwater-sensitive parameters are particularly influential in this area. The groundwater-sensitive parameters involved in this study include GWQMN and ALPHA_BF, all of which exhibit strong sensitivity. Several other parameters—such as SOL_BD, CANMX, OV_N, and CH_K2—were included in the calibration based on their moderate sensitivity and hydrological relevance. SOL_BD influences soil porosity and water retention capacity; CANMX affects interception and thus delays or reduces direct runoff; OV_N controls overland flow velocity by representing surface roughness; and CH_K2 governs the exchange between channel flow and groundwater, thereby affecting baseflow. Additionally, SLSUBBSN and HRU_SLP were selected due to the large elevation differences in the mountainous terrain of the study area, which make slope-related parameters particularly relevant.

3.2. Model Calibration and Validation Results

The effective calibration of basin discharge parameters directly affects the accuracy of model simulations. The model was calibrated by SUFI-2 optimization algorithm referenced to monthly observed discharge data from the Jizi hydrological station for 2016–2018. The model was iterated 500 times per cycle. Calibration was finished until the NSE (Nash–Sutcliffe Efficiency) no longer improved. The model was then validated using monthly observed discharge data for 2019–2020. Simulated and observed discharge, along with evaluation metrics, are shown in Figure 2. The average monthly discharge in the study area is 0.32 m3/s, which reflects the relatively low-flow characteristics of the Jizi Basin throughout the entire study period (2016–2020). During the calibration period, the R2 and NSE values for the simulated discharge were 0.95 and 0.90, respectively, while during the validation period, they were 0.91 and 0.84. These values indicate a strong monthly scale consistency between simulated and observed discharges, confirming the model accurately reflects actual discharge. The SWAT model shows a good applicability to the Jizi Basin. The discharge pattern in the basin exhibits distinct seasonal variations. During the winter and spring, discharge is relatively low, typically less than 0.2 m3/s, while during the summer and autumn, discharge is higher, with the peak discharge occurring in July 2018 of 1.378 m3/s. This pattern closely follows the precipitation distribution.

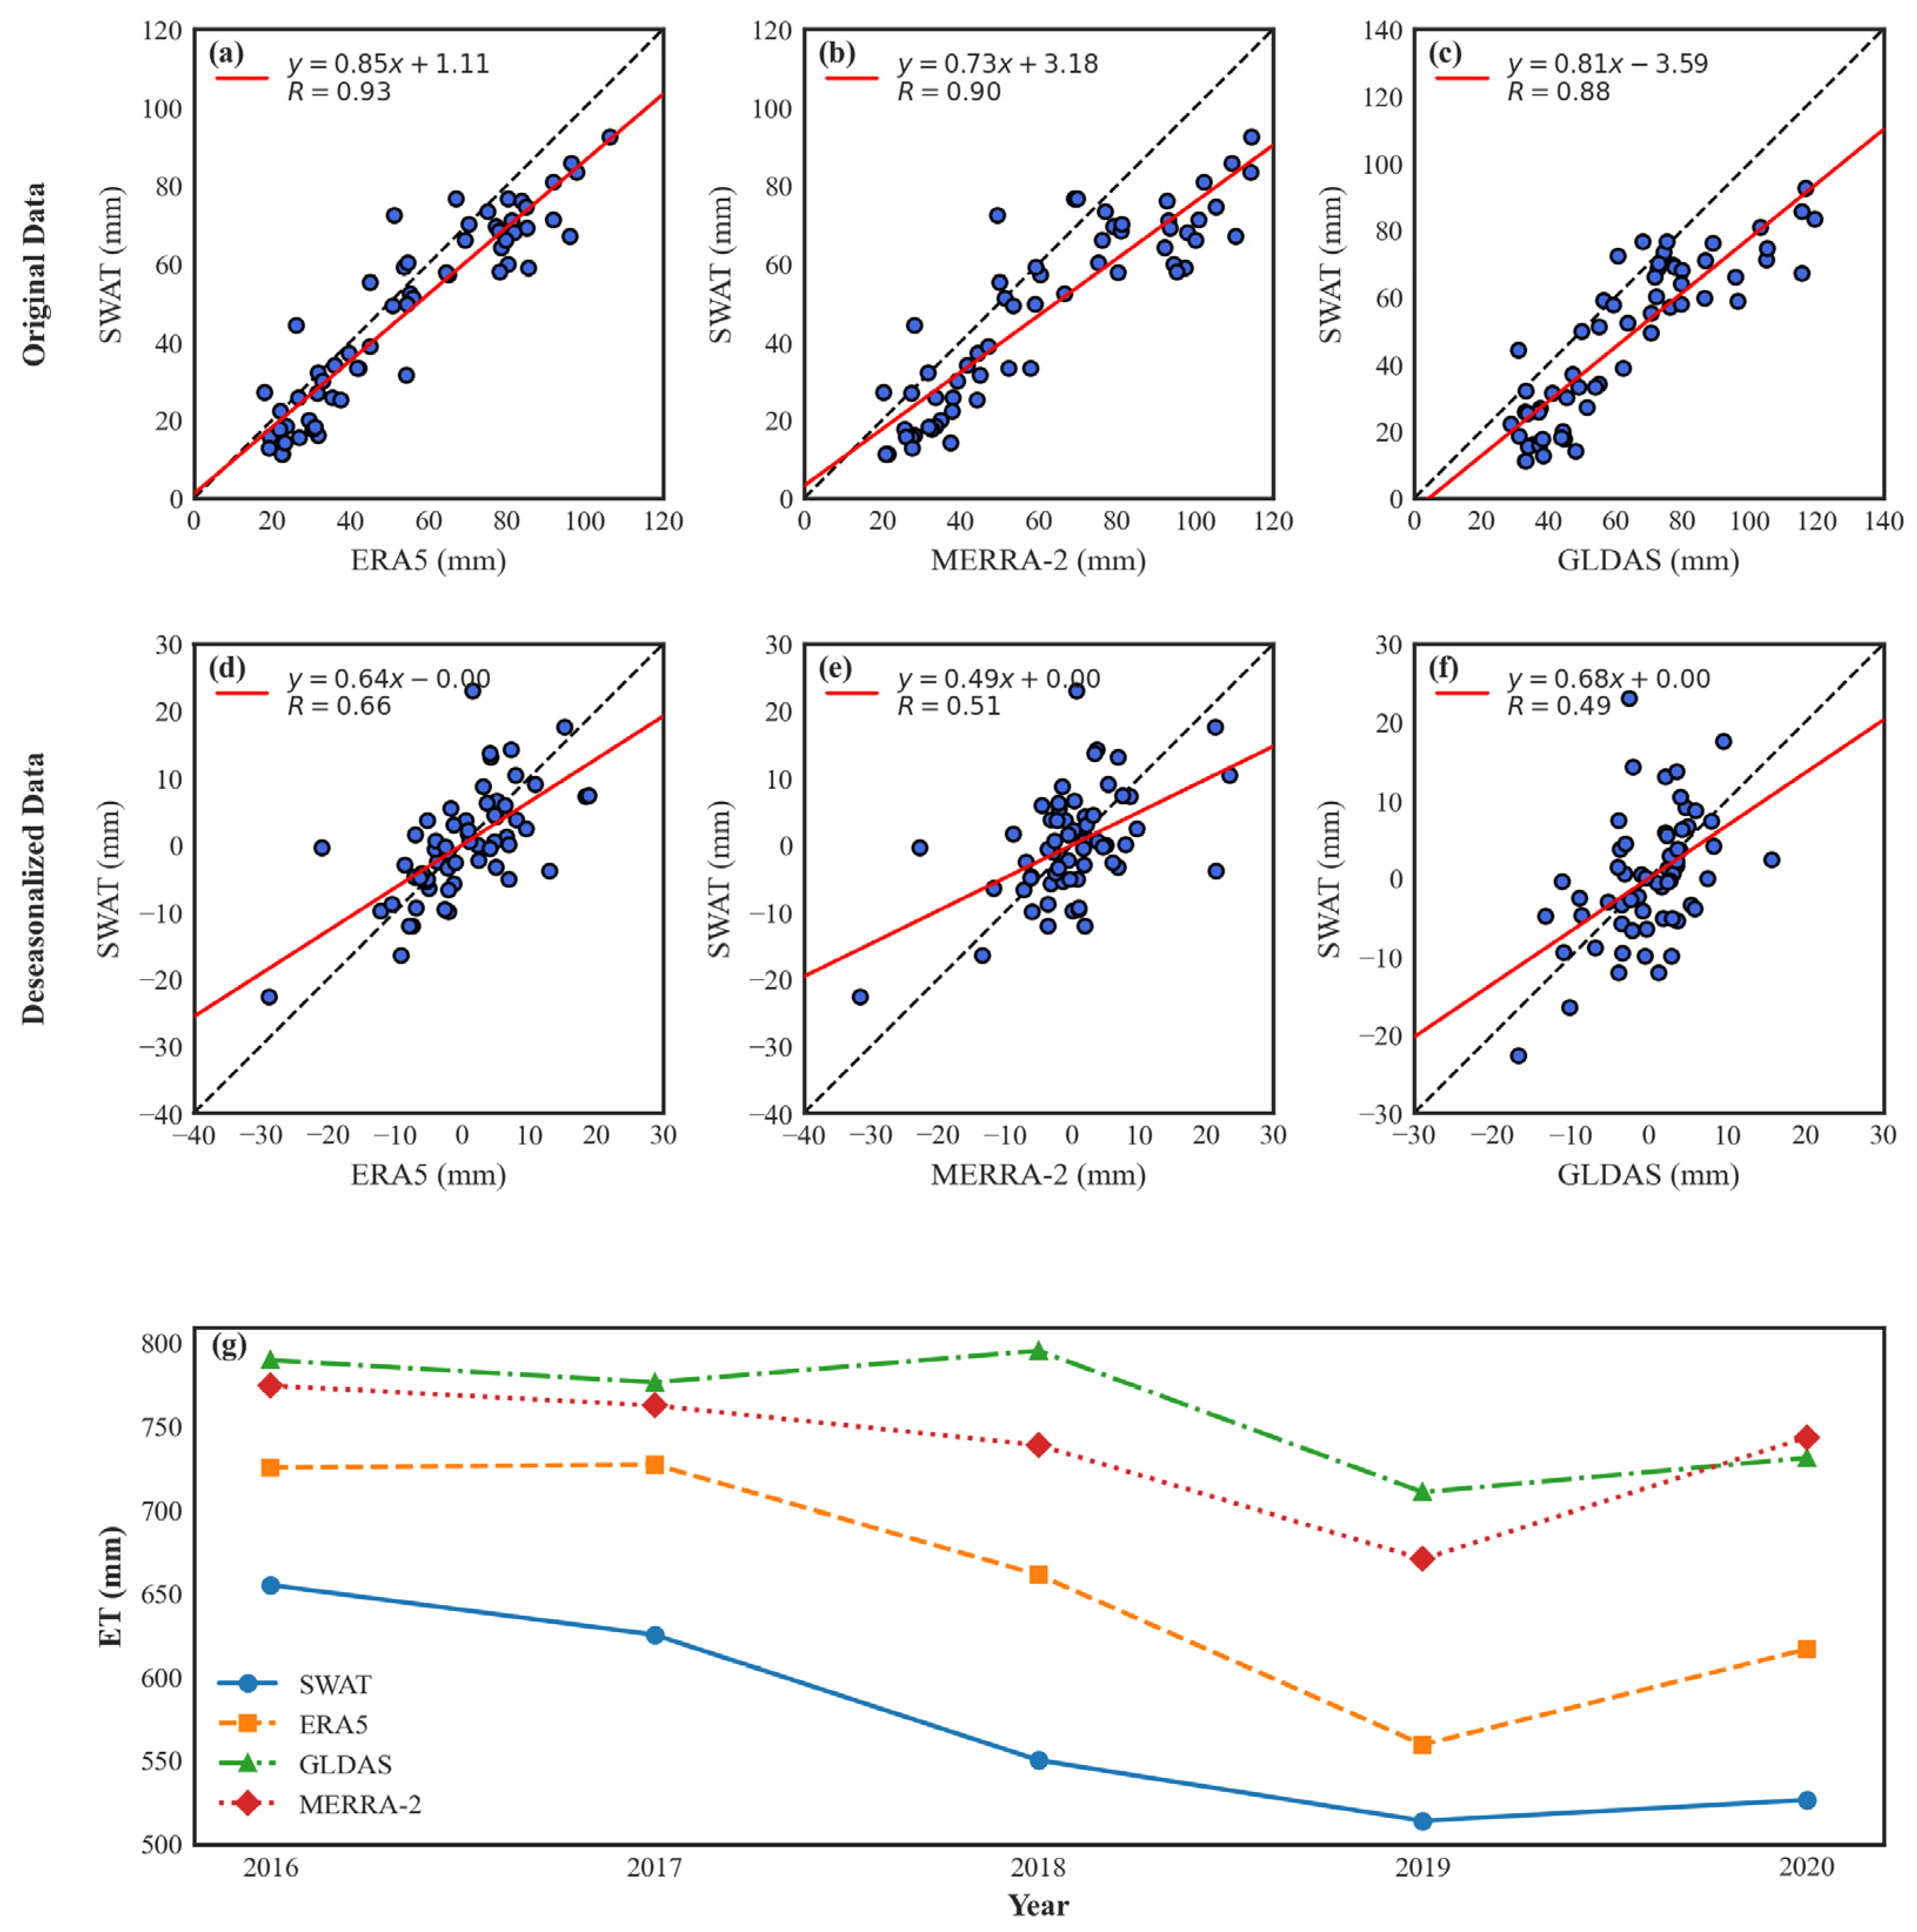
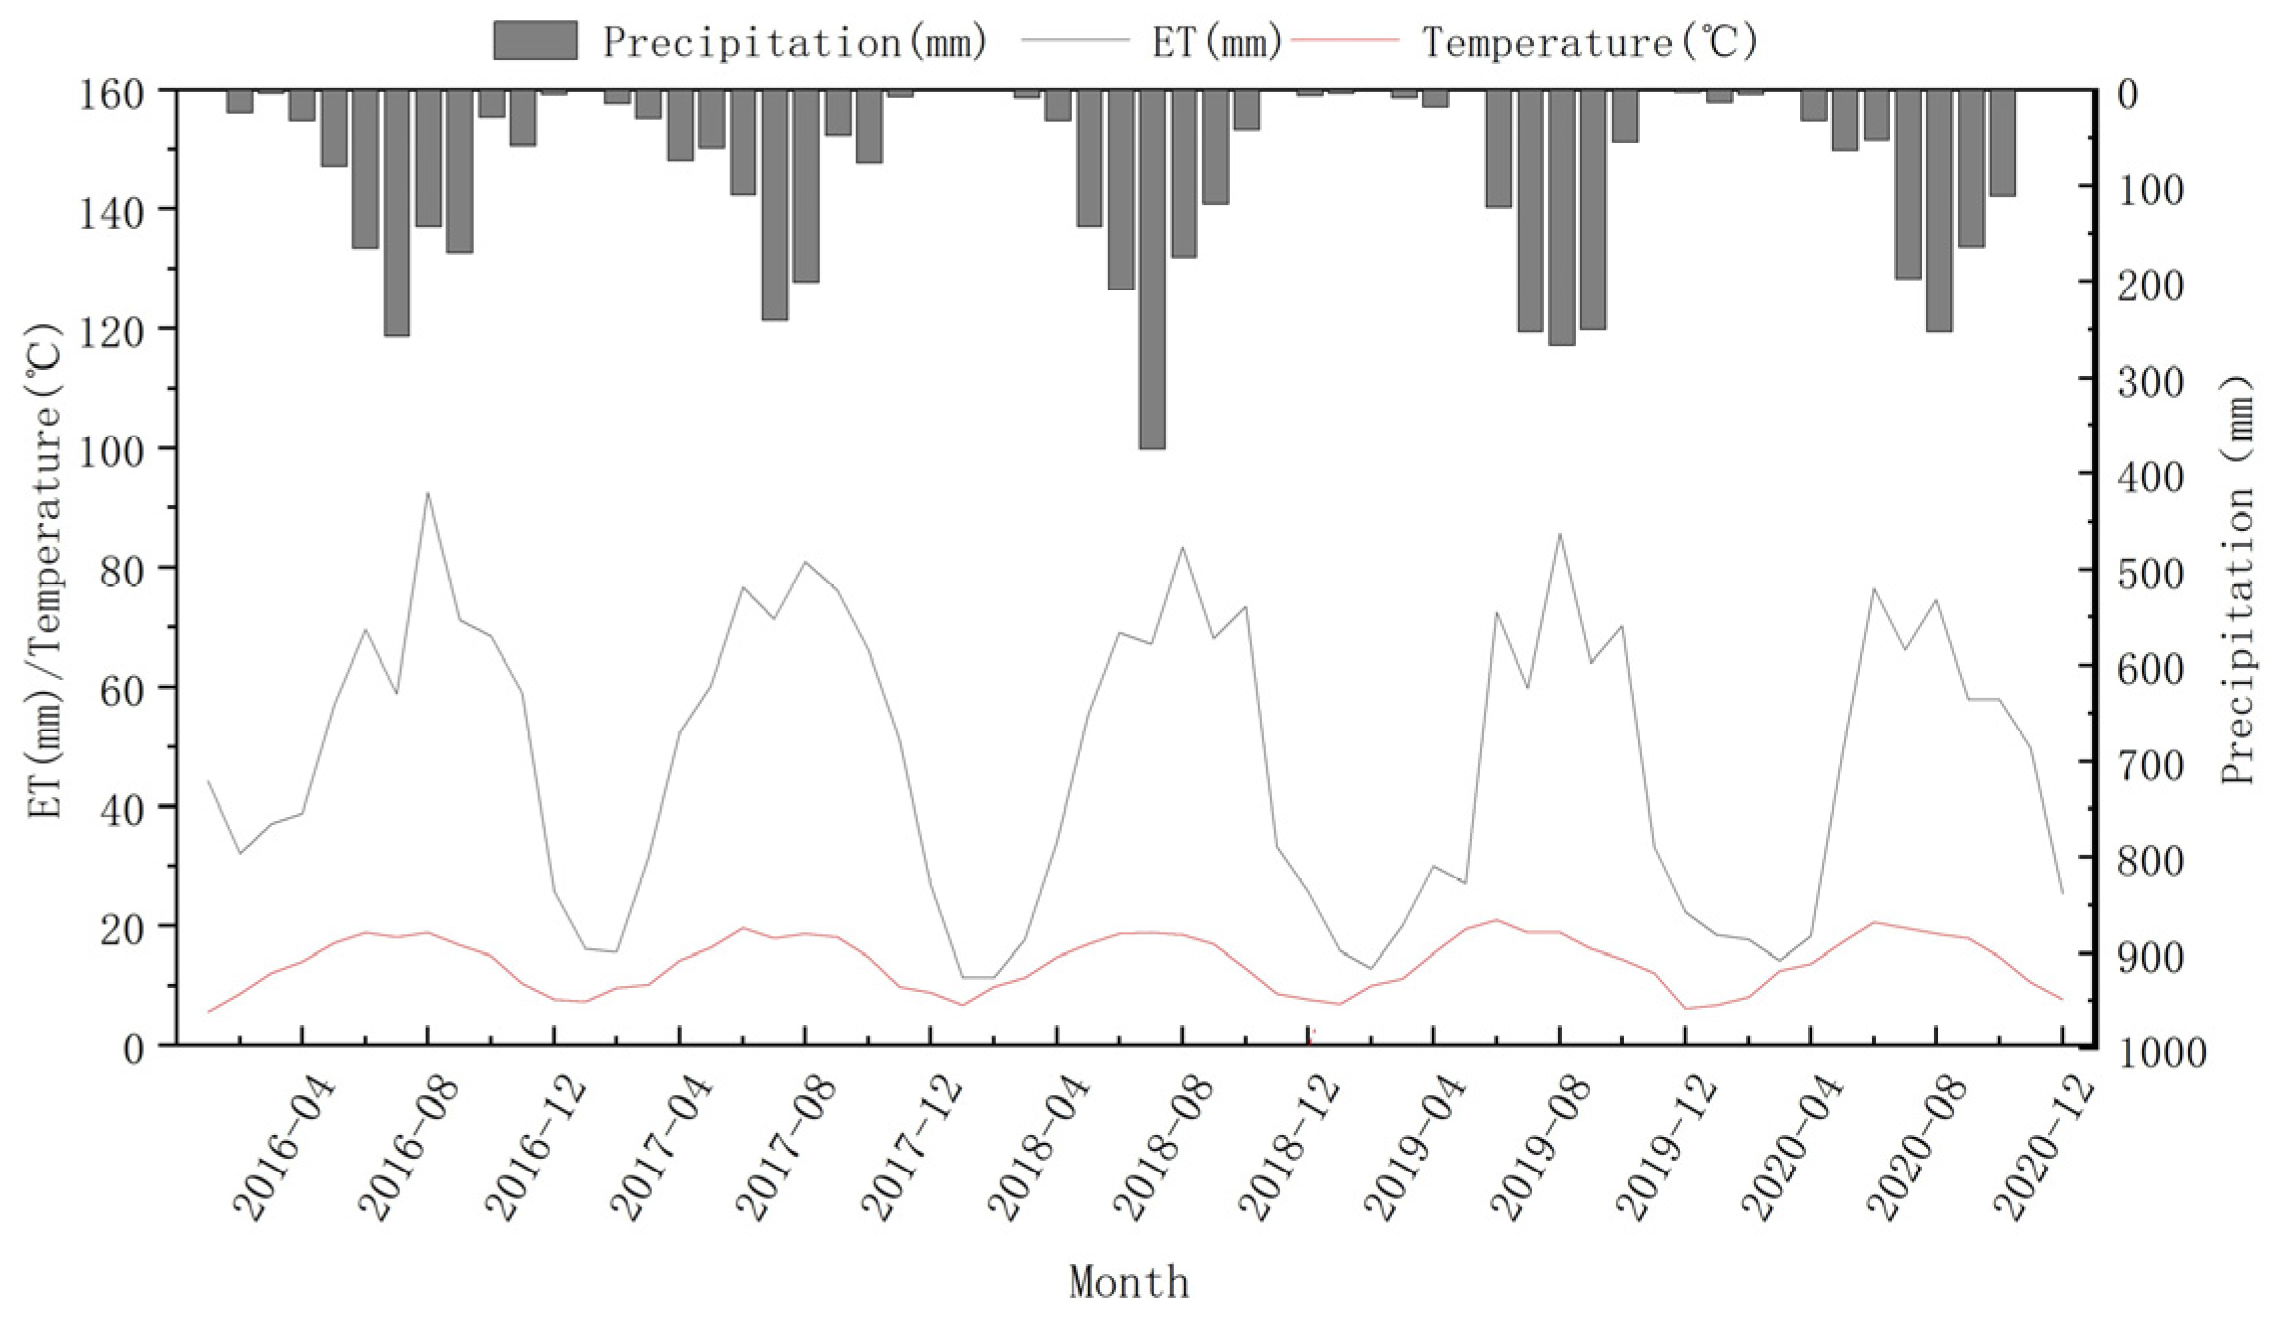
3.3. ET Simulation Results

ET is an indispensable component of the regional water cycle. Given the scarcity of ground-based ET observations in this remote mountainous terrain of Southwest China, particularly the absence of measurements from instruments like Large Aperture Scintillometers or Eddy Covariance systems within the basin itself, the ET simulated by the SWAT model was compared with estimates from reanalysis datasets (ERA5, MERRA-2, and GLDAS) despite of their coarse resolution. The results demonstrate strong agreement in the original temporal patterns between SWAT and all three reanalysis products (Figure 3a–c), with high correlation coefficients (R): 0.93 for ERA5, 0.90 for MERRA-2, and 0.88 for GLDAS. After deseasonalization, the correlations decreased but remained significant, particularly for ERA5 (R = 0.66), compared to MERRA-2 (R = 0.51) and GLDAS (R = 0.49) as shown in Figure 3d–f. Given that the area of the study basin accounts for only 3.75% of the ERA5 grid cell area, the moderate but significant correlation (R = 0.66) maintained between SWAT and ERA5 after deseasonalization further supports the reliability of the SWAT ET simulations. Although ET values from ERA5, GLDAS, and MERRA-2 are generally higher than those simulated by the SWAT model, all datasets exhibit similar temporal variation with the SWAT output, as clearly shown in Figure 3g.
ET in the basin exhibits a distinct seasonal fluctuation (Figure 4). During the summer months (June to August), ET typically ranges from 70 to 100 mm/month, whereas in winter (December to February), it drops to around 20 mm/month. This variation is closely related to temperature and precipitation. In summer, higher temperatures and abundant precipitation lead to a significant increase in ET, while in winter, lower temperatures and reduced precipitation result in a decrease in ET. The correlation between ET and precipitation, as well as between ET and temperature, was calculated (Figure 5). The results show that the correlation coefficient between ET and precipitation peaked at a one-month lag, reaching 0.75. The climate of the study area is characterized by a typical pattern of simultaneous precipitation and temperature, and similarly, the correlation coefficient between ET and temperature also peaks at a one-month lag, reaching 0.87. The interaction between hydrological, meteorological, and ecological processes jointly leads to the observed lag of ET behind temperature and precipitation. On one hand, when precipitation increases, it takes time for the water to infiltrate into the soil; since ET relies on soil moisture availability, it does not immediately reach its peak. On the other hand, although higher temperatures accelerate ET, the plant transpiration process also requires time for the roots to absorb water and release it into the atmosphere, creating a lag effect. Overall, the basin’s ET shows significant seasonal fluctuations, strongly influenced by temperature and precipitation, and exhibits a high correlation with precipitation and temperature, both with a one-month lag. To further quantify their relative contributions, we constructed a standardized multiple linear regression model using one-month lagged temperature and precipitation as predictors. Results show that temperature has a stronger influence on ET variability (standardized coefficient = 0.694) than precipitation (0.253). This is further supported by partial correlation analysis, where temperature exhibits a higher independent correlation with ET (r = 0.747) than precipitation (r = 0.378).
The seasonal variation in ET in the Jizi Basin is shown in Figure 6. The boxplot illustrates significant fluctuations in ET across seasons, with spring exhibiting the highest variability (Figure 6b). This pronounced variability implies that extreme hydrological events, such as droughts, are more likely to occur during this season. The highest ET values are observed in summer, with a peak of 92.58 mm in July (Figure 6a), driven by the southwest monsoon that delivers abundant precipitation and synchronizes water availability with elevated temperatures, minimizing drought risk. In contrast, winter, particularly December and January, experiences the lowest ET values, with the minimum observed in December at 11.26 mm, as cold temperatures and insufficient precipitation suppress evaporation. This pronounced seasonal fluctuation is closely related to the region’s climate, where monsoon dynamics, thermal regimes, and hydrological cycles collectively shape the basin’s vulnerability to drought.
A severe drought occurred in the study area during the spring and early summer of 2019. To further investigate the response of ET to drought and the variations in contributing factors during the drought event, we deseasonalized the data for precipitation (P), runoff (Q), ET, soil moisture (SM), percolation (PERC), and temperature (T), focusing on the drought year 2019. As shown in Figure 7, from April to July 2019, precipitation anomalies were significantly low while temperatures were abnormally high, suggesting that this drought was likely triggered by a combination of precipitation deficit and rising temperatures. The reduction in runoff and percolation anomalies lagged by 1–2 months compared to other variables, which indicates the regulatory capacity of forests on groundwater and runoff. Notably, ET from January to July remained consistently lower than previous years. Despite rising temperatures typically enhancing potential evaporation, the prolonged precipitation deficit progressively depleted soil moisture, leaving vegetation and soil unable to provide sufficient water to sustain evaporation and transpiration. This precipitation-restricted ET partially reflects the onset and progression of this drought.
To quantitatively assess the response of ET to drought, we conducted a coupling analysis using the Standardized Precipitation Evapotranspiration Index (SPEI). According to widely adopted thresholds, SPEI values between −1 and −1.5 indicate moderate drought, between −1.5 and −2 indicate severe drought, and values below −2 indicate extreme drought. In the spring and early summer of 2019, SPEI dropped below −2 across multiple timescales (Figure 8), confirming the occurrence of an extreme and persistent drought event. Based on this, we calculated the lagged correlation coefficients between ET anomalies and the SPEI at 1-, 3-, and 6-month time scales. As shown in Figure 8, the correlation is strongest at lag 0, particularly for SPEI-1 (r = 0.68), and weakens substantially with larger lag, approaching zero at a 3-month delay. This indicates that ET is most sensitive to short-term drought fluctuations, with limited delayed responses.

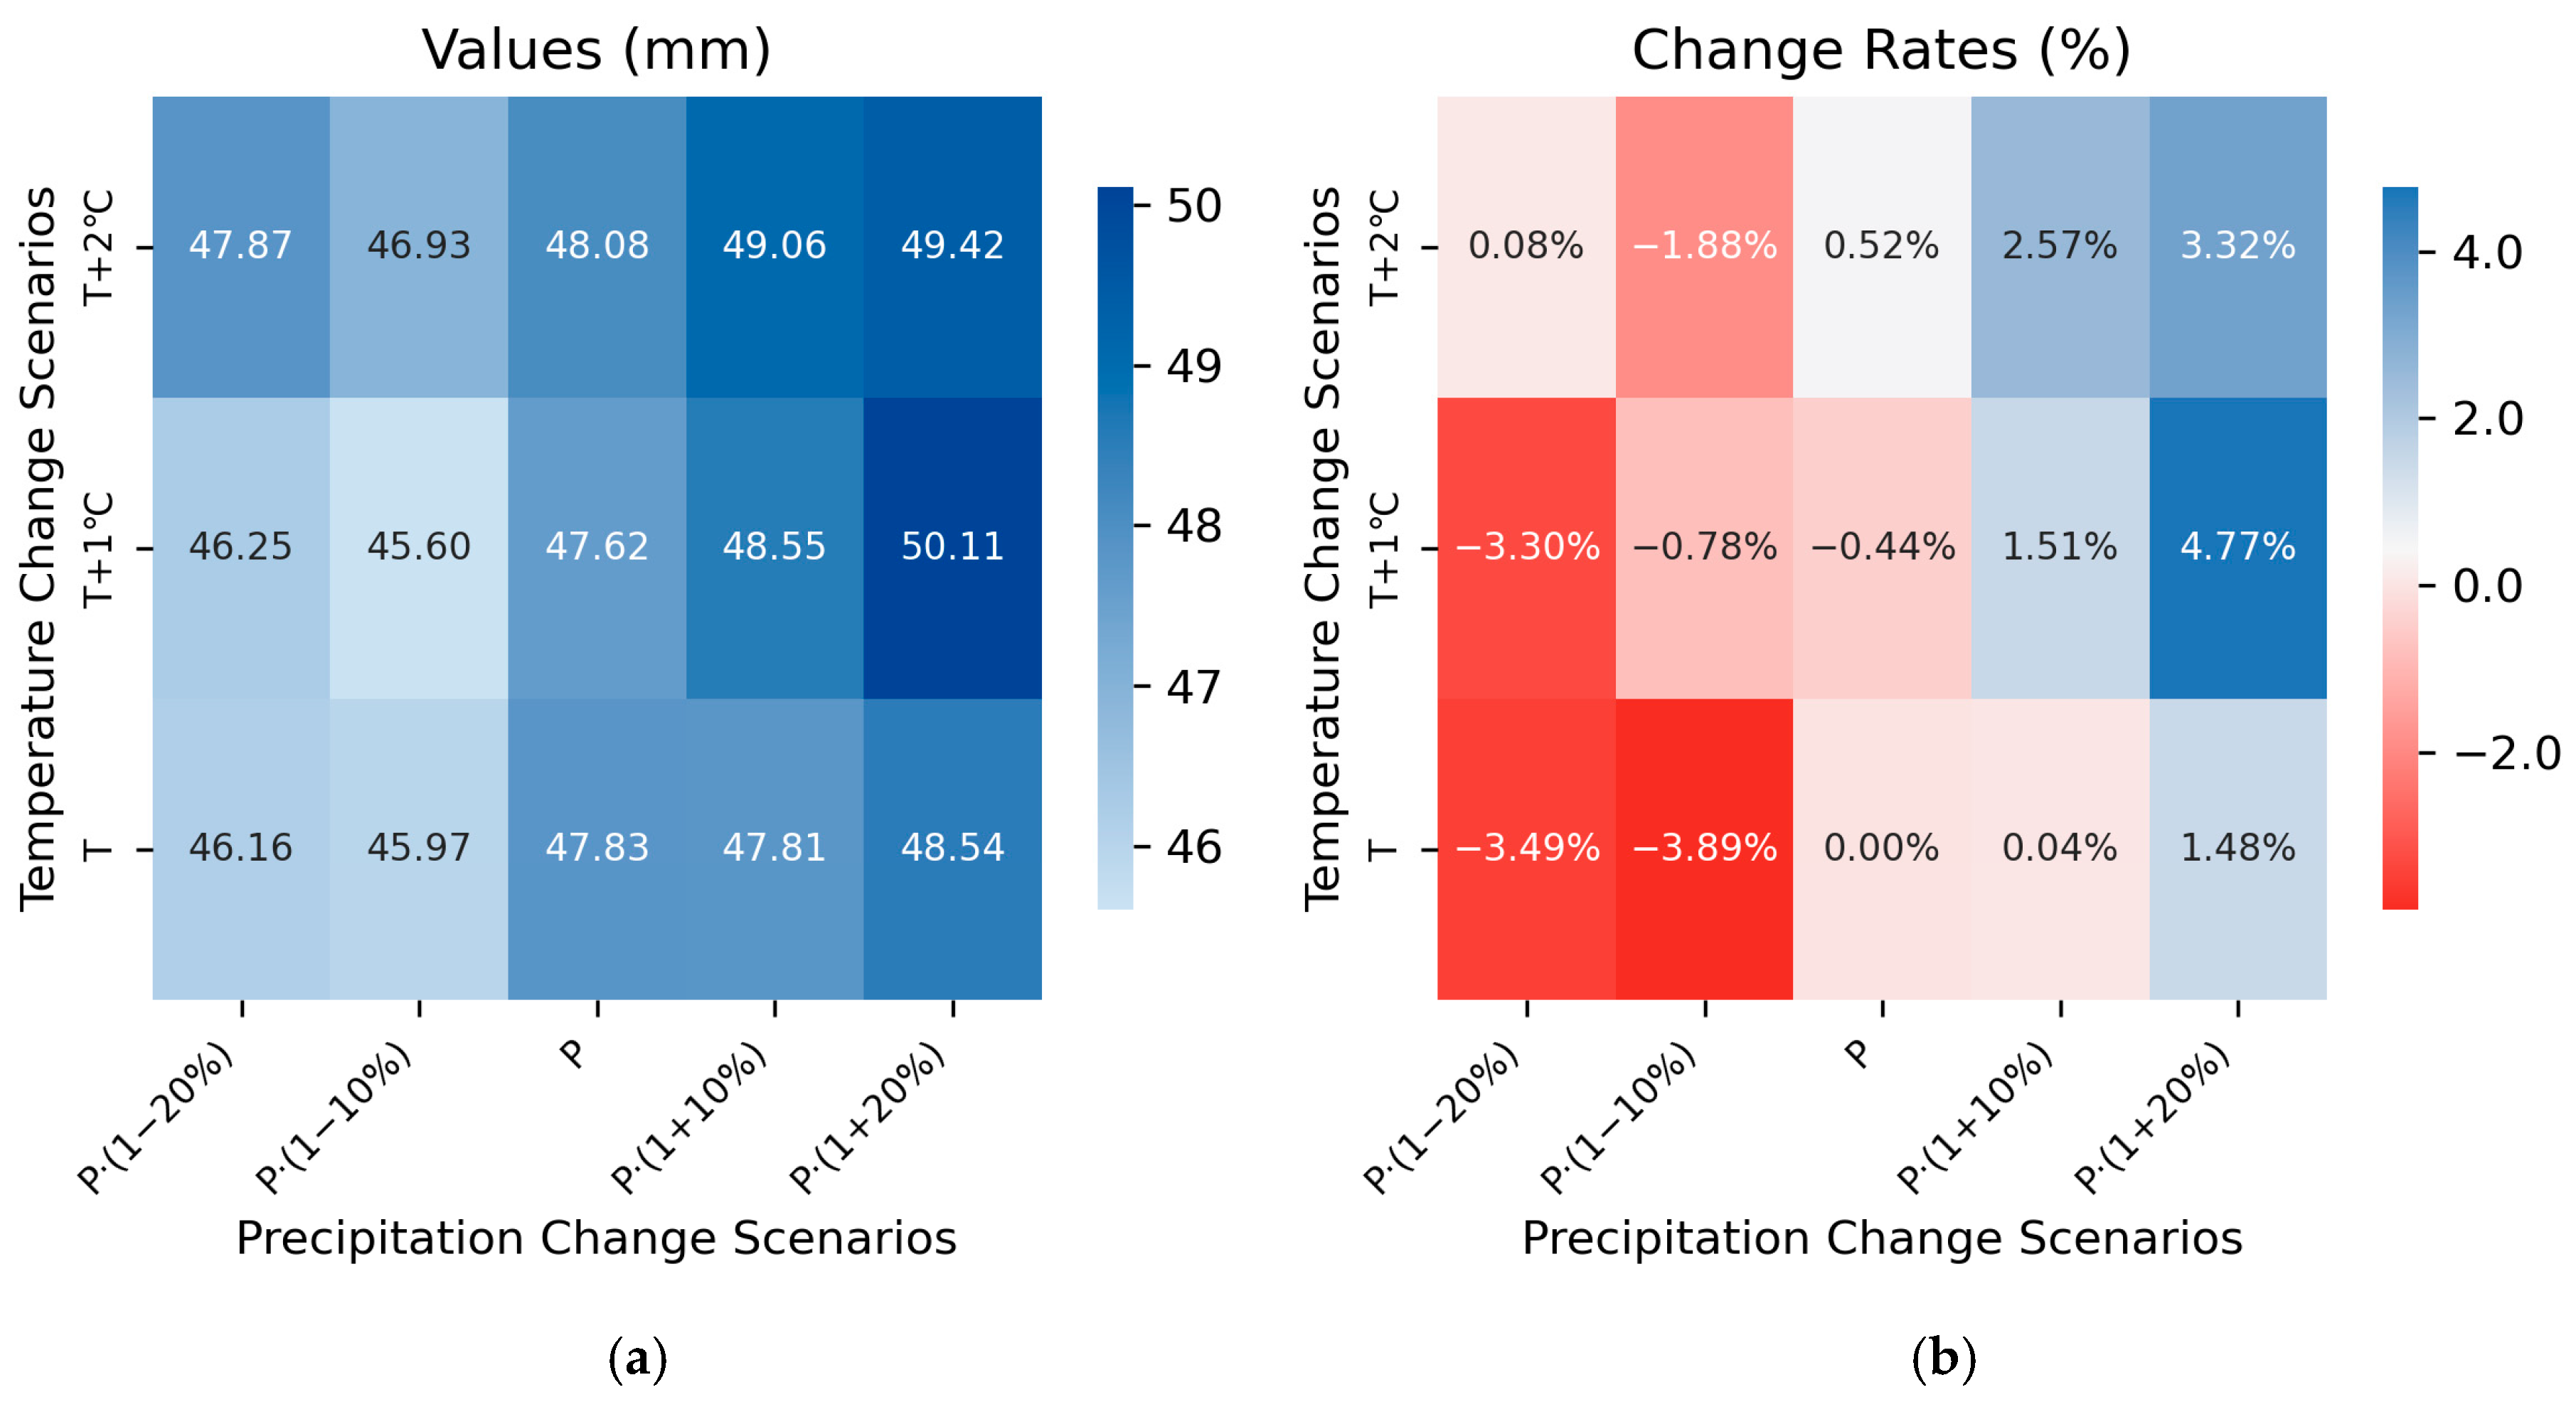
3.4. The Impact of Climate Change on ET

Climate change leads to long-term changes in temperature and precipitation, which in turn affect ET. ET generally increases with the increase in precipitation and temperature, as shown in Table 3 and Figure 9. However, a 10% precipitation reduction resulted in less ET than a 20% precipitation reduction under T and T + 2 °C.
To further clarify the differences in the impacts of temperature and precipitation changes on ET, we conducted change rate and standard deviation statistics on the results in Table 4. The T + 1 °C scenario exhibited the largest range (3.86 mm) and standard deviation (1.42 mm) of ET with changes in precipitation, indicating that ET is most sensitive to precipitation changes when the temperature increases by 1 °C. This pattern can be explained by the fact that a 1 °C temperature increase has not yet surpassed the critical threshold at which thermal forcing becomes the dominant driver of ET. Consequently, the system remains in a precipitation-limited regime under which water availability directly controls ET magnitude, resulting in amplified hydrological responsiveness and higher variability when precipitation fluctuates. Although it may seem intuitive that higher temperature increases (T + 2 °C) would lead to greater ET sensitivity, our results indicate a potential nonlinear response. At a +1 °C warming level, the system appears predominantly controlled by water availability. At higher temperatures, the system may transition toward an energy-limited regime, where ET tends to become less sensitive to changes in precipitation. This aligns with Ryter et al.’s observations in California: when temperature increases reach a critical threshold (+2–4 °C), warming-induced ET enhancement dominates the hydrological response, substantially offsetting precipitation gains [38]. Under a 20% reduction in precipitation (P·(1–20%)), ET showed the largest range (1.71 mm) and standard deviation (0.79 mm) with temperature changes, suggesting that ET is more responsive to temperature changes when precipitation decreases by 20%. A 20% reduction in precipitation may represent scenarios of drought or water scarcity, where the temperature’s influence on ET becomes more pronounced, impacting water resources and ecosystems more significantly. The T + 1 °C and P·(1–20%) scenarios, with larger ranges and variation in ET, exhibit the greatest uncertainty and potential impact on water resources.

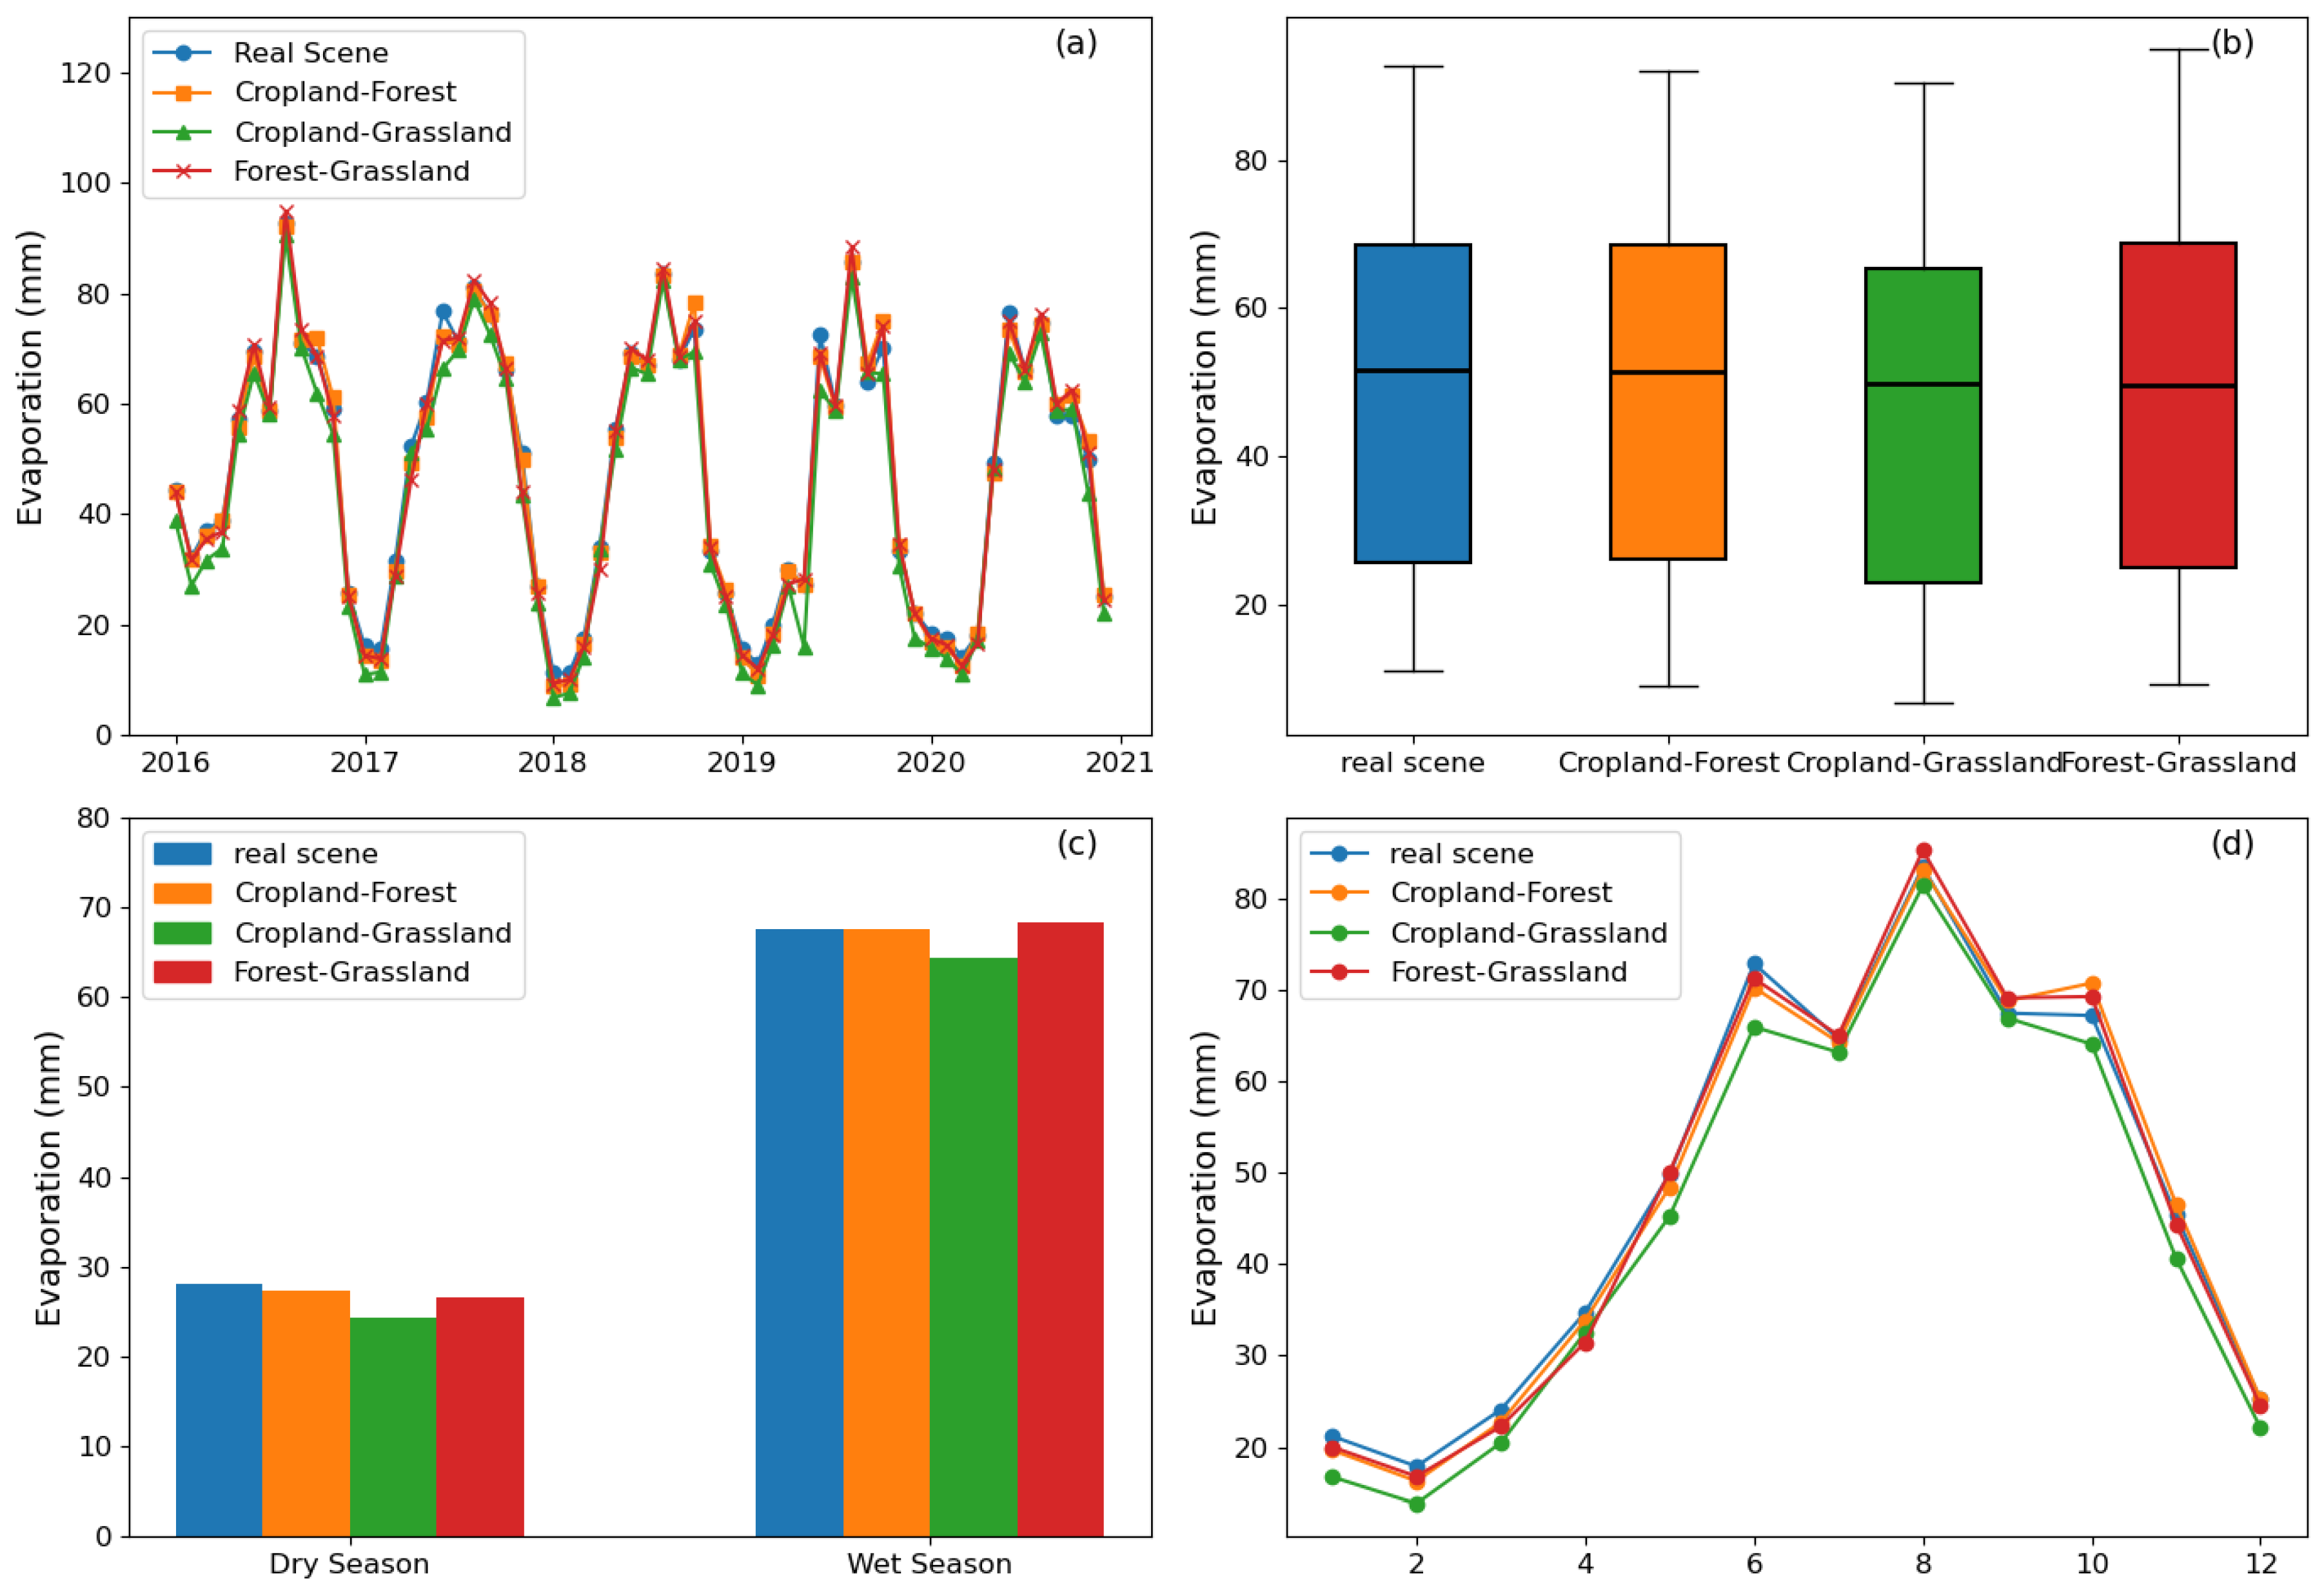
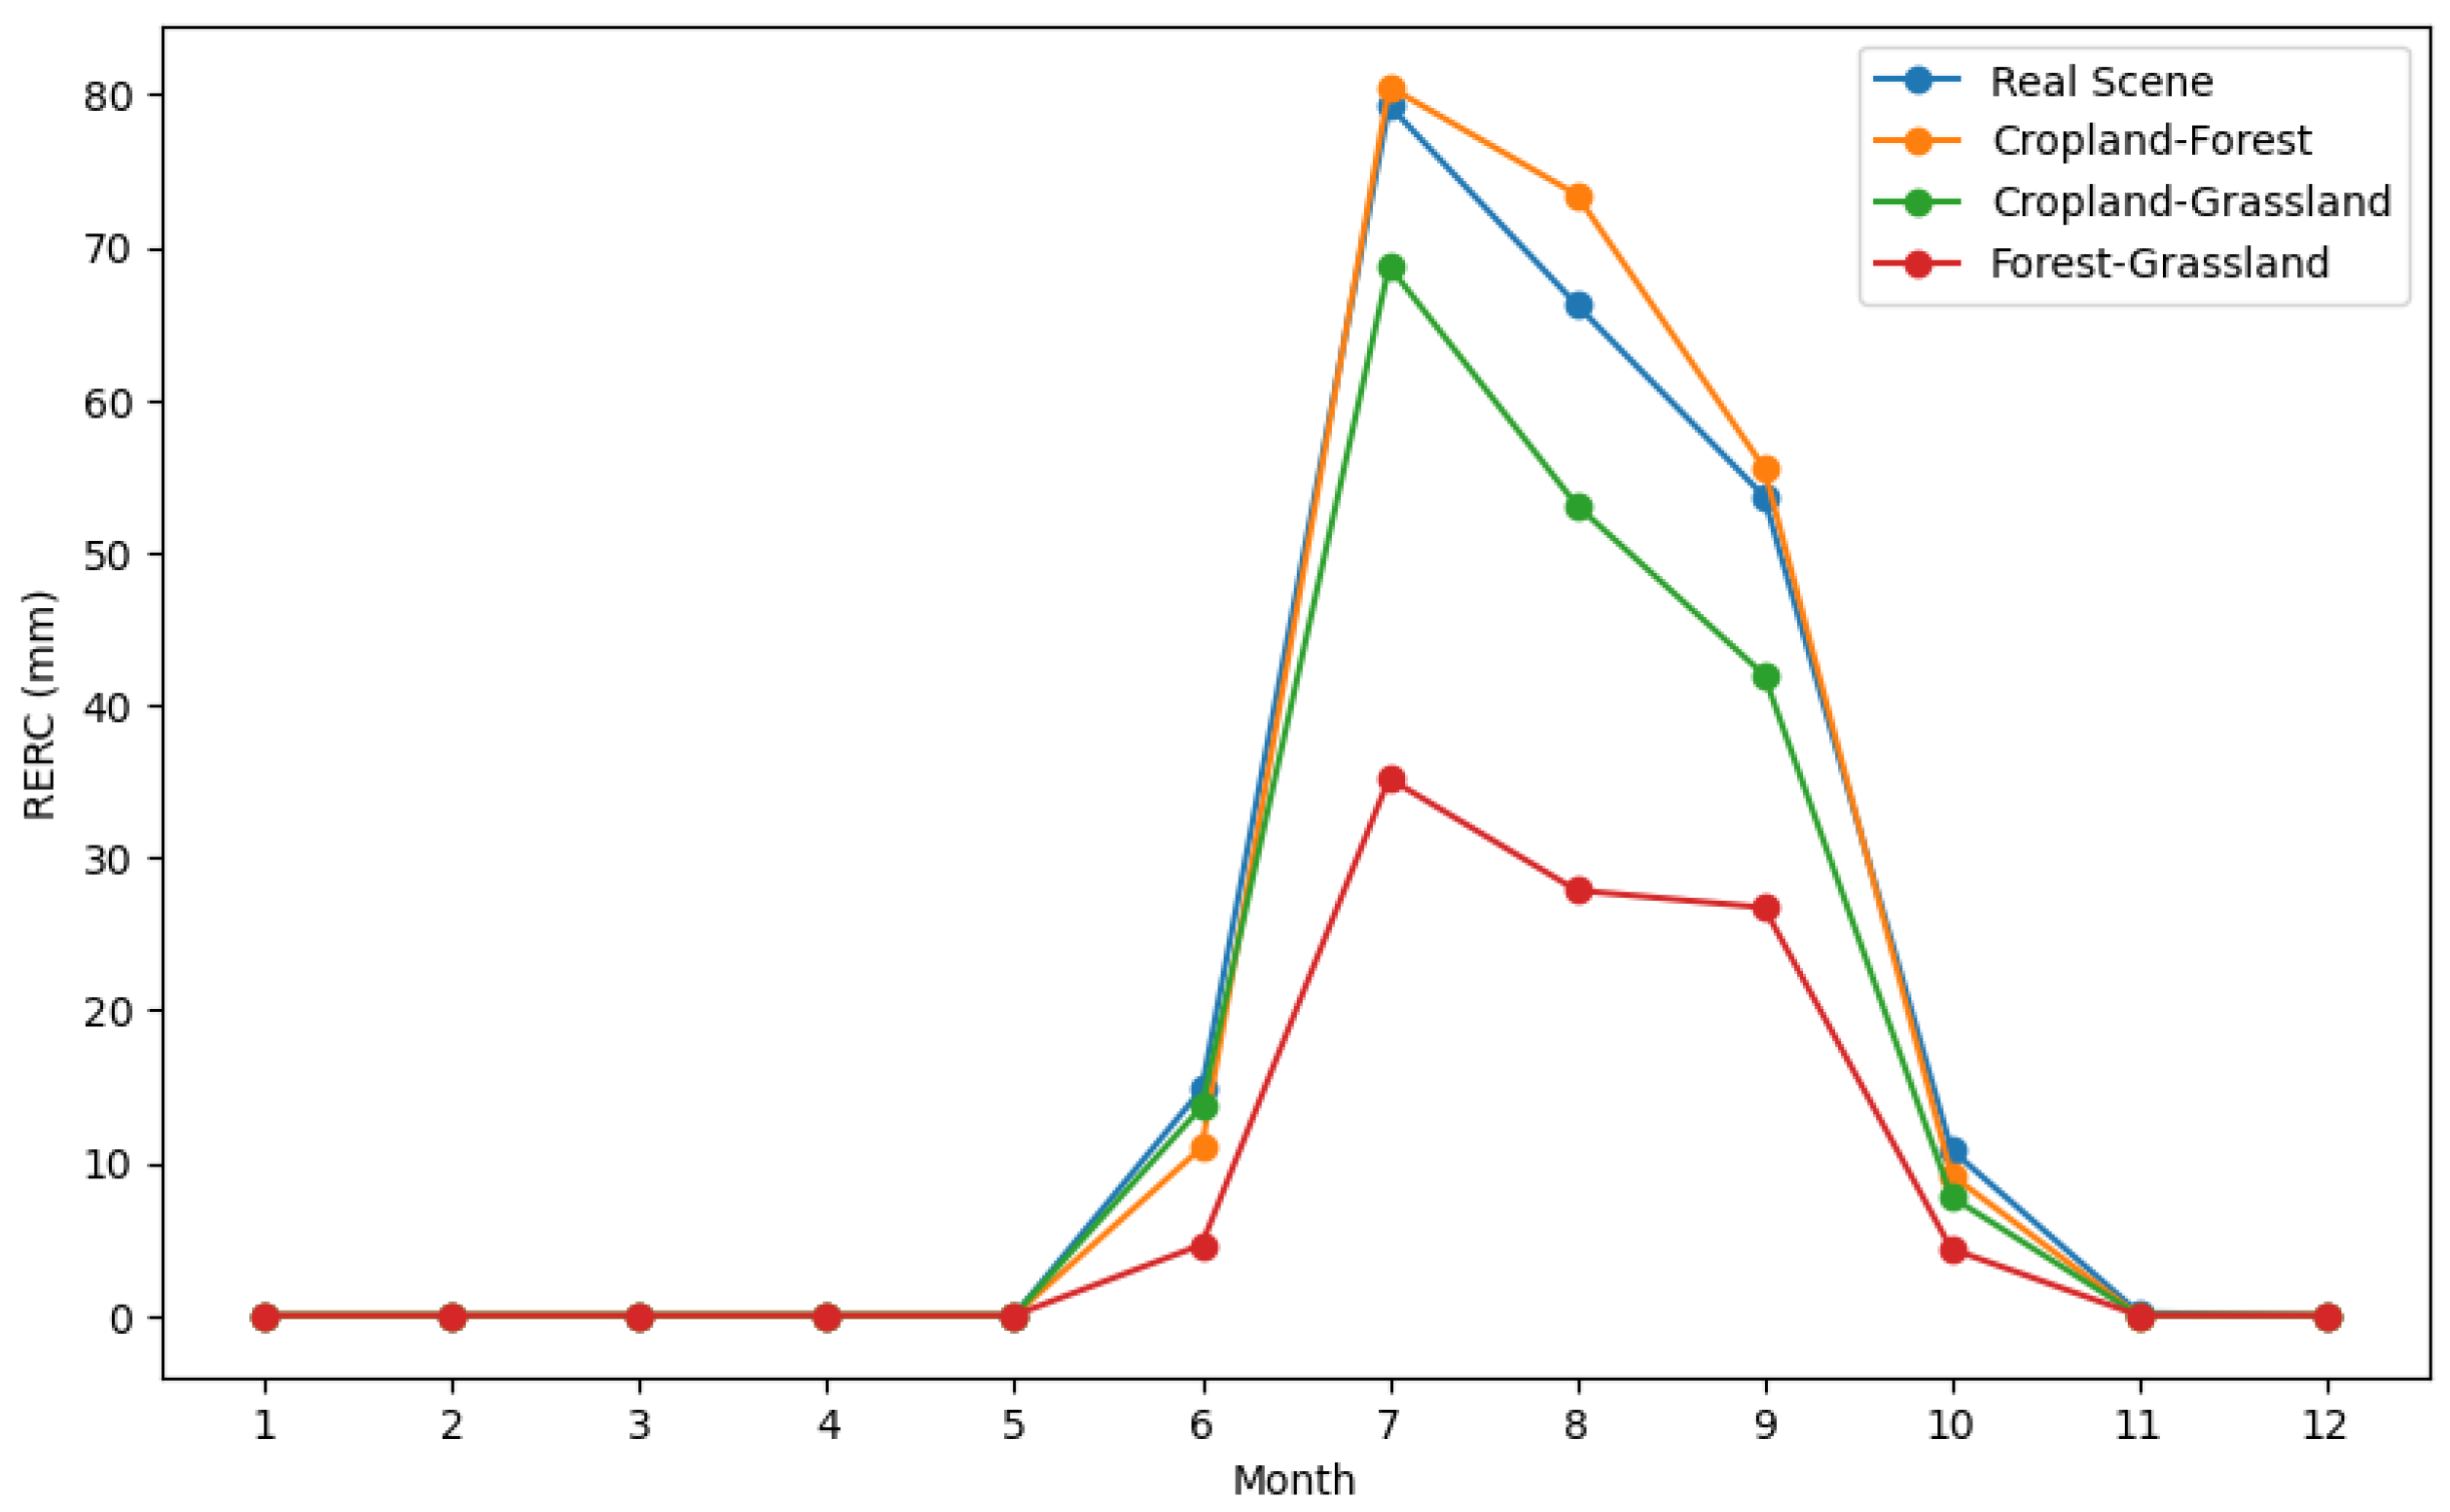
3.5. The Impact of Land Use Change on ET

The land use maps for different scenarios are shown in Figure 10. ET responses to different land use/cover changes are shown in Table 5. The ET value under the baseline scenario is 47.83 mm. In the cropland–forest and forest–grassland scenarios, ET reduced by 0.67% and 0.78%, respectively. The cropland–grassland scenario exhibits a slightly larger ET reduction of 7.10%. Overall, the impact of different land use/cover changes on ET is weak. Figure 11 further demonstrates the monthly and seasonal changes in ET under different land use scenarios are insignificant, which align with the multi-year average ET analysis results. The study basin is well-vegetated, therefore the changes between cropland, grassland, and forest devote little changes in ET.
Although land use changes have a limit impact on ET, they still play an important role in regulating regional water cycle processes (Figure 12). Specifically, our results show that land cover transitions mainly affect subsurface processes, such as percolation (PERC), which refers to the amount of water that infiltrates the root zone during a time step, and after a period of time, this variable represents groundwater recharge. In the cropland–forest scenario, PERC is higher compared to others, especially between July and September. Under the forest–grassland condition, PERC is relatively small. This suggests that forest cover enhances percolation and promotes groundwater recharge due to its deeper root systems and improved soil structure. Therefore, land use changes primarily influence groundwater dynamics rather than surface soil moisture, which explains their weaker effect on ET, especially in a water-limited environment where ET is more directly controlled by near-surface water availability.

4. Discussion

4.1. ET Variations Under Different Scenarios

Wang et al. [39] found that the interannual average ET in the Hengduan Mountains of southwestern China is relatively low, with most areas falling between 400 and 800 mm. The study area in this research, located in a small basin in the Hengduan Mountains, has a multi-year average ET of 573.96 mm, which is consistent with previous studies [40,41], suggesting that the ET simulated by the SWAT model is reasonable. Additionally, the SWAT-simulated ET shows reasonable agreement with ERA5 (R = 0.66), further confirming its accuracy in representing actual ET patterns. These consistencies—both with previous research and ERA5 data—strengthen confidence in the model’s results. Ma et al. [42] found that precipitation is the dominant factor driving the increase in ET in the Qinghai–Tibet Plateau, contributing 57%, followed by temperature with a contribution of 20%. Zhao et al. [2] indicated that the significant increase in temperature from 1982 to 2016 in the Yellow River Basin led to a rise in ET, with vegetation greening playing a secondary role. These studies highlight the critical role of temperature and precipitation in driving ET, consistent with our results. Our further analysis of combined temperature–precipitation scenarios shows that a 1 °C temperature rise (T + 1 °C) makes ET most sensitive to precipitation changes. In contrast, when precipitation drops by 20%, ET becomes more influenced by temperature changes. Importantly, the T + 1 °C and 20% precipitation reduction scenarios carry the highest uncertainties and risks for water availability, making them critical to address in this climate scenarios as hydrological extremes intensify.
The changes in ET caused by land use/cover change (LUCC) in the Jizi Basin are relatively less pronounced compared to climate change. In contrast, studies in other regions have shown relatively significant changes in ET due to land use changes [43,44,45]. For example, Sun et al. [46] found that the conversion between natural vegetation and cropland in the Hai River Basin caused significant ET changes. In this study, the basin is predominantly forested, accounting for a large proportion (71.21%). The ET from forest and other natural vegetation, such as grassland, is typically similar, which may reduce the impact of land use changes on ET. Secondly, the wetland characteristics of the Lashi Lake Nature Reserve, of a richer water supply, especially in the water body areas of the basin, make land use changes less likely to significantly alter the overall ET. Additionally, the Jizi Basin is located in a plateau mountainous climate with a high altitude and low temperatures, which leads to relatively slow ET rates. Climate conditions may still be the primary limiting factor for ET.

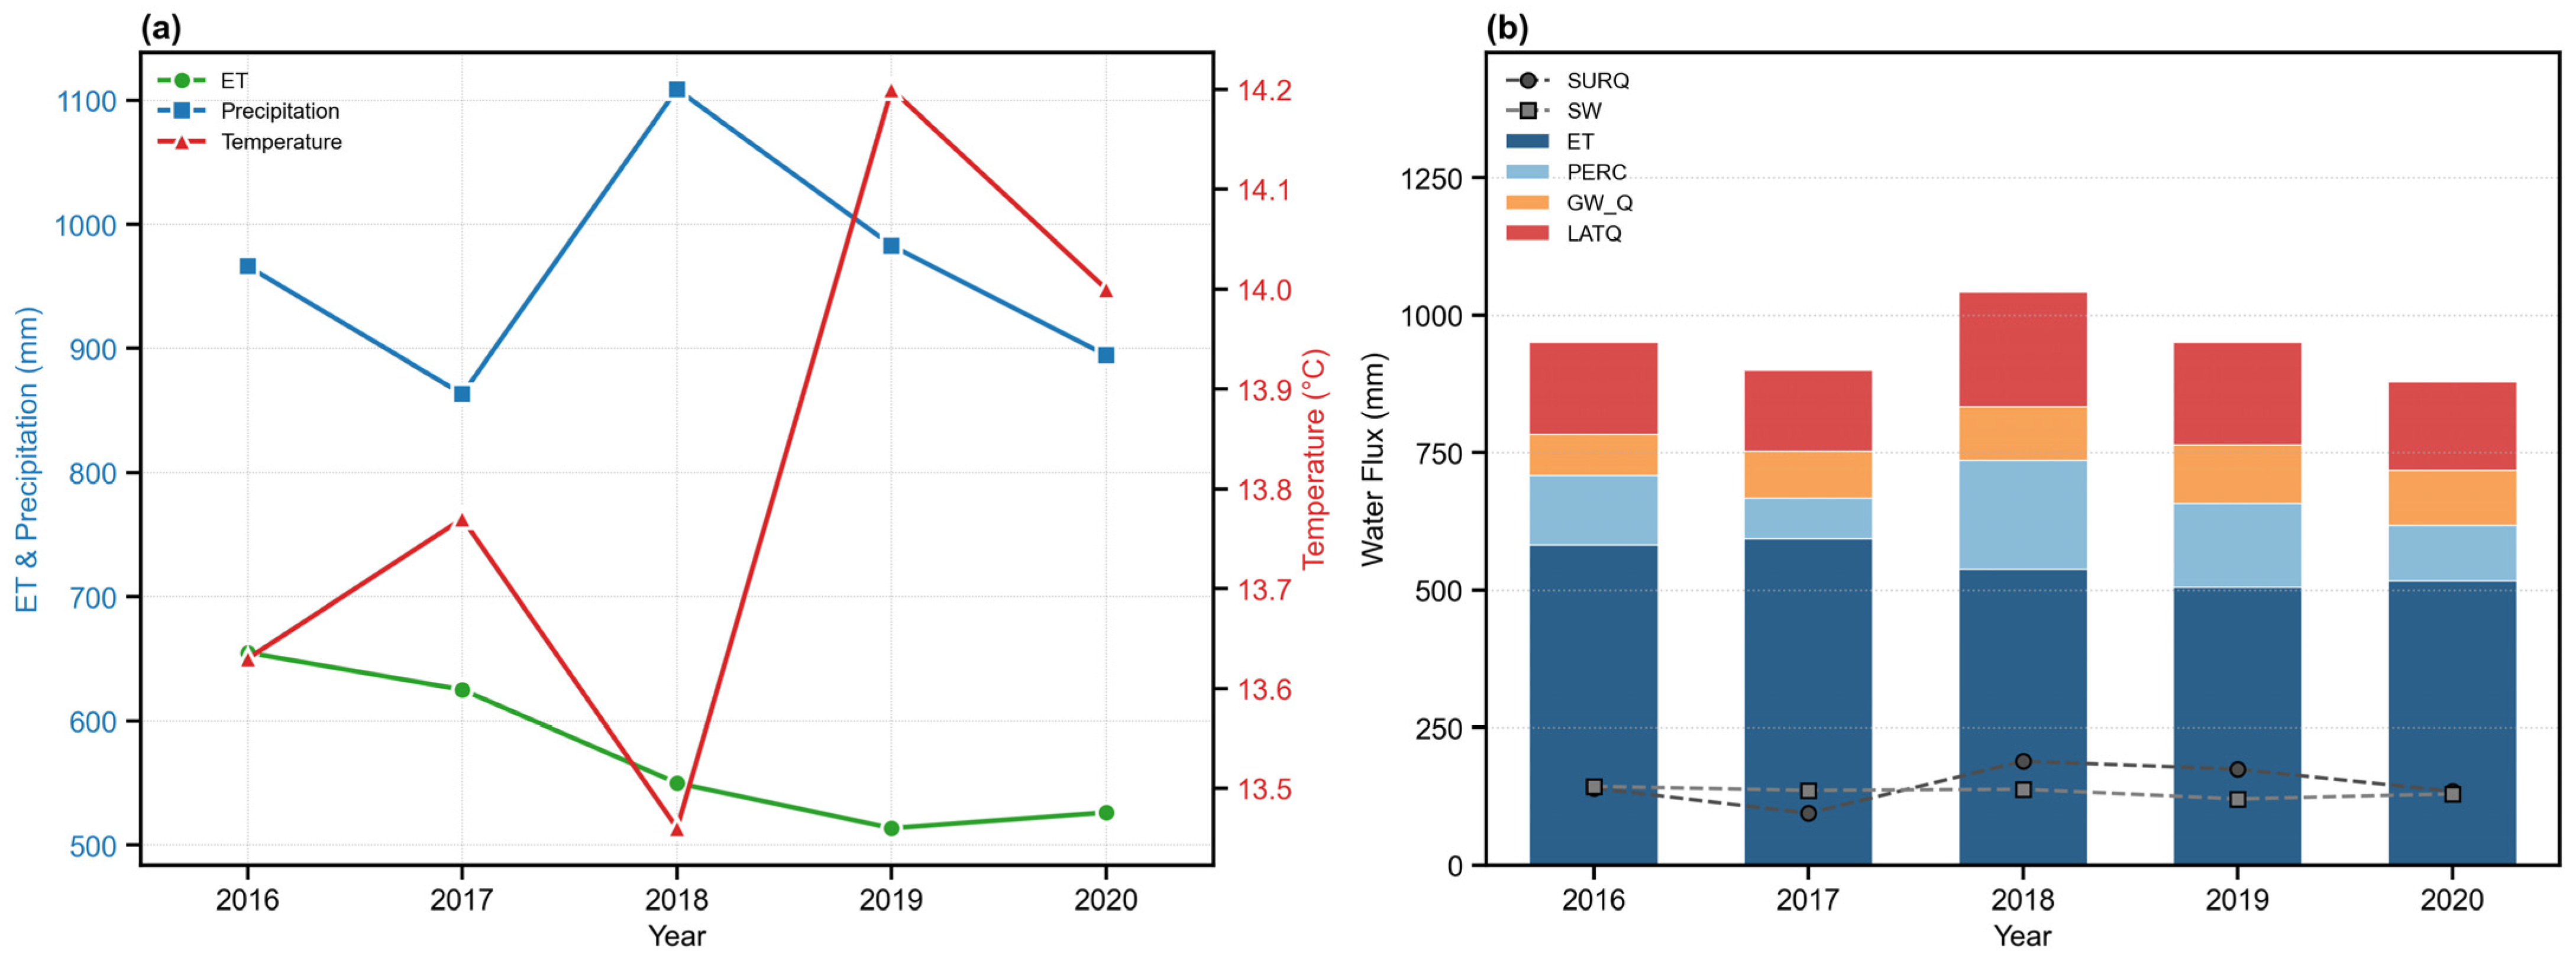
4.2. Changes in ET from the Perspective of Water Balance

Although temperature and precipitation typically influence ET, interannual variations presented in Table 6 and Figure 13a reveal a nonlinear and complex response to climatic drivers. Notably, the trends in 2018 and 2019 diverged markedly from the conventional expectation that warming and increased precipitation would enhance ET. In 2018, annual precipitation peaked at 1108.8 mm, the highest in the observation period. Contrary to expectation, ET decreased to 549.93 mm, substantially lower than the 625.12 mm recorded in 2017. This indicates that increased precipitation did not translate into enhanced soil water availability for evapotranspiration. The water balance components in Figure 13b reveal that the percolation volume (PERC) increased substantially in 2018, suggesting that excess rainfall primarily recharged the groundwater system through rapid percolation, rather than soil moisture. As a result, the effective soil water available for ET was insufficient. Similarly, in 2019, the precipitation was close to the multi-year average at 983.00 mm (0.02% higher than the annual average). The temperature reached a record high of 14.2 °C during the study period, while ET further decreased to 513.59 mm, marking the lowest observed value. PERC and SURQ decreased compared to the previous year, while GW_Q, SW, and LATQ remained relatively stable. This indicates that high temperatures generally enhance ET; however, under insufficient water supply, ET may decrease instead, reflecting a typical response under water-limited conditions. Furthermore, changes in groundwater recharge can significantly influence ET dynamics.
Collectively, these findings indicate that ET in the study region is predominantly water-limited. Groundwater recharge processes, rather than surface soil moisture dynamics, played a dominant role in shaping ET variability. This explains why land use changes tend to have a weaker direct impact on ET in such a water-limited context. Its interannual variability is not solely controlled by atmospheric demand but is strongly modulated by subsurface hydrological processes. Therefore, reliance on climatic variables alone may lead to substantial uncertainties in ET projections. Future studies should explicitly incorporate groundwater feedbacks to better constrain ET estimates under changing climatic conditions.

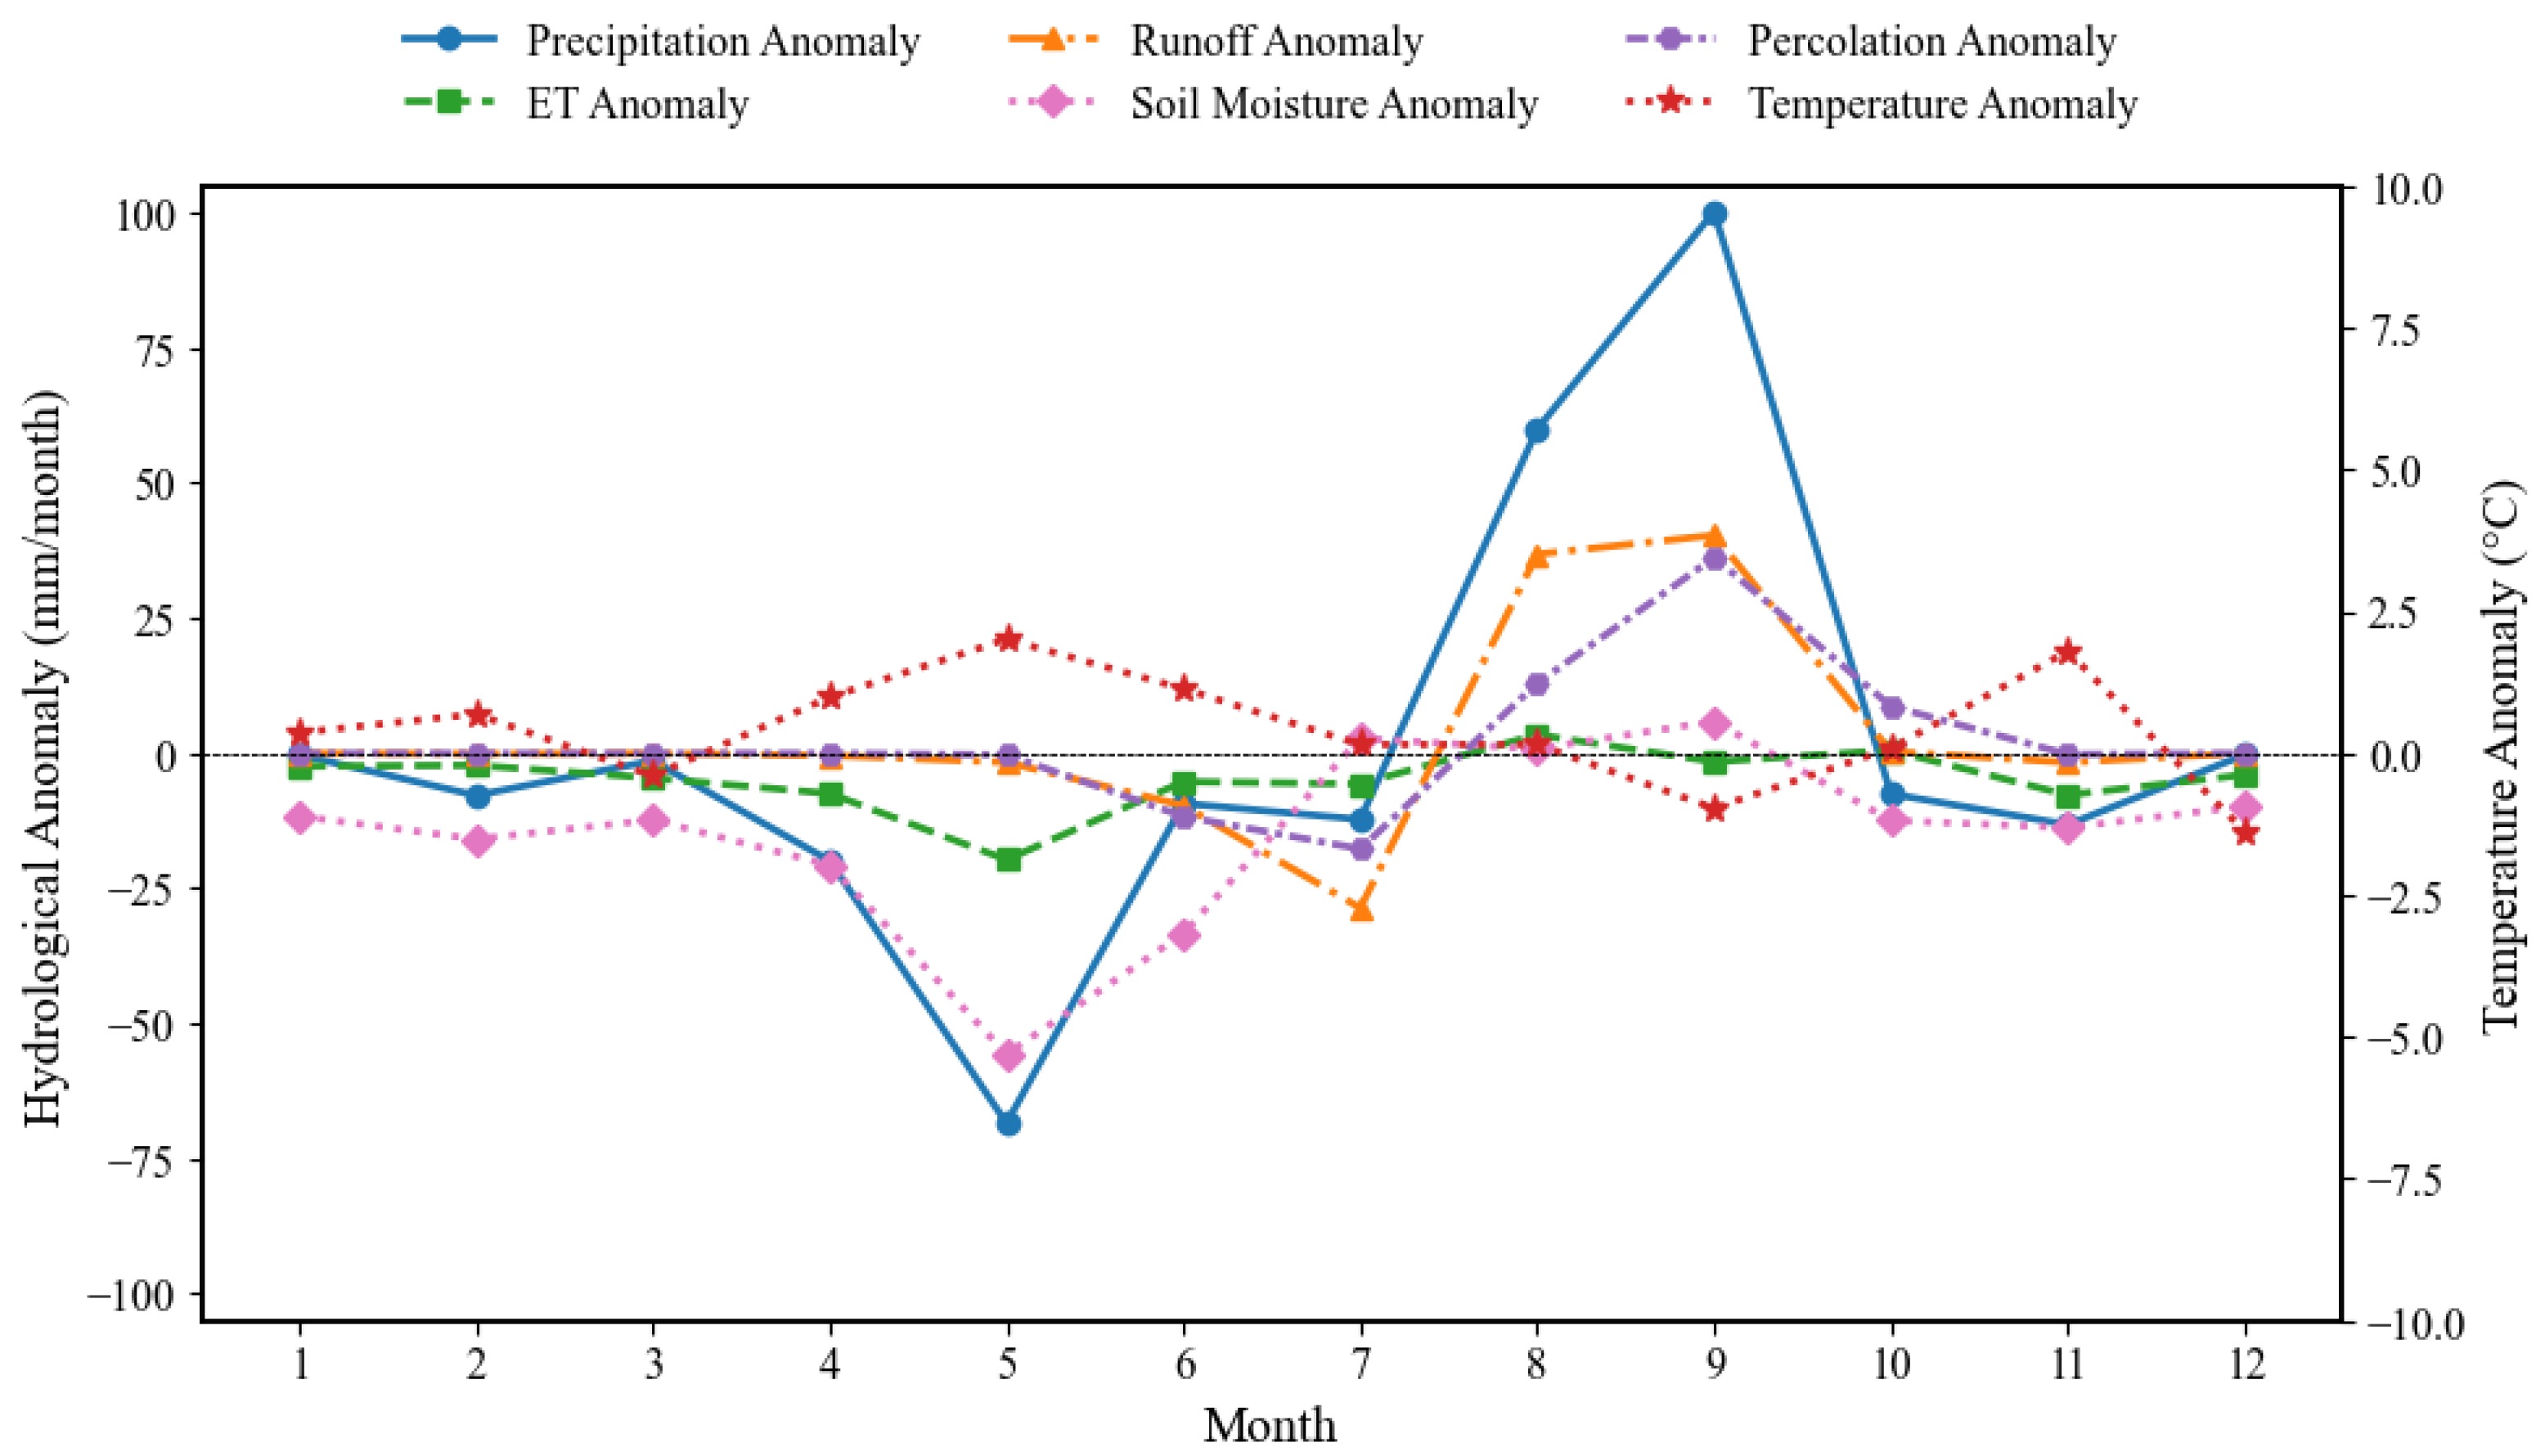
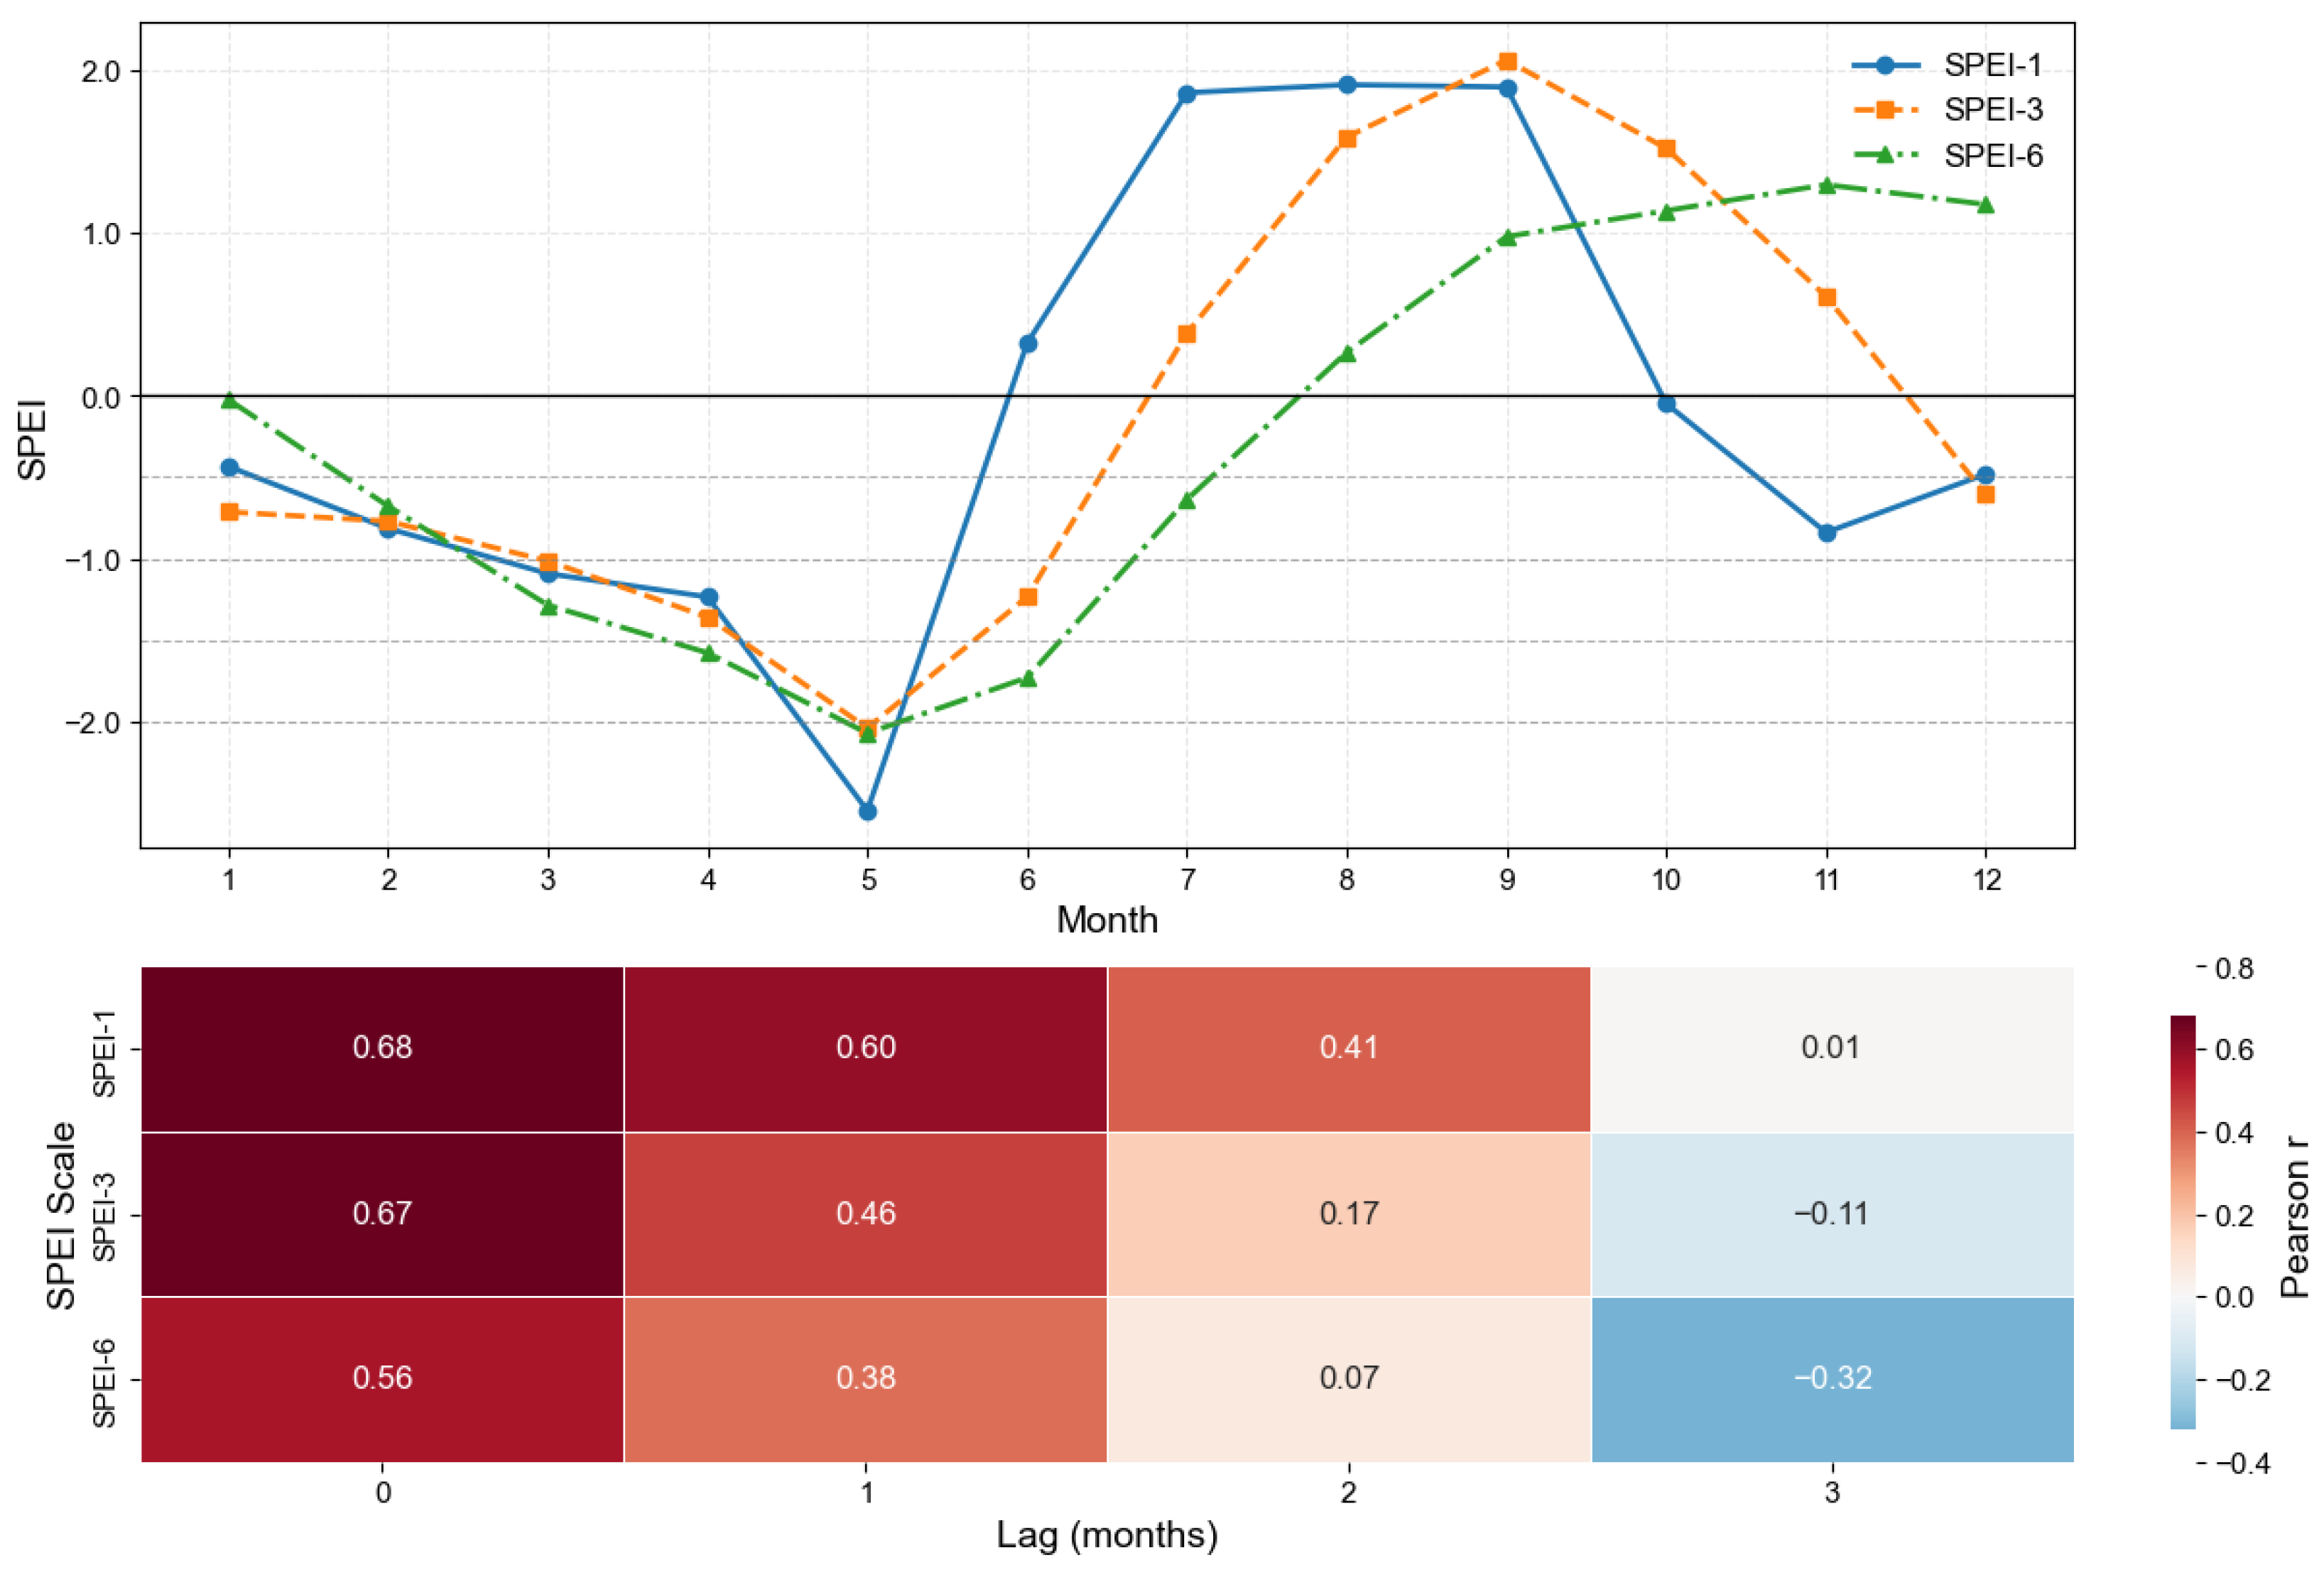
4.3. Drought and ET in Southwestern China

Existing studies suggest that drought in southwestern China is influenced by multiple factors, including precipitation, temperature, and ET [47,48]. The study area in southwestern China is affected by both the southwestern and southeastern monsoons during the summer prevailing wind period, and its precipitation and hydrological processes show distinct wet and dry seasons throughout the year [30]. Compared to regions at similar latitudes, southwestern China experiences a relatively late rainy season, which has led to an increase in the frequency of spring droughts and even continuous drought events from winter to spring and from spring to summer over the past two decades [49,50,51]. Our seasonal ET analysis indicates higher drought likelihood in spring, consistent with previous studies. This suggests that the hydrological model used in this study can partially reflect the occurrence of drought events.
The forested area of the Jizi Basin accounts for 71.21% of the total land area, emphasizing the critical role of forests in the region’s water cycle. Prolonged droughts, particularly during the spring, could significantly reduce the groundwater recharge in the basin, thereby weakening forest resilience. This could result in increased vulnerability to forest degradation and wildfires. As forest ecosystems are crucial for water retention and biodiversity, these changes pose a significant risk to both the environment and local communities dependent on water resources from the Jizi. Therefore, it is essential to adopt adaptive forest management strategies that focus on enhancing drought resilience. Increasing forest species diversity, selecting drought-resistant species, and improving monitoring systems for soil moisture and groundwater are crucial steps to mitigate the adverse effects of future droughts. Additionally, integrating hydrological processes, including groundwater dynamics and soil moisture, into forest management will provide a more comprehensive understanding of the potential risks and improve long-term water resource management in the region.

4.4. Study Limitations

While the SWAT model successfully simulated ET dynamics in the Jizi Basin and revealed insights into climate and land use impacts, several limitations should be acknowledged to better understand the results. First, the spatial resolution of the input datasets (e.g., meteorological and soil data) may not fully capture local-scale variability. For instance, although the Lijiang station data showed high consistency with reanalysis (ERA5) and satellite (TRMM) products, we recognize that relying on a single station may not fully reflect spatial heterogeneity. In future work, we plan to explore elevation-weighted interpolation to better capture within-basin climate variability. Second, land use change in mountainous areas is typically gradual and spatially heterogeneous. Although policies such as the Conversion of Cropland to Forest Program promote the restoration of steep-slope cropland (>25°), such land comprises only 1.57% of the study area. Overall cropland occupies 15.06% of the basin, limiting the potential extent of land use change. Even converting 20–40% of cropland would affect only a small portion of the basin, suggesting a limited hydrological impact. Therefore, the extreme scenarios used here are not intended to reflect realistic land transitions, but rather serve as sensitivity analyses to explore possible ET responses. Third, the study period (2016–2020) is relatively short due to the lack of long-term hydrometeorological data in southwestern China, limiting the assessment of long-term trends and interdecadal climate variability. Additionally, in the absence of direct ET observations in the basin, coarse-resolution reanalysis datasets (e.g., ERA5) were used for supplementary validation, which may still introduce uncertainty due to scale mismatch. Furthermore, the SWAT’s simplified groundwater module cannot fully represent the influence of groundwater depth on root water uptake or differentiate between the groundwater dependence of soil evaporation and plant transpiration. Due to limited subsurface data, the SWAT-MODFLOW model was not applied in this study. Future work will focus on collecting hydrogeological data to enable coupled modeling and better assess this mechanism under varying hydrological conditions.

5. Conclusions

This study simulated and analyzed ET in a small, forest-dominated basin in southwestern China using the SWAT model. The model calibration and validation results demonstrated a high degree of consistency with observed discharge data and ERA5, confirming its reliability. Analysis revealed a one-month lag in response to precipitation and temperature changes, highlighting delayed hydrological response to climatic drivers. On average, the basin experiences an annual ET of approximately 574 mm, with pronounced seasonal variations—monthly ET ranges from 70 to 100 mm in summer to around 20 mm in winter. The analysis of monthly anomalies effectively reproduces the drought event that occurred in spring and early summer of 2019.
Scenario simulations indicate high ET uncertainty under combined +1 °C temperature and −20% precipitation, highlighting the potential risks to water availability under extreme climate change scenarios. Additionally, while shifts in land use/cover had a relatively minor impact on overall ET, they played a vital role in regulating subsurface hydrological processes by enhancing percolation and promoting groundwater recharge, especially for forest cover type. The findings indicate that although climate change exerts a primary influence on ET, groundwater and soil moisture change are indispensable for regulating ET and mitigating drought impacts.
In summary, this research not only enhances our understanding of ET in small, forest-dominated basins in southwestern China, but also provides valuable scientific insights for effective water resource management and climate change adaptation strategies. Future studies should further investigate the coupled mechanisms of soil moisture and groundwater processes to refine predictions of ET under evolving climatic and anthropogenic influences.

Supplementary Materials

The following supporting information can be downloaded at https://www.mdpi.com/article/10.3390/su17156816/s1; Figure S1: Comparison of monthly mean air temperature between ERA5 and the Lijiang Meteorological Station; Figure S2: Comparison of monthly precipitation between the Lijiang Meteorological Station and gridded datasets.

Author Contributions

Conceptualization, Q.M. and Z.Z.; methodology, Q.M. and Z.Z.; software, Z.Z.; validation, L.L. and Y.L.; formal analysis, Q.M. and Z.Z.; investigation, L.L., Y.L. and C.L.; resources, Y.J., Q.M. and Z.Z.; data curation, Z.Z.; writing—original draft preparation, Z.Z. and Q.M.; writing—review and editing, Z.Z. and Q.M.; visualization, Z.Z. and Q.M.; supervision, Y.J. and Q.M.; project administration, Y.J. and Q.M.; funding acquisition, Y.J. and Q.M. All authors have read and agreed to the published version of the manuscript.

Funding

This research was funded by the National Natural Science Foundation of China (No. 41930970), Open Fund of State Key Laboratory of Remote Sensing and Digital Earth (No. OFSLRSS202416), the BNU-FGS Global Environmental Change Program (No. 2023-GC-ZYTS-06), the National Natural Science Foundation of China (No. 42471131), Yunnan Provincial Basic Research Project-Key Project (No. 202201AS070024), and the National Undergraduate Training Program for Innovation and Entrepreneurship (No. 202310681007).

Institutional Review Board Statement

Not applicable.

Informed Consent Statement

Not applicable.

Data Availability Statement

The Digital Elevation Model (DEM) data can be downloaded at https://search.asf.alaska.edu, accessed on 20 June 2025. The 2017 land use raster data can be downloaded at http://www.geodata.cn, accessed on 20 June 2025. The soil data can be downloaded at https://gaez.fao.org/pages/hwsd, accessed on 20 June 2025. The meteorological data can be downloaded at https://data.cma.cn, accessed on 20 June 2025.

Conflicts of Interest

The authors declare no conflicts of interest.

References

  1. Günen, M.A.; Atasever, U.H. Remote sensing and monitoring of water resources: A comparative study of different indices and thresholding methods. Sci. Total Environ. 2024, 926, 172117. [Google Scholar] [CrossRef]
  2. Scanlon, B.R.; Fakhreddine, S.; Rateb, A.; de Graaf, I.; Famiglietti, J.; Gleeson, T.; Grafton, R.Q.; Jobbagy, E.; Kebede, S.; Kolusu, S.R. Global water resources and the role of groundwater in a resilient water future. Nat. Rev. Earth Environ. 2023, 4, 87–101. [Google Scholar] [CrossRef]
  3. Oki, T.; Kanae, S. Global hydrological cycles and world water resources. Science 2006, 313, 1068–1072. [Google Scholar] [CrossRef]
  4. Kool, D.; Agam, N.; Lazarovitch, N.; Heitman, J.; Sauer, T.; Ben-Gal, A. A review of approaches for evapotranspiration partitioning. Agric. For. Meteorol. 2014, 184, 56–70. [Google Scholar] [CrossRef]
  5. Zhang, K.; Kimball, J.S.; Running, S.W. A review of remote sensing based actual evapotranspiration estimation. Wiley Interdiscip. Rev. Water 2016, 3, 834–853. [Google Scholar] [CrossRef]
  6. Yang, Y.; Roderick, M.L.; Guo, H.; Miralles, D.G.; Zhang, L.; Fatichi, S.; Luo, X.; Zhang, Y.; McVicar, T.R.; Tu, Z. Evapotranspiration on a greening Earth. Nat. Rev. Earth Environ. 2023, 4, 626–641. [Google Scholar] [CrossRef]
  7. Godoy, M.R.V.; Markonis, Y. Water cycle changes in reanalyses: A complementary framework. Sci. Rep. 2023, 13, 4795. [Google Scholar] [CrossRef]
  8. Zhao, F.B.; Ma, S.; Wu, Y.P.; Qiu, L.J.; Wang, W.K.; Lian, Y.Q.; Chen, J.; Sivakumar, B. The role of climate change and vegetation greening on evapotranspiration variation in the Yellow River Basin, China. Agric. For. Meteorol. 2022, 316, 108842. [Google Scholar] [CrossRef]
  9. Yang, D.; Yang, Y.; Xia, J. Hydrological cycle and water resources in a changing world: A review. Geogr. Sustain. 2021, 2, 115–122. [Google Scholar] [CrossRef]
  10. Gong, C.; Wang, W.; Zhang, Z.; Wang, H.; Luo, J.; Brunner, P. Comparison of field methods for estimating evaporation from bare soil using lysimeters in a semi-arid area. J. Hydrol. 2020, 590, 125334. [Google Scholar] [CrossRef]
  11. Liu, C.; Zhang, X.; Zhang, Y. Determination of daily evaporation and evapotranspiration of winter wheat and maize by large-scale weighing lysimeter and micro-lysimeter. Agric. For. Meteorol. 2002, 111, 109–120. [Google Scholar] [CrossRef]
  12. Su, Y.; Zhang, C.; Chen, X.; Liu, L.; Ciais, P.; Peng, J.; Wu, S.; Wu, J.; Shang, J.; Wang, Y. Aerodynamic resistance and Bowen ratio explain the biophysical effects of forest cover on understory air and soil temperatures at the global scale. Agric. For. Meteorol. 2021, 308, 108615. [Google Scholar] [CrossRef]
  13. Baldocchi, D.D. How eddy covariance flux measurements have contributed to our understanding of Global Change Biology. Glob. Change Biol. 2020, 26, 242–260. [Google Scholar] [CrossRef]
  14. Bambach, N.; Kustas, W.; Alfieri, J.; Prueger, J.; Hipps, L.; McKee, L.; Castro, S.; Volk, J.; Alsina, M.; McElrone, A. Evapotranspiration uncertainty at micrometeorological scales: The impact of the eddy covariance energy imbalance and correction methods. Irrig. Sci. 2022, 40, 445–461. [Google Scholar] [CrossRef]
  15. Jin, L.; Zhang, H.; He, Q.; Zhang, H. Comparison of the sensible heat flux determined by large-aperture Scintillometer and Eddy covariance measurements with respect to the energy balance problem in the Taklimakan Desert. Bound.-Layer Meteorol. 2022, 185, 365–393. [Google Scholar] [CrossRef]
  16. Singh, P.; Sehgal, V.K.; Dhakar, R.; Neale, C.M.; Goncalves, I.Z.; Rani, A.; Jha, P.K.; Das, D.K.; Mukherjee, J.; Khanna, M. Estimation of ET and crop water productivity in a semi-arid region using a large aperture scintillometer and remote sensing-based SETMI model. Water 2024, 16, 422. [Google Scholar] [CrossRef]
  17. Chen, J.M.; Liu, J. Evolution of evapotranspiration models using thermal and shortwave remote sensing data. Remote Sens. Environ. 2020, 237, 111594. [Google Scholar] [CrossRef]
  18. Zhao, G.; Gao, H.; Cai, X. Estimating lake temperature profile and evaporation losses by leveraging MODIS LST data. Remote Sens. Environ. 2020, 251, 112104. [Google Scholar] [CrossRef]
  19. Dembélé, M.; Ceperley, N.; Zwart, S.J.; Salvadore, E.; Mariethoz, G.; Schaefli, B. Potential of satellite and reanalysis evaporation datasets for hydrological modelling under various model calibration strategies. Adv. Water Resour. 2020, 143, 103667. [Google Scholar] [CrossRef]
  20. Lu, J.; Wang, G.; Chen, T.; Li, S.; Hagan, D.F.T.; Kattel, G.; Peng, J.; Jiang, T.; Su, B. A harmonized global land evaporation dataset from model-based products covering 1980–2017. Earth Syst. Sci. Data 2021, 13, 5879–5898. [Google Scholar] [CrossRef]
  21. Pan, S.; Pan, N.; Tian, H.; Friedlingstein, P.; Sitch, S.; Shi, H.; Arora, V.K.; Haverd, V.; Jain, A.K.; Kato, E. Evaluation of global terrestrial evapotranspiration using state-of-the-art approaches in remote sensing, machine learning and land surface modeling. Hydrol. Earth Syst. Sci. 2020, 24, 1485–1509. [Google Scholar] [CrossRef]
  22. Antonopoulos, V.Z.; Gianniou, S.K.; Antonopoulos, A.V. Artificial neural networks and empirical equations to estimate daily evaporation: Application to Lake Vegoritis, Greece. Hydrol. Sci. J.-J. Des Sci. Hydrol. 2016, 61, 2590–2599. [Google Scholar] [CrossRef]
  23. Baffaut, C.; Baker, J.M.; Biederman, J.A.; Bosch, D.D.; Brooks, E.S.; Buda, A.R.; Demaria, E.M.; Elias, E.H.; Flerchinger, G.N.; Goodrich, D.C.; et al. Comparative analysis of water budgets across the US long-term agroecosystem research network. J. Hydrol. 2020, 588, 125021. [Google Scholar] [CrossRef]
  24. Cai, Y.F.; Zhang, F.; Shi, J.C.; Johnson, V.C.; Ahmed, Z.; Wang, J.G.; Wang, W.W. Enhancing SWAT model with modified method to improve Eco-hydrological simulation in arid region. J. Clean. Prod. 2023, 403, 136891. [Google Scholar] [CrossRef]
  25. Dangol, S.; Zhang, X.S.; Liang, X.Z.; Anderson, M.; Crow, W.; Lee, S.; Moglen, G.E.; McCarty, G.W. Multivariate Calibration of the SWAT Model Using Remotely Sensed Datasets. Remote Sens. 2023, 15, 2417. [Google Scholar] [CrossRef]
  26. Merk, F.; Schaffhauser, T.; Anwar, F.; Tuo, Y.; Cohard, J.M.; Disse, M. The significance of the leaf area index for evapotranspiration estimation in SWAT-T for characteristic land cover types of West Africa. Hydrol. Earth Syst. Sci. 2024, 28, 5511–5539. [Google Scholar] [CrossRef]
  27. Abiodun, O.O.; Guan, H.; Post, V.E.A.; Batelaan, O. Comparison of MODIS and SWAT evapotranspiration over a complex terrain at different spatial scales. Hydrol. Earth Syst. Sci. 2018, 22, 2775–2794. [Google Scholar] [CrossRef]
  28. Dash, S.S.; Sahoo, B.; Raghuwanshi, N.S. Improved drought monitoring in teleconnection to the climatic escalations: A hydrological modeling based approach. Sci. Total Environ. 2023, 857, 159545. [Google Scholar] [CrossRef]
  29. Morsy, M.; Sayad, T.; Abdou, M.I.; Aboelkhair, H. Comparative study of evapotranspiration from the SWAT model and MODIS-derived remote sensing data in two climatic zones in Egypt. J. Water Clim. Change 2024, 15, 5219–5241. [Google Scholar] [CrossRef]
  30. Wang, L.; Chen, W.; Haung, G.; Wang, T.; Wang, Q.L.; Su, X.Y.; Ren, Z.X.; Chotamonsak, C.; Limsakul, A.; Torsri, K. Characteristics of super drought in Southwest China and the associated compounding effect of multiscalar anomalies. Sci. China-Earth Sci. 2024, 67, 2084–2102. [Google Scholar] [CrossRef]
  31. Wang, H.; Stephenson, S.R.; Qu, S.J. Quantifying the relationship between streamflow and climate change in a small basin under future scenarios. Ecol. Indic. 2020, 113, 106251. [Google Scholar] [CrossRef]
  32. Li, G.; Zhang, F.M.; Jing, Y.S.; Liu, Y.B.; Sun, G. Response of evapotranspiration to changes in land use and land cover and climate in China during 2001–2013. Sci. Total Environ. 2017, 596, 256–265. [Google Scholar] [CrossRef]
  33. Li, Z.; Xu, X.; Yu, B.; Xu, C.; Liu, M.; Wang, K. Quantifying the impacts of climate and human activities on water and sediment discharge in a karst region of southwest China. J. Hydrol. 2016, 542, 836–849. [Google Scholar] [CrossRef]
  34. Benavidez, R.; Jackson, B.; Maxwell, D.; Norton, K. A review of the (Revised) Universal Soil Loss Equation ((R)USLE): With a view to increasing its global applicability and improving soil loss estimates. Hydrol. Earth Syst. Sci. 2018, 22, 6059–6086. [Google Scholar] [CrossRef]
  35. Allen, M.; Dube, O.P.; Solecki, W.; Aragón-Durand, F.; Cramer, W.; Humphreys, S.; Kainuma, M.; Kala, J.; Mahowald, N.; Mulugetta, Y.; et al. Framing and Context. In Special Report: Global Warming of 1.5 °C; Cambridge University Press: Cambridge, UK, 2018. [Google Scholar]
  36. Valencia, S.; Villegas, J.C.; Hoyos, N.; Duque-Villegas, M.; Salazar, J.F. Streamflow response to land use/land cover change in the tropical Andes using multiple SWAT model variants. J. Hydrol.-Reg. Stud. 2024, 54, 101888. [Google Scholar] [CrossRef]
  37. Jafari, T.; Kiem, A.S.; Javadi, S.; Nakamura, T.; Nishida, K. Fully integrated numerical simulation of surface water-groundwater interactions using SWAT-MODFLOW with an improved calibration tool. J. Hydrol.-Reg. Stud. 2021, 35, 100822. [Google Scholar] [CrossRef]
  38. Ryter, D.W.; Alzraiee, A.H.; Niswonger, R.G. Simulation of the impacts of projected climate change on groundwater resources in the Urban, Semiarid Yucaipa Valley Watershed, Southern California using an integrated hydrologic model. J. Hydrol.-Reg. Stud. 2025, 60, 102461. [Google Scholar] [CrossRef]
  39. Wang, Y.F.; Jing, J.L.; Liu, H.H. Spatio—Temporal Variation of Evapotranspiration and Its Driving Factors in Southwest China from 2000 to 2020. Resour. Environ. Yangtze Basin 2023, 32, 2568–2580. [Google Scholar]
  40. Xie, R.H.; Wang, A.H. Comparison of Ten Potential Evapotranspiration Models and Their Attribution Analyses for Ten Chinese Drainage Basins. Adv. Atmos. Sci. 2020, 37, 959–974. [Google Scholar] [CrossRef]
  41. Zhao, J.C.; Liu, Q.Q.; Lu, H.L.; Wang, Z.; Zhang, K.; Wang, P. Future droughts in China using the standardized precipitation evapotranspiration index (SPEI) under multi-spatial scales. Nat. Hazards 2021, 109, 615–636. [Google Scholar] [CrossRef]
  42. Ma, N.; Zhang, Y.Q. Increasing Tibetan Plateau terrestrial evapotranspiration primarily driven by precipitation. Agric. For. Meteorol. 2022, 317, 108887. [Google Scholar] [CrossRef]
  43. Li, C.; Zhang, Y.; Shen, Y.; Kong, D.; Zhou, X. LUCC-driven changes in gross primary production and actual evapotranspiration in northern China. J. Geophys. Res. Atmos. 2020, 125, e2019JD031705. [Google Scholar] [CrossRef]
  44. Wang, Q.; Guan, Q.; Sun, Y.; Du, Q.; Xiao, X.; Luo, H.; Zhang, J.; Mi, J. Simulation of future land use/cover change (LUCC) in typical watersheds of arid regions under multiple scenarios. J. Environ. Manag. 2023, 335, 117543. [Google Scholar] [CrossRef]
  45. Wang, X.; Zhang, B.; Xu, X.; Tian, J.; He, C. Regional water-energy cycle response to land use/cover change in the agro-pastoral ecotone, Northwest China. J. Hydrol. 2020, 580, 124246. [Google Scholar] [CrossRef]
  46. Sun, S.; Chen, B.; Yan, J.; Van Zwieten, L.; Wang, H.; Dong, J.; Fu, P.; Song, Z. Potential impacts of land use and land cover change (LUCC) and climate change on evapotranspiration and gross primary productivity in the Haihe River Basin, China. J. Clean. Prod. 2024, 476, 143729. [Google Scholar] [CrossRef]
  47. Ma, T.J.; Chen, W.; Cai, Q.Y.; Dong, Z.Z.; Wang, L.; Hu, P.; Gao, L.; Garfinkel, C. Attribution analysis of the persistent and extreme drought in southwest China during 2022–2023. Environ. Res. Lett. 2024, 19, 114056. [Google Scholar] [CrossRef]
  48. Sun, X.P.; Wang, J.H.; Ma, M.G.; Han, X.J. Attribution of Extreme Drought Events and Associated Physical Drivers across Southwest China Using the Budyko Framework. Remote Sens. 2023, 15, 2702. [Google Scholar] [CrossRef]
  49. Sun, X.; Lai, P.; Wang, S.; Song, L.; Ma, M.; Han, X. Monitoring of extreme agricultural drought of the past 20 years in southwest China using GLDAS soil moisture. Remote Sens. 2022, 14, 1323. [Google Scholar] [CrossRef]
  50. Wang, M.; Ding, Z.; Wu, C.; Song, L.; Ma, M.; Yu, P.; Lu, B.; Tang, X. Divergent responses of ecosystem water-use efficiency to extreme seasonal droughts in Southwest China. Sci. Total Environ. 2021, 760, 143427. [Google Scholar] [CrossRef]
  51. Zhang, M.; He, J.; Wang, B.; Wang, S.; Li, S.; Liu, W.; Ma, X. Extreme drought changes in Southwest China from 1960 to 2009. J. Geogr. Sci. 2013, 23, 3–16. [Google Scholar] [CrossRef]
Figure 1. Location of the research domain. The basin boundary is shown in red. Hydrological station is marked by green dots. The meteorological station (Lijiang station) is represented by a red dot and is close to the basin as there are no meteorological stations within the basin.
Sustainability 17 06816 g001
Figure 2. Measured and simulated discharge value of Jizi hydrological station.
Sustainability 17 06816 g002
Figure 3. Comparisons of SWAT-simulated evapotranspiration (ET) with reanalysis datasets (ERA5, MERRA-2, GLDAS) for monthly values (ac), monthly anomalies values (df), and annual values of area-average (g).
Sustainability 17 06816 g003
Figure 4. ET, precipitation, and temperature in Qizi Basin during the study period.
Sustainability 17 06816 g004
Figure 5. The circular cross-correlation between ET and precipitation (a) and between ET and temperature (b).
Sustainability 17 06816 g005
Figure 6. (a) The average ET, precipitation, and temperature by season in the Jizi Basin during the study period; (b) the seasonal Standardized ET boxplot for the Jizi Basin during the study period. Black circles represent outliers beyond 1.5 times the interquartile range.
Sustainability 17 06816 g006
Figure 7. The evolution of monthly anomaly of precipitation, runoff, percolation, evapotranspiration, soil moisture, and temperature during 2019.
Sustainability 17 06816 g007
Figure 8. Multi-scale drought characterization and lagged correlations with evapotranspiration anomalies in 2019.
Sustainability 17 06816 g008
Figure 9. Heat map of ET data (a) and rate of change (b) for precipitation and temperature change scenarios.
Sustainability 17 06816 g009
Figure 10. Comparison of land use outcomes in the Gizi Basin under (a) real scenario, (b) cropland–forest scenario, (c) cropland–grassland scenario, and (d) forest–grassland scenario.
Sustainability 17 06816 g010
Figure 11. Changes in ET under different land use scenarios between 2016 and 2020. (a) Monthly ET changes under different land use scenarios between 2016 and 2020. (b) Boxplots of ET under different land use scenarios between 2016 and 2020. (c) ET for different land use scenarios during the dry and rainy seasons between 2016 and 2020. (d) monthly ET change rate for different land use scenarios between 2016 and 2020.
Sustainability 17 06816 g011
Figure 12. The multi-year average monthly PREC from 2016 to 2020.
Sustainability 17 06816 g012
Figure 13. (a) Annual variations in precipitation, ET, and temperature from 2016 to 2018 (b) Stacked Bars and Line Charts for Water balance components including actual evapotranspiration (ET), groundwater outflow (GW_Q), percolation volume (PERC), lateral flow volume (LATQ), surface runoff (SURQ), and soil water storage (SW), and the combination of PERC and LATQ represents the water flux entering the vadose zone from the soil profile.
Sustainability 17 06816 g013
Table 1. Data required for SWAT model construction in Jizi Basin.
Data TypeMain Parameters Included in the DataData Source
Digital Elevation Model (DEM) dataElevation and SlopeNASA Official Website (https://search.asf.alaska.edu, accessed on 20 June 2025)
Land use data2017 Land Use Raster DataNational Earth System Science Data Center, National Science & Technology Infrastructure of China
(http://www.geodata.cn, accessed on 20 June 2025)
Soil dataSoil Type, Soil Texture, Soil Organic Carbon Content, etc.Harmonized World Soil Database v 1.2 (https://gaez.fao.org/pages/hwsd, accessed on 20 June 2025)
Meteorological DataDaily Temperature, Humidity, Precipitation, etc., from 2016 to 2020China Meteorological Data Service Centre (https://data.cma.cn/, accessed on 20 June 2025)
observed hydrological dataDischarge in the Jizi Basin from 2016 to 2020Yulong Naxi Autonomous County Water Affairs Bureau
Table 2. Calibration parameter and parameter sensitivity ranking.
NumberParameter NameDescription of ParameterRangeFitted Valuep-Valuet-Statistic
1R_CN2Initial SCS runoff curve number for moisture condition II−0.2–0.2−0.070.00−23.43
2R_SOL_AWCAvailable water capacity (mm/mm)−0.5–0.50.480.005.63
3R_SOL_BDMoist bulk density (mg/m3)1.1–1.91.760.002.91
4V__ESCOSoil evaporation compensation factor0–10.890.00−2.84
5R_GWQMNThreshold depth of water in the shallow aquifer for return flow to occur (mm)−0.5–0.50.310.081.74
6R_SOL_KSaturated hydraulic conductivity−0.5–0.50.310.12−0.17
7R_CANMXMaximum canopy storage (mm)−0.5–0.50.470.131.53
8R_OV_NManning’s “n” value for overland flow−0.5–0.50.110.161.38
9V_ALPHA_BFBaseflow alpha factor0–10.040.19−1.31
10V_CH_K2Effective hydraulic conductivity in main channel alluvium (mm/h)0–50023.490.23−1.19
11R__SLSUBBSNAverage slope length (m)−0.5–0.50.090.410.83
12R_HRU_SLPAverage slope steepness(m/m)−0.5–0.50.320.49−0.69
Table 3. Changes in actual ET and change rates under the influence of precipitation, temperature, and the combined effect of precipitation and temperature.
Climate Change ScenarioP·(1–20%)
ET (mm)/ET Change Rate
P·(1–10%)
ET (mm)/ET Change Rate
P
ET (mm)/ET Change Rate
P·(1 + 10%)
ET(mm)/ET Change Rate
P·(1 + 20%)
ET (mm)/ET Change Rate
T + 2 °C47.87
(0.08%)
46.93
(−1.88%)
48.08
(0.52%)
49.06
(2.57%)
49.42
(3.32%)
T + 1 °C46.25
(−3.30%)
46.50
(−2.78%)
47.62
(−0.44%)
48.55
(1.51%)
50.11
(4.77%)
T46.16
(−3.49%)
45.97
(−3.89%)
47.83
(0.00%)
47.81
(−0.04%)
48.54
(1.48%)
Table 4. Statistical results of ET under climate change scenarios.
Climate Change
Scenarios
Range
(mm)
Standard Deviation (mm)
Temperature change scenariosT + 2 °C2.490.89
T + 1 °C3.861.42
T2.571.01
Precipitation change scenariosP (1–20%)1.710.79
P (1–10%)0.960.39
P0.460.19
P (1 + 10%)1.250.51
P (1 + 20%)1.570.64
Table 5. Simulation results of ET values and rates under different land use/cover scenarios.
Land Use/Cover ScenariosET Value
/(mm)
Comparison with Real Scene:
Increment Value/(mm)
Comparison with Real Scene: Increment Rate (%)
Real Scene47.8300
Cropland–Forest47.51−0.32−0.67%
Cropland–Grassland44.43−3.4−7.10%
Forest–Grassland47.46−0.37−0.78%
Table 6. Average annual evaporation, precipitation, and temperature from 2016 to 2020.
YearEvaporation (mm)
/Change Rate (%)
Precipitation (mm)
/Change Rate (%)
Temperature (°C)
/Change Rate (%)
2016655.03 (0.14%)966.30 (0.00%)13.63 (−0.01%)
2017625.12 (0.09%)863.30 (−0.10%)13.77 (0.00%)
2018549.93 (−0.04%)1108.80 (0.15%)13.46 (−0.03%)
2019513.59 (−0.11%)983.00 (0.02%)14.20 (0.03%)
2020526.14 (−0.08%)894.50 (−0.07%)14.00 (0.01%)
average573.962963.1813.812
Disclaimer/Publisher’s Note: The statements, opinions and data contained in all publications are solely those of the individual author(s) and contributor(s) and not of MDPI and/or the editor(s). MDPI and/or the editor(s) disclaim responsibility for any injury to people or property resulting from any ideas, methods, instructions or products referred to in the content.

