
Investigation of Ground Surface Temperature Increases in Urban Textures with Different Characteristics: The Case of Denizli City


Abstract
1. Introduction
2. Materials and Methods
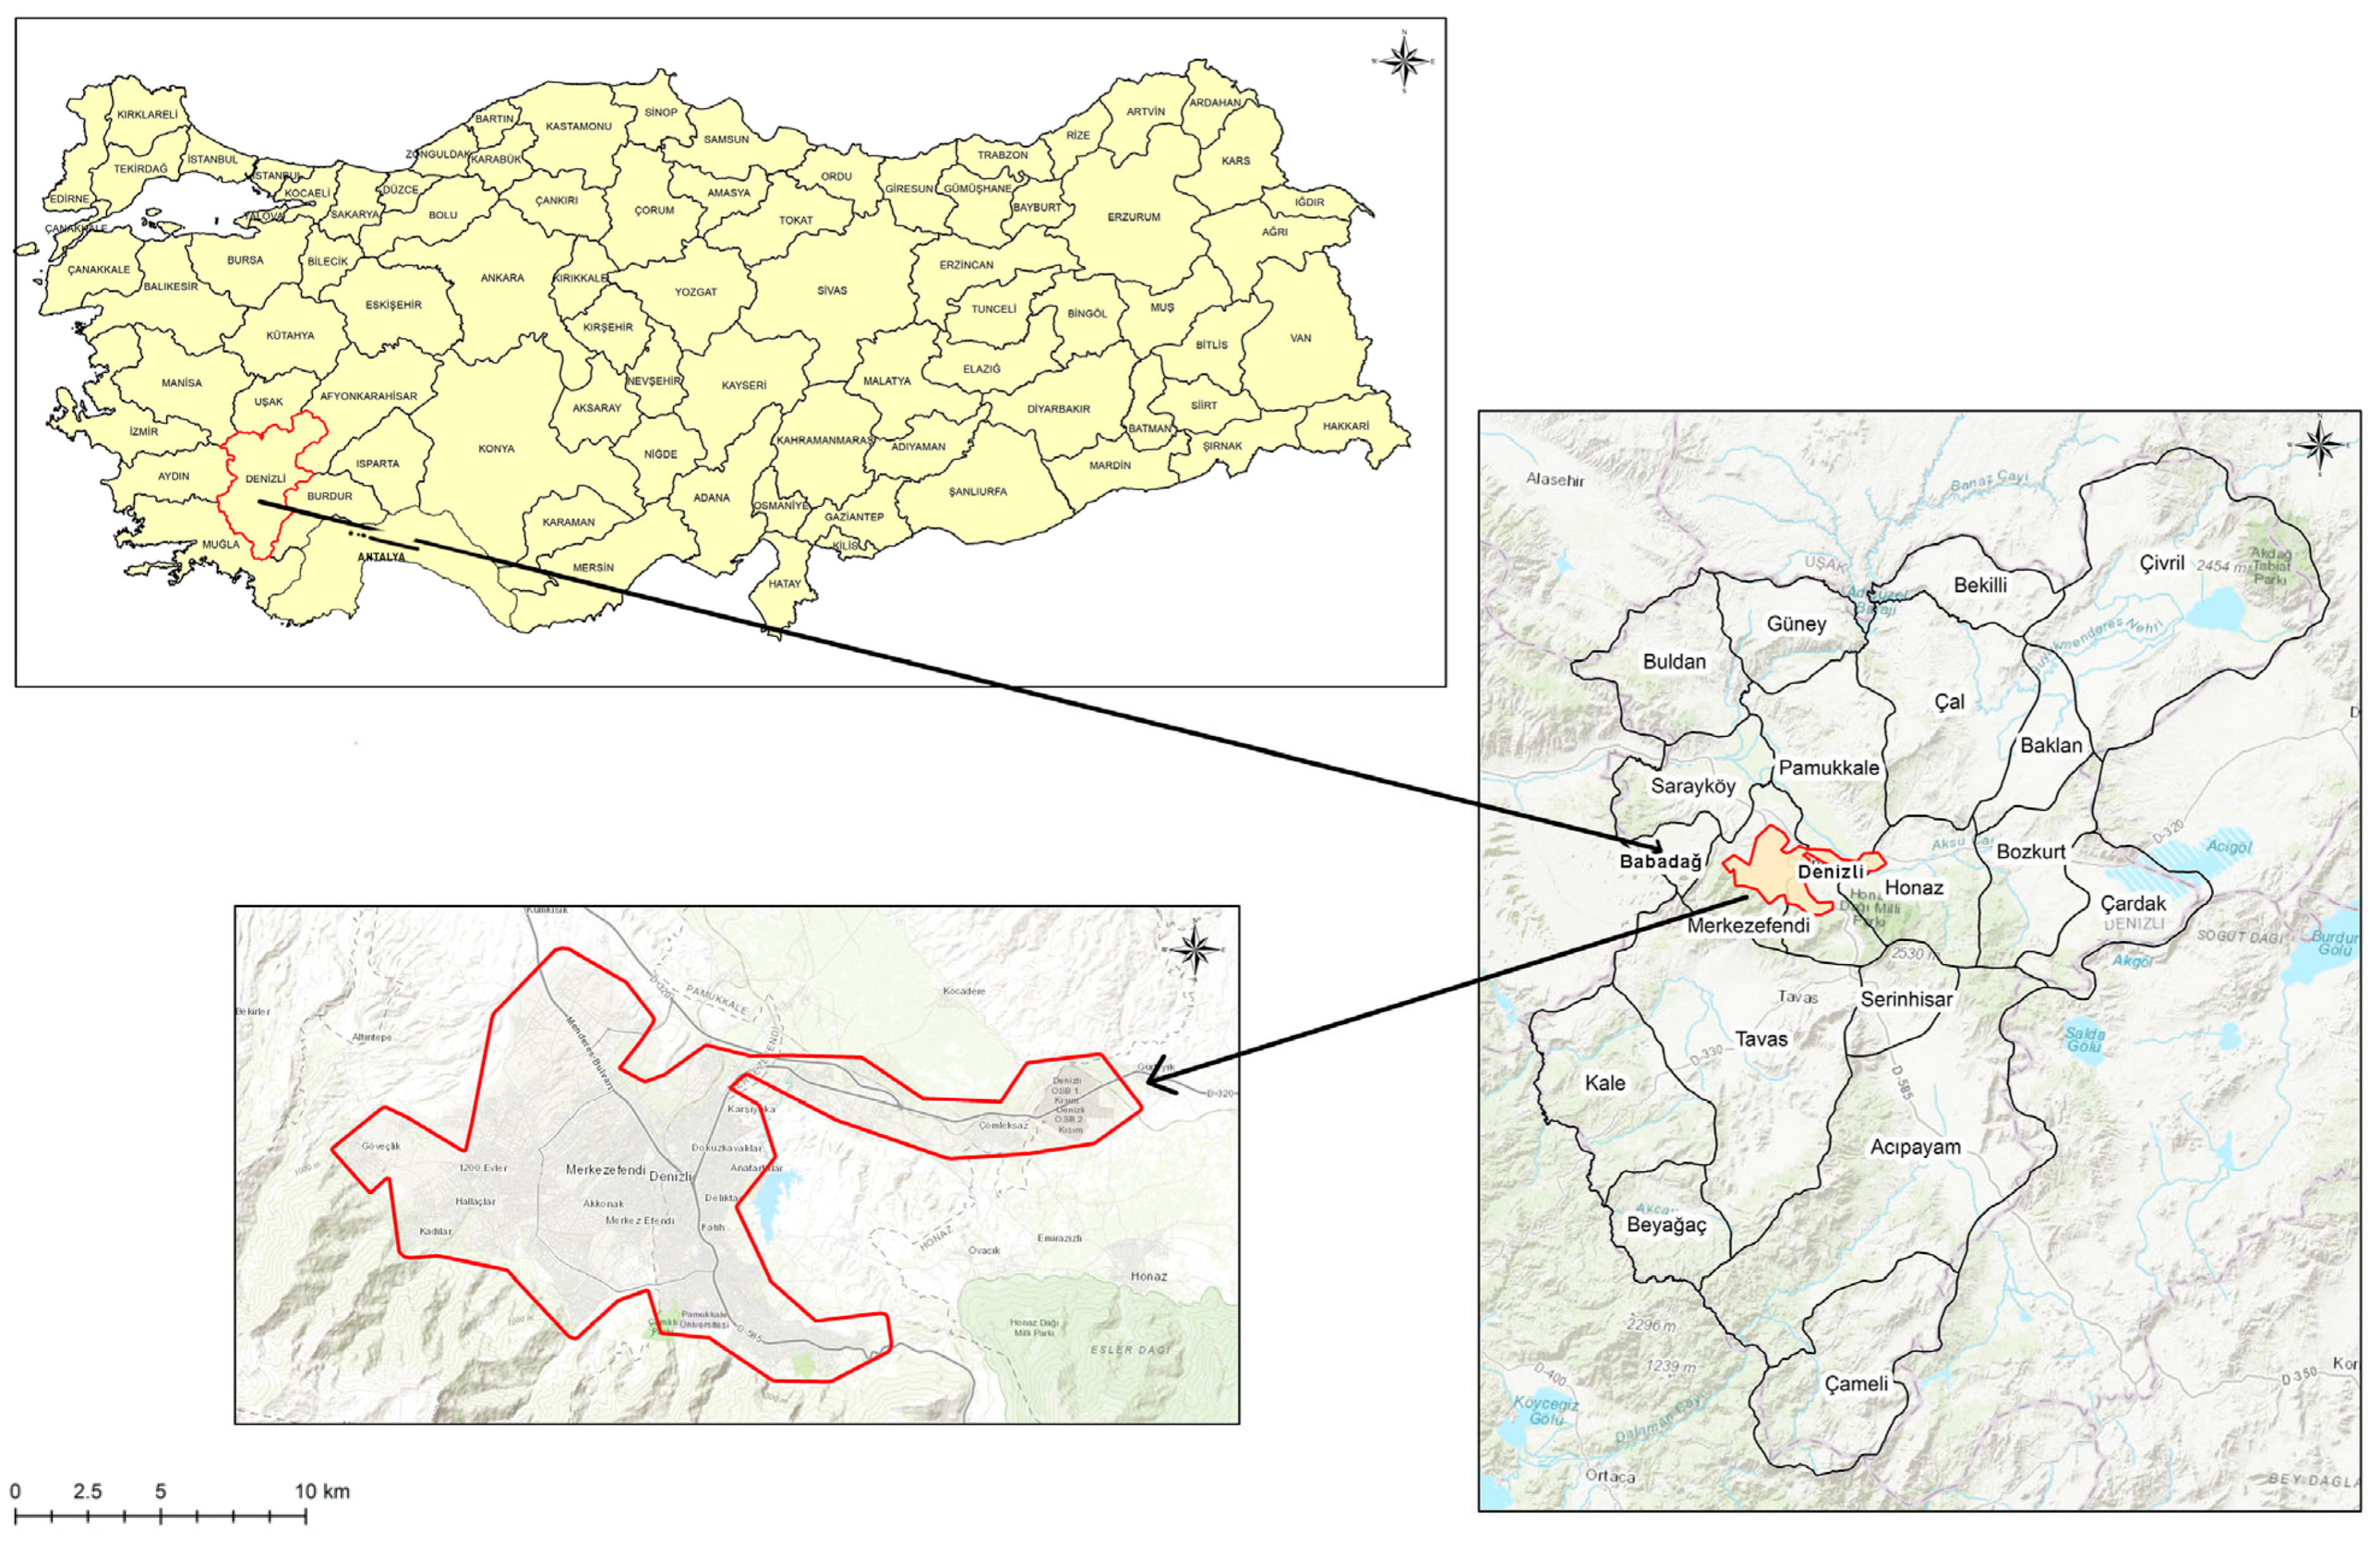
2.1. Study Area
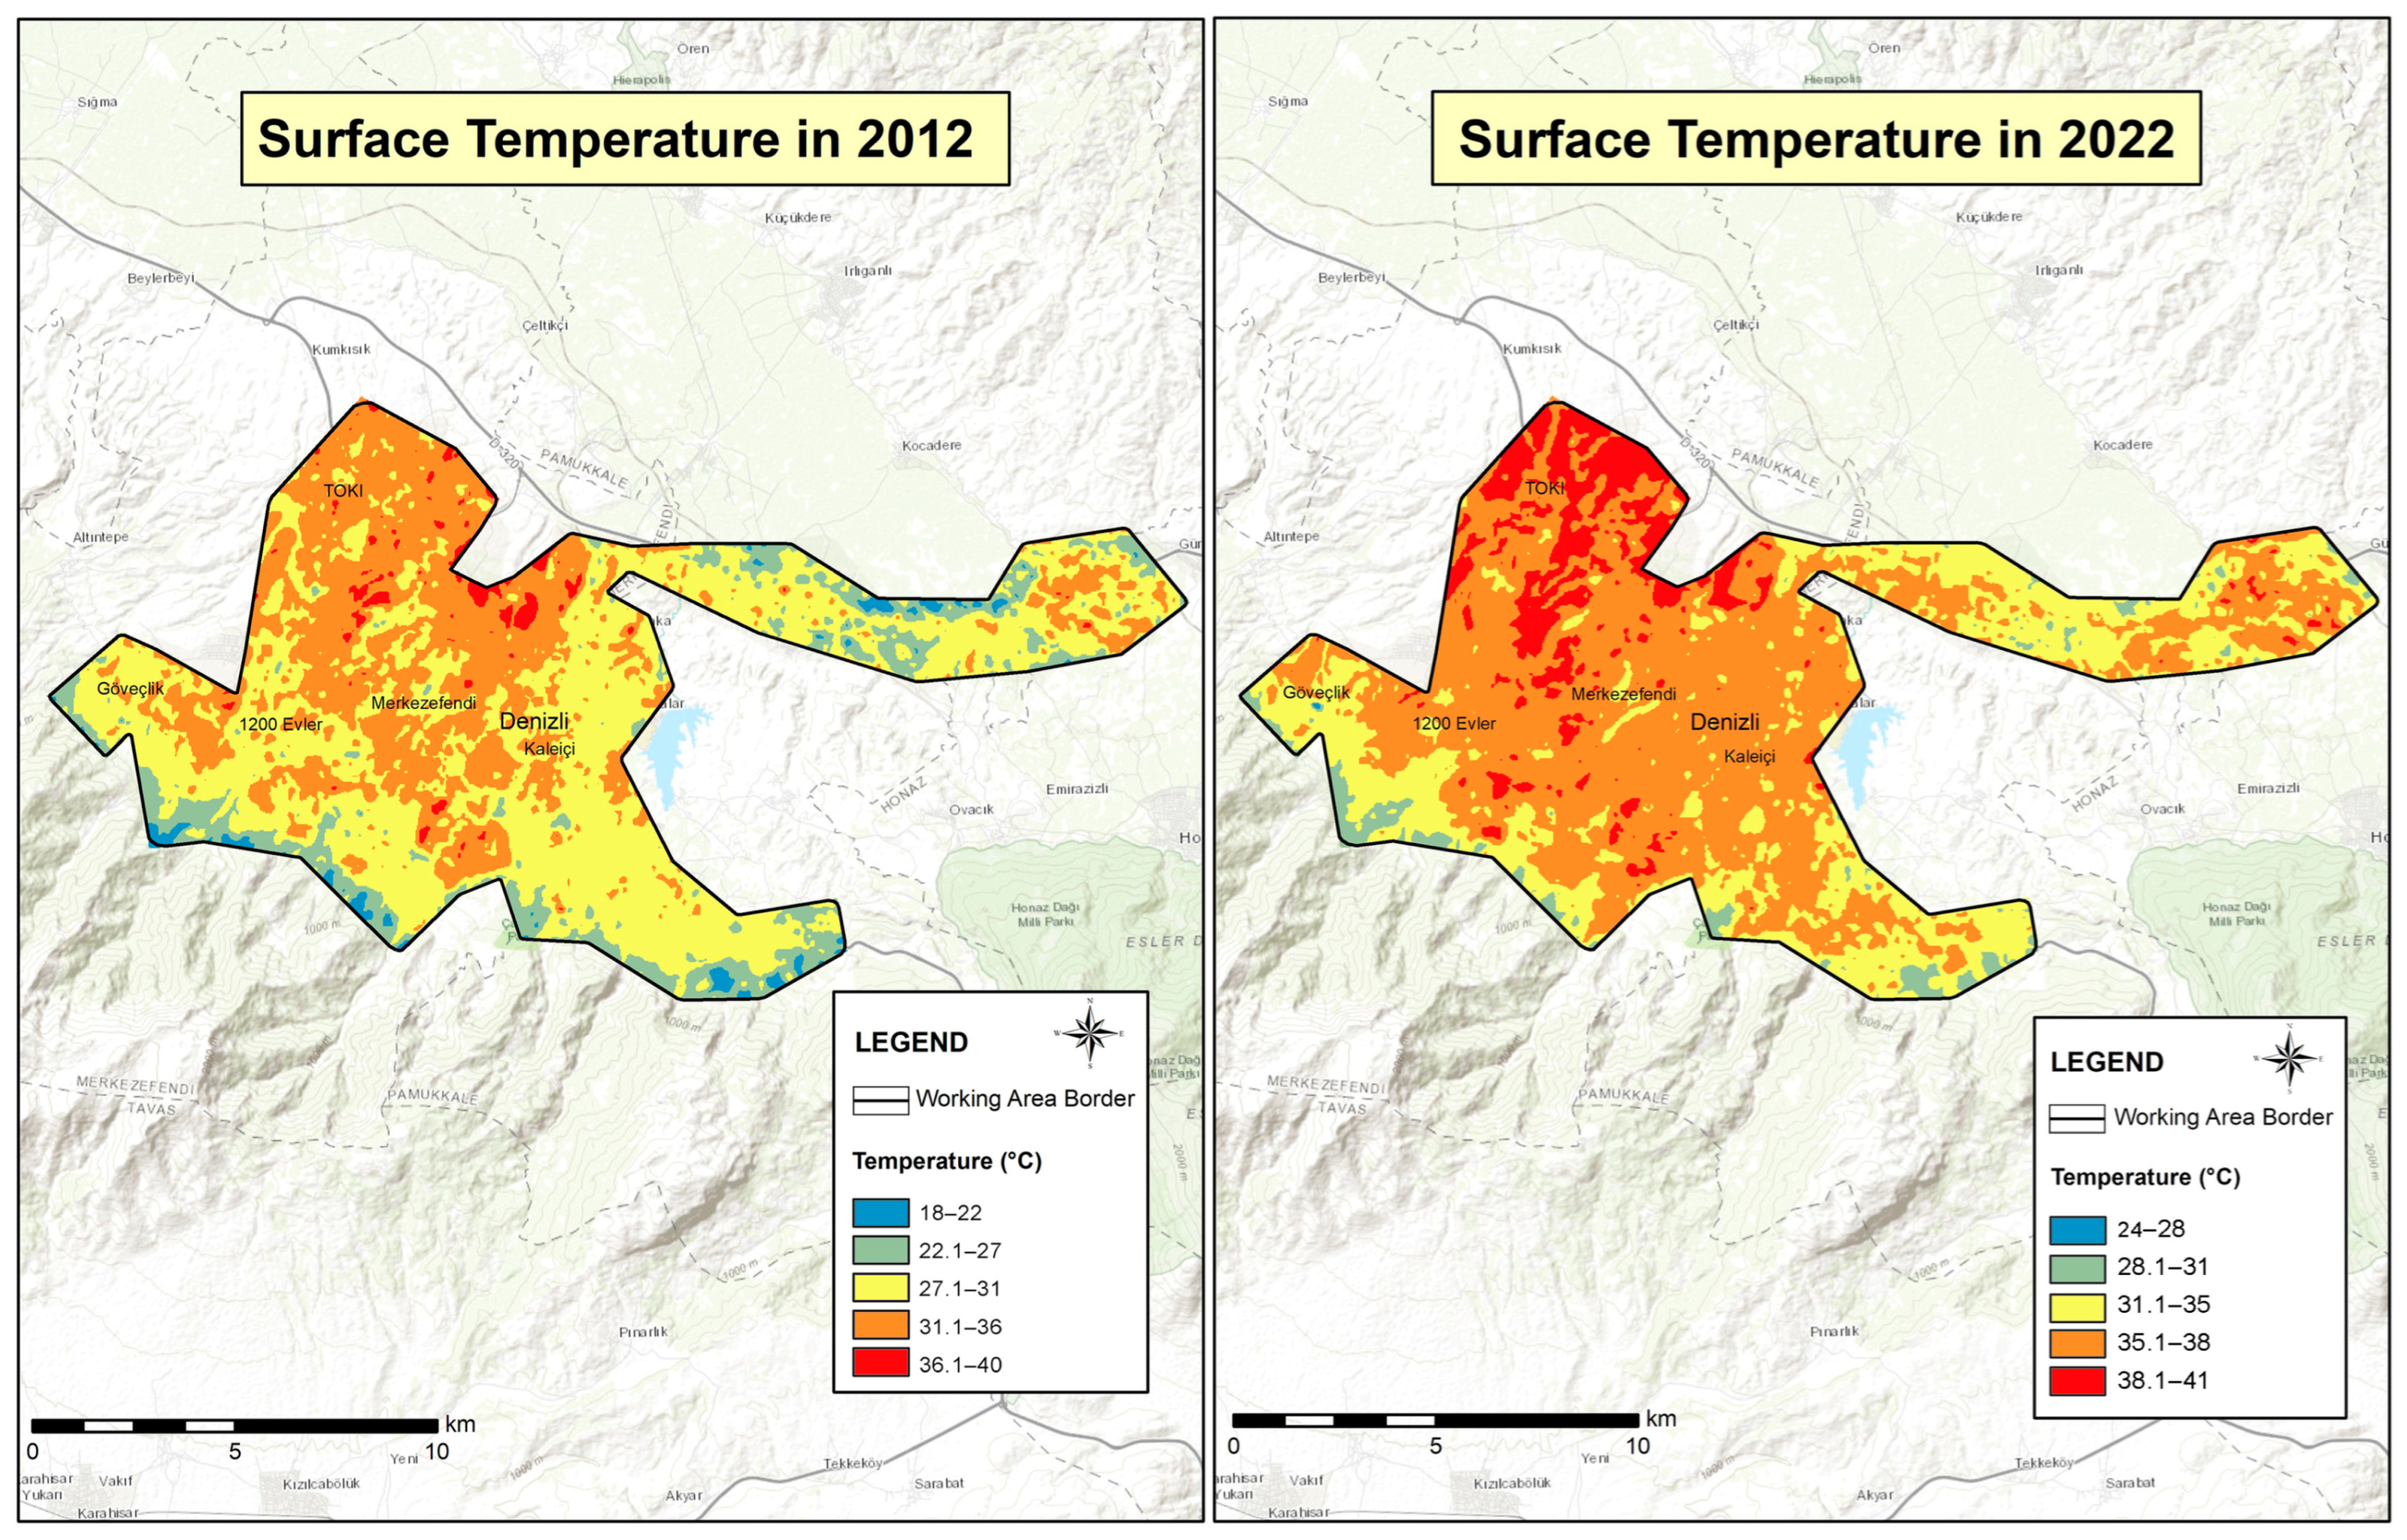
2.2. Production of Earth Surface Temperature Maps
2.3. Urban Fabric Analysis in Areas with Very High and High Temperature Rise

| Literature Findings | Criteria | Data Acquisition Method |
|---|---|---|
| Depending on the size of the park/green areas, the temperature reduction effect varies. A wooded area of 50–100 m2 decreases the temperature of the city by up to 1.5 °C, while this amount increases as the area increases. It has also been observed that the average cooling effect of a 0.15 hectare park is 1.5 °C and reaches 3 °C at midday [42]. | Size of parks and green areas | Observation in the field Photo shoot Google Earth Pro |
| On a sunny day, one tree cools with a power equivalent to 20–30 kW, which is equivalent to about 10 air conditioning units [43]. | Outside the park wooded areas | Observation in the field Photo shoot Google Earth |
| Water surfaces are a mitigating factor for the urban heat island effect and a wetland with a 30–35 m. spread provides a cooling effect of 1–3 °C [44]. | Water surface | Observation in the field Photo shoot Google Earth |
| Pavement materials such as asphalt and concrete absorb 60–95% of the solar energy incident on surfaces and reflect 5–40% [45]. | Road and sidewalk coating material | Observation in the field Photo shoot |
| Dark, dull, and rough surfaces of building materials in cities absorb and store heat; light and bright colored objects do not heat up much because they reflect light [46]. | Building cladding material | Observation in the field Photo shoot |
| Urban street layout has an impact on heat dissipation and there is a natural cooling effect in areas where the ratio (height/width) is close to 0.5 [47]. | Building height street/ street width | Observation in the field Measurement with laser meter Current map |
| Streets with low sky visibility (between 0 and 1) do not heat up much in winter and cool down very late in summer [40]. | Visibility of the sky between buildings | Observation in the field Photography with fisheye lens |
| Large surface areas in urban areas store more heat. Less heat is stored with compact (contiguous) buildings [43]. | Building layout | Observation in the field Photo shoot Current map |
| High-rise buildings in urban areas cause a decrease in wind speed, prevent heat loss, and increase the temperature. In this context, wind speed decreases as building height increases [40]. | Building height | Observation in the field Photo shoot Measurement with laser meter |
| When buildings are located parallel to the prevailing wind direction, they intercept the air and prevent it from reaching urban areas. Perpendicular positioning of buildings effectively directs the air flow [48]. | Prevailing wind direction and building location | Observation in the field Photo shoot Meteorological data |
| Building Coverage Ratio (BCR) and Floor Area Ratio (FAR) values for urban ventilation increase the efficiency of the building and the building island [49]. | Building Coverage Ratio (BCR) Floor Area Ratio (FAR) | TKGM Parcel Query Denizli Address Information System |
3. Findings
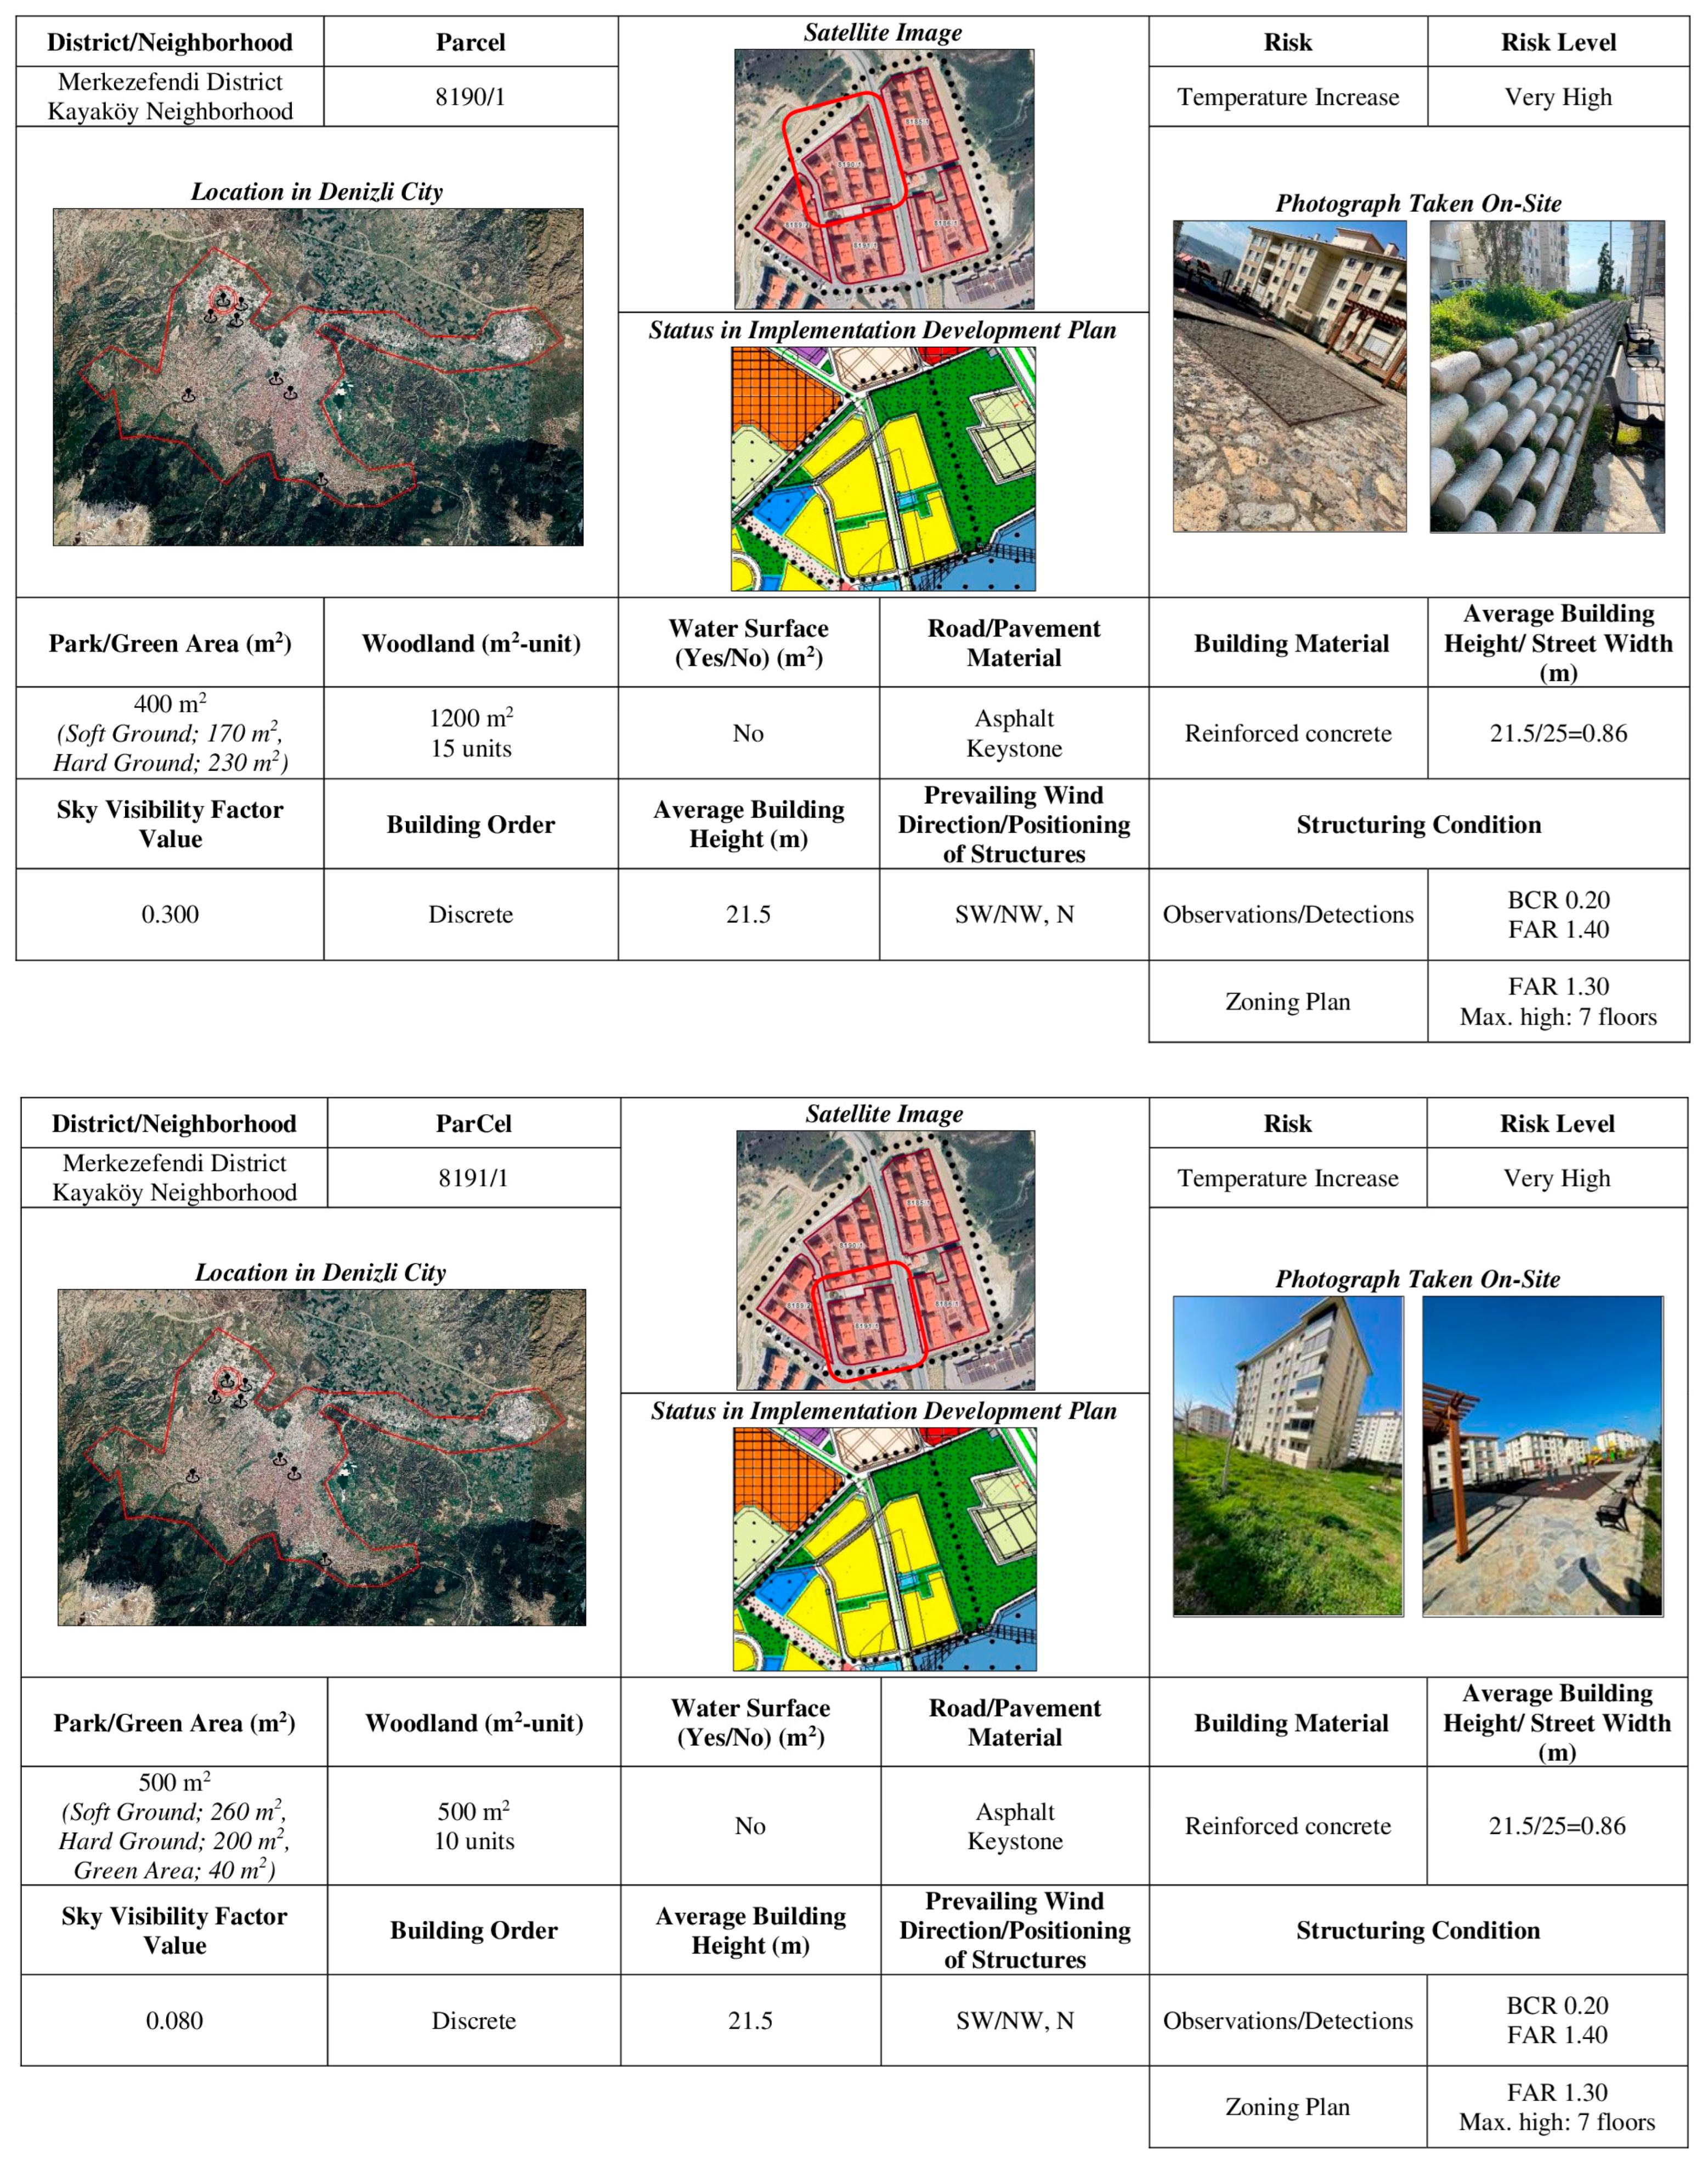
- When the amount of wooded and vegetated area in the parks is evaluated in terms of heat island effect, the ratio of hard and soft ground is not homogeneously distributed;
- There are wide openings in terms of wooded areas and number of trees to provide sufficient cooling effect;
- That there is no natural or artificial water surface;
- The use of impermeable materials including hard materials on roads/sidewalks;
- Albedo values remain in the range of 0.10–0.35 with reinforced concrete building material;
- The average building height (BH)/street-width (SW) ratio varies between 0.86 and 1.92;
- Sky Vision Factor (SVF) value ranged between 0.08 and 0.490;
- The settlement type is a housing estate and includes split-layout buildings;
- The average building height varies between 19.2 and 23.3 m;
- The buildings are generally oriented northwest and north, parallel to the prevailing wind direction;
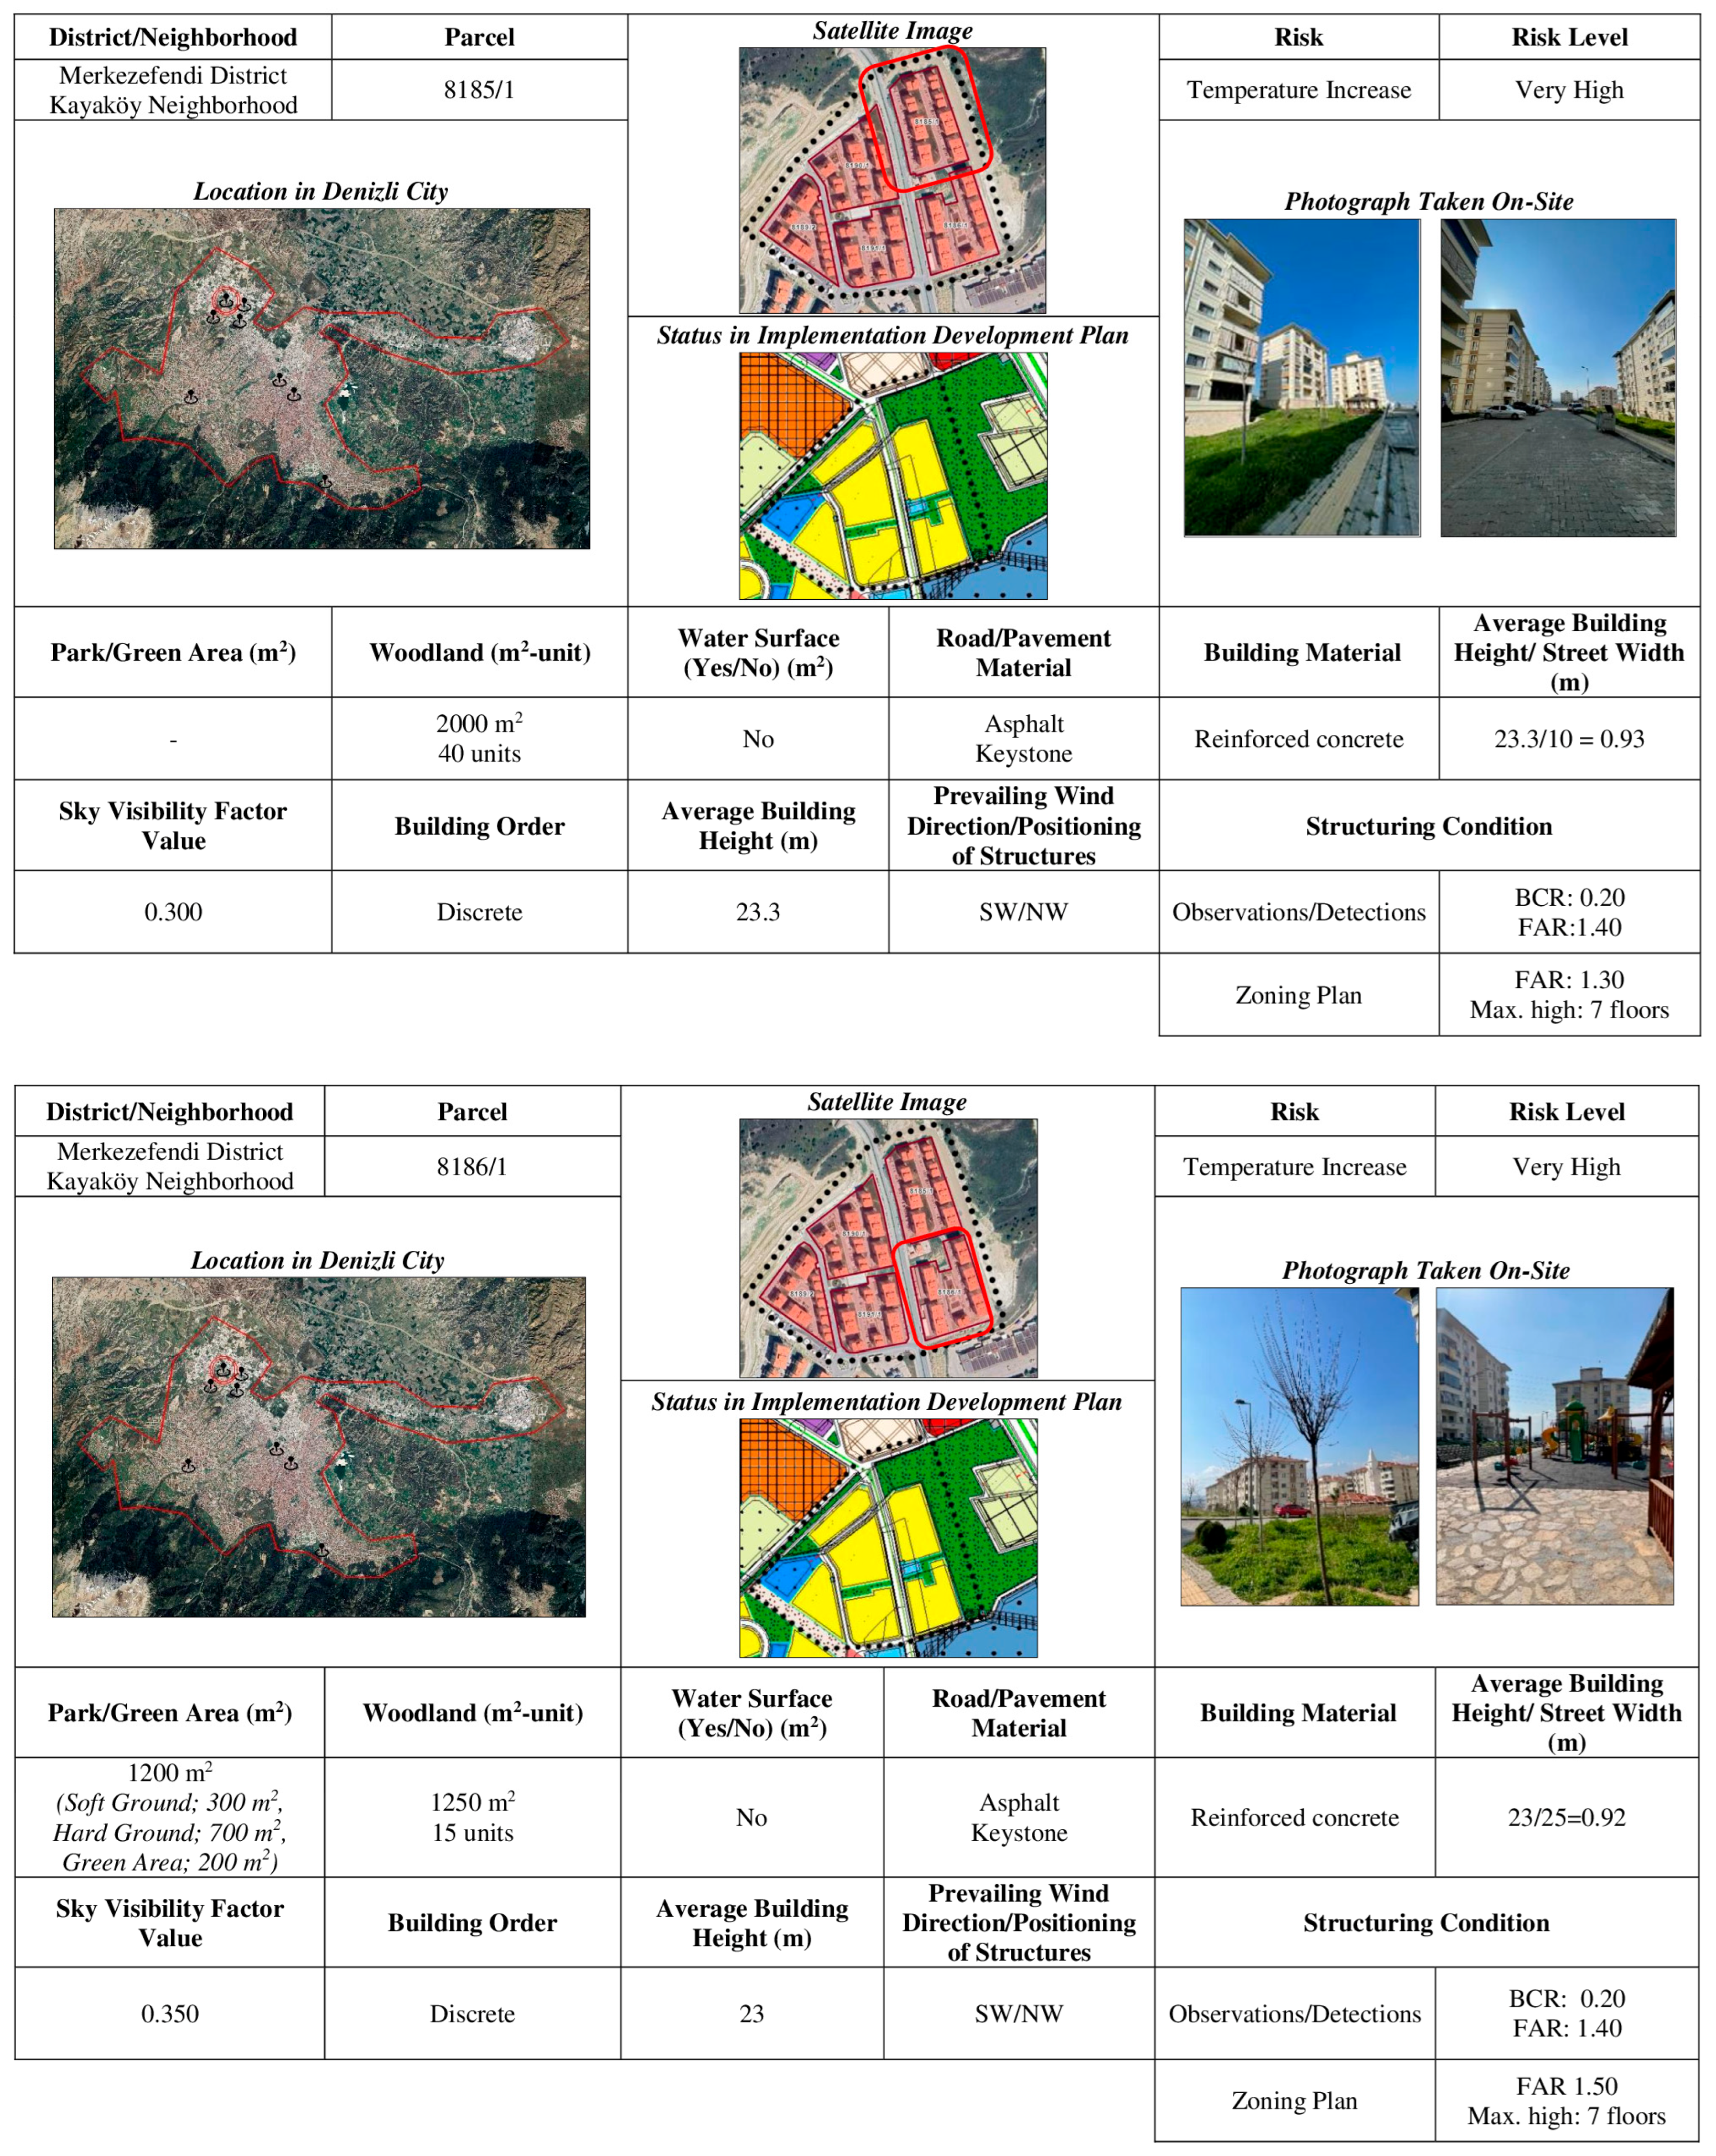
- It was determined that the Building Coverage Ratio (BCR) and Floor Area Ratio (FAR) values are in compliance with the zoning plan to a great extent, but the lack of any construction in the vicinity increases the surface temperature (Figure 5).
- Parking areas are not homogeneously distributed and the ratio of soft to hard surfaces is not balanced;
- In terms of wooded areas and number of trees, there are wide openings that will provide a cooling effect;
- That there is no natural or artificial water surface;
- The use of impermeable materials including hard materials on roads and sidewalks;
- Albedo values remain in the range of 0.10–0.35 with reinforced concrete building material;
- Average building height/street-to-street width ratio of 0.5;
- SVF value ranged between 0.240 and 0.290;
- The settlement type is a housing estate and includes split-layout buildings;
- The average building height varies between 20 and 21.5 m;
- The buildings are generally oriented northwest and parallel to the prevailing wind direction;
- It was determined that the Building Coverage Ratio (BCR) and Floor Area Ratio (FAR) values are in compliance with the zoning plan to a great extent, but the lack of any construction in the vicinity increases the surface temperature (Figure 6).
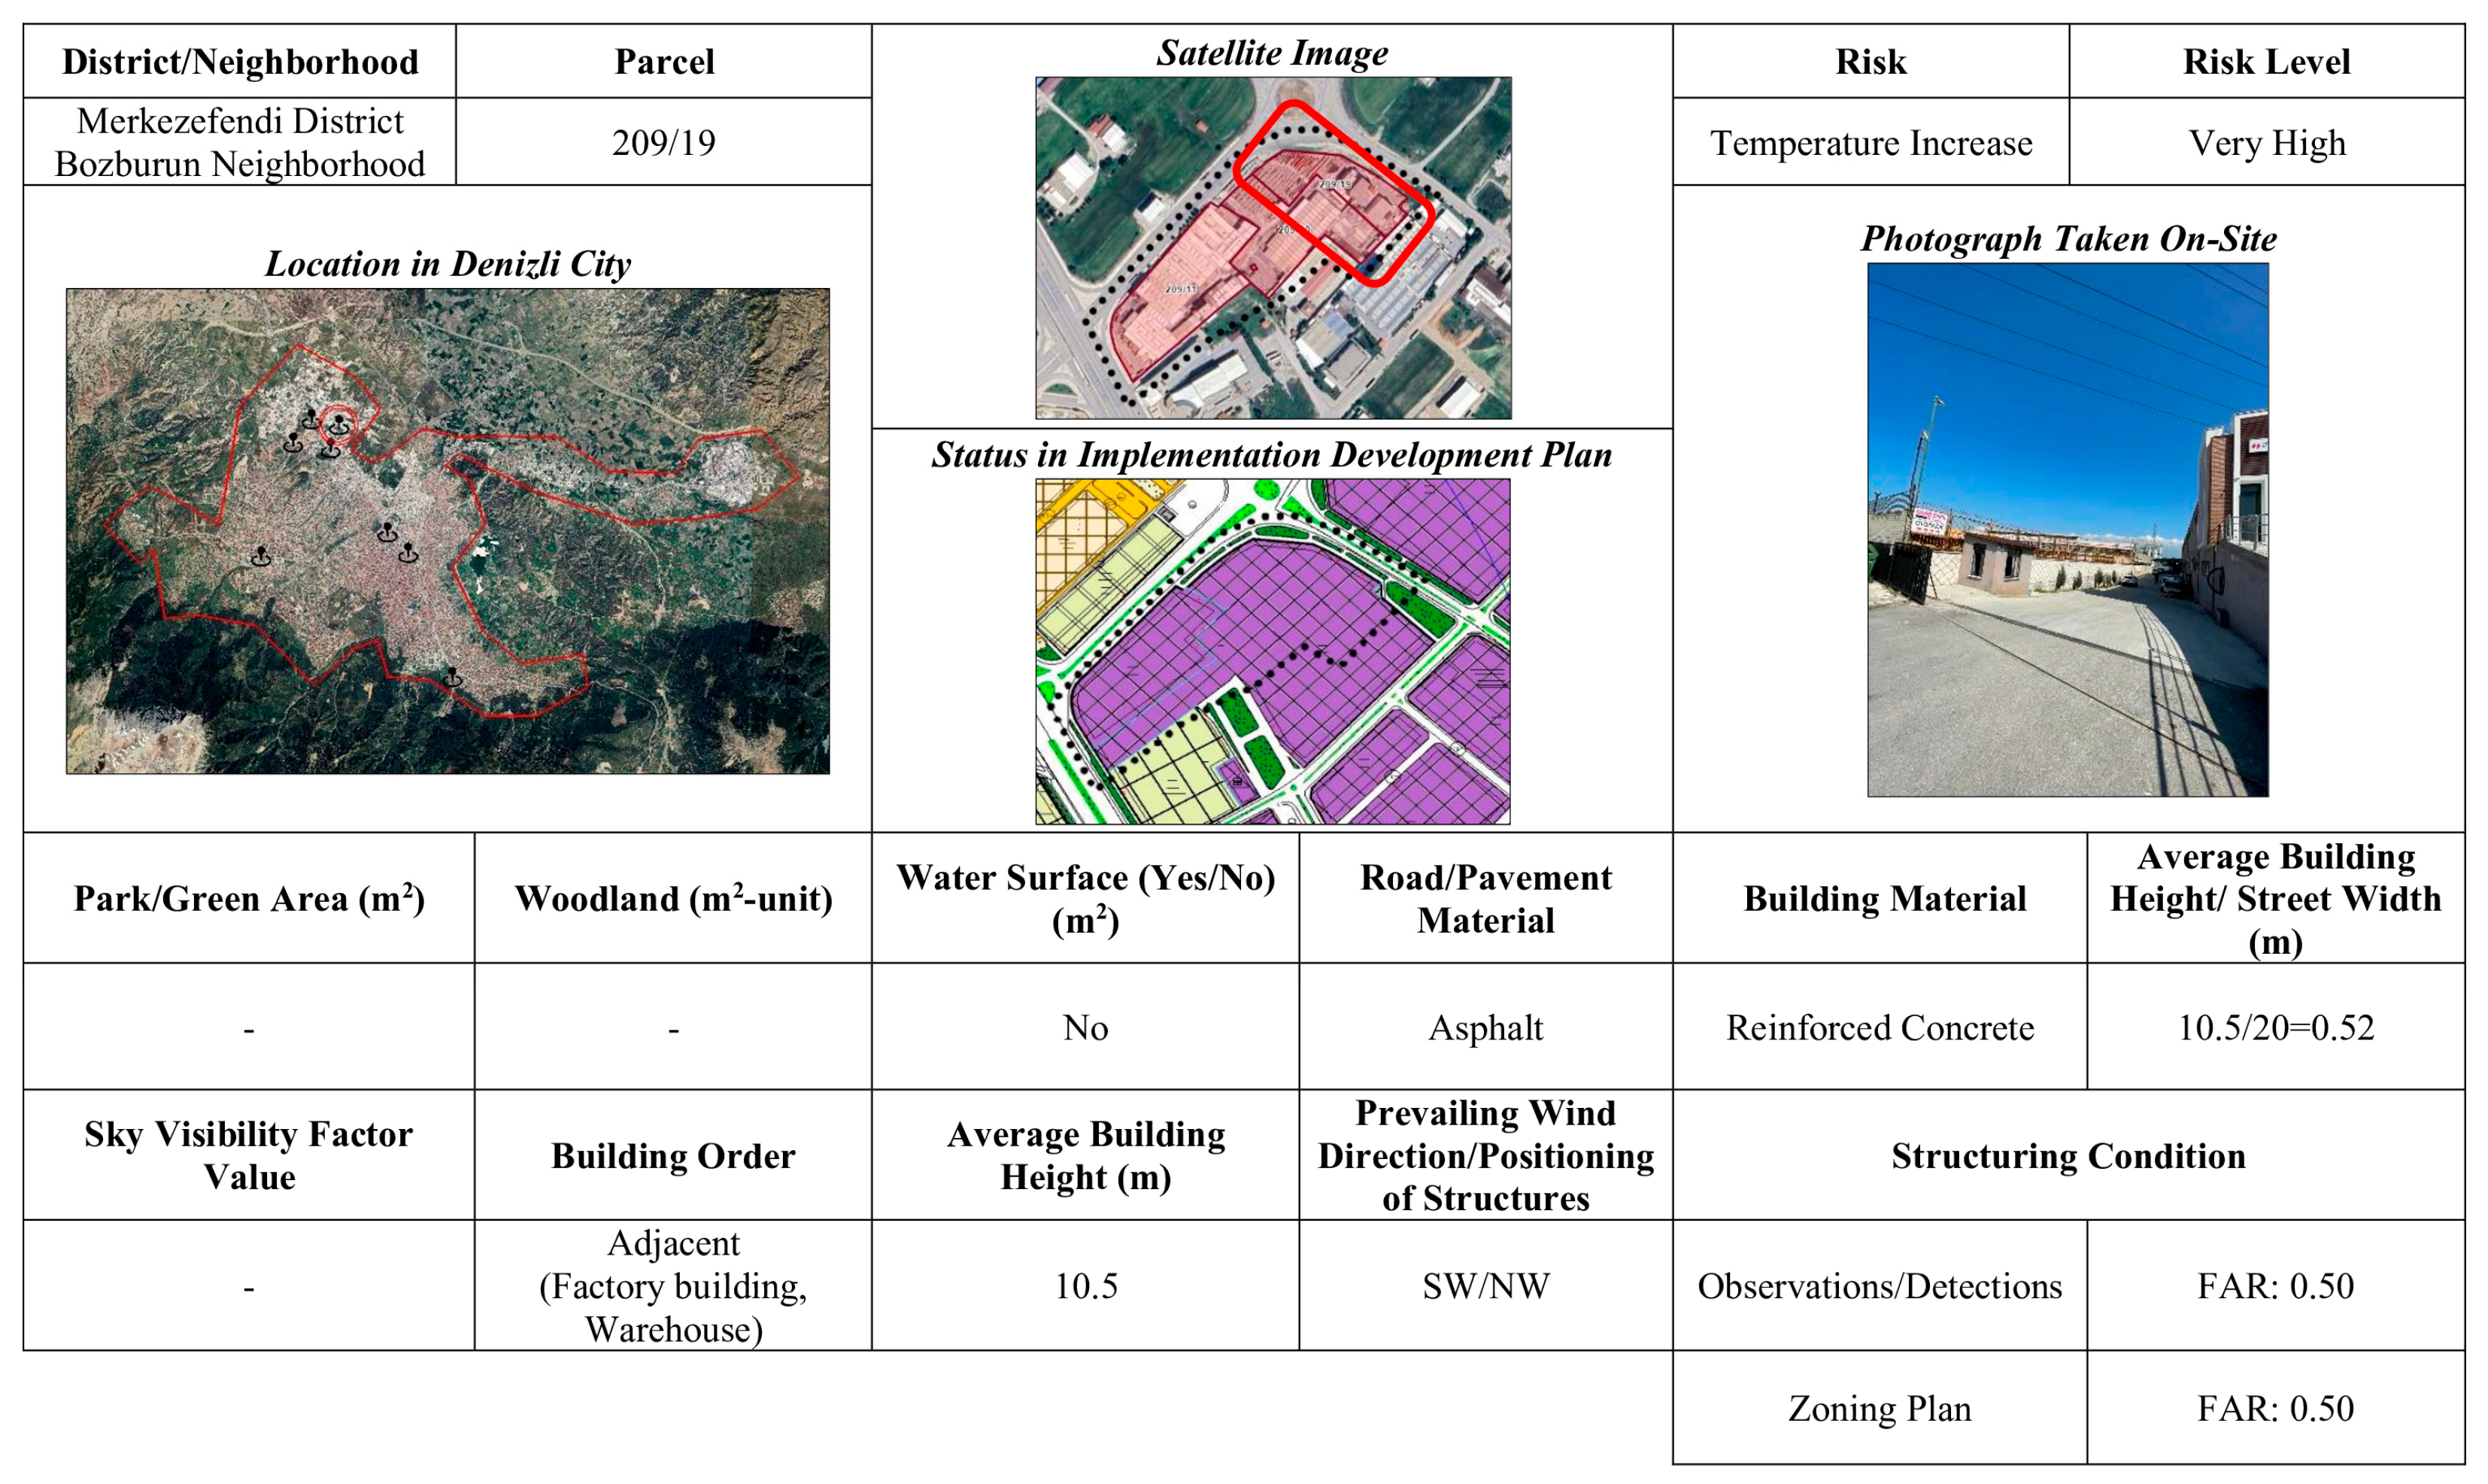
- Lack of parks/green areas and wooded areas;
- That there is no natural or artificial water surface;
- The use of impermeable materials such as asphalt and pressed concrete, which include hard materials, on roads and sidewalks;
- Albedo values between 0.10 and 0.35 and 0.10 and 0.13 with the use of reinforced concrete and brick as building materials;
- The average building height/street-width ratio varies between 0.40 and 0.52;
- The SVF value could not be calculated since the factories and warehouses are not mutually located;
- In the area where the factory building and warehouses are located, the buildings are located together in separate and adjacent order;
- The average building height varies between 10.5 and 12 m;
- The buildings are generally oriented northeast and perpendicular to the prevailing wind direction;
- It was determined that the Building Coverage Ratio (BCR) and Floor Area Ratio (FAR) values were in compliance with the zoning plan, but the dense construction compared to its surroundings increased the surface temperature (Figure 7).
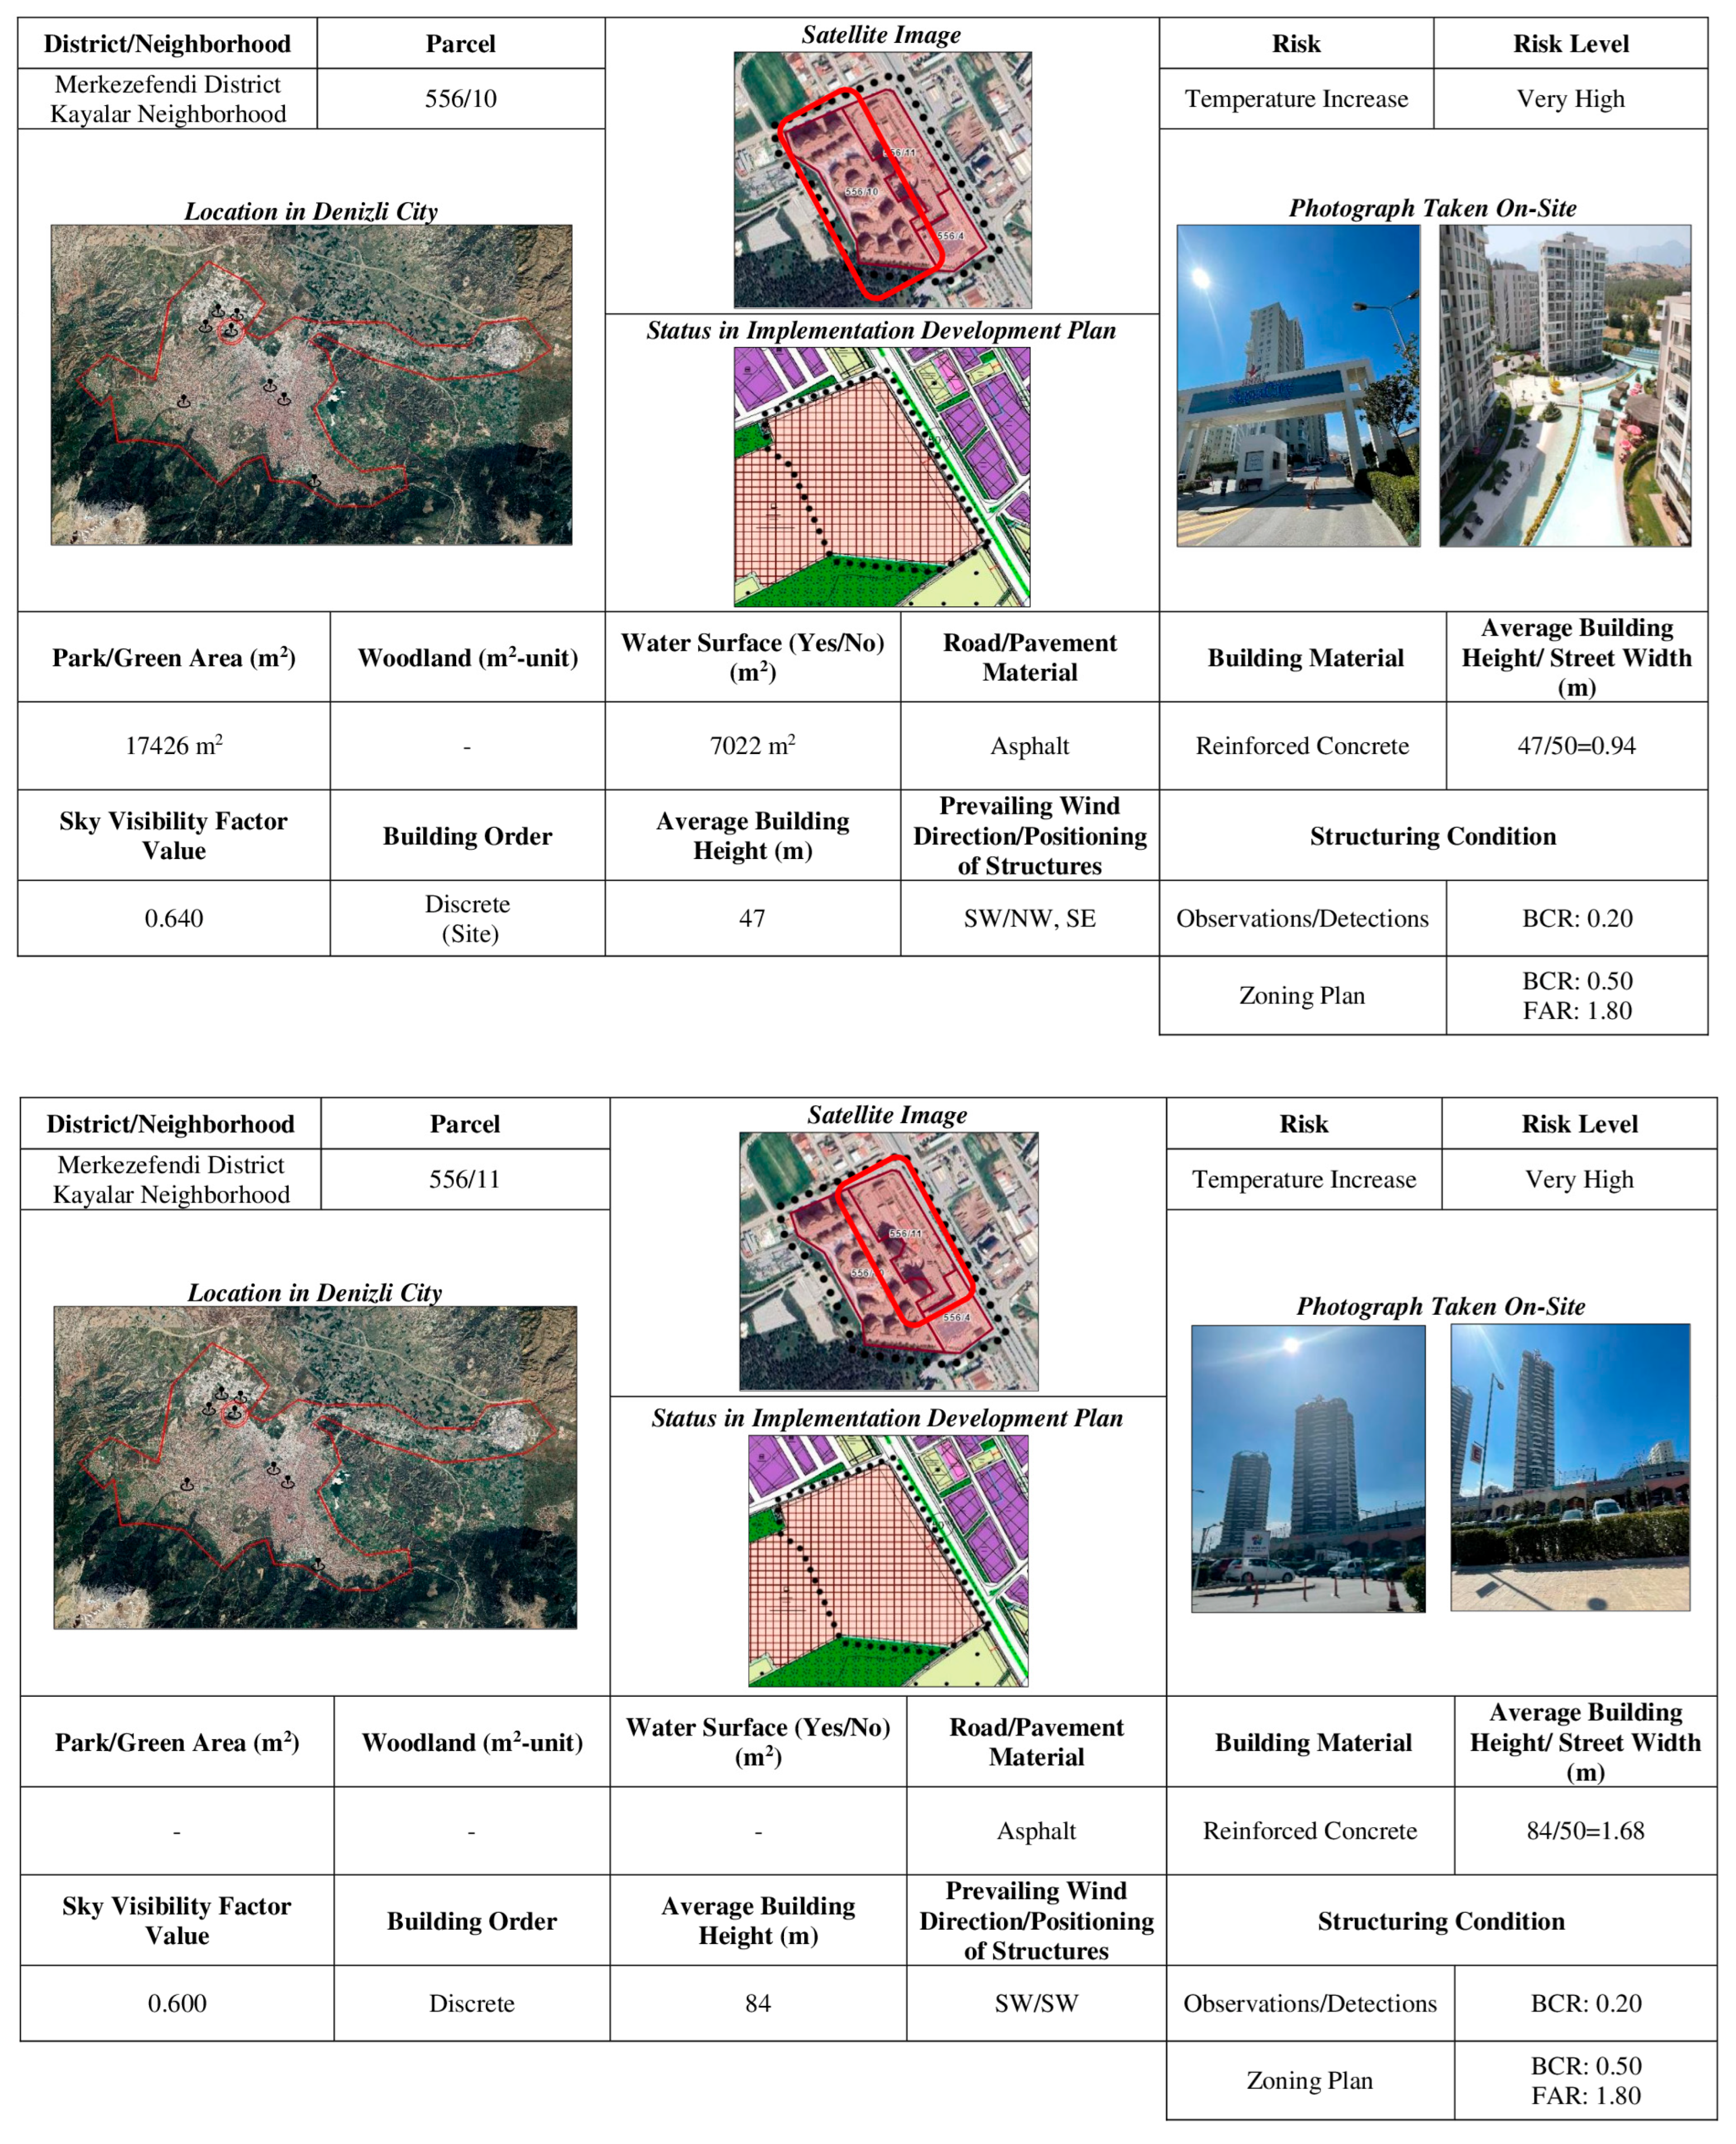
- Parking areas are only within the site and not evenly distributed;
- There are no large gaps in terms of wooded areas and number of trees;
- Artificial water surface;
- The use of impermeable materials including hard materials on roads and sidewalks;
- Albedo values between 0.10 and 0.35 with the use of reinforced concrete and brick as building materials;
- The average building height/street-width ratio varies between 0.13 and 1.68;
- SVF value ranged between 0.600 and 0.640;
- The settlement type is a housing estate and includes split-layout buildings;
- The average building height varies between 47 and 84 m. in the residential and shopping center and drops to 6.50 m. in the surrounding commercial area;
- The buildings are generally oriented northeast, perpendicular to the prevailing wind direction, and the Building Coverage Ratio (BCR) and Floor Area Ratio (FAR) values are higher than the surrounding buildings (Figure 8).
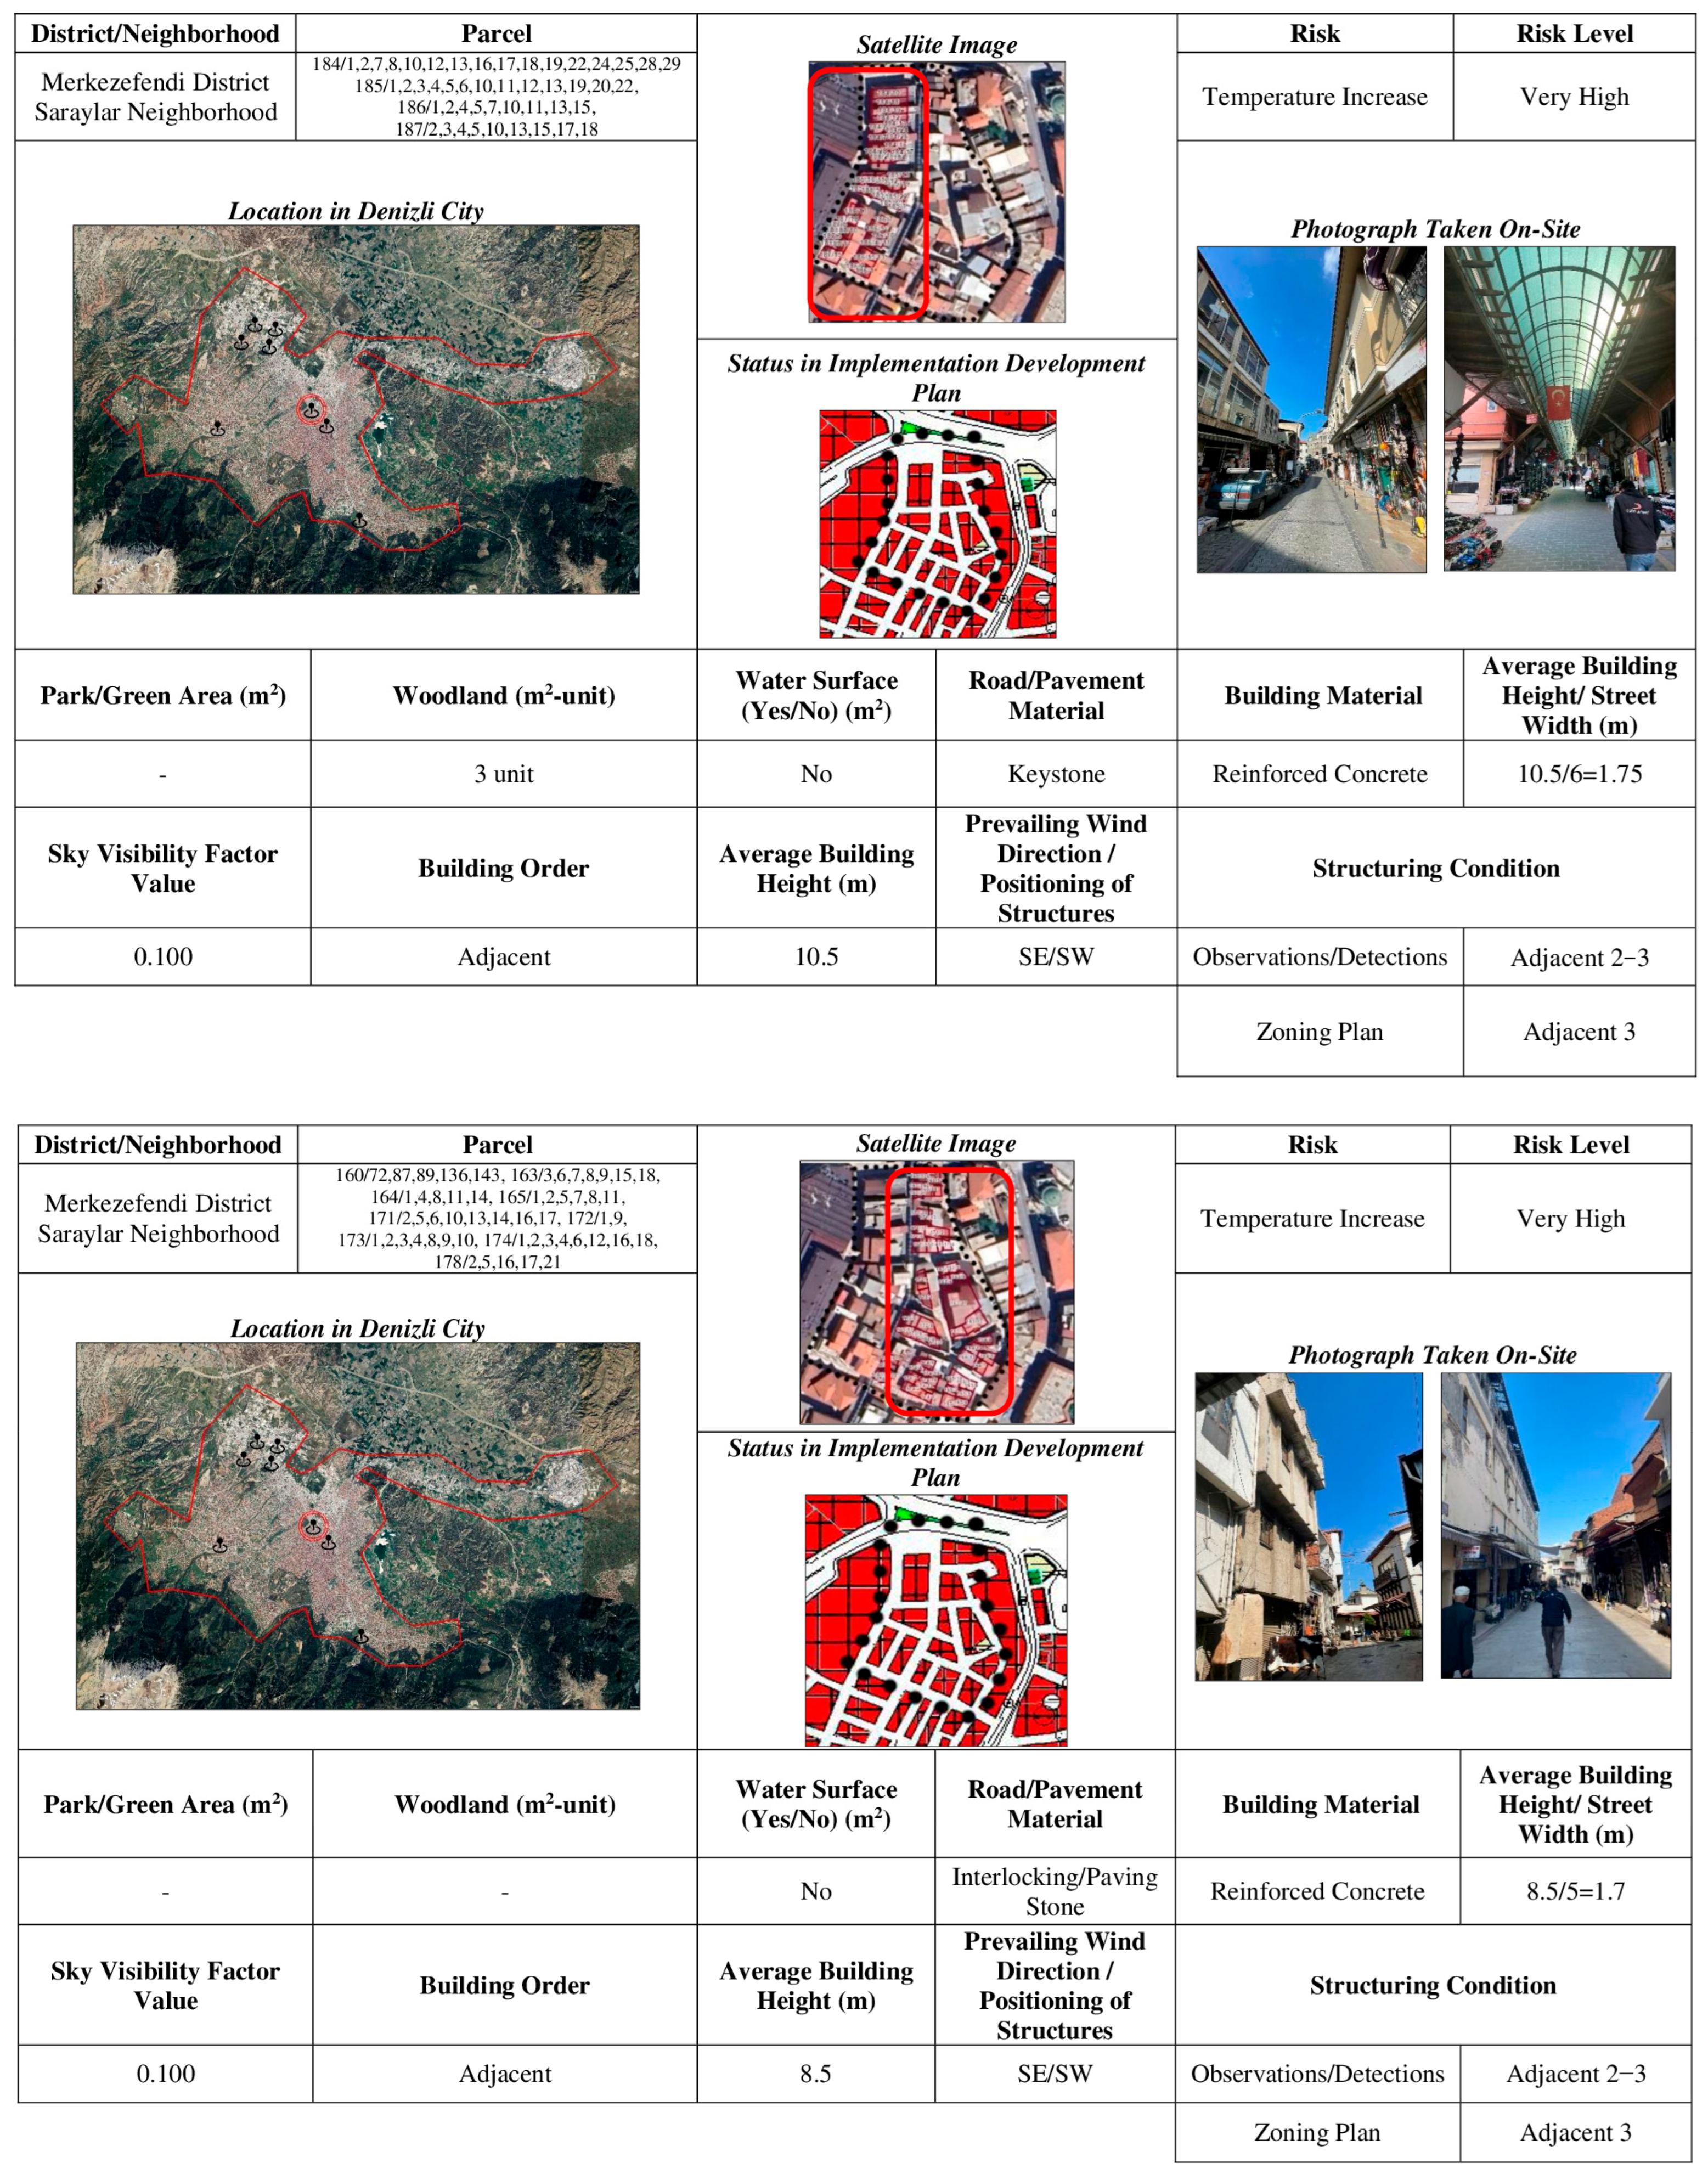
- There are no parks/green areas, and the number of trees is very low;
- That there is no natural or artificial water surface;
- The use of impermeable materials including hard materials on roads and sidewalks;
- With the use of reinforced concrete as a building material, albedo values remain between 0.10 and 0.35;
- The average building height/street-width ratio varies between 1.70 and 1.75;
- SVF value of 0.100;
- The type of construction includes adjoining commercial areas and the fact that it is covered causes the heat to remain inside;
- The average building height varies between 8.5 and 10.5 m;
- The buildings are generally oriented southwest and perpendicular to the prevailing wind direction;
- It has been determined that the construction conditions are largely in compliance with the zoning plan, but the adjacent buildings do not allow heat dissipation (Figure 9).
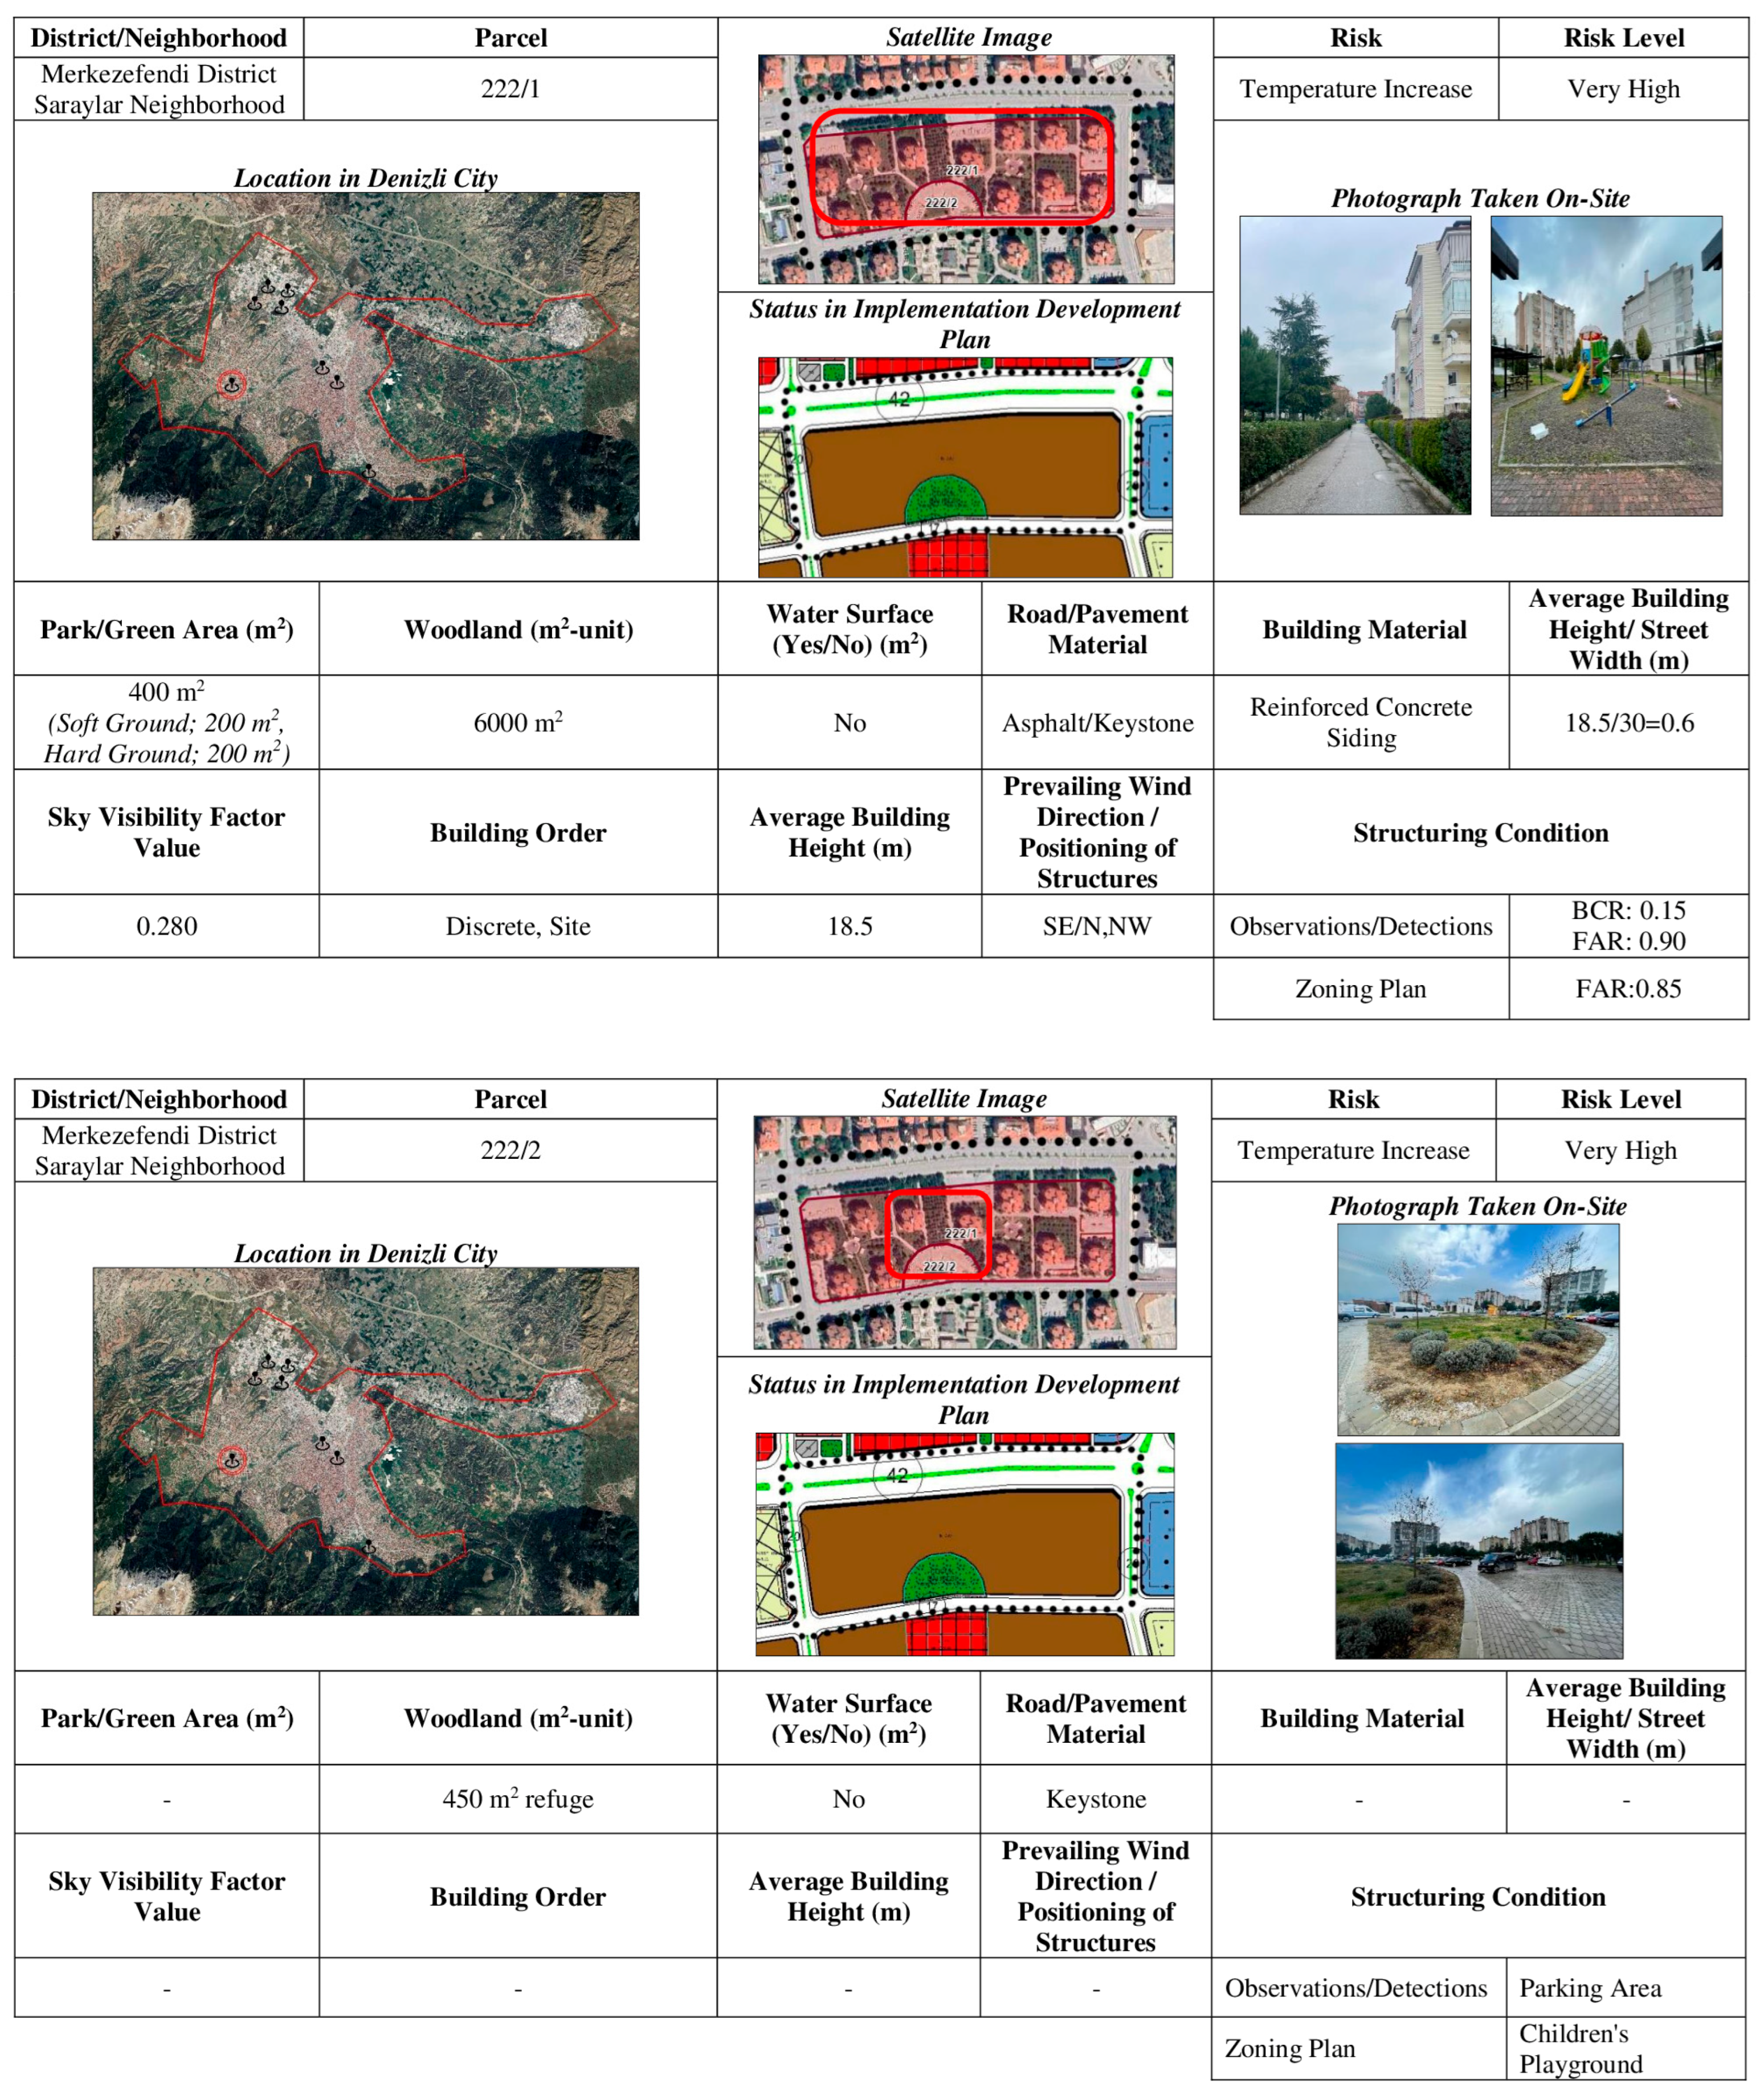
- Parking areas are homogeneously distributed in terms of soft and hard ground within the site;
- Large openings in terms of wooded areas and number of trees;
- That there is no natural or artificial water surface;
- The use of impermeable materials including hard materials on roads and sidewalks;
- With the use of reinforced concrete and siding as building materials, albedo values remain between 0.10 and 0.35 and 0.50 and 0.90;
- The average building height/street-width ratio is 0.60;
- SVF value was 0.280;
- The settlement type is a housing estate and includes split-layout buildings;
- The average building height is 18.5 m and buildings with different heights are located opposite each other;
- The buildings are generally oriented northwest and north, parallel to the prevailing wind direction;
- It was found that the BCR and FAR values were largely in compliance with the zoning plan, but the parcel planned as a children’s garden in the plan was used as a parking lot (Figure 10).
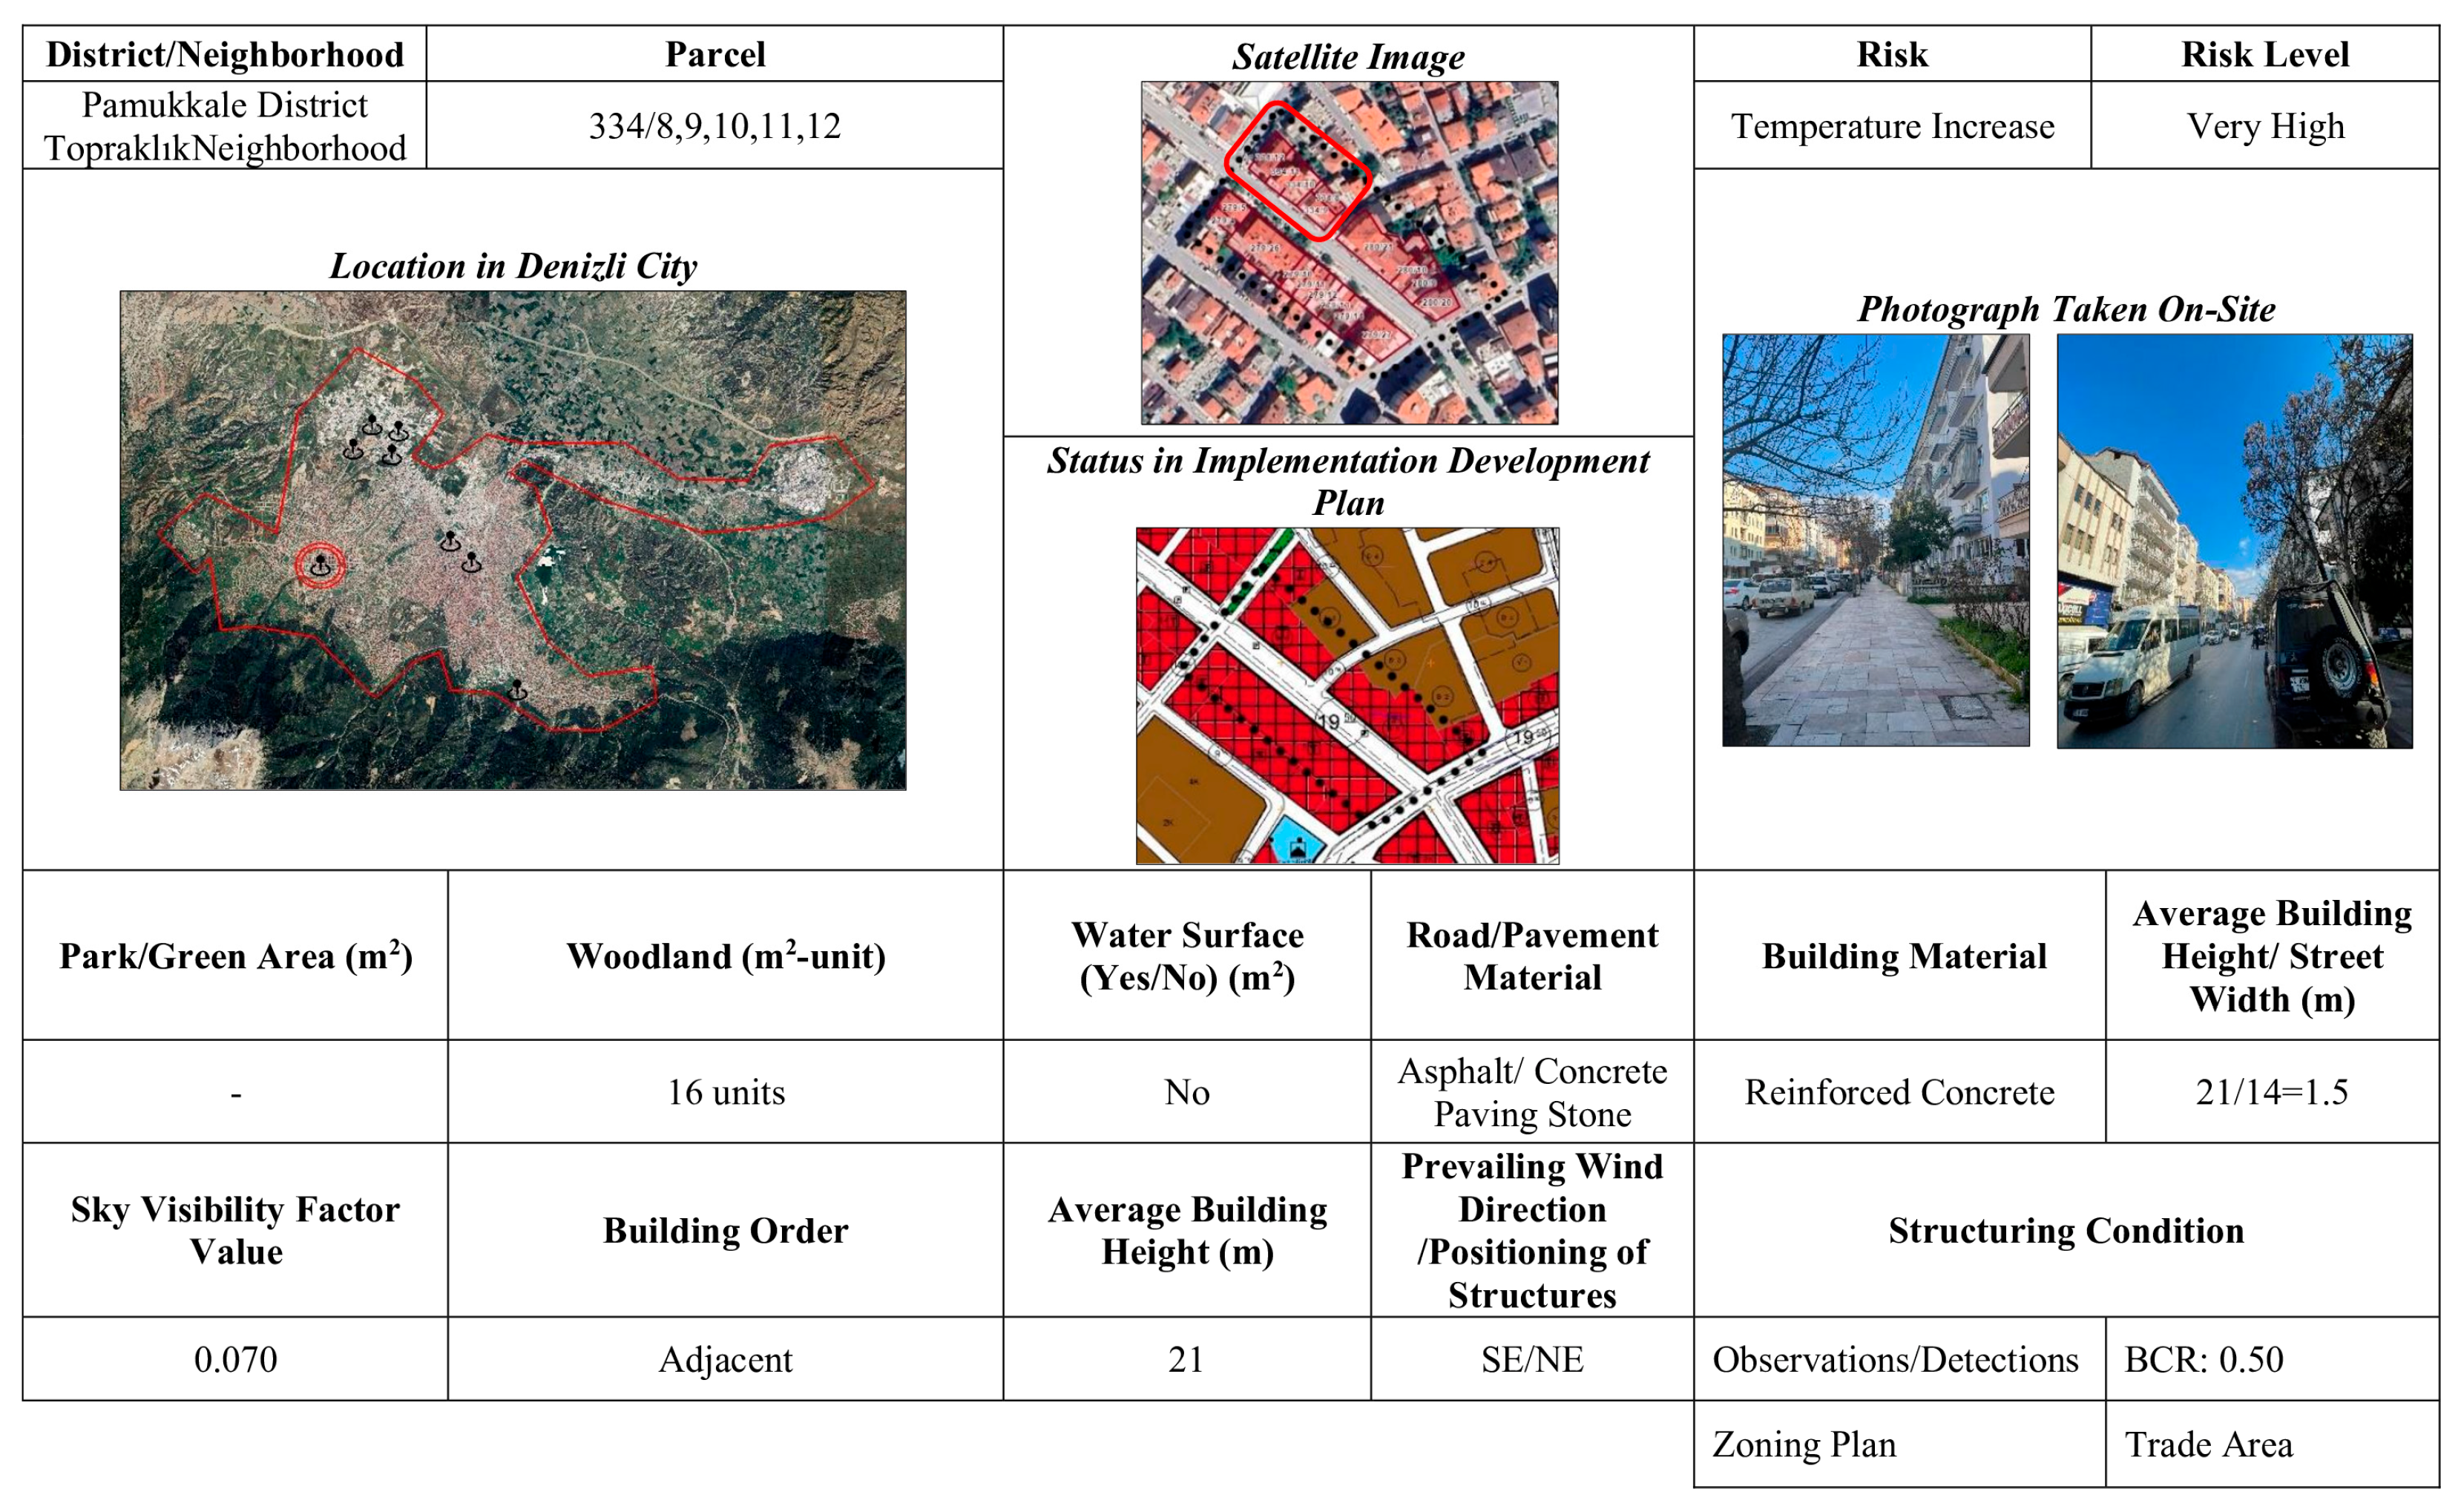
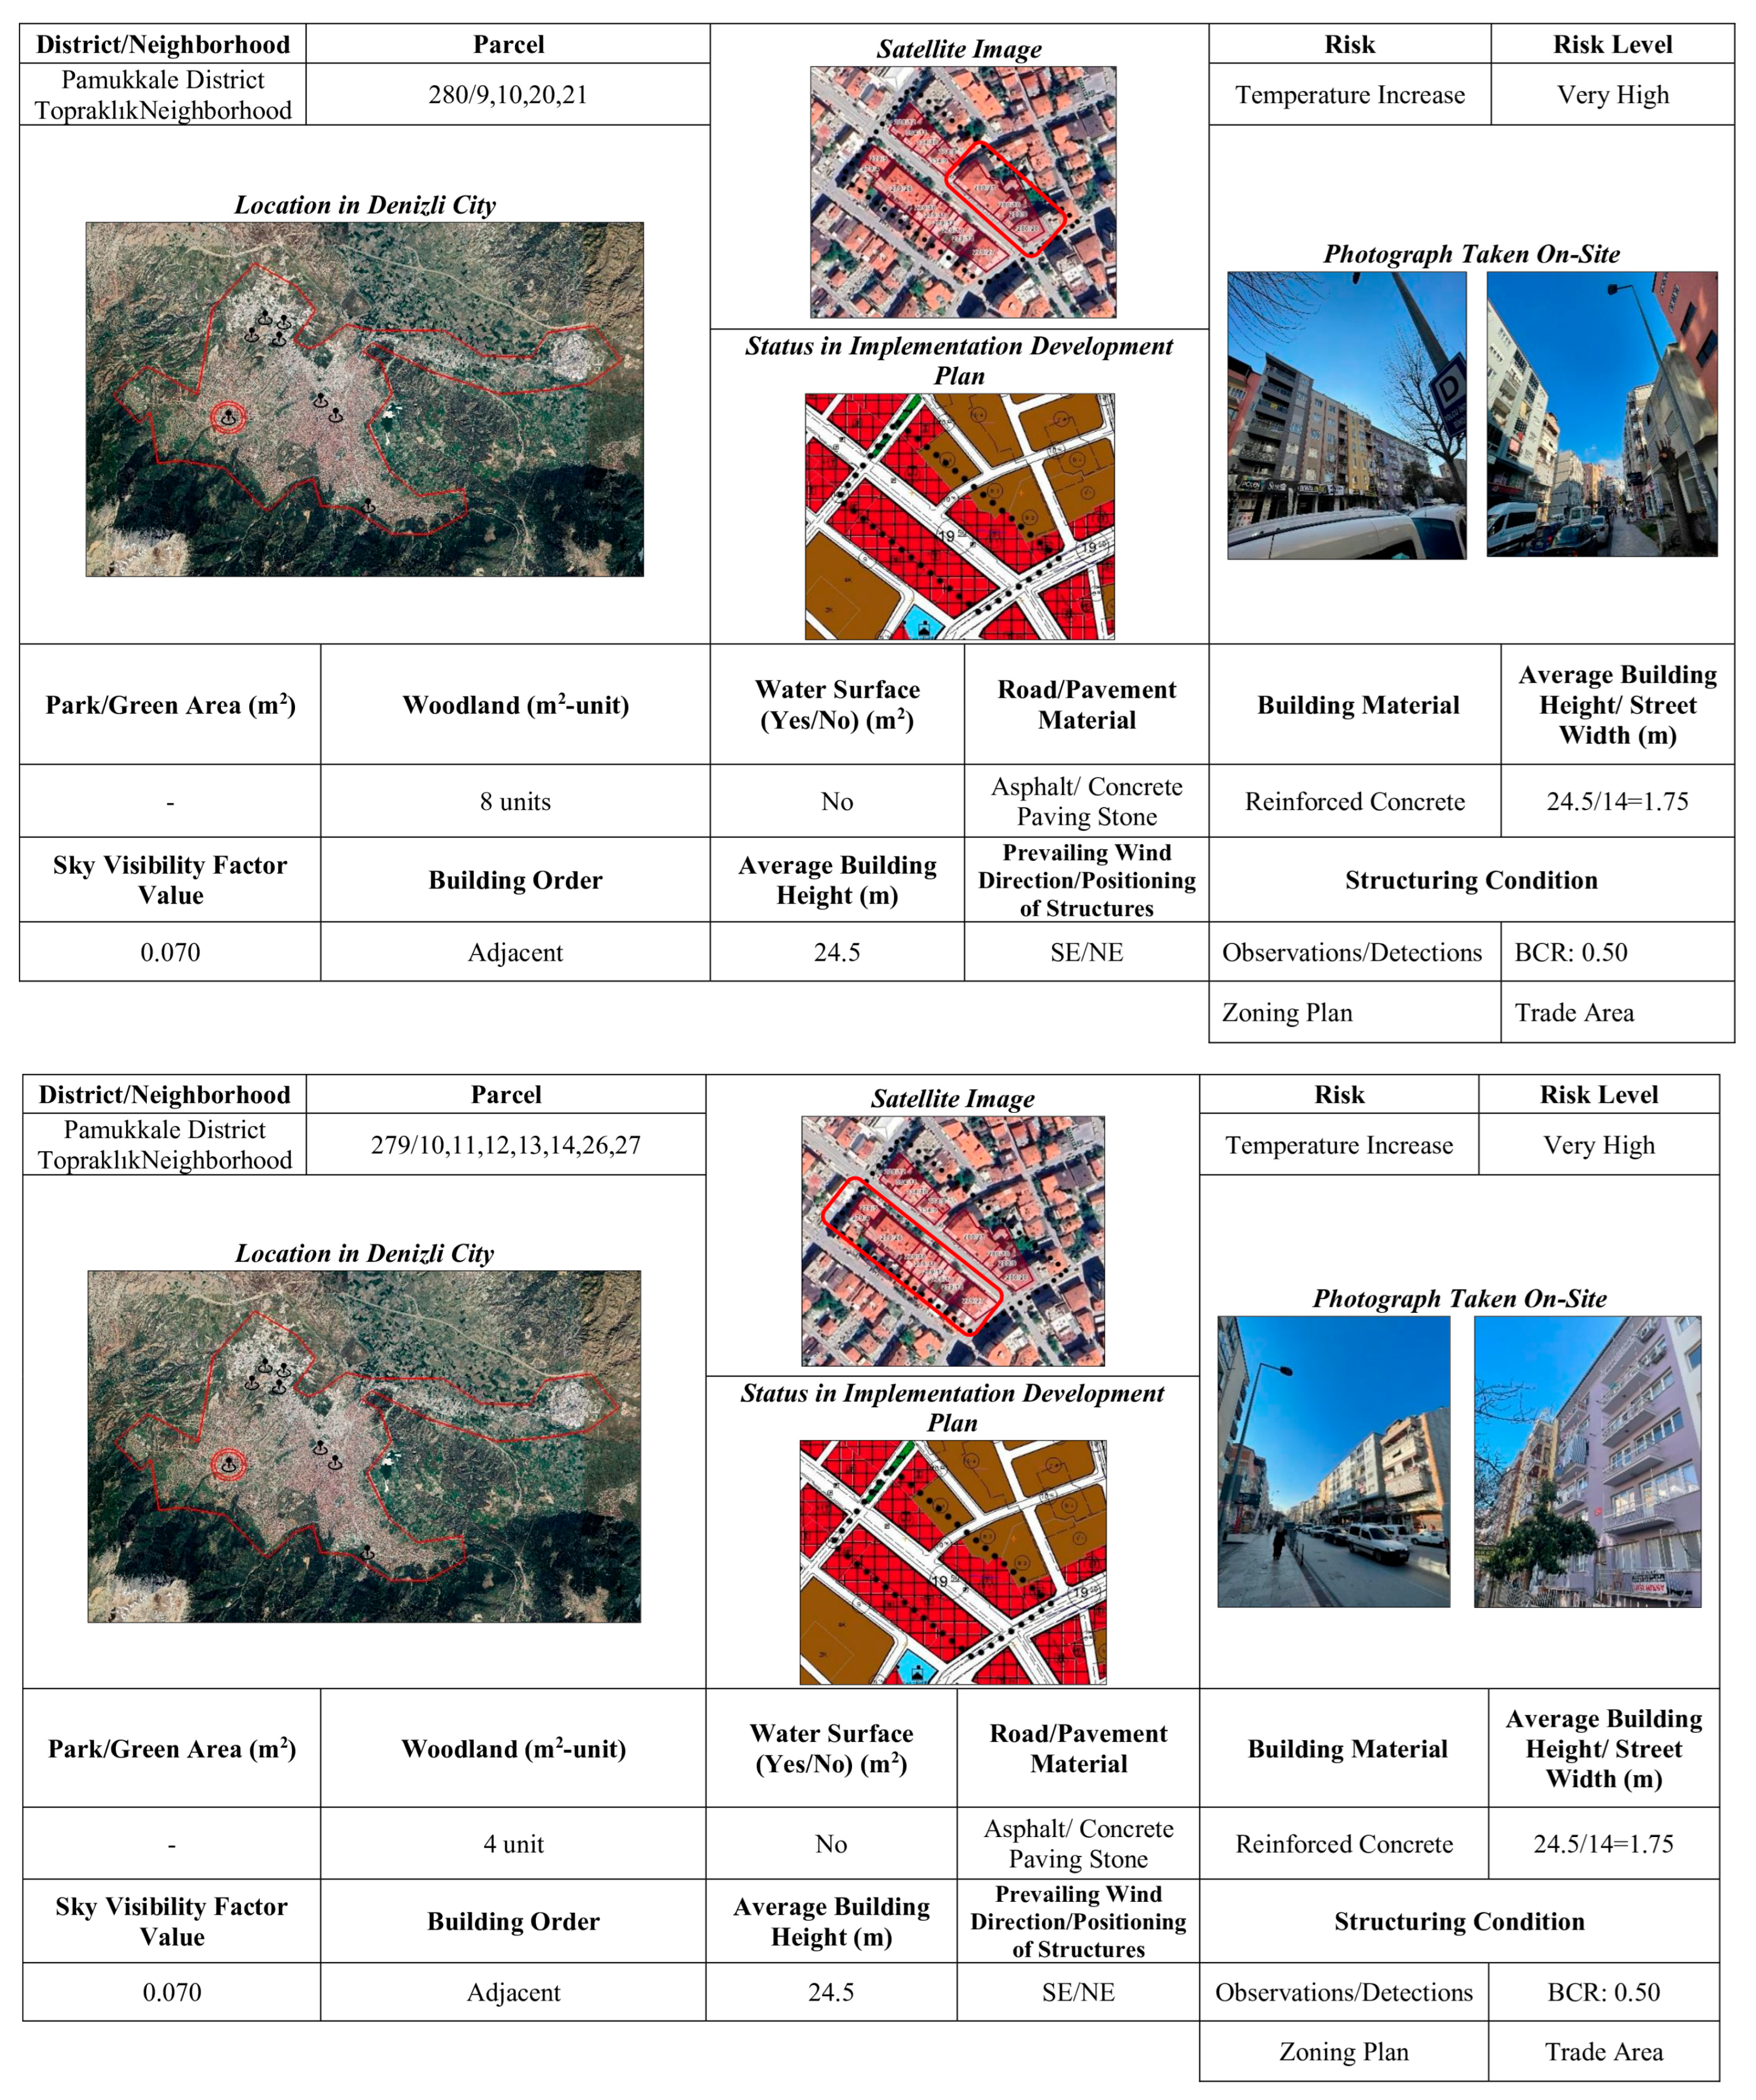
- Lack of parks/green areas;
- The cooling effect is not sufficient in terms of wooded area and number of trees;
- That there is no natural or artificial water surface;
- The use of impermeable materials including hard materials on roads and sidewalks;
- Albedo values remain in the range of 0.10–0.35 with reinforced concrete building material;
- The average building height/street-width ratio varies between 1.50 and 1.75;
- SVF value is 0.070;
- The construction type is adjoining order;
- The average building height varies between 21 and 24.5 m. and buildings with different heights are located opposite each other;
- The buildings are generally oriented northeast and perpendicular to the prevailing wind direction;
- BCR and FAR values are largely in line with the zoning plan, but the areas planned as commercial areas contain commercial + residential areas (Figure 11).
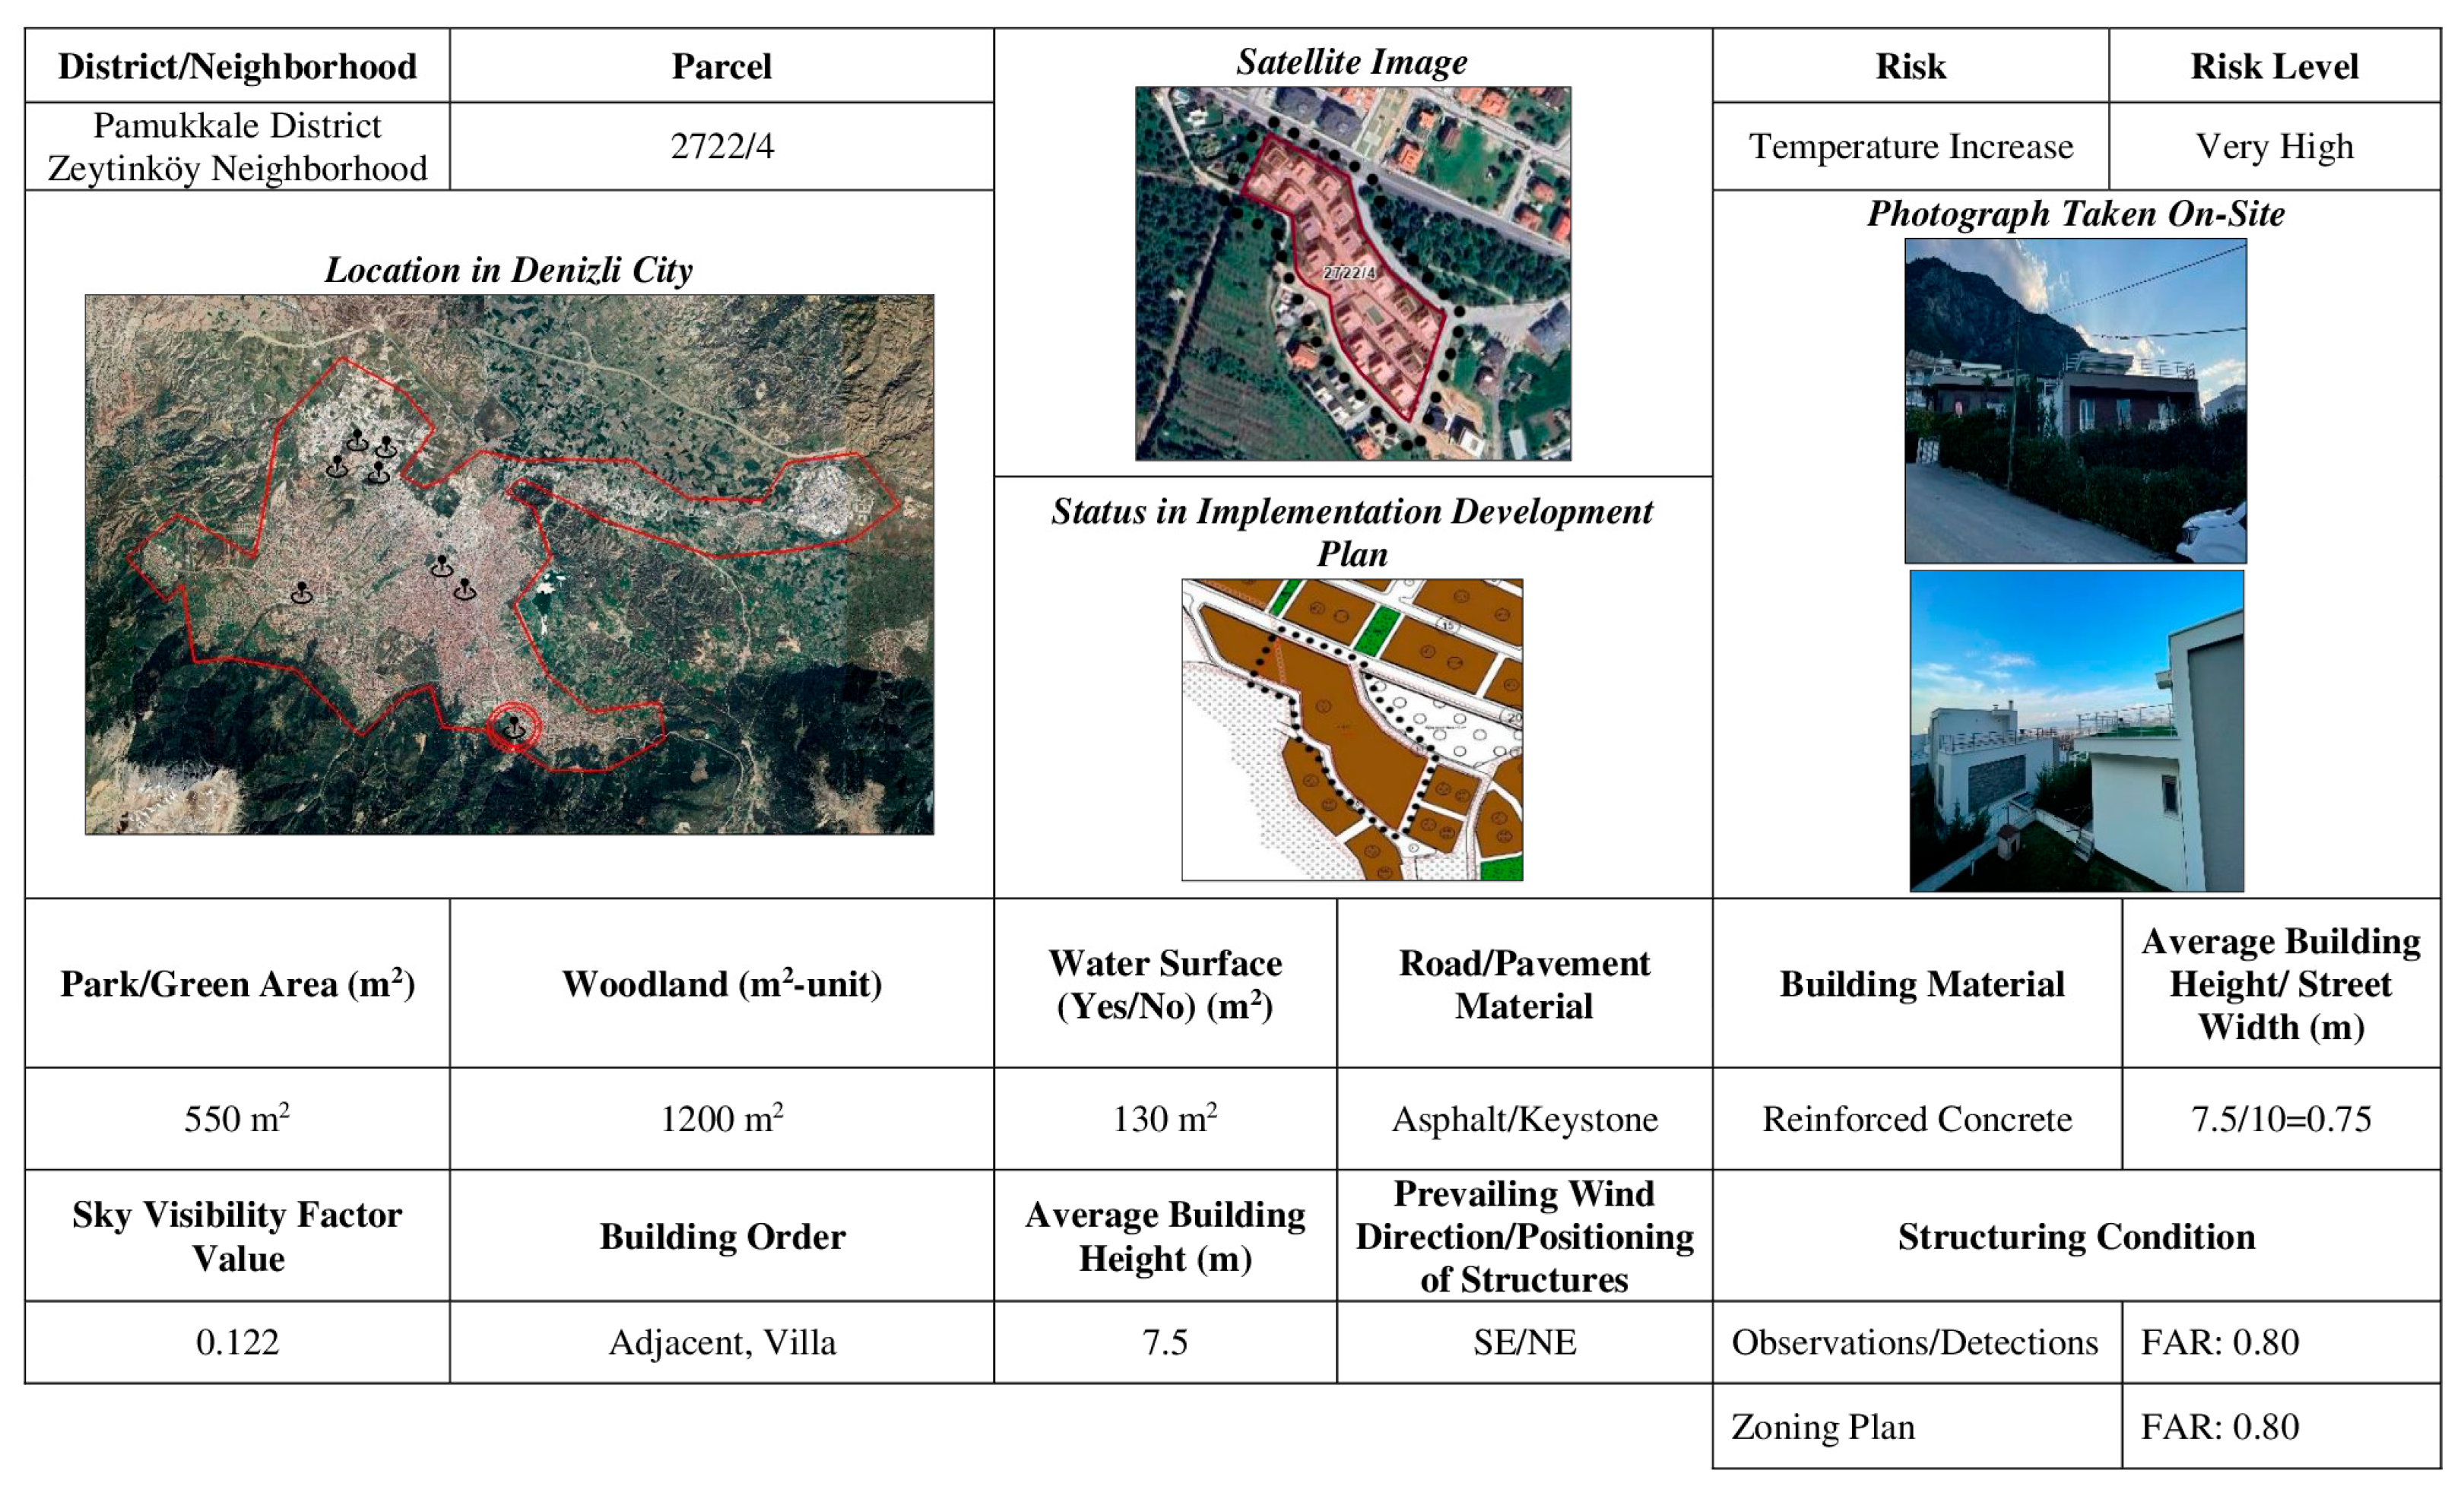
- 550 m2 parking area, where there are areas that will provide cooling effect in terms of wooded areas;
- There is an artificial water surface;
- The use of impermeable materials including hard materials on roads and sidewalks;
- Albedo values remain in the range of 0.10–0.35 with reinforced concrete building material;
- The average building height/street-width ratio is 0.75;
- The SVF value was 0.122;
- The type of construction is split-layout as villa type residences;
- The average building height is 7.5 m, but it has a decreasing effect on wind speed compared to the surrounding open spaces;
- The buildings are generally oriented northwest and parallel to the prevailing wind direction;
- It was determined that the BCR and FAR values are in compliance with the zoning plan to a great extent, but the lack of any construction in the vicinity increases the surface temperature (Figure 12).
4. Results
- In urban development areas, preference should be given to split-layout settlements in order to make the most use of Denizli’s hot-humid climate air flow;
- Consider the cooling effect in open and green space planning in Bozburun and Aktepe Neighborhood mass housing areas where urban transformation projects are ongoing.
- Determining a ratio in the plan notes within the scope of hard ground and wooded area in the industrial area located in Kayaköy and Bozburun Neighborhoods.
- The use of travertine, the local stone of the region, which has a permeable/porous structure, for flooring in open areas.
- Since the sunbathing direction of the city is in the east–west direction, the buildings should be located in this direction in an elongated form.
- Using light colors such as white with high reflectivity in accordance with Denizli climate on the facades of the buildings.
- Designs to reduce the formation of urban heat islands (permeable ground, reflective materials, tree planting, etc.) to the extent permitted by the uses of the backyards of adjacent buildings with revision plans and transformations in the city center.
- Increasing the amount of wooded areas along the road in the gardens of residences and public institutions in Saraylar, İlbade, and Gültepe Neighborhoods.
- Planning permeable infrastructure systems and increasing open and green areas in the areas between Kaleiçi, Bayramyeri and Hal.
- Use of permeable materials on the ground in Bayramyeri and Çınar squares.
- Designing walking and pedestrian paths and seating/rest areas with landscape elements that will provide sun in winter and shade in summer;
- Creating green space connections between neighboring parcels, designing horizontal and vertical green facades.
Author Contributions
Funding
Institutional Review Board Statement
Informed Consent Statement
Data Availability Statement
Conflicts of Interest
Abbreviations
| IPCC | The Intergovernmental Panel on Climate Change |
| AR | Assessment Report |
| BCR | Building Coverage Ratio |
| FAR | Floor Area Ratio |
| NDVI | Normalized Vegetation Difference Index |
| LST | Land Surface Temperature |
| GST | Ground Surface Temperature |
| TÜİK | Türkiye Statical Institute |
| USGS | United States Geological Survey |
| TOKI | Housing and Public Partnership Administration |
| TKGM | General Directorate of Land Registry and Cadastre |
References
- Masson-Delmotte, V.; Zhai, P.; Pörtner, H.-O.; Roberts, D.C.; Skea, J.; Shukla, P.R.; Pirani, A. Global Warming of 1.5 °C; Intergovernmental Panel on Climate Change: New York, NY, USA, 2017. [Google Scholar]
- Denizli Valiliği (Denizli Governorship). Denizli Provincial Disaster Risk Reduction Planı (Denizli İl Afet Risk Azaltma Planı). 2021. Available online: https://www.afad.gov.tr/kurumlar/afad.gov.tr/Mevzuat/Kilavuzlar/IRAP-KILAVUZ_tum_v7.pdf (accessed on 5 June 2025).
- Cuce, P.M.; Cuce, E.; Santamouris, M. Towards Sustainable and Climate-Resilient Cities: Mitigating Urban Heat Islands through Green Infrastructure. Sustainability 2025, 17, 1303. [Google Scholar] [CrossRef]
- Şekertekin, A.; Marangoz, A.M. Zonguldak Metropolitan Alanındaki Arazi Kullanımı Arazi Örtüsünün Yer Yüzey Sıcaklığına Etkisi. Geomatik 2019, 4, 101–111. [Google Scholar] [CrossRef]
- Atak, B.K.; Tonyaloğlu, E.E. Alan Kullanım/Arazi Örtüsü ve Bitki Örtüsündeki Değişimin Arazi Yüzey Sıcaklığına Etkisinin Değerlendirilmesi: Aydın Ili Örneği. Turk. J. For. 2020, 21, 489–497. [Google Scholar]
- Ünal, M. Kentsel Yüzey Isı Adalarının Belirlenmesinde Yer Yüzey Sıcaklık Verilerinin Kullanımı. Avrupa. Bilim. Teknol. Derg. 2022, 33, 213–222. [Google Scholar] [CrossRef]
- Ardahanlıoğlu, Z.R. Kayaköy-Hisarönü (Fethiye) ve Yakın Çevresinde Arazi Kullanımı/Arazi Örtüsü Ile Arazi Yüzey Sıcaklığının Değerlendirilmesi Üzerine Bir Araştırma. Acad. Soc. Resour. J. 2024, 8, 4013–4022. [Google Scholar] [CrossRef]
- Canan, F. Kent Geometrisine Bağlı Olarak Kentsel Isı Adası Etkisinin Belirlenmesi: Konya Örneği. Çukurova Üniversitesi Mühendislik-Mimarlık Fakültesi Derg. 2017, 32, 69–80. [Google Scholar] [CrossRef]
- Ekinci, B. Kentsel Alanlarda Oluşan Isı Adası Etkisinin Kentsel Tasarım Yöntemleri İle Azaltılması: Aksaray Meydanı Örneği. Master’s Thesis, İstanbul Technical University, Istanbul, Turkey, 2016. [Google Scholar]
- Canan, F.; Geyikli, H.B. Kentsel Isı Adası Etkisinin Farklı Dokusal Özelliklerde Karşılaştırmalı Analizi: Konya Kenti Örneği. In Proceedings of the TMMOB Mimarlar Odası Ankara Şubesi 5: Ulusal Yapı Kongresi ve Sergisi, Online, 9–11 September 2021; pp. 525–537. [Google Scholar]
- Yin, C.; Yuan, M.; Lu, Y.; Huang, Y.; Liu, Y. Effects of Urban Form on the Urban Heat Island Effect Based on Spatial Regression Model. Sci. Total Environ. 2018, 634, 696–704. [Google Scholar] [CrossRef] [PubMed]
- Guo, A.; Yang, J.; Xiao, X.; Xia, J.; Jin, C.; Li, X. Influences of Urban Spatial Form on Urban Heat Island Effects at the Community Level in China. Sustain. Cities Soc. 2020, 53, 101972. [Google Scholar] [CrossRef]
- Liu, C.; Lu, S.; Tian, J.; Yin, L.; Wang, L.; Zheng, W. Research Overview on Urban Heat Islands Driven by Computational Intelligence. Land 2024, 13, 2176. [Google Scholar] [CrossRef]
- Yılmaz, E.; Özcanlı, M. Van Şehir Gelişimi Ile Şehir Isı Adası Arasındaki İlişkiler ve Sıcaklık Değişimleri. Van İnsani Sos. Bilim. Derg. 2021, 1, 40–60. [Google Scholar]
- Çolak, K.; Çetinkaya, Ş.B.; Gençel, Z. Kentsel Yayılma Tipolojisinin Kentsel Isı Adası Etkisi Üzerine Etkisi: İki Akdeniz Kenti Karşılaştırması. In Proceedings of the Türkiye Kentsel Morfoloji Ağı, Konya, Turkey, 31 May–2 June 2023; pp. 527–537. [Google Scholar]
- Saka, B.N.; Atmaca, İ. Uzaktan Algılama Yöntemleri Ile Kentsel Yüzey Sıcaklıklarının Haritalanması, Yozgat Kenti Örneği. Bozok. J. Eng. Archit. 2023, 2, 38–43. [Google Scholar]
- Gerçek, D.; Bayraktar, N.T. Kentsel Isı Adası Etkisinin Uzaktan Algılama İle Tespiti ve Değerlendirilmesi: İzmit Kenti Örneği. In Proceedings of the 5. Uzak. Algılama-CBS Sempozyumu (UZAL-CBS), Istanbul, Turkey, 14–17 October 2014. [Google Scholar]
- Yılmaz, D.; Öztürk, S. Kentsel Isı Adası Etkisinin Sistematik Bir İncelemesi: Kentsel Form, Peyzaj ve Planlama Stratejileri. Çevre Şehir. İklim. Derg. 2023, 2, 302–323. [Google Scholar]
- Alkan, A.; Adıgüzel, F.; Kaya, E. Batman Kentinde Kentsel Isınmanın Azaltılmasında Yeşil Alanların Önemi. Coğrafya Derg. 2017, 34, 62–76. [Google Scholar]
- Lopes, H.S.; Vidal, D.G.; Cherif, N.; Silva, L.; Remoaldo, P.C. Green Infrastructure and Its Influence on Urban Heat Island, Heat Risk, and Air Pollution: A Case Study of Porto (Portugal). J. Environ. Manag. 2025, 376, 124446. [Google Scholar] [CrossRef] [PubMed]
- Dimitrov, S.; Iliev, M.; Borisova, B.; Semerdzhieva, L.; Petrov, S. A Methodological Framework for High-Resolution Surface Urban Heat Island Mapping: Integration of UAS Remote Sensing, GIS, and the Local Climate Zoning Concept. Remote Sens. 2024, 16, 4007. [Google Scholar] [CrossRef]
- Yüksel, A.T.; Hepcan, Ç.C. Kentsel Yüzey Sıcaklığı ve Mavi-Yeşil Altyapı Ilişkisi: Karşıyaka Örneği. Adnan Menderes Üniversitesi Ziraat Fakültesi Derg. 2023, 20, 91–98. [Google Scholar] [CrossRef]
- He, J.F.; Liu, J.Y.; Zhuang, D.F.; Zhang, W.; Liu, M.L. Assessing the Effect of Land Use/Land Cover Change on the Change of Urban Heat Island Intensity. Theor. Appl. Climatol. 2007, 90, 217–226. [Google Scholar] [CrossRef]
- Özkök, M.K.; Tok, E.; Gündoğdu, H.M.; Demir, G. Arazi Yüzey Sıcaklığı Farklılaşmalarının Kentsel Gelişim ve Planlama Süreçleri Açısından Uzaktan Algılama Verileri Ile Değerlendirilmesi: Çorlu/Çerkezköy/Ergene/Kapaklı Alt Bölgesi Örneği. Toprak Bilim Bitki Besleme Derg. 2017, 5, 69–79. [Google Scholar]
- Orhan, O. Mersin Ilindeki Kentsel Büyümenin Yer Yüzey Sıcaklığı Üzerine Etkisinin Araştırılması. Geomatik 2021, 6, 69–76. [Google Scholar] [CrossRef]
- Ünsal, Ö.; Avci, V. Yer Yüzeyi Sıcaklıkları Ile Kentsel Arazi Kullanımı Arasındaki Ilişkinin Belirlenmesi: Şanlıurfa, Diyarbakır ve Mardin Örneği. Türk Uzak. Algılama CBS Derg. 2023, 4, 125–150. [Google Scholar]
- Guo, F.; Hertel, D.; Schlink, U.; Hu, D.; Qian, J.; Wu, W. Remote Sensing-Based Attribution of Urban Heat Islands to the Drivers of Heat. IEEE Trans. Geosci. Remote Sens. 2024, 62, 5002312. [Google Scholar] [CrossRef]
- TÜİK (Türkiye Statistical Institute). Türkiye Address Based Population Registration System (Türkiye Adrese Dayalı Nüfus Kayıt Sistemi-Turkish); Türkiye Statistical Institute: Ankara, Turkey, 2025.
- Denizli Metropolitan Municipality. Department of Survey and Projects Denizli Climate Change Action Plan (Denizli İklim Değişikliği Eylem Planı); Denizli Metropolitan Municipality: Denizli, Turkey, 2016.
- Qin, Z.; Karnieli, A.; Berliner, P. A Mono-Window Algorithm for Retrieving Land Surface Temperature from Landsat TM Data and Its Application to the Israel-Egypt Border Region. Int. J. Remote Sens. 2001, 22, 3719–3746. [Google Scholar] [CrossRef]
- Akyürek, Ö. Termal Uzaktan Algılama Görüntüleri Ile Yüzey Sıcaklıklarının Belirlenmesi: Kocaeli Örneği. Doğal Afetler Çevre Derg. 2020, 6, 377–390. [Google Scholar] [CrossRef]
- Çalhan, E.; Özelkan, E. Şehirleşmenin Yer Yüzeyi Sıcaklıklarına Etkisinin İncelenmesi: Denizli İli Kent Merkezi Örneği. J. Res. Atmos. Sci. 2022, 4, 20–30. [Google Scholar]
- Giannini, M.B.; Belfiore, O.R.; Parente, C.; Santamaria, R. Land Surface Temperature from Landsat 5 TM Images: Comparison of Different Methods Using Airborne Thermal Data. J. Eng. Sci. Technol. Rev. 2015, 8, 83–90. [Google Scholar] [CrossRef]
- Çilek, M.Ü. Kent Kanyon Geometrilerinin Yer Yüzeyi Sıcaklığı Üzerindeki Etkisi: Kurtuluş Mahallesi Örneği. Türk Uzak. Algılama CBS Derg. 2022, 3, 98–111. [Google Scholar]
- Mercan, Ç. Yer Yüzey Sıcaklığının Termal Uzaktan Algılama Görüntüleri Ile Araştırılması: Muş Ili Örneği. Türkiye Uzak. Algılama Derg. 2020, 2, 42–49. [Google Scholar]
- Zhang, J.; Wang, Y.; Li, Y. A C++ Program for Retrieving Land Surface Temperature from the Data of Landsat TM/ETM+ Band6. Comput. Geosci. 2006, 32, 1796–1805. [Google Scholar] [CrossRef]
- Polat, N. Mardin Ilinde Uzun Yıllar Yer Yüzey Sıcaklığı Değişiminin Incelenmesi. Türkiye Uzak. Algılama Derg. 2020, 2, 10–15. [Google Scholar]
- Artis, D.A.; Carnahan, W.H. Survey of Emissivity Variability in Thermography of Urban Areas. Remote Sens. Environ. 1982, 12, 313–329. [Google Scholar] [CrossRef]
- Qin, Y.; Luo, J.; Chen, Z.; Mei, G.; Yan, L.-E. Measuring the Albedo of Limited-Extent Targets without the Aid of Known-Albedo Masks. Sol. Energy 2018, 171, 971–976. [Google Scholar] [CrossRef]
- Oke, T.R. Street Design and Urban Canopy Layer Climate. Energy Build. 1988, 11, 103–113. [Google Scholar] [CrossRef]
- Gülten, A.; Aksoy, U.T. Gökyüzü Görüş Faktörü ve Bina Yüzey Sıcaklıklarına Bağlı Olarak Cadde Geometrisi-Güneş Işınımı İlişkisi. Firat Univ. J. Eng. Sci. 2010, 22, 75–92. [Google Scholar]
- Norton, B.A.; Coutts, A.M.; Livesley, S.J.; Harris, R.J.; Hunter, A.M.; Williams, N.S. Planning for Cooler Cities: A Framework to Prioritise Green Infrastructure to Mitigate High Temperatures in Urban Landscapes. Landsc. Urban Plan. 2015, 134, 127–138. [Google Scholar] [CrossRef]
- Kleerekoper, L.; Van Esch, M.; Salcedo, T.B. How to Make a City Climate-Proof, Addressing the Urban Heat Island Effect. Resour. Conserv. Recycl. 2012, 64, 30–38. [Google Scholar] [CrossRef]
- Inard, C.; Groleau, D.; Musy, M. Energy Balance Study of Water Ponds and Its Influence on Building Energy Consumption. Build. Serv. Eng. Res. Technol. 2004, 25, 171–182. [Google Scholar] [CrossRef]
- Pisello, A.L. State of the Art on the Development of Cool Coatings for Buildings and Cities. Sol. Energy 2017, 144, 660–680. [Google Scholar] [CrossRef]
- Bhargava, A.; Lakmini, S.; Bhargava, S. Urban Heat Island Effect: It’s Relevance in Urban Planning. J. Biodivers. Endanger. Species 2017, 5, 2020. [Google Scholar]
- Xiaomin, X.; Zhen, H.; Jiasong, W. The Impact of Urban Street Layout on Local Atmospheric Environment. Build. Environ. 2006, 41, 1352–1363. [Google Scholar] [CrossRef]
- Yamamoto, M.K.; Nishi, N.; Horinouchi, T.; Niwano, M.; Fukao, S. Vertical Wind Observation in the Tropical Upper Troposphere by VHF Wind Profiler: A Case Study. Radio Sci. 2007, 42, 1–14. [Google Scholar] [CrossRef]
- Çamaş, N.Ç. Kentsel Morfoloji ve Mikroiklim Ilişkisinin Rüzgar Temelinde Incelenmesi: Karşıyaka (İzmir) Örneği. Master’s Thesis, Dokuz Eylul Universitesi (Turkey), Izmir, Turkey, 2023. [Google Scholar]


| J | F | M | A | M | J | J | A | S | O | N | D |
|---|---|---|---|---|---|---|---|---|---|---|---|
| 5.9 | 7.3 | 10.2 | 14.8 | 19.8 | 24.5 | 27.6 | 27.2 | 22.9 | 17.1 | 11.5 | 7.4 |
| Landsat 8 Satellite Images | ||
|---|---|---|
| Date | 1 August 2012 | 1 August 2022 |
| Time | 08.42 | 08.40 |
| Wrs_Path | 179 | 179 |
| Wrs_Row | 34 | 34 |
| Cloud Cover | 1.17 | 0.80 |
| Parameter | Unit | Reference Value | Effect on Temperature | Conclusion | Heat Island Effect |
|---|---|---|---|---|---|
| Park/Green Space | m2 | 1500 m2 park | 1.5 °C reduction | Park: 240 m2 | Increase |
| Wooded Area | m2 | 100 m2 wooded area | 1.5 °C reduction | 5550 m2 | Decrease |
| unit | 1 tree (10 m diameter) | 1–1.5 °C reduction | 110 units | Decrease | |
| Water Surface | m2 | 30–35 m water surface | 1–3 °C reduction | No | Increase |
| Road Material | Permeable/Impermeable | Disperses heat/ warehouses | Impermeable | Increase | |
| Pavement Material | Permeable/Impermeable | Disperses heat/ warehouses | Impermeable | Increase | |
| Building Material | Albedo | 0–1 | Decreases as it approaches 1 | 0.10–0.35 | Increase |
| Average BH/SW | m | 0–0.5 | Decreases as it approaches 0.5 | 0.86–1.92 m | Increase |
| Sky Vision Factor | SVF | 0–1 | Decreases as it approaches 1 | 0.08–0.49 | Increase |
| Building Order | Adjacent | - | Stores heat | - | |
| Block | - | Stores heat | - | ||
| Discrete | - | Disperses heat | Discrete | Decrease | |
| Average Building Height | m | <10 m 10–20 m | Increases 1 °C | 19.2 m | Increase |
| 20–30 m >30 m | Increases 3 °C | 23.3 m | Increase | ||
| Prevailing Wind Direction | SE | Parallel | Stores heat | NW, N | Increase |
| Upright | Disperses heat | - | |||
| Structuring Condition | BCR | Stores heat | - | ||
| FAR | Disperses heat | FAR: 1.40 | Decrease |
| Parameter | Unit | Reference Value | Effect on Temperature | Conclusion | Heat Island Effect |
|---|---|---|---|---|---|
| Park/Green Space | m2 | 1500 m2 park | 1.5 °C reduction | Park: 900 m2 | Increase |
| Wooded Area | m2 | 100 m2 wooded area | 1.5 °C reduction | 7850 m2 | Decrease |
| unit | 1 tree (10 m diameter) | 1–1.5 °C reduction | 45 units | Decrease | |
| Water Surface | m2 | 30–35 m water surface | 1–3 °C reduction | No | Increase |
| Road Material | Permeable/Impermeable | Disperses heat/ warehouses | Impermeable | Increase | |
| Pavement Material | Permeable/Impermeable | Disperses heat/ warehouses | Impermeable | Increase | |
| Building Material | Albedo | 0–1 | Decreases as it approaches 1 | 0.10–0.35 | Increase |
| Average BH/SW | m | 0–0.5 | Decreases as it approaches 0.5 | 0.5 m | Decrease |
| Sky Vision Factor | SVF | 0–1 | Decreases as it approaches 1 | 0.240–0.290 | Increase |
| Building Order | Adjacent | - | Stores heat | - | |
| Block | - | Stores heat | - | ||
| Discrete | - | Disperses heat | Discrete | Decrease | |
| Average Building Height | m | <10 m 10–20 m | Increases 1 °C | 20 m | Increase |
| 20–30 m >30 m | Increases 3 °C | 21.5 m | Increase | ||
| Prevailing Wind Direction | SE | Parallel | Stores heat | NW | Increase |
| Upright | Disperses heat | - | |||
| Structuring Condition | BCR | Stores heat | - | ||
| FAR | Disperses heat | FAR:1.40 | Decrease |
| Parameter | Unit | Reference Value | Effect on Temperature | Conclusion | Heat Island Effect |
|---|---|---|---|---|---|
| Park/Green Space | m2 | 1500 m2 park | 1.5 °C reduction | - | Increase |
| Wooded Area | m2 | 100 m2 wooded area | 1.5 °C reduction | - | Increase |
| unit | 1 tree (10 m diameter) | 1–1.5 °C reduction | - | Increase | |
| Water Surface | m2 | 30–35 m water surface | 1–3 °C reduction | No | Increase |
| Road Material | Permeable/Impermeable | Disperses heat/ warehouses | Impermeable | Increase | |
| Pavement Material | Permeable/Impermeable | Disperses heat/ warehouses | Impermeable | Increase | |
| Building Material | Albedo | 0–1 | Decreases as it approaches 1 | 0.10–0.35 | Increase |
| Average BH/SW | m | 0–0.5 | Decreases as it approaches 0.5 | 0.40–0.52 m | Increase |
| Sky Vision Factor | SVF | 0–1 | Decreases as it approaches 1 | 0.240–0.290 | Increase |
| Building Order | Adjacent | - | Stores heat | - | |
| Block | - | Stores heat | - | ||
| Discrete | - | Disperses heat | Discrete | Decrease | |
| Average Building Height | m | <10 m 10–20 m | Increases 1 °C | 10.5–12 m | Increase |
| 20–30 m >30 m | Increases 3 °C | ||||
| Prevailing Wind Direction | SE | Parallel | Stores heat | NW | Increase |
| Upright | Disperses heat | - | |||
| Structuring Condition | BCR | Stores heat | - | ||
| FAR | Disperses heat | FAR: 1.40 | Decrease |
| Parameter | Unit | Reference Value | Effect on Temperature | Conclusion | Heat Island Effect |
|---|---|---|---|---|---|
| Park/Green Space | m2 | 1500 m2 park | 1.5 °C reduction | Park: 17,426 m2 | Decrease |
| Wooded Area | m2 | 100 m2 wooded area | 1.5 °C reduction | - | Increase |
| unit | 1 tree (10 m diameter) | 1–1.5 °C reduction | - | Increase | |
| Water Surface | m2 | 30–35 m water surface | 1–3 °C reduction | 7.022 m2 | Decrease |
| Road Material | Permeable/Impermeable | Disperses heat/ warehouses | Impermeable | Increase | |
| Pavement Material | Permeable/Impermeable | Disperses heat/ warehouses | Impermeable | Increase | |
| Building Material | Albedo | 0–1 | Decreases as it approaches 1 | 0.10–0.35 | Increase |
| Average BH/SW | m | 0–0.5 | Decreases as it approaches 0.5 | 0.13–1.68 m | Increase |
| Sky Vision Factor | SVF | 0–1 | Decreases as it approaches 1 | 0.240–0.290 | Increase |
| Building Order | Adjacent | - | Stores heat | - | |
| Block | - | Stores heat | - | ||
| Discrete | - | Disperses heat | Discrete | Decrease | |
| Average Building Height | m | <10 m 10–20 m | Increases 1 °C | 6.5 m | Decrease |
| 20–30 m >30 m | Increases 3 °C | 47–84 m | Increase | ||
| Prevailing Wind Direction | SE | Parallel | Stores heat | - | |
| Upright | Disperses heat | NE | Decrease | ||
| Structuring Condition | BCR | Stores heat | - | ||
| FAR | Disperses heat | FAR: 0.50 | Decrease |
| Parameter | Unit | Reference Value | Effect on Temperature | Conclusion | Heat Island Effect |
|---|---|---|---|---|---|
| Park/Green Space | m2 | 1500 m2 park | 1.5 °C reduction | - | Increase |
| Wooded Area | m2 | 100 m2 wooded area | 1.5 °C reduction | - | Increase |
| unit | 1 tree (10 m diameter) | 1–1.5 °C reduction | 3 | Increase | |
| Water Surface | m2 | 30–35 m water surface | 1–3 °C reduction | - | Increase |
| Road Material | Permeable/Impermeable | Disperses heat/ warehouses | Impermeable | Increase | |
| Pavement Material | Permeable/Impermeable | Disperses heat/ warehouses | Impermeable | Increase | |
| Building Material | Albedo | 0–1 | Decreases as it approaches 1 | 0.10–0.35 | Increase |
| Average BH/SW | m | 0–0.5 | Decreases as it approaches 0.5 | 1.70–1.75 m | Increase |
| Sky Vision Factor | SVF | 0–1 | Decreases as it approaches 1 | 0.240–0.290 | Increase |
| Building Order | Adjacent | - | Stores heat | Adjacent | Increase |
| Block | - | Stores heat | - | ||
| Discrete | - | Disperses heat | - | ||
| Average Building Height | m | <10 m 10–20 m | Increases 1 °C | 8.5–10.5 m | Increase |
| 20–30 m >30 m | Increases 3 °C | ||||
| Prevailing Wind Direction | SE | Parallel | Stores heat | - | |
| Upright | Disperses heat | SW | Decrease | ||
| Structuring Condition | BCR | Stores heat | BCR (Adj.-3) | Increase | |
| FAR | Disperses heat |
| Parameter | Unit | Reference Value | Effect on Temperature | Conclusion | Heat Island Effect |
|---|---|---|---|---|---|
| Park/Green Space | m2 | 1500 m2 park | 1.5 °C reduction | Park: 400 m2 Green Space: - | Increase |
| Wooded Area | m2 | 100 m2 wooded area | 1.5 °C reduction | 6.450 m2 | Decrease |
| unit | 1 tree (10 m diameter) | 1–1.5 °C reduction | - | Increase | |
| Water Surface | m2 | 30–35 m water surface | 1–3 °C reduction | - | Increase |
| Road Material | Permeable/Impermeable | Disperses heat/ warehouses | Impermeable | Increase | |
| Pavement Material | Permeable/Impermeable | Disperses heat/ warehouses | Impermeable | Increase | |
| Building Material | Albedo | 0–1 | Decreases as it approaches 1 | 0.10–0.35 0.50–0.90 | Increase Decrease |
| Average BH/SW | m | 0–0.5 | Decreases as it approaches 0.5 | 0.60 m | Decrease |
| Sky Vision Factor | SVF | 0–1 | Decreases as it approaches 1 | 0.280 | Increase |
| Building Order | Adjacent | - | Stores heat | - | |
| Block | - | Stores heat | - | ||
| Discrete | - | Disperses heat | Discrete | Decrease | |
| Average Building Height | m | <10 m 10–20 m | Increases 1 °C | 18.5 m | Increase |
| 20–30 m >30 m | Increases 3 °C | - | |||
| Prevailing Wind Direction | SE | Parallel | Stores heat | - | |
| Upright | Disperses heat | N, NW | Increase | ||
| Structuring Condition | BCR | Stores heat | |||
| FAR | Disperses heat | FAR: 0.90 | Decrease |
| Parameter | Unit | Reference Value | Effect on Temperature | Conclusion | Heat Island Effect |
|---|---|---|---|---|---|
| Park/Green Space | m2 | 1500 m2 park | 1.5 °C reduction | - | Increase |
| Wooded Area | m2 | 100 m2 wooded area | 1.5 °C reduction | - | Increase |
| unit | 1 tree (10 m diameter) | 1–1.5 °C reduction | 28 | Decrease | |
| Water Surface | m2 | 30–35 m water surface | 1–3 °C reduction | - | Increase |
| Road Material | Permeable/Impermeable | Disperses heat/ warehouses | Impermeable | Increase | |
| Pavement Material | Permeable/Impermeable | Disperses heat/ warehouses | Impermeable | Increase | |
| Building Material | Albedo | 0–1 | Decreases as it approaches 1 | 0.10–0.35 | Increase |
| Average BH/SW | m | 0–0.5 | Decreases as it approaches 0.5 | 1.50–1.75 m | Decrease |
| Sky Vision Factor | SVF | 0–1 | Decreases as it approaches 1 | 0.07 | Increase |
| Building Order | Adjacent | - | Stores heat | Adjacent | Increase |
| Block | - | Stores heat | - | ||
| Discrete | - | Disperses heat | - | ||
| Average Building Height | m | <10 m 10–20 m | Increases 1 °C | ||
| 20–30 m >30 m | Increases 3 °C | 21–21.4 m | Increase | ||
| Prevailing Wind Direction | SE | Parallel | Stores heat | - | |
| Upright | Disperses heat | NE | Increase | ||
| Structuring Condition | BCR | Stores heat | BCR: 0.50 | Increase | |
| FAR | Disperses heat |
| Parameter | Unit | Reference Value | Effect on Temperature | Conclusion | Heat Island Effect |
|---|---|---|---|---|---|
| Park/Green Space | m2 | 1500 m2 park | 1.5 °C reduction | 550 m2 | Decrease |
| Wooded Area | m2 | 100 m2 wooded area | 1.5 °C reduction | 1200 m2 | Decrease |
| unit | 1 tree (10 m diameter) | 1–1.5 °C reduction | - | Decrease | |
| Water Surface | m2 | 30–35 m water surface | 1–3 °C reduction | 130 m2 | Decrease |
| Road Material | Permeable/Impermeable | Disperses heat/ warehouses | Impermeable | Increase | |
| Pavement Material | Permeable/Impermeable | Disperses heat/ warehouses | Impermeable | Increase | |
| Building Material | Albedo | 0–1 | Decreases as it approaches 1 | 0.10–0.35 | Increase |
| Average BH/SW | m | 0–0.5 | Decreases as it approaches 0.5 | 0.75 m | Increase |
| Sky Vision Factor | SVF | 0–1 | Decreases as it approaches 1 | 0.122 | Increase |
| Building Order | Adjacent | - | Stores heat | - | Increase |
| Block | - | Stores heat | - | ||
| Discrete | - | Disperses heat | -Discrete | Decrease | |
| Average Building Height | m | <10 m 10–20 m | Increases 1 °C | ||
| 20–30 m >30 m | Increases 3 °C | 7.5 m | Increase | ||
| Prevailing Wind Direction | SE | Parallel | Stores heat | - | |
| Upright | Disperses heat | NE | Increase | ||
| Structuring Condition | BCR | Stores heat | - | ||
| FAR | Disperses heat | FAR: 0.80 | Decrease |
| Parameter | Texture Analysis Results | |||||||
|---|---|---|---|---|---|---|---|---|
| 1 | 2 | 3 | 4 | 5 | 6 | 7 | 8 | |
| Park/Green Space | ↑ | ↑ | ↑ | ↓ | ↑ | ↑ | ↑ | ↓ |
| Wooded Area | ↓ | ↓ | ↑ | ↑ | ↑ | ↓ | ↑ | ↓ |
| Water Surface | ↑ | ↑ | ↑ | ↓ | ↑ | ↑ | ↑ | ↓ |
| Road Material | ↑ | ↑ | ↑ | ↑ | ↑ | ↑ | ↑ | ↑ |
| Pavement Material | ↑ | ↑ | ↑ | ↑ | ↑ | ↑ | ↑ | ↑ |
| Building Material | ↑ | ↑ | ↑ | ↑ | ↑ | ↑↓ | ↑ | ↑ |
| Average BH/SW | ↑ | ↑ | ↓ | ↑ | ↑ | ↓ | ↑ | ↓ |
| Sky Vision Factor | ↑ | ↑ | ↑ | ↑ | ↑ | ↑ | ↑ | ↑ |
| Building Order | ↓ | ↓ | ↓ | ↓ | ↑ | ↓ | ↑ | ↓ |
| Average Building Height | ↑ | ↑ | ↑ | ↑↓ | ↑ | ↑ | ↑ | ↑ |
| Prevailing Wind Direction | ↑ | ↑ | ↑ | ↓ | ↓ | ↑ | ↓ | ↑ |
| Structuring Condition | ↓ | ↓ | ↓ | ↑ | ↑ | ↓ | ↑ | ↓ |
Disclaimer/Publisher’s Note: The statements, opinions and data contained in all publications are solely those of the individual author(s) and contributor(s) and not of MDPI and/or the editor(s). MDPI and/or the editor(s) disclaim responsibility for any injury to people or property resulting from any ideas, methods, instructions or products referred to in the content. |
© 2025 by the authors. Licensee MDPI, Basel, Switzerland. This article is an open access article distributed under the terms and conditions of the Creative Commons Attribution (CC BY) license (https://creativecommons.org/licenses/by/4.0/).
Share and Cite
Karacan Tekin, G.; Gökce, D. Investigation of Ground Surface Temperature Increases in Urban Textures with Different Characteristics: The Case of Denizli City. Sustainability 2025, 17, 6818. https://doi.org/10.3390/su17156818
Karacan Tekin G, Gökce D. Investigation of Ground Surface Temperature Increases in Urban Textures with Different Characteristics: The Case of Denizli City. Sustainability. 2025; 17(15):6818. https://doi.org/10.3390/su17156818
Chicago/Turabian StyleKaracan Tekin, Gizem, and Duygu Gökce. 2025. "Investigation of Ground Surface Temperature Increases in Urban Textures with Different Characteristics: The Case of Denizli City" Sustainability 17, no. 15: 6818. https://doi.org/10.3390/su17156818
APA StyleKaracan Tekin, G., & Gökce, D. (2025). Investigation of Ground Surface Temperature Increases in Urban Textures with Different Characteristics: The Case of Denizli City. Sustainability, 17(15), 6818. https://doi.org/10.3390/su17156818