

Globalization, Financial Risk, and Environmental Degradation in China: The Role of Human Capital and Renewable Energy Use

Abstract
1. Introduction
- (a)
- How does China’s economic growth and globalization interact with emissions trends?
- (b)
- What is the effect of fossil fuel efficiency (FFE) on emissions trends in China?
- (c)
- How does human capital impact emissions trends in China?
- (d)
- What is the association between renewable energy and CO2 emissions?
- (e)
- How can China achieve carbon neutrality?
2. Theoretical Framework and the Literature
2.1. Theoretical Framework
2.2. Literature Review
2.3. Evaluation of the Literature
3. Data and Methods
3.1. Data
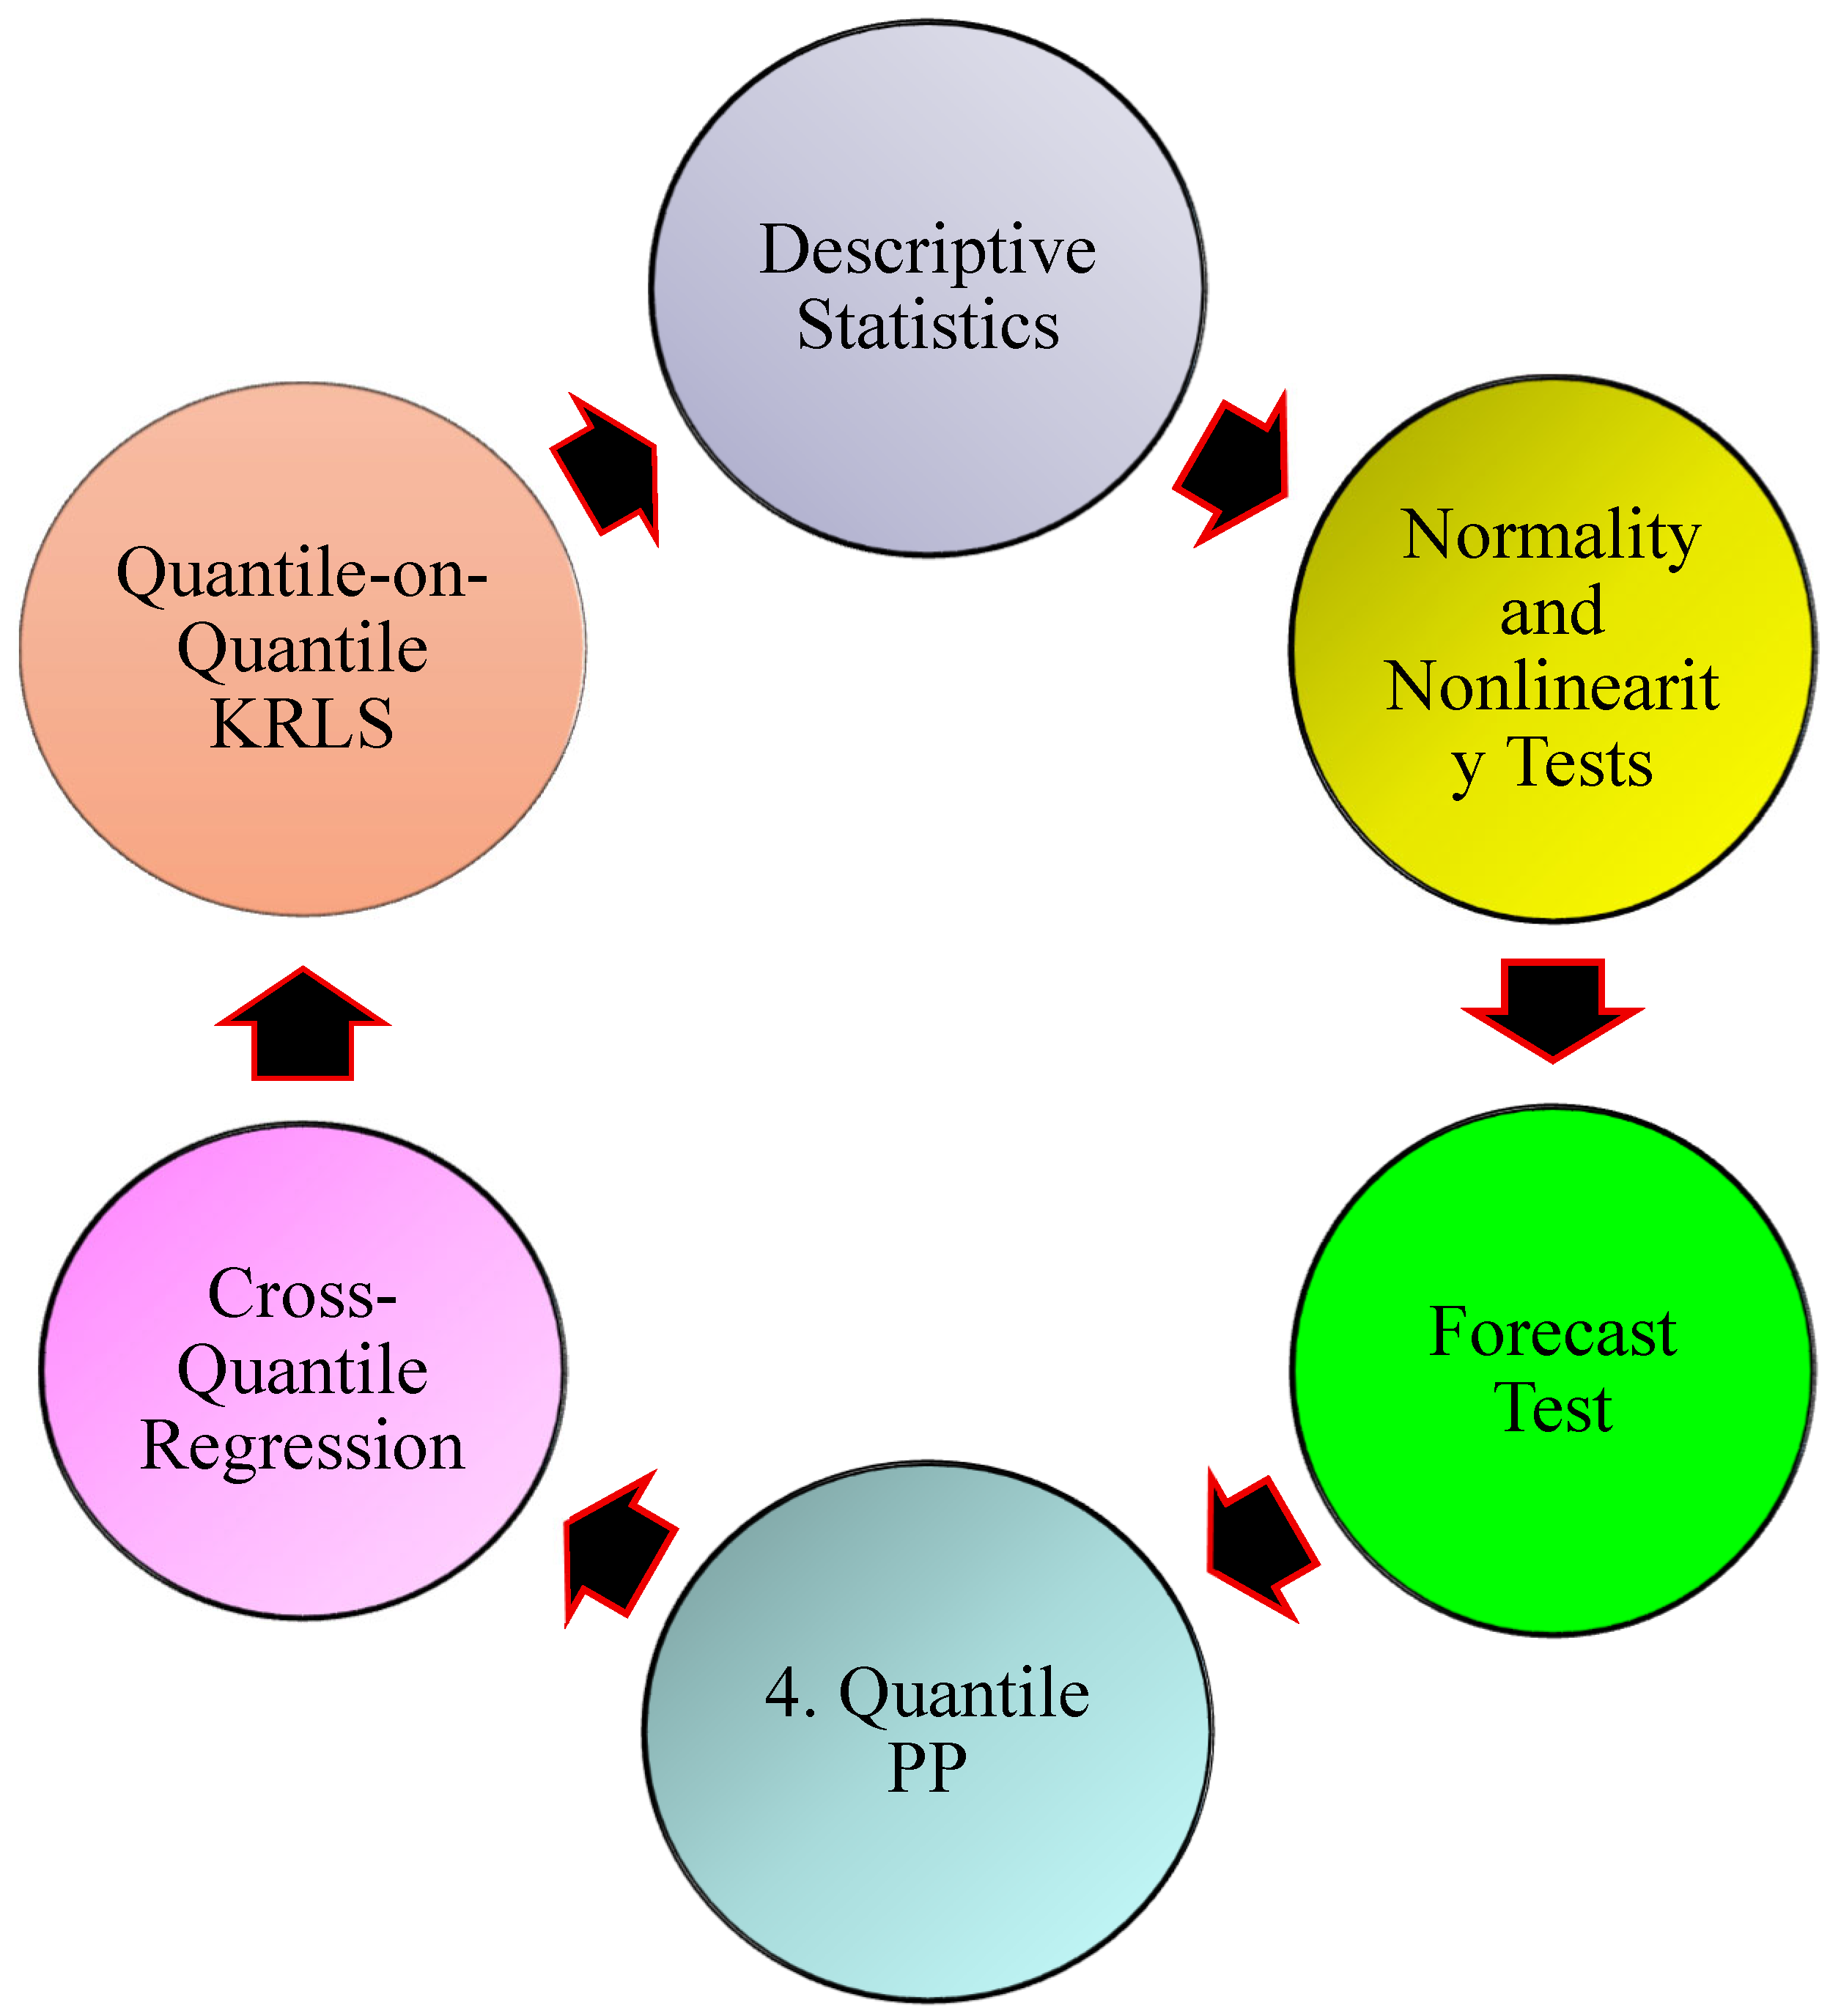
3.2. Empirical Method
3.2.1. Modified Cross-Quantile Regression
3.2.2. Quantile-on-Quantile KRLS
4. Findings and Discussion
4.1. Forecast Results
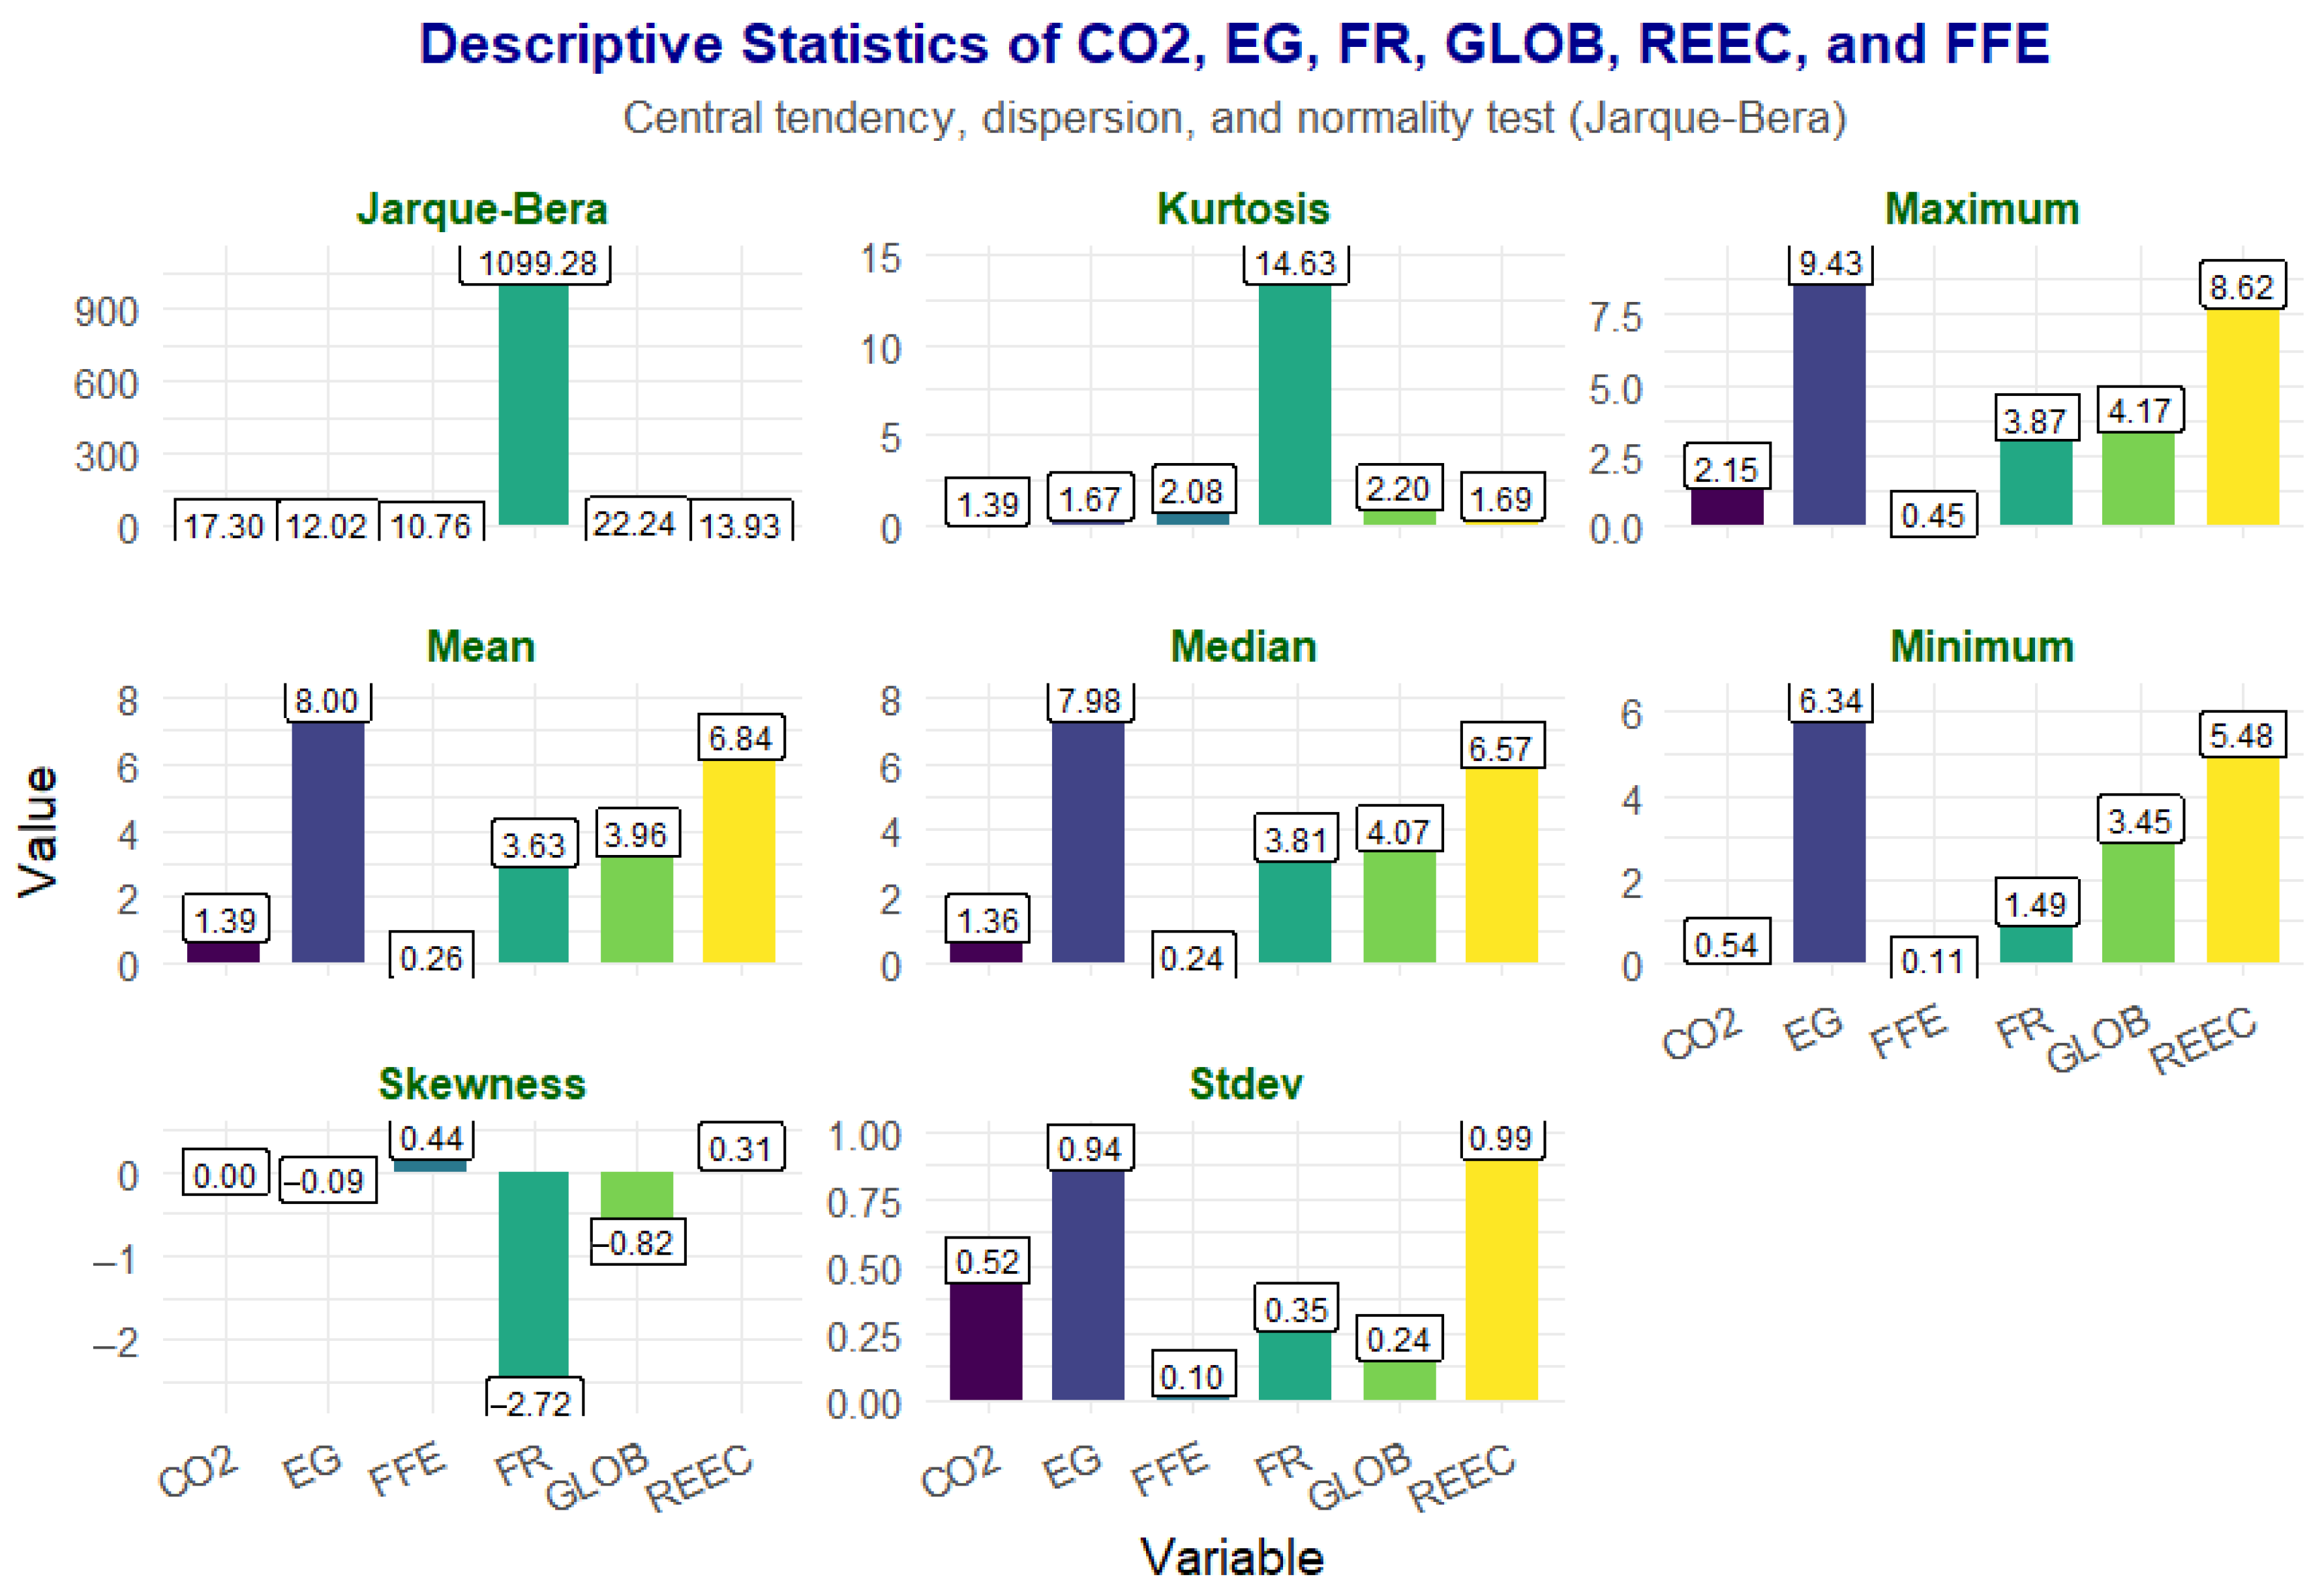
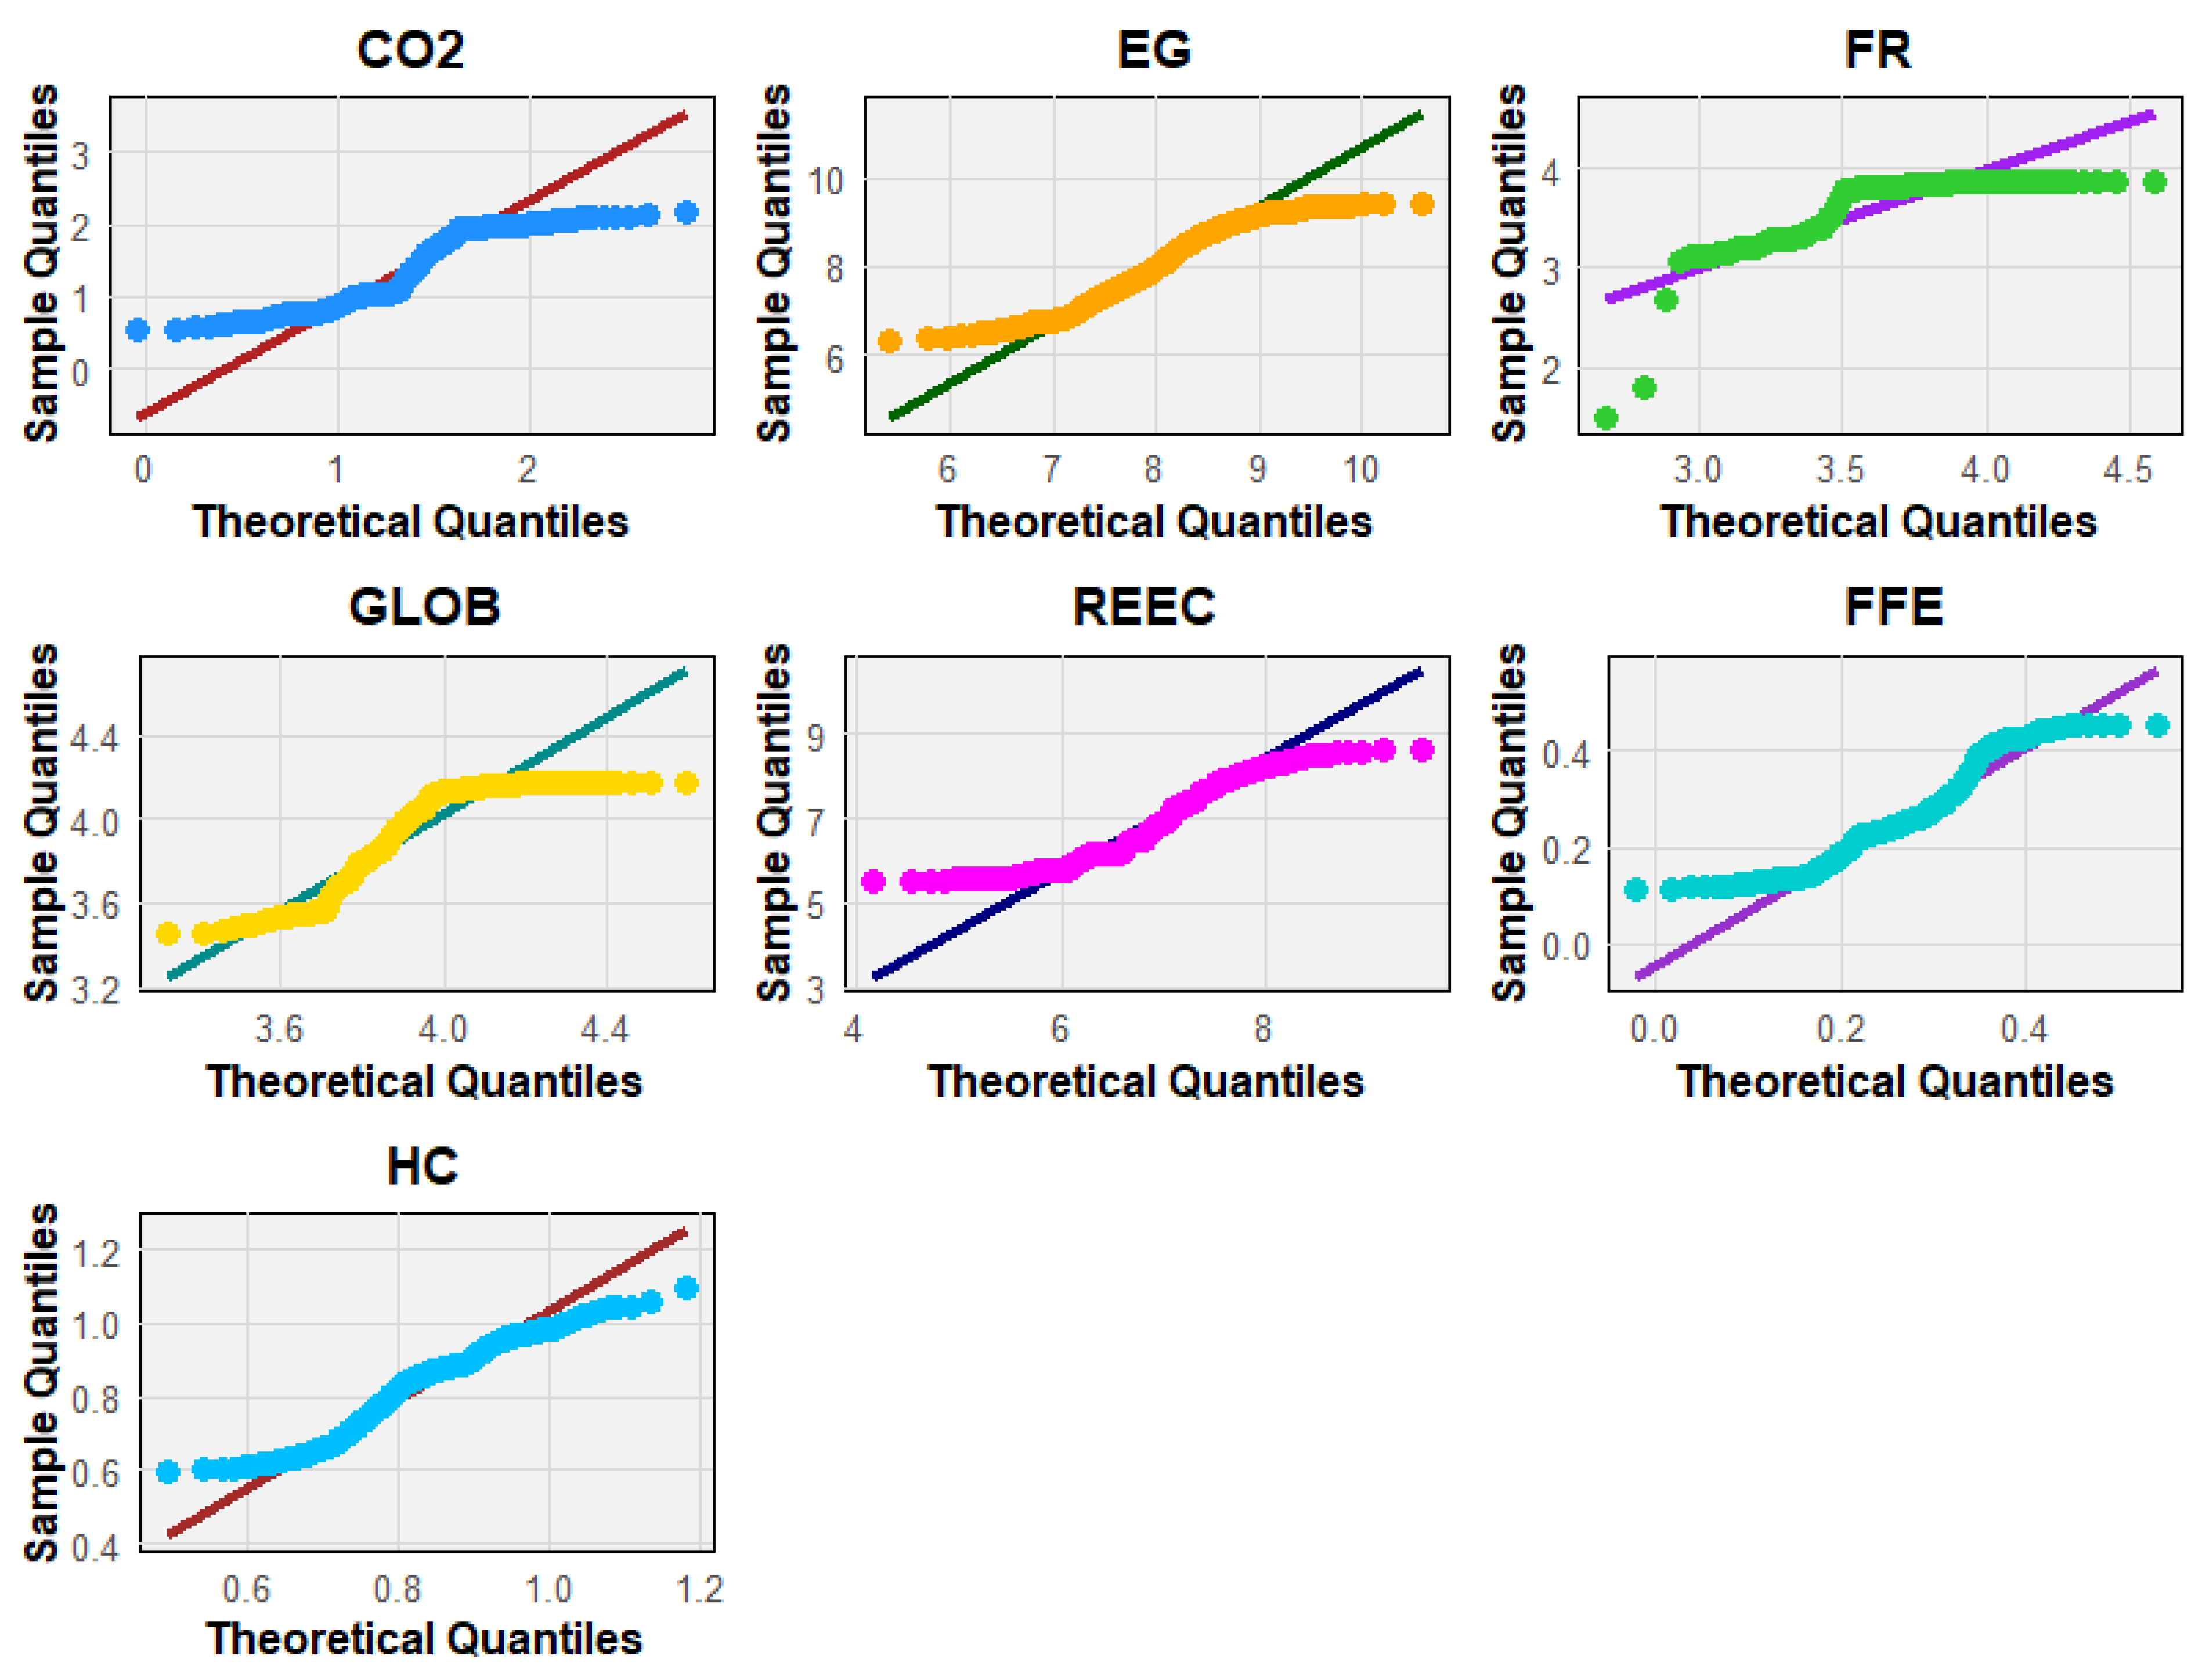
4.2. Results of Nonlinearity and Normality Tests
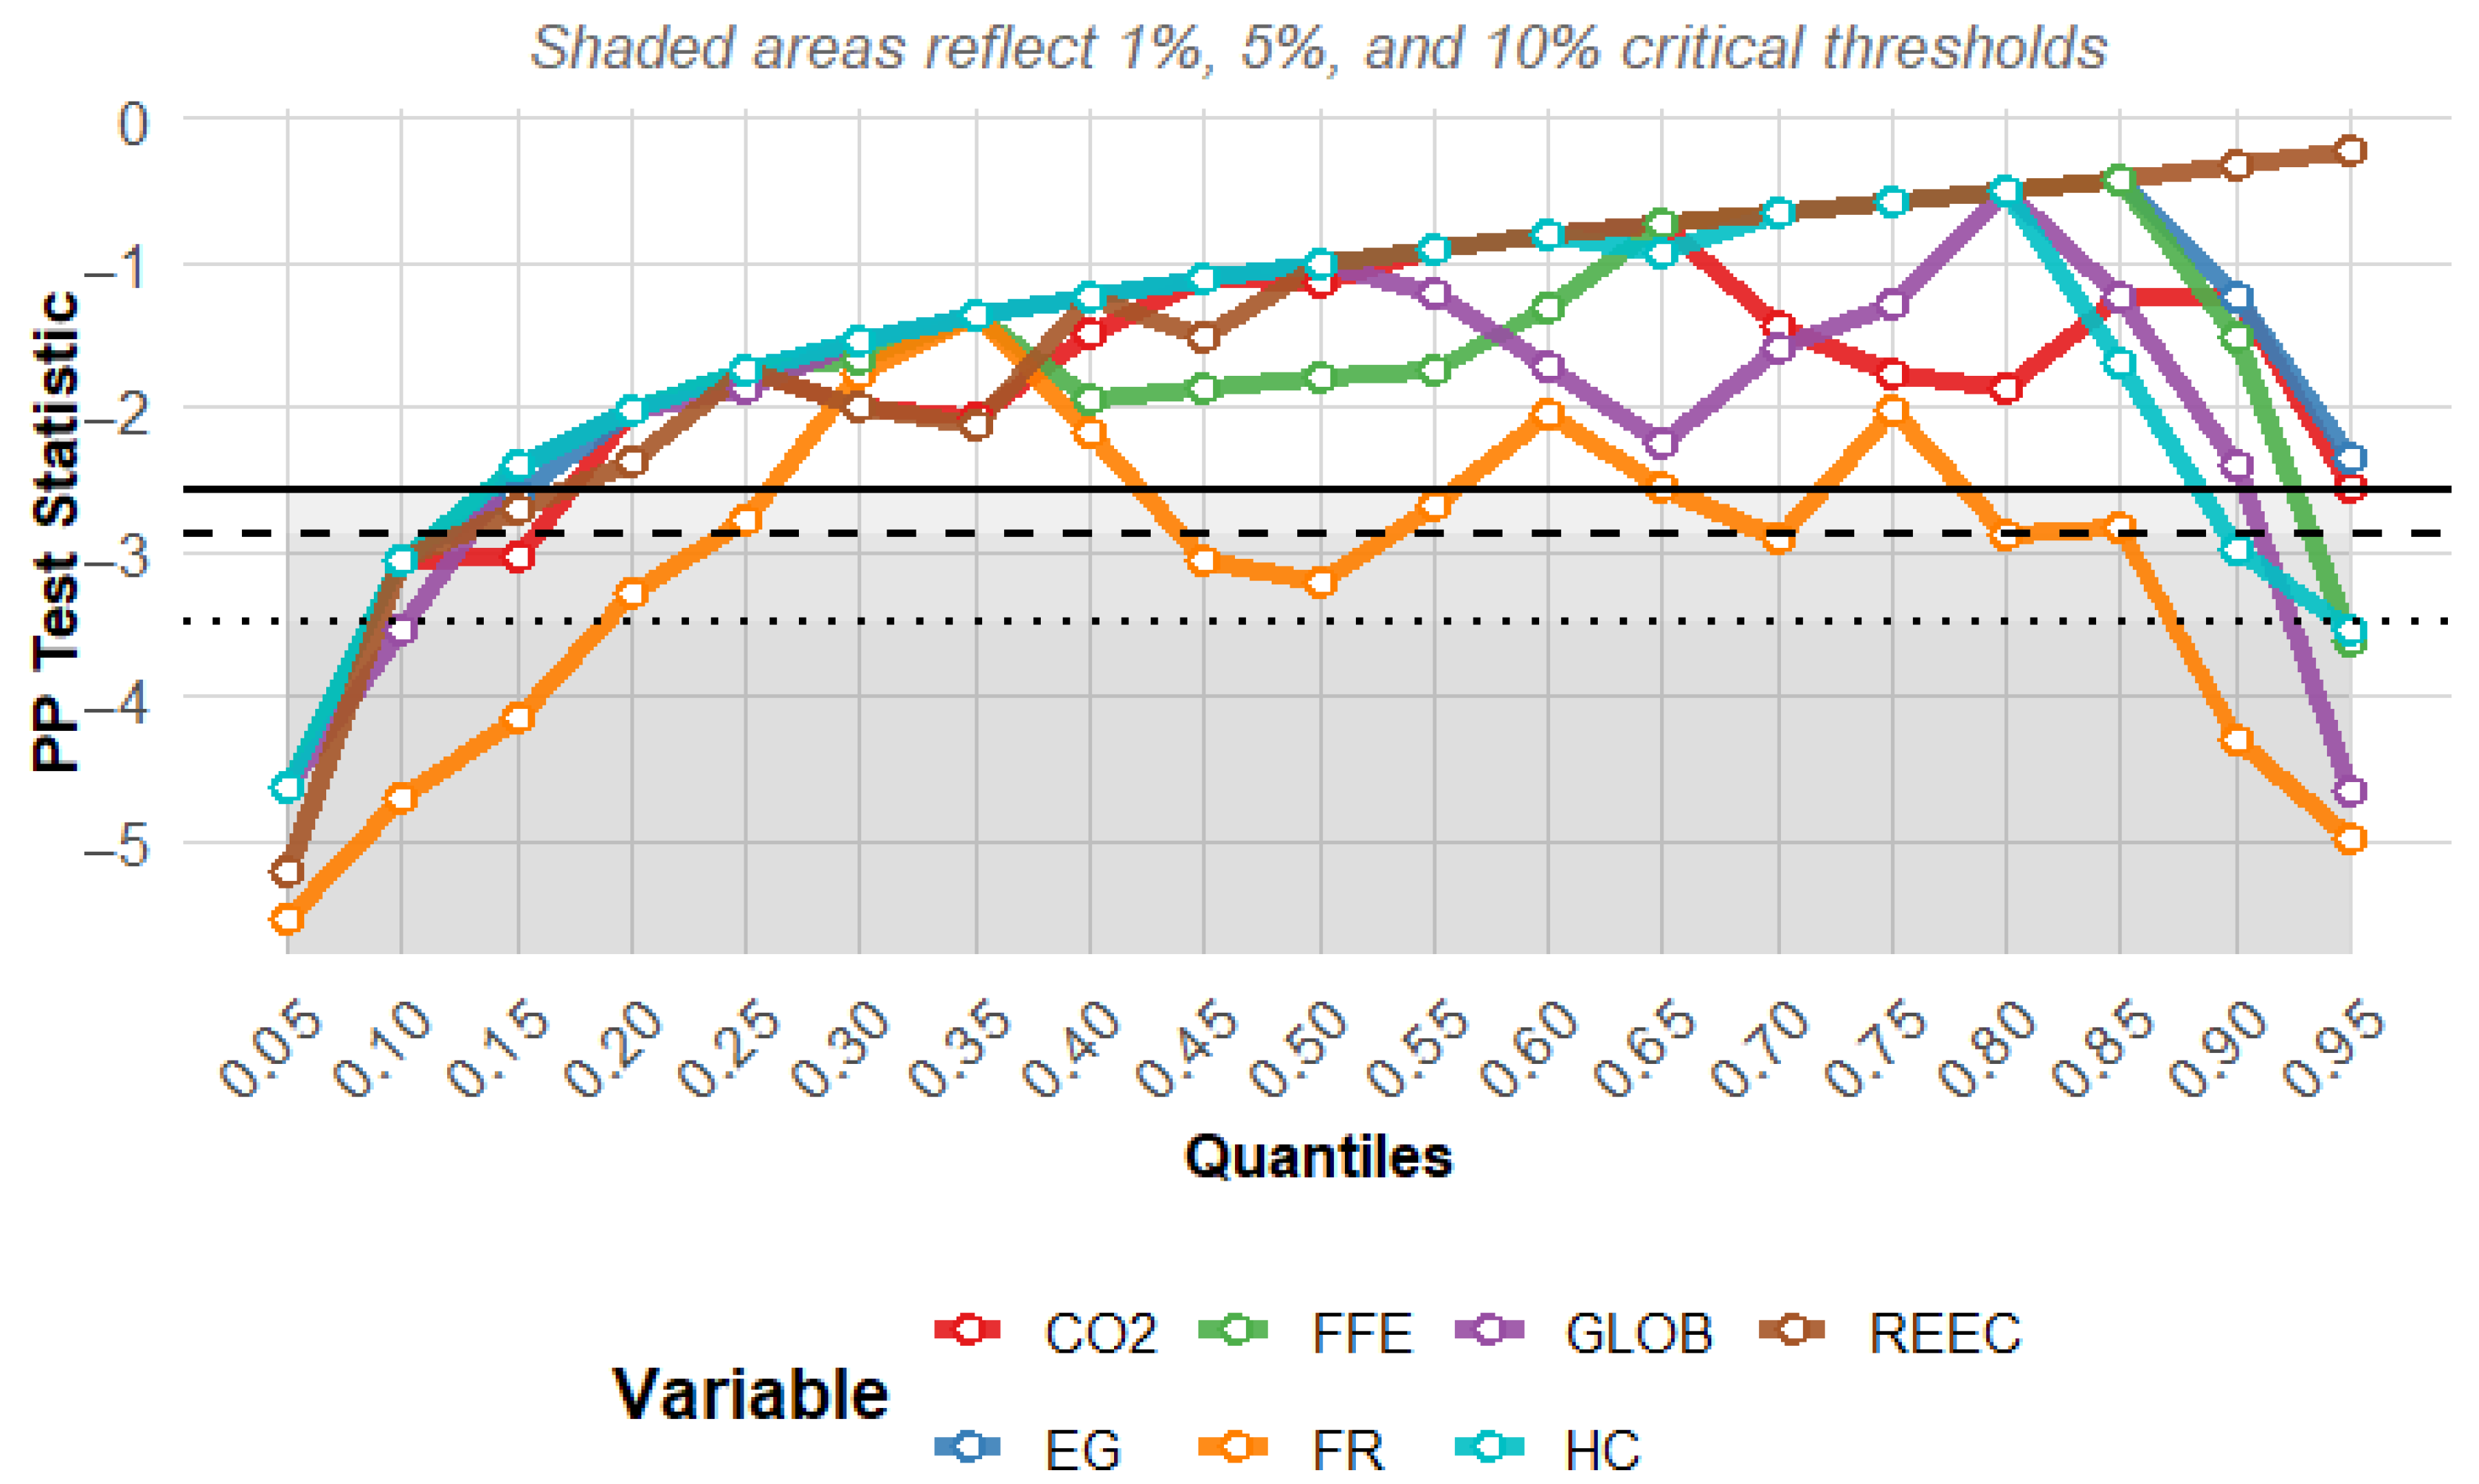
4.3. Stationarity Test Result
4.4. Cross-Quantile Regression Result
4.5. Robustness Check with MQR and ACQR
4.6. Quantile-on-Quantile KRLS Results
5. Conclusions and Policy Recommendations
5.1. Conclusions
5.2. Policy Recommendations
5.3. Limitations and Future Recommendations
Author Contributions
Funding
Institutional Review Board Statement
Informed Consent Statement
Data Availability Statement
Conflicts of Interest
References
- Climate Tracker. Climate Tracker China. 2025. Available online: https://climateactiontracker.org/countries/china/ (accessed on 17 June 2025).
- IEA. Tracking Clean Energy Innovation Focus on China. 2024. Available online: https://www.iea.org/reports/tracking-clean-energy-innovation-focus-on-china (accessed on 5 May 2024).
- IEA. International Energy Association. China. 2023. Available online: https://www.iea.org/countries/china (accessed on 17 June 2025).
- Awosusi, A.A.; Ozdeser, H.; Ojekemi, O.S.; Adeshola, I.; Ramzan, M. Environmental sustainability in Vietnam: Evaluating the criticality of economic globalisation, renewable energy, and natural resources. Environ. Sci. Pollut. Res. 2023, 3, 75581–75594. [Google Scholar] [CrossRef]
- Alola, A.A.; Olanipekun, I.O.; Shah, M.I. Examining the drivers of alternative energy in leading energy sustainable economies: The trilemma of energy efficiency, energy intensity and renewables expenses. Renew. Energy 2023, 202, 1190–1197. [Google Scholar] [CrossRef]
- Altın, H. The impact of energy efficiency and renewable energy consumption on carbon emissions in G7 countries. Int. J. Sustain. Eng. 2024, 17, 134–142. [Google Scholar] [CrossRef]
- Anser, M.K.; Khan, K.A.; Umar, M.; Awosusi, A.A.; Shamansurova, Z. Formulating sustainable development policy for a developed nation: Exploring the role of renewable energy, natural gas efficiency and oil efficiency towards decarbonization. Int. J. Sustain. Dev. World Ecol. 2023, 31, 247–263. [Google Scholar] [CrossRef]
- Akram, R.; Chen, F.; Khalid, F.; Ye, Z.; Majeed, M.T. Heterogeneous effects of energy efficiency and renewable energy on carbon emissions: Evidence from developing countries. J. Clean. Prod. 2020, 247, 119122. [Google Scholar] [CrossRef]
- Lee, Y.; Chiu, Y.H.; Lu, L.C.; Chiu, C.R. Evaluation of energy efficiency and air pollutant emissions in Chinese provinces. Energy Effic. 2021, 12, 963–977. [Google Scholar]
- Ivanovski, K.; Hailemariam, A. Is globalisation linked to CO2 emission? Evidence from OECD nations. Environ. Ecol. Stat. 2022, 29, 241–270. [Google Scholar] [CrossRef]
- Alariqi, M.; Long, W.; Singh, P.R.; Al-Barakani, A.; Muazu, A. Modelling dynamic links among energy transition, technological level and economic development from the perspective of economic globalisation: Evidence from MENA economies. Energy Rep. 2023, 9, 3920–3931. [Google Scholar] [CrossRef]
- Abdi, A.H.; Warsame, A.A.; Sugow, M.O.; Hussein, H.A. Transitioning to sustainable energy and enhanced environmental quality in Somalia through renewable energy, globalisation and trade openness. Sci. Rep. 2025, 15, 6367. [Google Scholar] [CrossRef]
- Borowiec, J.; Papież, M. Convergence of CO2 emissions in countries at different stages of development. Do globalisation and environmental policies matter? Energy Policy 2024, 184, 113866. [Google Scholar] [CrossRef]
- Sharif, A.; Saqib, N.; Dong, K.; Khan, S.A.R. Nexus between green technology innovation, green financing, and CO2 emissions in the G7 countries: The moderating role of social globalisation. Sustain. Dev. 2022, 4, 12–24. [Google Scholar] [CrossRef]
- Chen, Y.; Lee, C.-C.; Chen, M. Ecological footprint, human capital, and urbanization. Energy Environ. 2022, 33, 487–510. [Google Scholar] [CrossRef]
- Ahmed, Z.; Asghar, M.M.; Malik, M.N.; Nawaz, K. Moving towards a sustainable environment: The dynamic linkage between natural resources, human capital, urbanization, economic growth, and ecological footprint in China. Resour. Policy 2020, 67, 101677. [Google Scholar] [CrossRef]
- Dada, J.T.; Adeiza, A.; Ismail, N.A.; Marina, A. Investigating the link between economic growth, financial development, urbanization, natural resources, human capital, trade openness and ecological footprint: Evidence from Nigeria. J. Bioecon. 2022, 24, 153–179. [Google Scholar] [CrossRef]
- Danish; Hassan, S.T.; Baloch, M.A.; Mahmood, N.; Zhang, J. Linking economic growth and ecological footprint through human capital and biocapacity. Sustain. Cities Soc. 2019, 47, 101516. [Google Scholar] [CrossRef]
- Adebayo, T.S.; Özkan, O.; Olanrewaju, V.O.; Uzun, B. Do fossil-fuel subsidies, Fintech innovation, and digital ICT transform ecological quality in Turkey? Evidence from modified cross-quantile regression. Appl. Econ. 2025. [Google Scholar] [CrossRef]
- Huang, X.; Chen, M. Analysis on the Nonlinear Impact of Financial Risks on CO2 Emissions: Designing a Sustainable Development Goal Framework for Asian Economies. J. Environ. Public Health 2022, 2022, e8458122. [Google Scholar] [CrossRef]
- Zhao, J.; Shahbaz, M.; Dong, X.; Dong, K. How does financial risk affect global CO2 emissions? The role of technological innovation. Technol. Forecast. Soc. Change 2021, 168, 120751. [Google Scholar] [CrossRef]
- Adebayo, T.S. Overcoming barriers to clean cooking solutions: Political risk, financial development, and their implications for achieving SDG 7 in Nigeria. Environ. Prog. Sustain. Energy 2025, 44, e14592. [Google Scholar] [CrossRef]
- Aladejare, S.A. Natural resource rents, globalisation and environmental degradation: New insight from 5 richest African economies. Resour. Policy 2022, 78, 102909. [Google Scholar] [CrossRef]
- Amegavi, G.B.; Langnel, Z.; Ahenkan, A.; Buabeng, T. The dynamic relationship between economic globalisation, institutional quality, and ecological footprint: Evidence from Ghana. J. Int. Trade Econ. Dev. 2022, 31, 876–893. [Google Scholar] [CrossRef]
- Arora, G.K.; Gumber, A. Globalisation and Healthcare Financing in India: Some Emerging Issues. Public Financ. Manag. 2005, 5, 567–596. [Google Scholar] [CrossRef]
- Ahmed, Z.; Nathaniel, S.P.; Shahbaz, M. The criticality of information and communication technology and human capital in environmental sustainability: Evidence from Latin American and Caribbean countries. J. Clean. Prod. 2021, 286, 125529. [Google Scholar] [CrossRef]
- Alvarado, R.; Deng, Q.; Tillaguango, B.; Méndez, P.; Bravo, D.; Chamba, J.; Alvarado-Lopez, M.; Ahmad, M. Do economic development and human capital decrease non-renewable energy consumption? Evidence for OECD countries. Energy 2021, 215, 119147. [Google Scholar] [CrossRef]
- Hao, L.-N.; Umar, M.; Khan, Z.; Ali, W. Green growth and low carbon emission in G7 countries: How critical the network of environmental taxes, renewable energy and human capital is? Sci. Total Environ. 2021, 752, 141853. [Google Scholar] [CrossRef]
- Gnangoin, T.Y.; Kassi, D.F.; Kongrong, O. Urbanization and CO2 emissions in Belt and Road Initiative economies: Analyzing the mitigating effect of human capital in Asian countries. Environ. Sci. Pollut. Res. 2023, 30, 50376–50391. [Google Scholar] [CrossRef]
- Danish; Ulucak, R. Renewable energy, technological innovation and the environment: A novel dynamic auto-regressive distributive lag simulation. Renew. Sustain. Energy Rev. 2021, 150, 111433. [Google Scholar] [CrossRef]
- Yunzhao, L. Modelling the role of eco innovation, renewable energy, and environmental taxes in carbon emissions reduction in E∓7 economies: Evidence from advance panel estimations. Renew. Energy 2022, 190, 309–318. [Google Scholar] [CrossRef]
- Jeon, H. CO2 emissions, renewable energy and economic growth in the US. Electr. J. 2022, 35, 107170. [Google Scholar] [CrossRef]
- Kartal, M.T.; Kılıç Depren, S.; Ayhan, F.; Depren, Ö. Impact of renewable and fossil fuel energy consumption on environmental degradation: Evidence from USA by nonlinear approaches. Int. J. Sustain. Dev. World Ecol. 2022, 29, 738–755. [Google Scholar] [CrossRef]
- Pavel, T.; Polina, S.; Liubov, N. The research of the impact of energy efficiency on mitigating greenhouse gas emissions at the national level. Energy Convers. Manag. 2024, 314, 118671. [Google Scholar] [CrossRef]
- Akbar, M.W.; Yuelan, P.; Zia, Z.; Arshad, M.I. Role of fiscal policy in energy efficiency and CO2 emission nexus: An investigation of belt and road region. J. Public Aff. 2022, 22, e2603. [Google Scholar] [CrossRef]
- Li, B.; Haneklaus, N. Reducing CO2 emissions in G7 countries: The role of clean energy consumption, trade openness and urbanization. Energy Rep. 2022, 8, 704–713. [Google Scholar] [CrossRef]
- Rahman, M.M.; Alam, K.; Velayutham, E. Reduction of CO2 emissions: The role of renewable energy, technological innovation and export quality. Energy Rep. 2022, 8, 2793–2805. [Google Scholar] [CrossRef]
- Wang, Q.; Dong, Z.; Li, R.; Wang, L. Renewable energy and economic growth: New insight from country risks. Energy 2022, 238, 122018. [Google Scholar] [CrossRef]
- Alola, A.A.; Adebayo, T.S.; Onifade, S.T. Examining the dynamics of ecological footprint in China with spectral Granger causality and quantile-on-quantile approaches. Int. J. Sustain. Dev. World Ecol. 2022, 29, 263–276. [Google Scholar] [CrossRef]
- Rehman, E.; Rehman, S. Modeling the nexus between carbon emissions, urbanization, population growth, energy consumption, and economic development in Asia: Evidence from grey relational analysis. Energy Rep. 2022, 8, 5430–5442. [Google Scholar] [CrossRef]
- Audi, M.; Poulin, M.; Ahmad, K.; Ali, A. Modeling Disaggregate Globalization to Carbon Emissions in BRICS: A Panel Quantile Regression Analysis. Sustainability 2025, 17, 2638. [Google Scholar] [CrossRef]
- Degirmenci, T.; Okoth, E.; Erdem, A. Political governance and tourism development: The roles of globalisation, stability, economic growth, and taxation in top destinations. Tour. Recreat. Res. 2025, 1–13. [Google Scholar] [CrossRef]
- Yang, B.; Ali, M.; Nazir, M.R.; Ullah, W.; Qayyum, M. Financial instability and CO2 emissions: Cross-country evidence. Air Qual. Atmos. Health 2020, 13, 459–468. [Google Scholar] [CrossRef]
- D’Orazio, P.; Pham, A.-D. Evaluating climate-related financial policies’ impact on decarbonization with machine learning methods. Sci. Rep. 2025, 15, 1694. [Google Scholar] [CrossRef]
- Adebayo, T.S.; Ullah, S. Towards a sustainable future: The role of energy efficiency, renewable energy, and urbanization in limiting CO2 emissions in Sweden. Sustain. Dev. 2023, 32, 244–259. [Google Scholar] [CrossRef]
- Shen, J.; Ridwan, L.I.; Raimi, L.; Al-Faryan, M.A.S. Recent developments in green hydrogen–environmental sustainability nexus amidst energy efficiency, green finance, eco-innovation, and digitalization in top hydrogen-consuming economies. Energy Environ. 2023, 36, 255–290. [Google Scholar] [CrossRef]
- Charfeddine, L.; Kahia, M. Do information and communication technology and renewable energy use matter for carbon dioxide emissions reduction? Evidence from the Middle East and North Africa region. J. Clean. Prod. 2021, 327, 129410. [Google Scholar] [CrossRef]
- OWD. Our Worldindata. 2024. Available online: https://ourworldindata.org/ (accessed on 20 October 2024).
- WDI. World Development Indicator. 2025. Available online: https://data.worldbank.org/country/nigeria (accessed on 1 January 2025).
- The PRS Group. PRS Group Data of Country Risk. Obtained from the PRS Group via E-Mail (2022). 2022. Available online: https://www.prsgroup.com/explore-our-products/icrg/ (accessed on 17 June 2025).
- KOF. ETH Zurich KOF Globalisation Index. 2023. Available online: https://kof.ethz.ch/en/forecasts-and-indicators/indicators/kof-globalisation-index.html (accessed on 20 October 2023).
- Sim, N.; Zhou, H. Oil prices, US stock return, and the dependence between their quantiles. J. Bank. Finance 2015, 55, 1–8. [Google Scholar] [CrossRef]
- Naeem, M.A.; Peng, Z.; Suleman, M.T.; Nepal, R.; Shahzad, S.J.H. Time and frequency connectedness among oil shocks, electricity and clean energy markets. Energy Econ. 2020, 91, 104914. [Google Scholar] [CrossRef]
- Adebayo, T.S. Response of sectoral CO2 emissions to climate and economic policy uncertainties: A multi-frequency quantile analysis. Appl. Econ. 2025, 1, 1–20. [Google Scholar] [CrossRef]
- Li, T.-H. Quantile Fourier Transform, Quantile Series, and Nonparametric Estimation of Quantile Spectra. arXiv 2024. [Google Scholar] [CrossRef]
- Abbasi, K.R.; Shahbaz, M.; Zhang, J.; Irfan, M.; Alvarado, R. Analyze the environmental sustainability factors of China: The role of fossil fuel energy and renewable energy. Renew. Energy 2022, 187, 390–402. [Google Scholar] [CrossRef]
- Adebayo, T.S. Environmental consequences of fossil fuel in Spain amidst renewable energy consumption: A new insights from the wavelet-based Granger causality approach. Int. J. Sustain. Dev. World Ecol. 2022, 29, 579–592. [Google Scholar] [CrossRef]
- Pata, U.K.; Caglar, A.E. Investigating the EKC hypothesis with renewable energy consumption, human capital, globalization and trade openness for China: Evidence from augmented ARDL approach with a structural break. Energy 2021, 216, 119220. [Google Scholar] [CrossRef]
- Akadiri, S.S.; Akpan, U.; Aladenika, B. Asymmetric effect of financial globalization on carbon emissions in G7 countries: Fresh insight from quantile-on-quantile regression. Energy Environ. 2023, 34, 1285–1304. [Google Scholar] [CrossRef]
- Zhang, H.; Khan, K.A.; Eweade, B.S.; Adebayo, T.S. Role of eco-innovation and financial globalization on ecological quality in China: A wavelet analysis. Energy Environ. 2024. [Google Scholar] [CrossRef]
- Ling, G.; Razzaq, A.; Guo, Y.; Fatima, T.; Shahzad, F. Asymmetric and time-varying linkages between carbon emissions, globalization, natural resources and financial development in China. Environ. Dev. Sustain. 2022, 24, 6702–6730. [Google Scholar] [CrossRef]
- Al-Mulali, U.; Solarin, S.A.; Ozturk, I. Investigating the presence of the environmental Kuznets curve (EKC) hypothesis in Kenya: An autoregressive distributed lag (ARDL) approach. Nat. Hazards 2016, 80, 1729–1747. [Google Scholar] [CrossRef]
- Dogan, E.; Turkekul, B. CO2 emissions, real output, energy consumption, trade, urbanization and financial development: Testing the EKC hypothesis for the USA. Environ. Sci. Pollut. Res. 2016, 23, 1203–1213. [Google Scholar] [CrossRef]
- Adebayo, T.S.; Ozsahin, D.U.; Olanrewaju, V.O.; Uzun, B. Decoding the environmental role of nuclear and renewable energy consumption: A time-frequency perspective. Ann. Nucl. Energy 2025, 223, 111660. [Google Scholar] [CrossRef]
- Jahanger, A.; Zaman, U.; Hossain, M.R.; Awan, A. Articulating CO2 emissions limiting roles of nuclear energy and ICT under the EKC hypothesis: An application of non-parametric MMQR approach. Geosci. Front. 2023, 14, 101589. [Google Scholar] [CrossRef]
- Grossman, G.M.; Krueger, A.B. Economic Growth and the Environment. Q. J. Econ. 1995, 110, 353–377. [Google Scholar] [CrossRef]
- Achuo, E.; Kakeu, P.; Asongu, S. Financial development, human capital and energy transition: A global comparative analysis. Int. J. Energy Sect. Manag. 2024, 19, 59–80. [Google Scholar] [CrossRef]


| Author(s) | Periods | Nation(s) | Method(s) | Finding(s) |
|---|---|---|---|---|
| CO2 and REEC | ||||
| [36] | 1979–2019 | G7 countries | ARDL | REEC ↓ CO2 |
| [30] | 1980–2016 | U.S. and China | DARDL | REEC ↓ CO2 |
| [37] | 1990–2018 | 22 well-developed countries | NARDL | REEC ↓ CO2 |
| [31] | 1995–2018 | E∓7 economies | CUP-FM | REEC ↓ CO2 |
| [38] | 2005–2019 | BRI nations | Tapio decoupling | REEC ↓ CO2 |
| [47] | 1980–2019 | MENA nations | IRF | REEC ↓ CO2 |
| [32] | 1997–2017 | U.S. | MMQR | REEC ↓ CO2 |
| [39] | 1980–2017 | China | QQR | REEC ↑ CO2 |
| CO2 and GLOB | ||||
| [14] | 1995–2019 | G7 countries | ARDL | GLOB ↑ CO2 |
| [37] | 1960–2020 | Asian countries | PCSE | GLOB ↑ CO2 |
| [41] | 1991–2022 | BRICS countries | Panel Quantile Regression | GLOB ↓ CO2 |
| [42] | 2000–2020 | Top tourist nations | Panel Regression | GLOB ↓↑ CO2 |
| [12] | 1990–2019 | Somalia | ARDL | GLOB ↑ CO2 |
| [13] | 1992–2019 | 38 countries | DCCE-MG | GLOB ↓ CO2 |
| CO2 and FR | ||||
| [21] | 2003–2018 | 62 countries | Panel Quantile Regression | FR ↓ CO2 |
| [43] | 1980–2016 | 54 developing economies | GMM | FR ↓ CO2 |
| [33] | 2020–2023. | Globe | WLMC | FR ↑ CO2 |
| [44] | 2000–2023 | 87 countries | Panel Analysis | FR ↑ CO2 |
| [38] | 1984–2020 | China | ARDL | FR ↓ CO2 |
| CO2 and EF | ||||
| [45] | 1990–2020 | Sweden | Wavelet tools | EF ↓ CO2 |
| [7] | 1990–2020 | Developed nations | Fourier ARDL | EF ↓ CO2 |
| [34] | 2010–2020 | 120 countries | QR | EF ↓ CO2 |
| [46] | 1995–2019 | Hydrogen-consuming nations | AMG | EF ↓ CO2 |
| Full Name | Measurement | Sources | |
|---|---|---|---|
| CO2 | CO2 emissions | Per Capita | [48] |
| EG | Economic growth | GDP Per Capita USD 2015 | [49] |
| FR | Financial risk | Index | [50] |
| GLOB | Globalization | Index | [51] |
| REEC | Renewable energy consumption | Per Capita (Kwh) | [48] |
| FFE | Fossi fuel efficiency | Author’s Calculation | |
| HC | Human capital | Index | Penn Database |
| CO2 | EG | FR | FFE | GLOB | REEC | HC | |
|---|---|---|---|---|---|---|---|
| M2 | 52.096 *** | 41.709 *** | 11.386 *** | 44.237 *** | 43.397 *** | 29.614 *** | 53.233 *** |
| M3 | 55.301 *** | 44.237 *** | 13.524 *** | 46.897 *** | 46.487 *** | 31.204 *** | 56.773 *** |
| M4 | 59.516 *** | 47.661 *** | 15.270 *** | 50.449 *** | 50.350 *** | 33.417 *** | 61.821 *** |
| M5 | 65.823 *** | 52.838 *** | 16.734 *** | 55.852 *** | 55.925 *** | 36.853 *** | 69.098 *** |
| M6 | 74.573 *** | 60.062 *** | 18.589 *** | 63.376 *** | 63.547 *** | 41.686 *** | 79.032 *** |
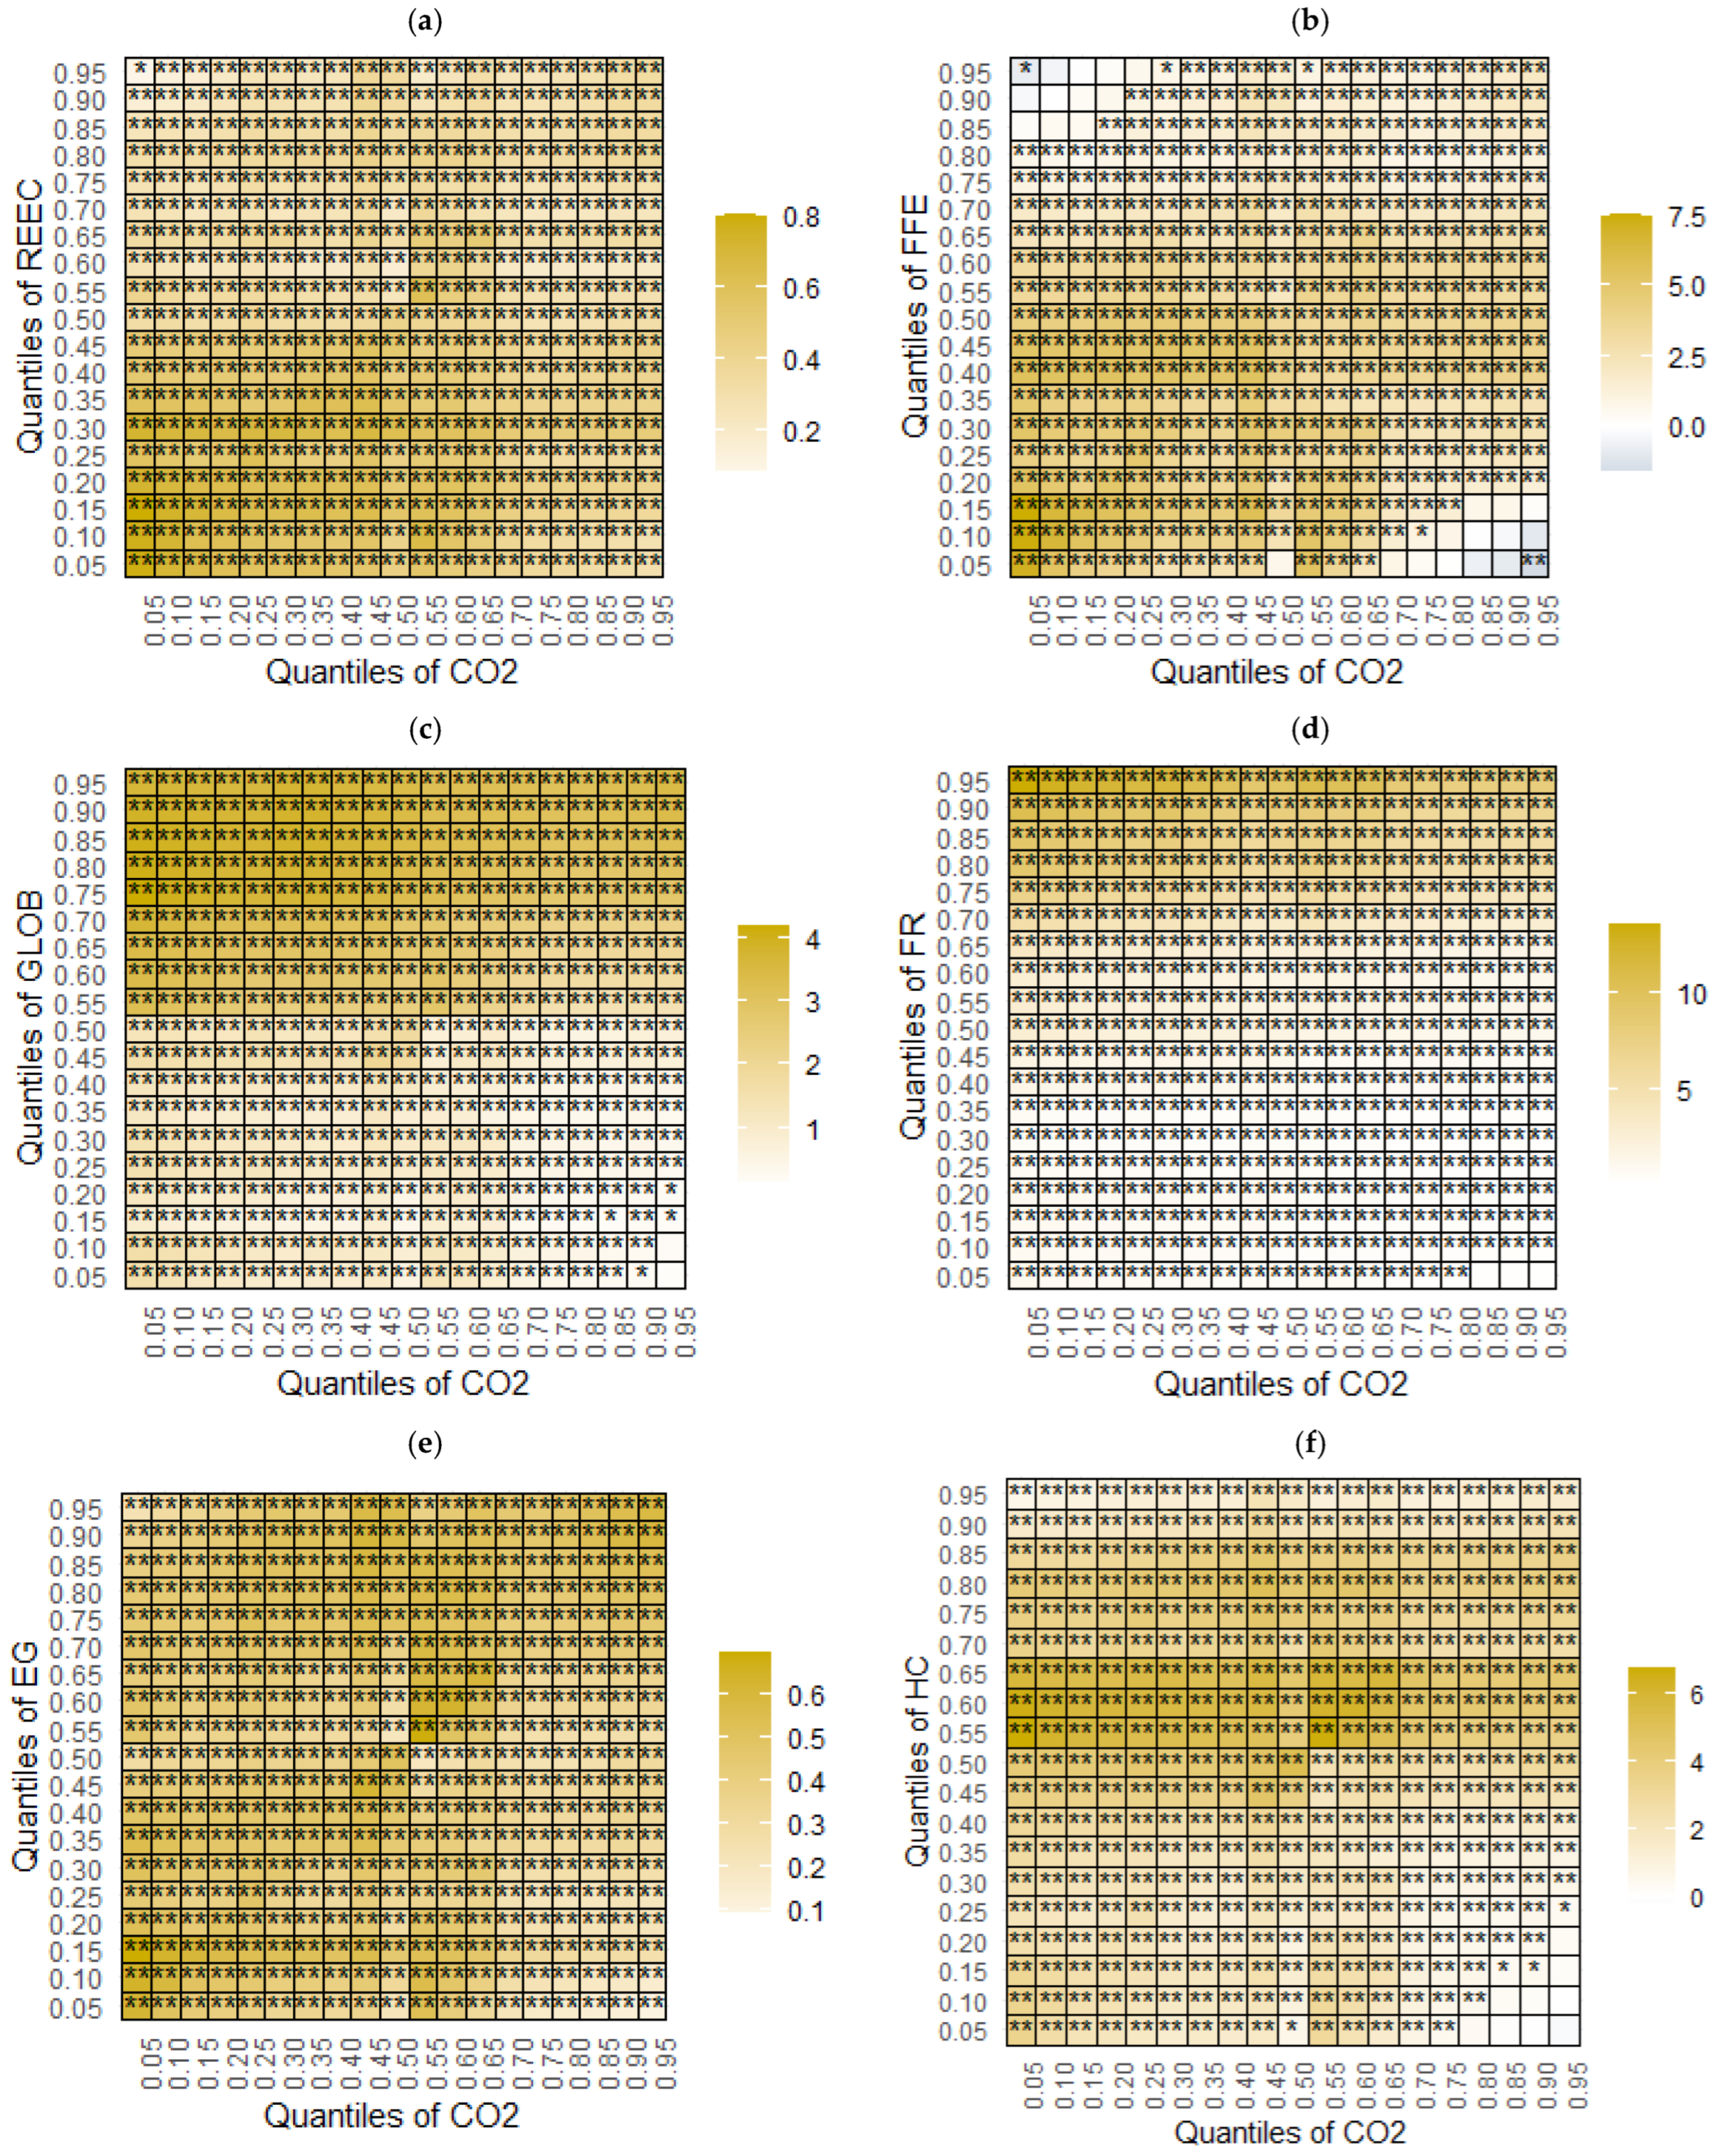
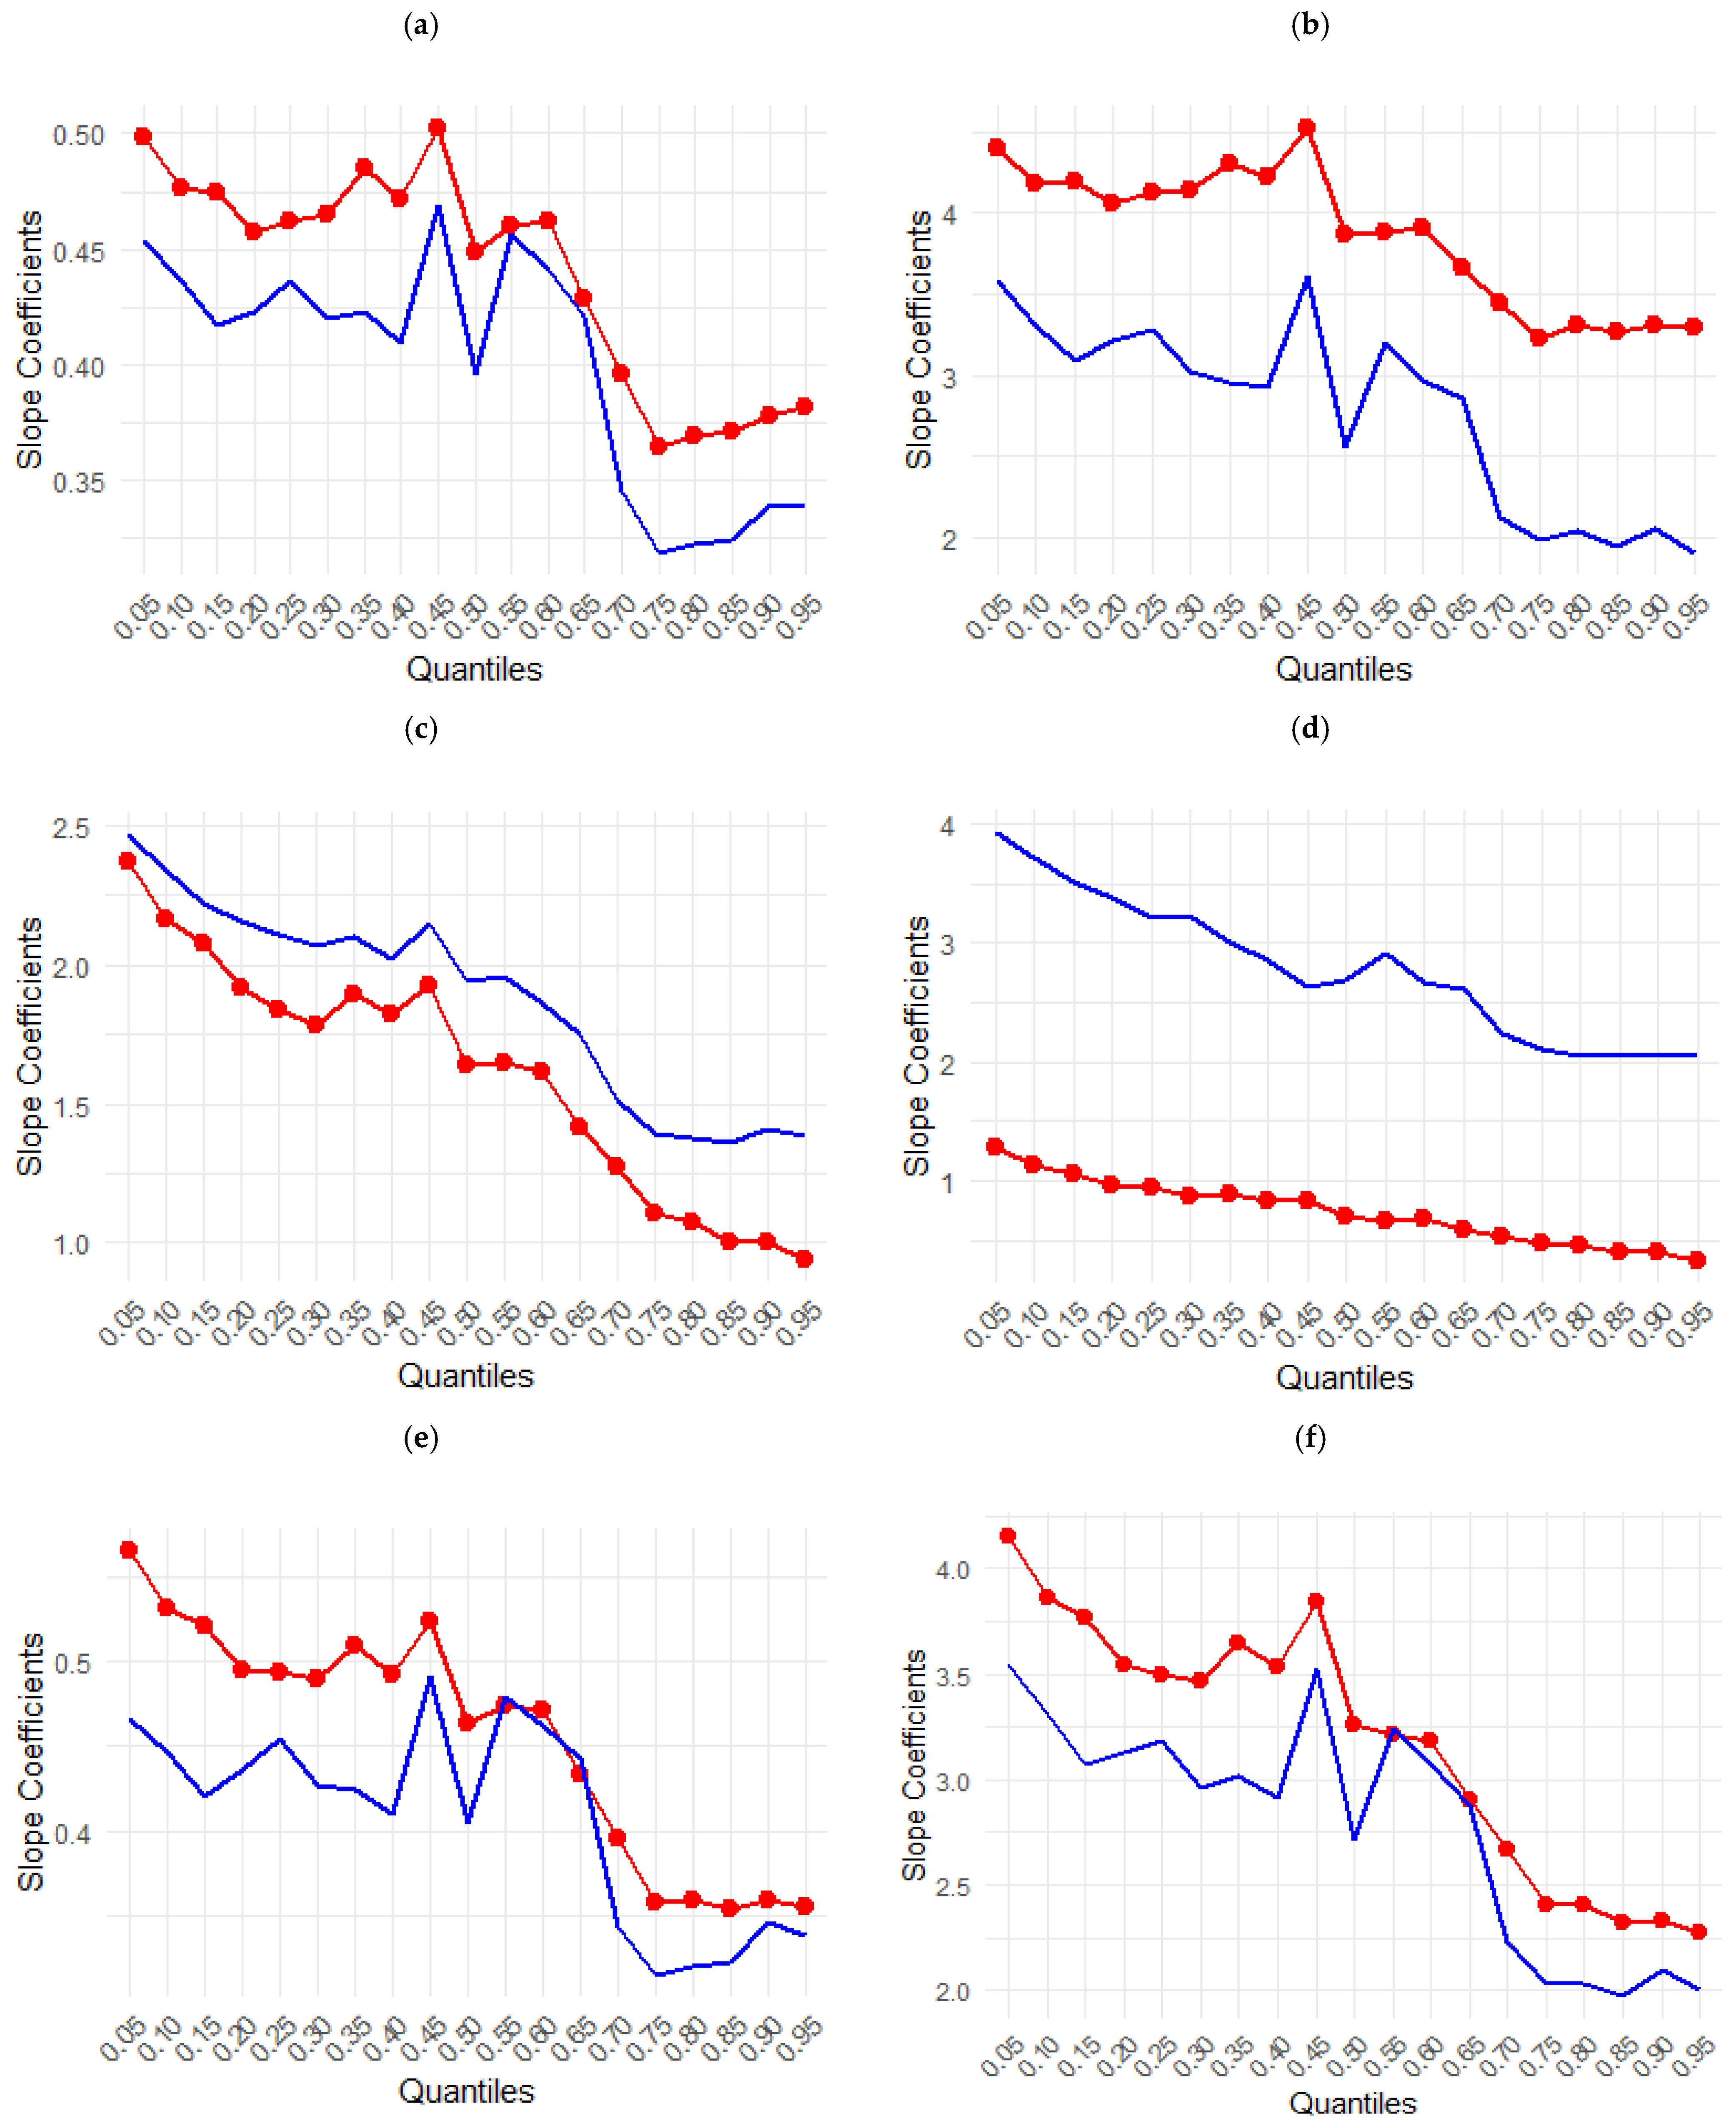
| Figure | Variable | Relationship with CO2 | Significance | Explanation and Interpretation |
|---|---|---|---|---|
| Figure 6a | Renewable Energy Expansion | Positive | Significant across all quantiles | Transitional phase where renewable energy expansion coexists with carbon-intensive infrastructure, leading to increased emissions despite renewable deployment. |
| Figure 6b | Fossil Fuel Efficiency | Positive | Significant, stronger in mid-to-upper quantiles | Reflects Jevons paradox; efficiency gains lower energy costs, increasing fossil fuel use and emissions. |
| Figure 6c | Globalization | Positive | Significant, stronger in higher quantiles | Driven by scale effect of China’s global trade integration, causing higher industrial production and emissions. |
| Figure 6d | Financial Risk | Positive | Significant, strongest in upper quantiles of FR | High financial risk undermines sustainable investments, increasing short-term reliance on carbon-intensive industries. |
| Figure 6e | Economic Growth | Positive | Significant across all quantiles | Energy-intensive growth model consistent with early Environmental Kuznets Curve stage, highlighting the need for sustainable growth policies. |
| Figure 6f | Human Capital | Positive | Significant across all quantiles | Improved human capital increases economic activities dependent on fossil fuels, thereby intensifying emissions without a green energy shift. |
Disclaimer/Publisher’s Note: The statements, opinions and data contained in all publications are solely those of the individual author(s) and contributor(s) and not of MDPI and/or the editor(s). MDPI and/or the editor(s) disclaim responsibility for any injury to people or property resulting from any ideas, methods, instructions or products referred to in the content. |
© 2025 by the authors. Licensee MDPI, Basel, Switzerland. This article is an open access article distributed under the terms and conditions of the Creative Commons Attribution (CC BY) license (https://creativecommons.org/licenses/by/4.0/).
Share and Cite
Nsair, R.; Alzubi, A.B. Globalization, Financial Risk, and Environmental Degradation in China: The Role of Human Capital and Renewable Energy Use. Sustainability 2025, 17, 6810. https://doi.org/10.3390/su17156810
Nsair R, Alzubi AB. Globalization, Financial Risk, and Environmental Degradation in China: The Role of Human Capital and Renewable Energy Use. Sustainability. 2025; 17(15):6810. https://doi.org/10.3390/su17156810
Chicago/Turabian StyleNsair, Ruwayda, and Ahmad Bassam Alzubi. 2025. "Globalization, Financial Risk, and Environmental Degradation in China: The Role of Human Capital and Renewable Energy Use" Sustainability 17, no. 15: 6810. https://doi.org/10.3390/su17156810
APA StyleNsair, R., & Alzubi, A. B. (2025). Globalization, Financial Risk, and Environmental Degradation in China: The Role of Human Capital and Renewable Energy Use. Sustainability, 17(15), 6810. https://doi.org/10.3390/su17156810