Article

The Environmental Impacts of Façade Renovation: A Case Study of an Office Building

Department of Wooden Constructions, Faculty of Wood Sciences and Technology, Technical University in Zvolen, 960 01 Zvolen, Slovakia
*
Author to whom correspondence should be addressed.
Sustainability 2025, 17(15), 6766; https://doi.org/10.3390/su17156766
Submission received: 2 July 2025 / Revised: 21 July 2025 / Accepted: 21 July 2025 / Published: 25 July 2025

Abstract

Renovating existing buildings is a key strategy for achieving the EU’s climate targets, as over 75% of the current building stock is energy inefficient. This study evaluates the environmental impacts of three façade renovation scenarios for an office building at the Technical University in Zvolen (Slovakia) using a life cycle assessment (LCA) approach. The aim is to quantify and compare these impacts based on material selection and its influence on sustainable construction. The analysis focuses on key environmental indicators, including global warming potential (GWP), abiotic depletion (ADE, ADF), ozone depletion (ODP), toxicity, acidification (AP), eutrophication potential (EP), and primary energy use (PERT, PENRT). The scenarios vary in the use of insulation materials (glass wool, wood fibre, mineral wool), façade finishes (cladding vs. render), and window types (aluminium vs. wood–aluminium). Uncertainty analysis identified GWP, AP, and ODP as robust decision-making categories, while toxicity-related results showed lower reliability. To support integrated and transparent comparison, a composite environmental index (CEI) was developed, aggregating characterisation, normalisation, and mass-based results into a single score. Scenario C–2, featuring an ETICS system with mineral wool insulation and wood–aluminium windows, achieved the lowest environmental impact across all categories. In contrast, scenarios with traditional cladding and aluminium windows showed significantly higher impacts, particularly in fossil fuel use and ecotoxicity. The findings underscore the decisive role of material selection in sustainable renovation and the need for a multi-criteria, context-sensitive approach aligned with architectural, functional, and regional priorities.

1. Introduction

The building sector faces significant challenges in meeting the EU’s recommended 2040 climate target, primarily due to the need for substantial reductions in energy consumption and greenhouse gas (GHG) emissions [1]. Buildings worldwide account for considerable energy use and related climate impact [2]. In Europe, the existing building stock is responsible for about 40% of the EU total energy consumption and 36% of the EU total CO2 emissions, whereas 75% of the EU existing building stock is considered energy inefficient. The highest amount of energy used in old buildings derives from the operational stage of their lives (e.g., heating, cooling), resulting in a significant source of carbon emissions with harmful effects on climate change [3]. More than 85% of the EU’s building stock was built before 2001. In Europe, 85–95% of the buildings that exist today will still be standing in 2050 [4]. As part of the transition to a low-emission society, existing building stock needs to be adapted to comply with increasingly strict environmental and energy performance requirements [5]. Thus, the renovation of external envelopes of existing building stock will be an important strategy to reduce environmental impact [6] and energy consumption during the operational stage. Moreover, the refurbishment increases the service life of the buildings; therefore, it is also essential to consider the overall environmental impacts associated with the use of construction materials characterised by low embodied energy and reduced environmental impact.
To achieve the 2040 climate target in the EU, a life cycle approach analysis is being practised. A life cycle assessment (LCA) is a versatile tool that quantifies the potential environmental impact of a product, or a service throughout its entire life cycle according to ISO 14040: 2006 [7] and ISO 14044: 2006 [8] standards, which supports the climate targets through emission hot-spot monitoring and identification. This contributes to the creation and implementation of climate-neutral innovations as well as policy and design regulations. The application of the life cycle assessment (LCA) methodology in the construction sector is continually increasing and is being used for the evaluation of construction materials as well as new and renovated buildings. In the field of environmental impacts of building renovations, several important review studies have been conducted [6,9,10]. The analysed studies examined environmental impacts and energy performance. According to Bragadin et al. [11], the overall environmental impact of building renovation is significantly lower than that of demolition, which is primarily due to the large amount of waste generated during new construction processes or demolitions. Comparable outcomes regarding life cycle cost analysis were reported by Rabani et al. [12] as well. Moreover, Bragadin et al. [13] claim the demolition of the existing building should add a greater amount of impact to the retrofitting process, but the possibility of reusing demolished building materials and components needs to be assessed, as it may be of importance in the final balance of impacts. In contrast, Chandrasekaran et al. [14] indicate that the overall impact on climate change associated with the renovation process, even when accounting for the use of new construction materials, is less significant. When comparing the renovation scenario with that of constructing a new building, the results of the study by Hasik et al. [15] suggest that renovation plays a significant role in reducing environmental impacts. The case study showed significant reductions across six different environmental impact categories when the renovation was compared to a new construction scenario. The studies by Berg and Fuglseth [5], and Wrålsen et al. [16] demonstrate that a careful refurbishment of the building stock is favourable from a climate change mitigation perspective. The studies indicate that material use, and user behaviour have a crucial impact on greenhouse gas emissions throughout the life cycle.
According to Schaubroeck et al. [17], and Huuhka et al. [18], the timing of the decision regarding the renovation of buildings—whether to renovate or to replace them—is also an important factor. Due to the higher material consumption associated with new building, construction will typically result in significantly higher CO2 emissions compared to renovation. However, the operational energy efficiency of a renovated building may not always fully match that of a newly constructed one. Consequently, the option with lower CO2 emissions may vary over time. Although a renovated building generally exhibits lower emissions in the early stages, a newly constructed building may eventually reach or surpass this performance [18,19]. Therefore, over time, the option with the lower environmental impact in terms of CO2 emissions—whether it is the renovation of the original building or the construction of a new one—may vary.
Building renovation has significant potential to reduce energy consumption [20]. According to Mišík and Oravcová [21], in Central and Eastern Europe, the renovation of older buildings primarily focuses on insulating external walls and replacing windows. The thermal insulation of external walls has a positive impact on the energy efficiency of building stock. Kamel and Memari [22] highlighted that retrofitting the building envelope can lead to substantial reductions in energy consumption and operational costs, emphasizing its importance in sustainable renovation strategies. The economic advantages of insulating older buildings are substantial. Research by Sojkova [23] reported that a comprehensive retrofit can lower energy expenditures by up to 40%. A second key theme emerging from the literature on energy efficiency related to insulation is window replacement. Although highly glazed façades can reduce lighting costs, they tend to increase heating and cooling demands [24]. Therefore, window size must be carefully optimised, and the orientation of the walls plays a crucial role. Conversely, windows can contribute to passive solar energy gains during the winter months, while the strategic use of shading devices can enhance energy efficiency throughout the entire year [25]. In the case of architecturally significant buildings, it is important to consider the overall character of the structure and, in the context of building envelope renovation, to ensure the preservation of the exterior appearance and original architecture—particularly in relation to windows.
In recent years, the application of life cycle assessment (LCA) in the building sector has expanded significantly, enabling more accurate evaluations of environmental impacts associated with construction and renovation processes. However, the increasing complexity of LCA outputs—often involving a dozen or more impact categories—poses challenges for interpretation and decision-making. While several studies have emphasised the importance of multi-criteria approaches in sustainable building design [26], there remains a lack of unified, intuitive tools for aggregating diverse environmental indicators into a single, comparable metric [27]. To address this gap, this study introduces a composite environmental index (CEI), developed to synthesise normalised and weighted LCA results into a single score. This approach supports a more transparent and context-sensitive evaluation of façade renovation scenarios and aligns with current recommendations from the EU Environmental Footprint methodology [28].
The paper investigates the environmental impacts of different renovation scenarios for the external façade of the main office building at the Technical University in Zvolen (Slovakia) using a life cycle assessment (LCA) approach. It evaluates three alternative solutions (scenarios A–C) for insulating and replacing external wall openings, focusing on selected environmental indicators. The analysis covers abiotic depletion (elements and fossil fuels), global warming potential, ozone depletion, human toxicity, ecotoxicity (freshwater, marine, terrestrial), photochemical ozone creation, acidification, eutrophication, and primary energy use (renewable and non-renewable) during the B5 life cycle stage. The scenarios compare different insulation materials—glass wool (scenario A), wood-fibre (scenario B), and mineral wool (scenario C)—paired with aluminium (A–1, B–1, C–1) or wood–aluminium (A–2, B–2, C–2) window frames. Two façade design options are also assessed: stone and wood cladding (scenarios A and B) versus an ETICS system with exterior render (scenario C). To support an integrated comparison, a composite environmental index (CEI) is introduced, aggregating multiple impact categories into a single weighted score to evaluate overall environmental performance.

2. Materials and Methods

2.1. Research Office Building

The case study office building of the Technical University is located in the city of Zvolen, in central Slovakia. The building was designed by the prominent Slovak architect Vladimír Dedeček during the early 1970s. The office building accommodates office spaces for teachers and researchers, as well as laboratories and classrooms. Apart from the partial replacement of window glazing, the building has not been subject to any significant refurbishment or structural modernisation to date. As the primary source of data, the study utilised the renovation project of the Technical University in Zvolen. The project under investigation originated in 2024. The primary structural framework of the building is composed of reinforced concrete. The external envelope, including the window-bearing walls, is constructed from perforated clay bricks. The building is partially fitted with aluminium windows with double insulating glazing in operable sections, and original aluminium windows with single glazing supplemented by additional external glazing in fixed sections. No supplementary thermal insulation has been applied to the building envelope. Perforated bricks are additionally employed as a secondary internal masonry layer, functioning as poor thermal insulation for the reinforced concrete side walls. The geometric characteristics of the building are presented in Table 1.
Figure 1 shows the office building of the Technical University in Zvolen prior to its renovation. Currently, the building lacks the characteristic architectural feature of the façade—the brise-soleils—which, along with the sandstone cladding, had to be removed due to their critical structural condition.

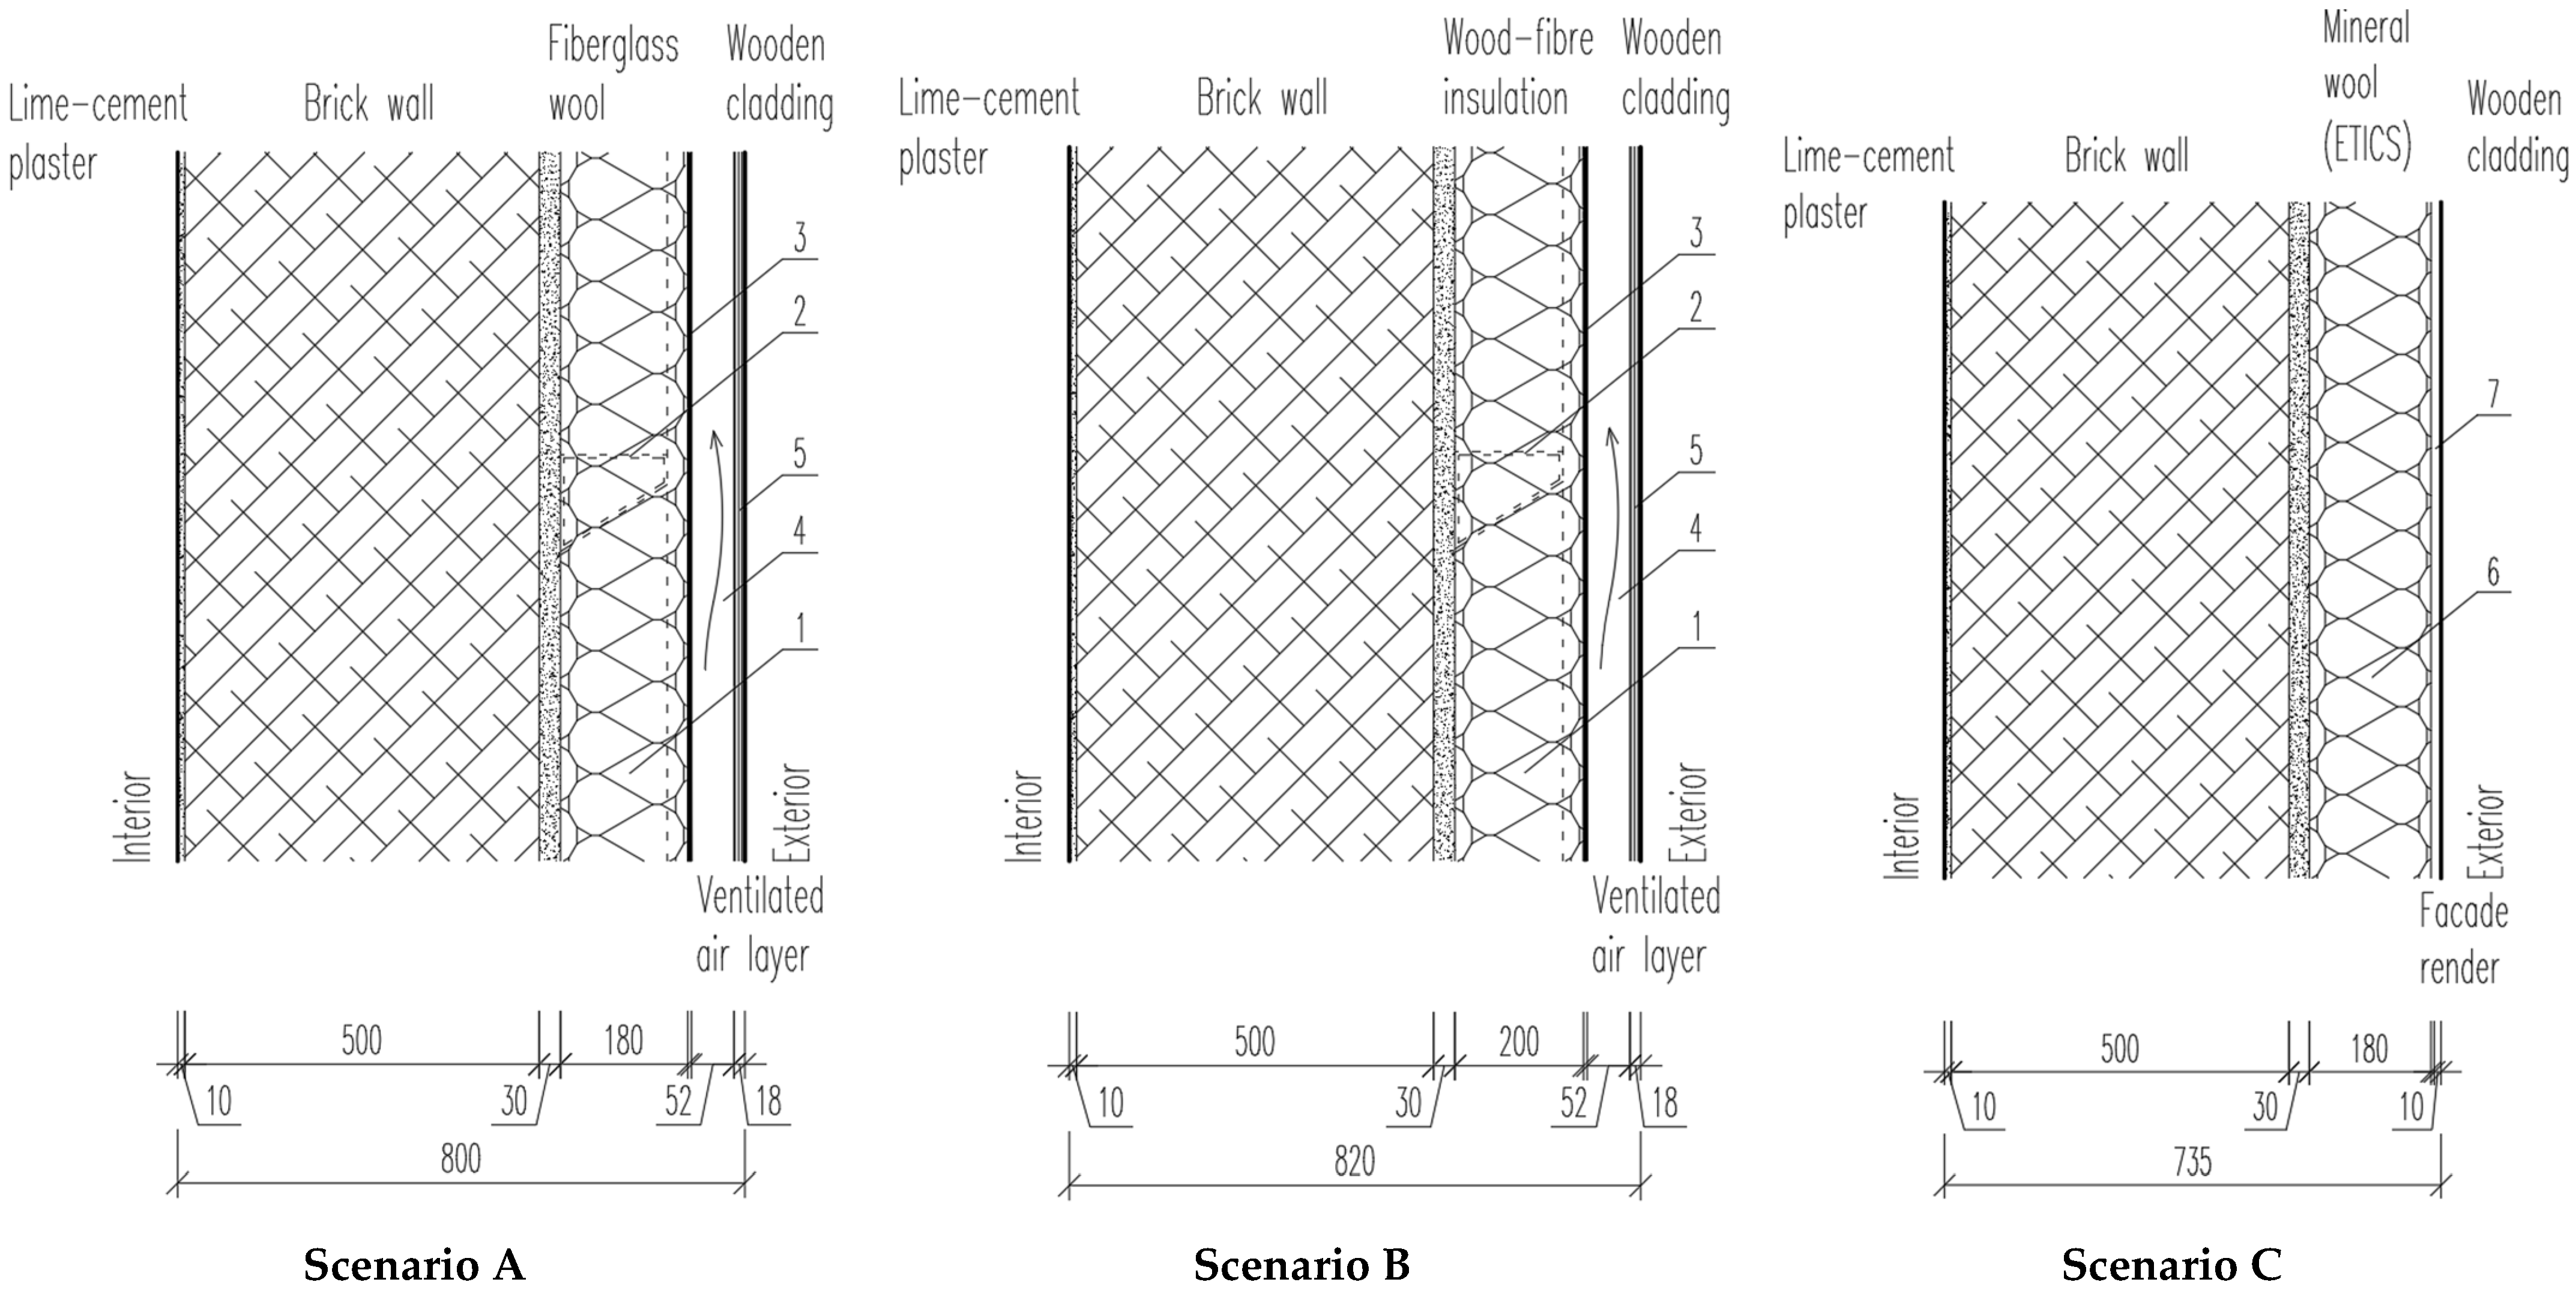
2.2. Scenarios Analysed

As part of the study, three variants of external wall assemblies of the university office building were compared (Table 2, Figure 2). In the first alternative (scenario A), the original design of the external wall assemblies was considered, based on the documentation of the approved reconstruction project. Within the scope of the building’s external wall renovation, glass wool insulation is proposed with a thickness of 160 mm for brick walls containing windows, and 180 mm for concrete side walls. Based on architectural requirements, the façade finish after renovation must replicate the original appearance. The renovated façade will include wooden cladding made of Siberian spruce with a translucent stain finishing on the wall containing windows, and sandstone cladding on the side walls (scenarios A and B). As part of the renovation, the original aluminium windows will be replaced with modern thermally broken aluminium windows equipped with triple insulation glazing. Within scenario A, two alternatives for window infills are considered: aluminium (scenario A–1) and wood–aluminium (scenario A–2) frames with triple glazing.
Scenario B considers an alternative thermal insulation solution based on wood fibre. The insulation thickness is 180 mm on brick walls with windows and 200 mm on side concrete walls. Due to the higher thermal conductivity of wood-fibre insulation compared to mineral wool, these thicknesses were selected to maintain equivalent thermal insulation performance of the renovated wall, in accordance with [29]. The aim of this alternative design is to compare the environmental impacts of using a natural insulation material. Within scenario B, two alternatives for window infills are considered: aluminium (scenario B–1) and wood–aluminium (scenario B–2) frames with triple glazing. The wall assemblies for scenario A and scenario B are shown in Table 2 and Figure 2.
Scenario C assumes the use of an external thermal insulation composite system (ETICS) with a façade render, without any external cladding. Similar to the previous scenarios, scenario C considers two alternatives for window infills: aluminium frames (scenario C–1) and wood–aluminium frames (scenario C–2), both with triple glazing. The wall assembly for scenario C is shown in Table 2 and Figure 2.
To improve the comparability of the renovation scenarios, Table 2 summarises the key characteristics of each variant. Furthermore, although the study focuses on three main design alternatives derived from the approved reconstruction project, future research should consider additional influencing factors such as building orientation, user behaviour, local climate conditions, and material availability. These secondary factors may significantly affect the environmental performance of renovation strategies and should be systematically analysed to support broader generalisation and decision-making.
Scenario A represents the architecturally approved design for the façade renovation of an office building. To comparing environmental impacts, we selected an alternative configuration (scenario B) utilising wood-fibre thermal insulation, under the hypothetical assumption that it has a lower embodied energy than mineral wool. A third alternative (scenario C), which contrasts with the previous two, features an external thermal composite system (ETICS) with mineral wool and a rendered façade, assumed to have the lowest environmental impact. The aim is to compare key construction materials (as presented in Table 2), insulation types (mineral wool vs. wood fibre), façade types (cladding vs. render), and window infill constructions (aluminium vs. wood–aluminium). The investigated wall assemblies are shown in Figure 2.
Table 3 presents the thermal and technical properties of the external wall assemblies for scenarios A–C. Each alternative wall assembly (scenarios B and C) was designed to achieve approximately the same thermal transmittance (U-value) as the approved assembly in scenario A. The calculations of thermal and technical properties were carried out in accordance with STN 73 0540–2 [29].
Table 4 presents energy performance indicators before and after the renovation of the building envelope of the studied office building. In designing each scenario, the thickness of the thermal insulation (relate to scenario B) was selected to achieve a comparable thermal transmittance value (U-value). The table displays energy performance indicators for the least favourable scenario (scenario B), as the differences in individual indicators for scenarios A and C are negligible.
Based on Table 4, the reduction in heating energy demand after the proposed improvements is 78.31% for scenario A, 77.79% for scenario B, and 78.05% for scenario C.

2.3. Methodology of the Study

The aim of the study is to quantify three alternative construction solutions (scenarios A–C) for façade renovation (including insulation and replacement of external wall openings) of an office building, with a focus on selected environmental aspects and energy performance (in terms of primary energy resources).
In the research, LCA methodology was used to evaluate the environmental impacts associated with the building façade renovation solutions. The analysis was caried out using SimaPro Craft Analyst 10.2.0.0 software [30], developed by PRé Sustainability in The Netherlands. The LCA database ecoinvent 3.10 [31] was applied as the background source of input data for the life cycle inventory phase. The study of the office building renovation was carried out following the guidelines recommended in the European standards series—ISO 14040 [7], ISO 14044 [8] and EN 15804 [32].
The functional unit is defined as 1 m2 of façade, which allows for consistent comparison and quantification of environmental impacts per square meter of the building envelope. The total façade area considered in the analysis is 9,545.1 m2 (Table 1). Material quantities were obtained from construction documentation. Reference study period is not applicable since only part of stage B5 is considered. Figure 3 represents the detailed schematic diagram of system boundaries for life cycle assessment (LCA) evaluation.

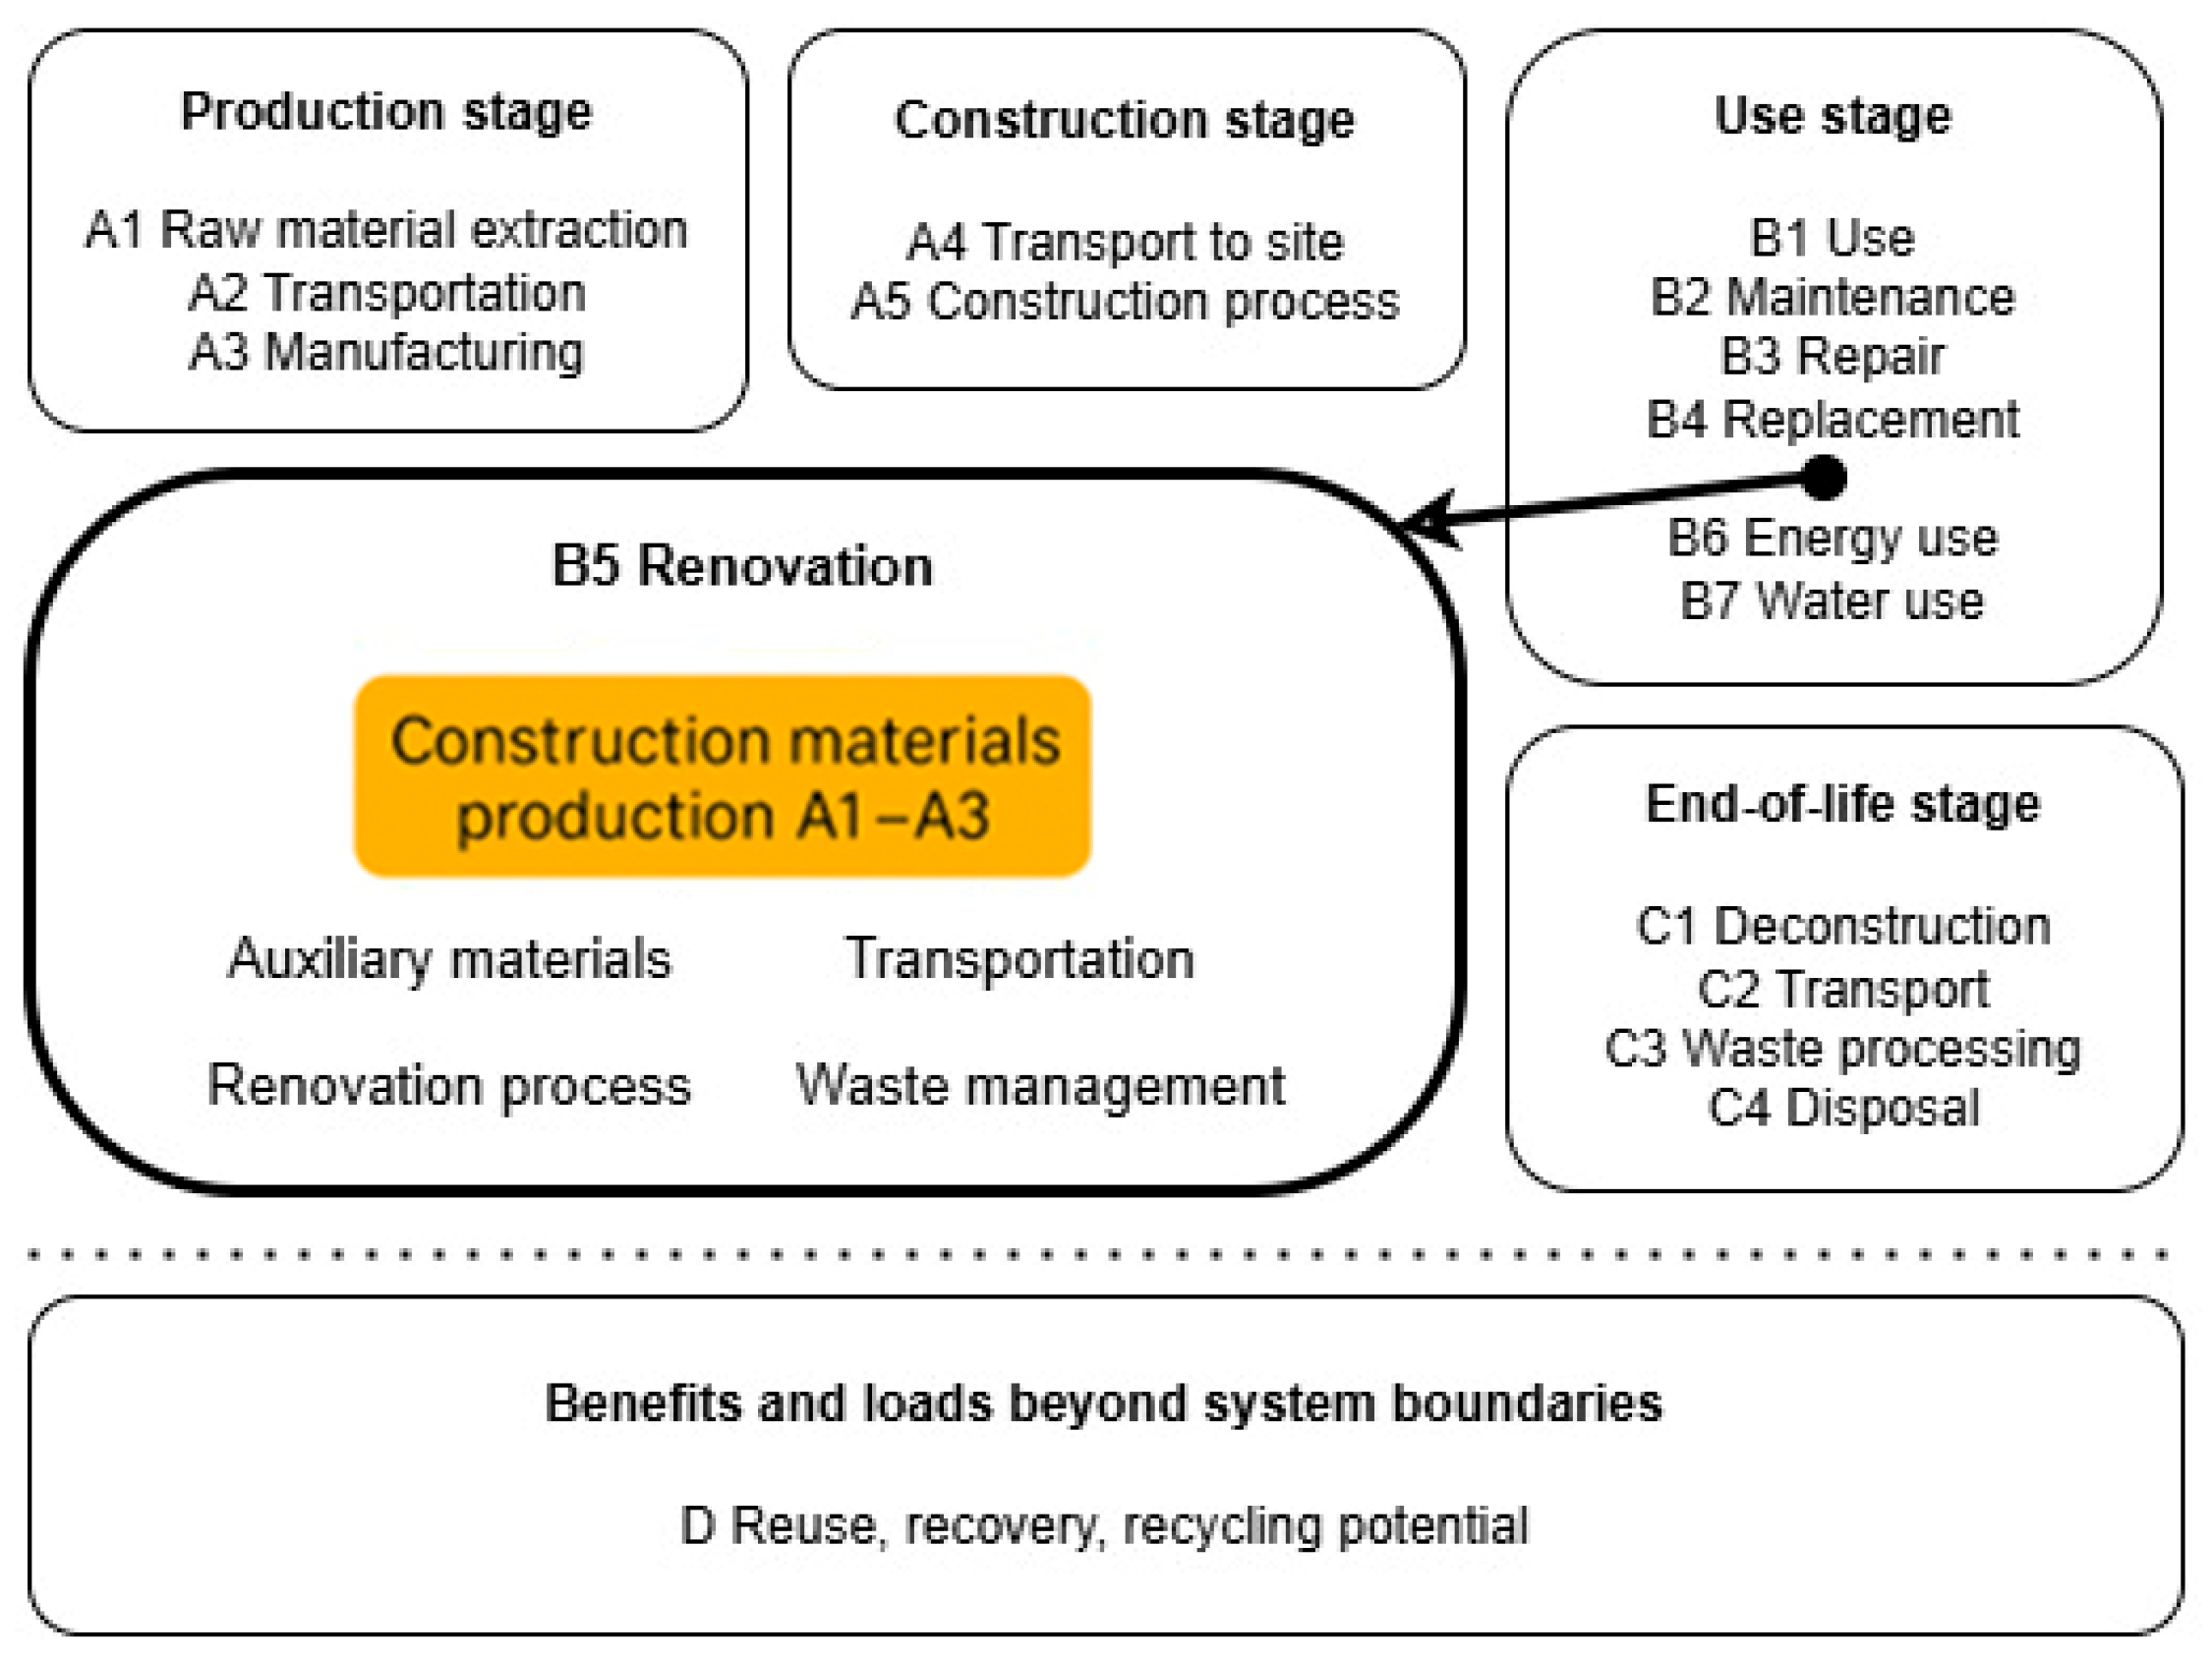
2.3.1. Life Cycle Inventory

The baseline inventory and process-specific data were sourced from the officially approved renovation documentation. The considered construction materials and components include the primary materials utilised during the renovation process.
Table 5 presents the construction materials for the renovation of the office building’s external wall assemblies for the three analysed scenarios (A–C), along with their total quantities and masses.

2.3.2. Life Cycle Impact Assessment

The study quantified the environmental impact categories—abiotic depletion of elements (ADE) and fossil fuels (ADF); global warming potential (GWP); ozone depletion potential (ODP); human toxicity (HT); freshwater aquatic ecotoxicity (FAE); marine aquatic ecotoxicity (MAE); terrestrial ecotoxicity (TE); photochemical ozone creation potential (POCP); acidification potential (AP); and eutrophication potential (EP)—as well as renewable and non–renewable primary energy indicators (PERT and PENRT), within the B5 life cycle stage for the assessed renovation scenarios. Table 6 presents the environmental impact categories, along with their definitions and corresponding units.

2.3.3. Proposal of an Integrated Evaluation Framework—Composite Environmental Index (CEI)

To compare the environmental burden associated with a particular scenario, a composite environmental index (CEI) is proposed. This index reflects a custom-built model developed by our team to integrate multiple indicators into a single composite score. The CEI is based on the addition of three key variables reflecting the relative values of impact category, normalisation, and mass results, each given the same weighting factor, assuming that all three dimensions contribute equally to the overall environmental performance.
The CEI was calculated using the following equation:
C E I s c e n a r i o   x = j = 1 n I C i I C i , m a x + N i N i , m a x + m i m i , m a x
where CEIscenario x refers to the composite environmental index of a particular scenario; n represents a total number of impact categories included in the analysis; ICi stands for the value from individual impact category characterisation within the selected scenario; ICi,max represents the maximum value of characterisation in a given impact category. The same logic is reflected in the test variables, where N represents the values of normalisation and m stands for the mass of construction materials of the selected scenarios. The variables capture a distinct aspect of environmental performance, providing a holistic evaluation of assessed burdens.

3. Results

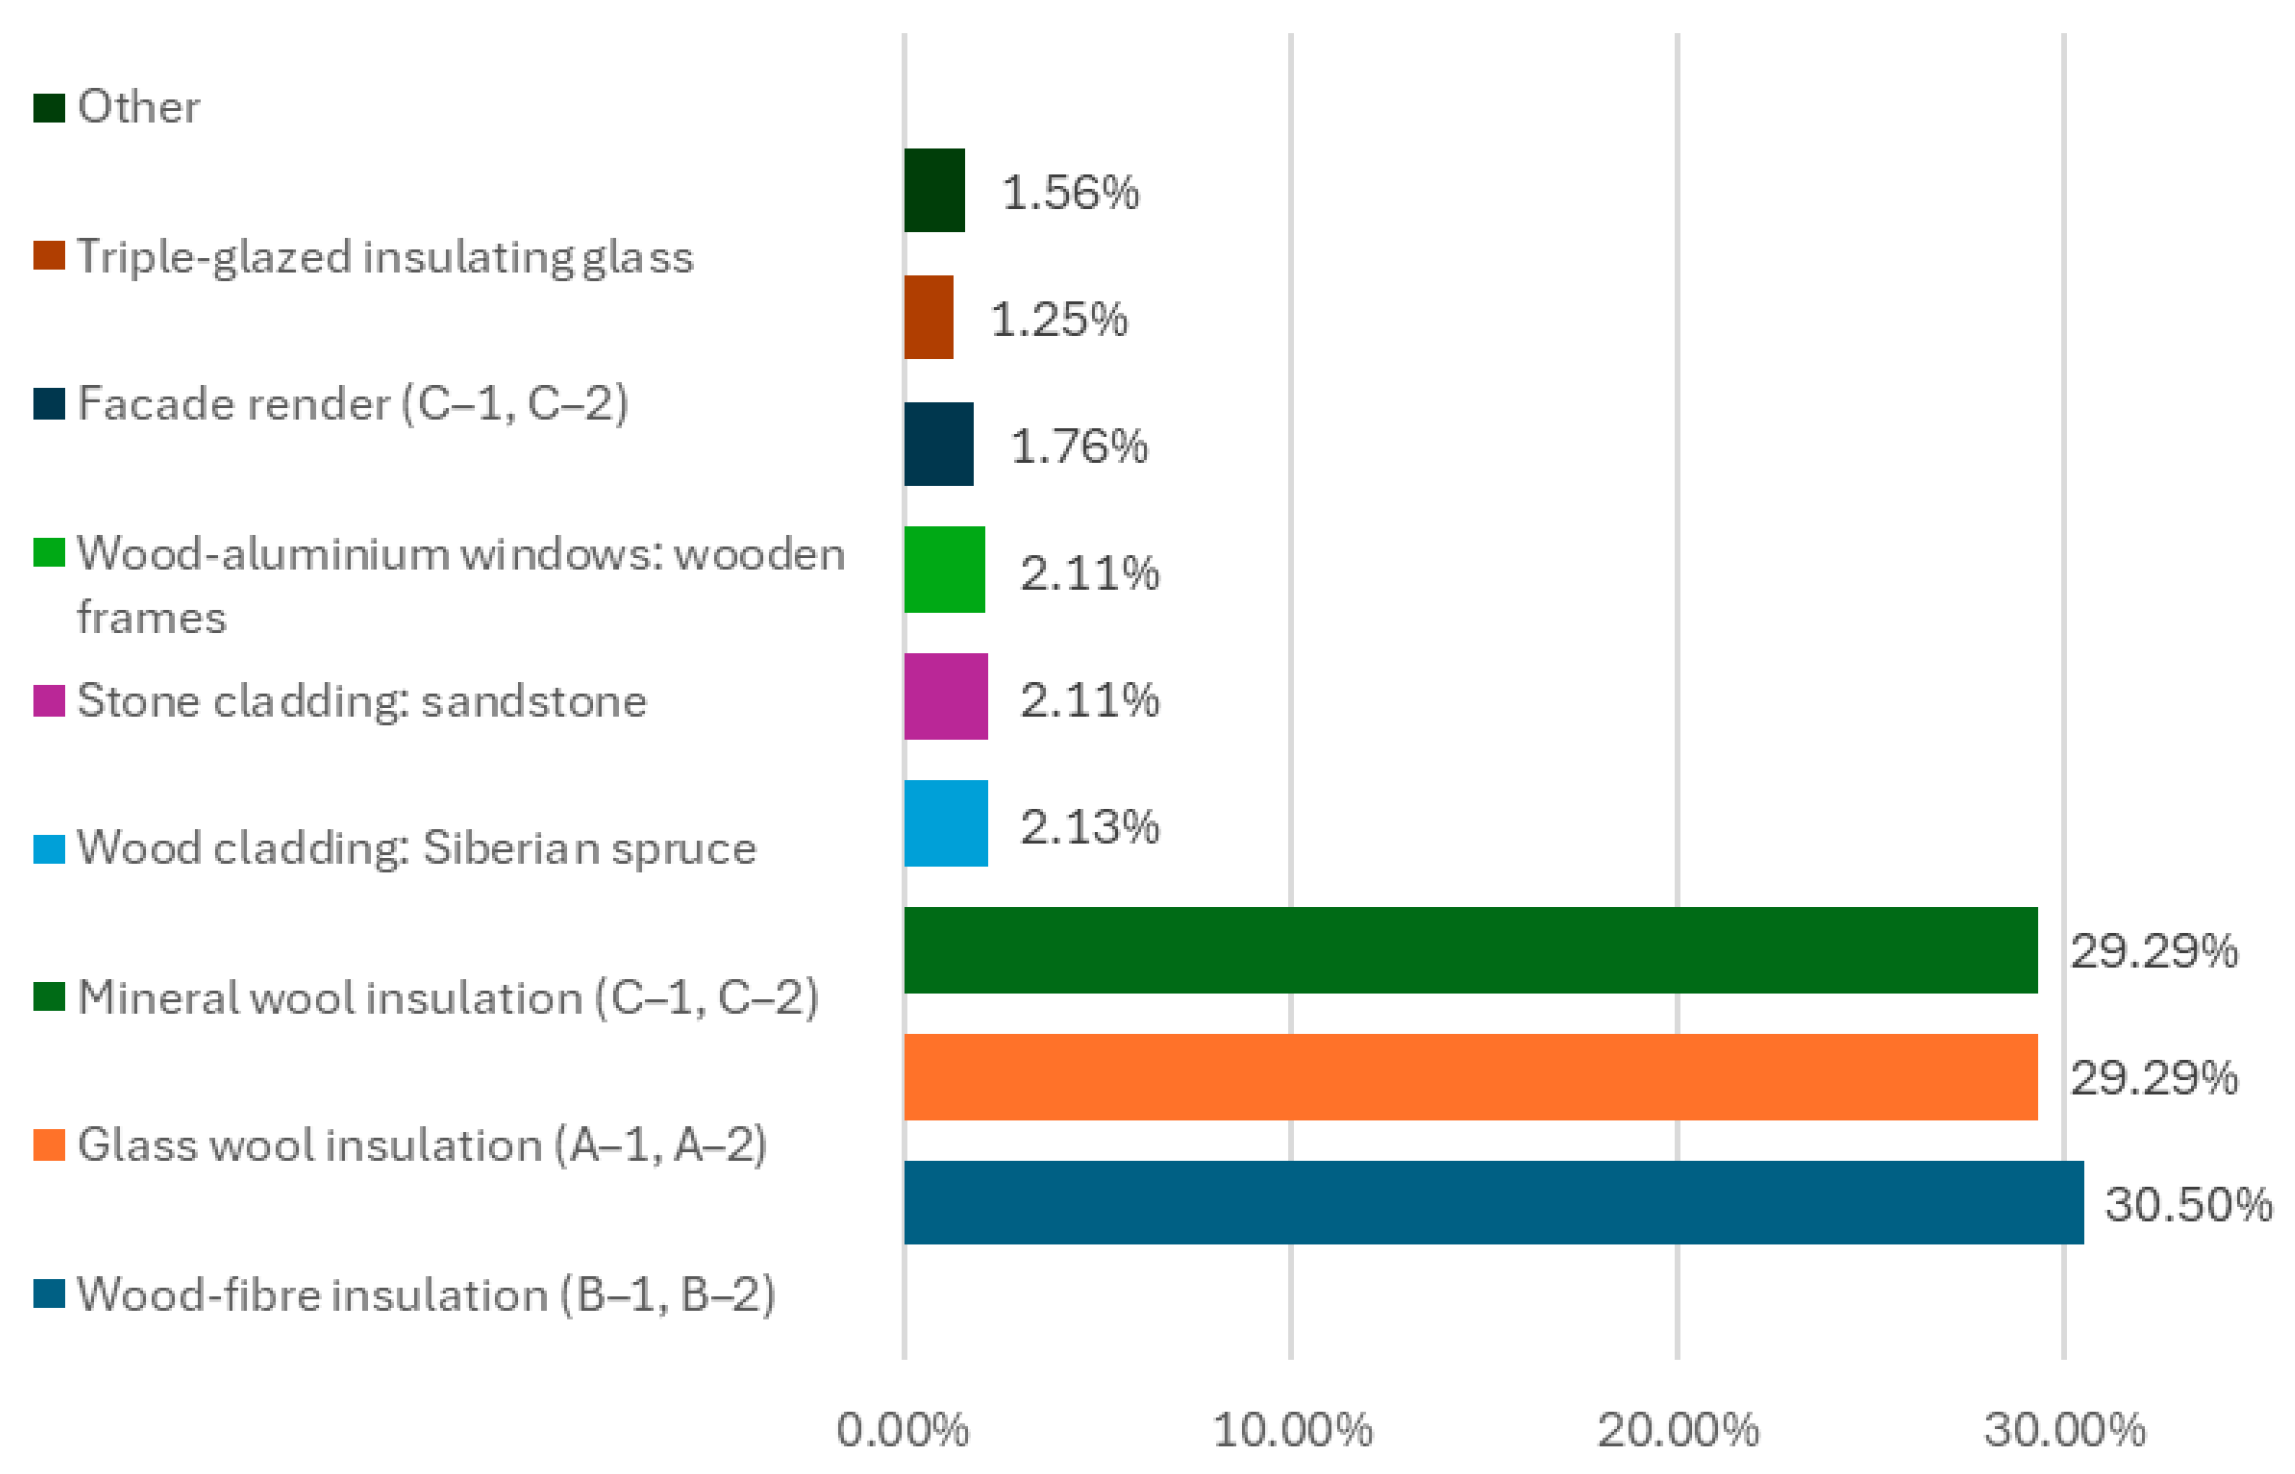
3.1. Mass and Volumetric Distribution of Materials

At the initial stage, the percentage distribution by mass of construction materials was assessed for each scenario (Figure 4). Sandstone façade cladding accounts for the highest proportion of materials in scenarios A–1 (36.59%) and B–1 (30.20%), whereas in scenario C–1, thermal insulation (34.72%) followed by façade render (25.48%) constitute the largest shares. Triple-glazed insulation glass (23.49%) and steel substructure and fastening elements (16.93%) were the second and third heaviest (scenarios A–1), respectively. In scenario B–1, wood-fibre insulation (19.70%) and triple-glazed insulation glass (19.39%) represented the second and third heaviest material components, respectively.
In the scenarios featuring wood–aluminium windows (Figure 5), the materials with the highest percentage by weight were sandstone cladding (35.98%), triple-glazed insulation glass (23.10%), and steel fastening elements (16.65%), respectively (scenario A–2). In scenario B–2, the largest share is represented by sandstone cladding (29.78%), followed—similar to scenario B–2—by wood-fibre insulation (19.70%), with triple-glazed insulation glass ranking third (19.12%). In scenario C–2, thermal insulation (34.72%) followed by façade render (25.01%) constitute the largest portion. The triple-glazed insulation glass in scenario C–2 ranks third, accounting for 25.73%.
Figure 6 shows the volume of individual construction materials for each scenario (A–C), sorted in ascending order. The largest volume is occupied by wood-fibre thermal insulation (scenario B), followed by glass wool (scenario A), mineral wool (scenario C), and wooden façade cladding (scenarios A and B).

3.2. Influence of Window Type

When comparing three types of façades (scenarios A–C)—each featuring two window variants—the results reveal a consistent trend: wood–aluminium windows tend to have a more environmentally favourable profile than pure aluminium windows. This is particularly evident in impact categories such as ADF, GWP, ODP, FAE and MAE, POCP, AP, and EP. Additionally, wood–aluminium windows demonstrate a higher use of primary renewable energy (PERT) and a lower reliance on primary non-renewable energy (PENRT) sources. In categories ADE, HT, and TE, the influence of window type on the overall environmental impact appears to be marginal. The characterisation results of the assessment for each scenario (A–C) of façade renovation are shown in Appendix A, Table A1. Figure 7 presents a percentage of environmental impact comparison of the studied scenarios.

3.3. Influence of Façade Type

Among the three façade types analysed, the first (Figure 7)—featuring mineral insulation (scenarios A–1 and A–2)—stands out with the highest environmental impact in the ADE category and across all four toxicity-related categories. In contrast, the façade using wood-fibre insulation (scenarios B–1 and B–2) shows the most significant impact in the categories of ADF, GWP, ODP, POCP, AP, EP, and in both primary energy indicators (renewable and non–renewable).
The contact façade system (scenarios C–1 and C–2) emerges as the most environmentally favourable option across all assessed categories. When paired with wood–aluminium windows (scenario C–2), its performance becomes particularly striking—achieving more than a 70% reduction in environmental impact in categories such as ADE, ODP, TE, and PERT (Figure 7). The reductions exceed 60% in the areas of ADF, GWP, FAE, POCP, EP, and PENRT. In the AP category, a decrease of 55% is observed, while HT and MAE show improvements of more than 40%. Characterisation results of the assessment for each scenario (A–C) of façade renovation are shown in Appendix A, Table A1.

3.4. Normalisation Results

Normalisation puts selected environmental impact categories into perspective by comparing them to a reference value. In this study, the reference value for normalisation refers to the overall environmental impact of European citizens of 25 countries per capita and year. This helps us to understand the relative importance of each impact category. As shown in Figure 8, scenario C–2 performs the best in nearly all categories except for ADE, where scenario C–1 scores. However, the difference between ADE, HT and TE categories remains very close. On the other hand, scenarios A–1 and B–1 often appear as the worst options with the highest environmental burden. Scenario A–1 shows the highest impact in four categories—MAE, TE, FAE, and HT. ADE is mostly affected by scenario A–2 but compared to the latter, the difference remains negligible. Scenario B–1 is the worst in six categories—ADF, GWP, POCP, AP, EP, and ODP. The biggest differences are visible in categories such as MAE, TE and FAE, suggesting high sensitivity to changes in the technologies, processes or inputs that the individual scenarios represent. Overall, most of the impact is associated with toxicity parameters, especially in the MAE category.

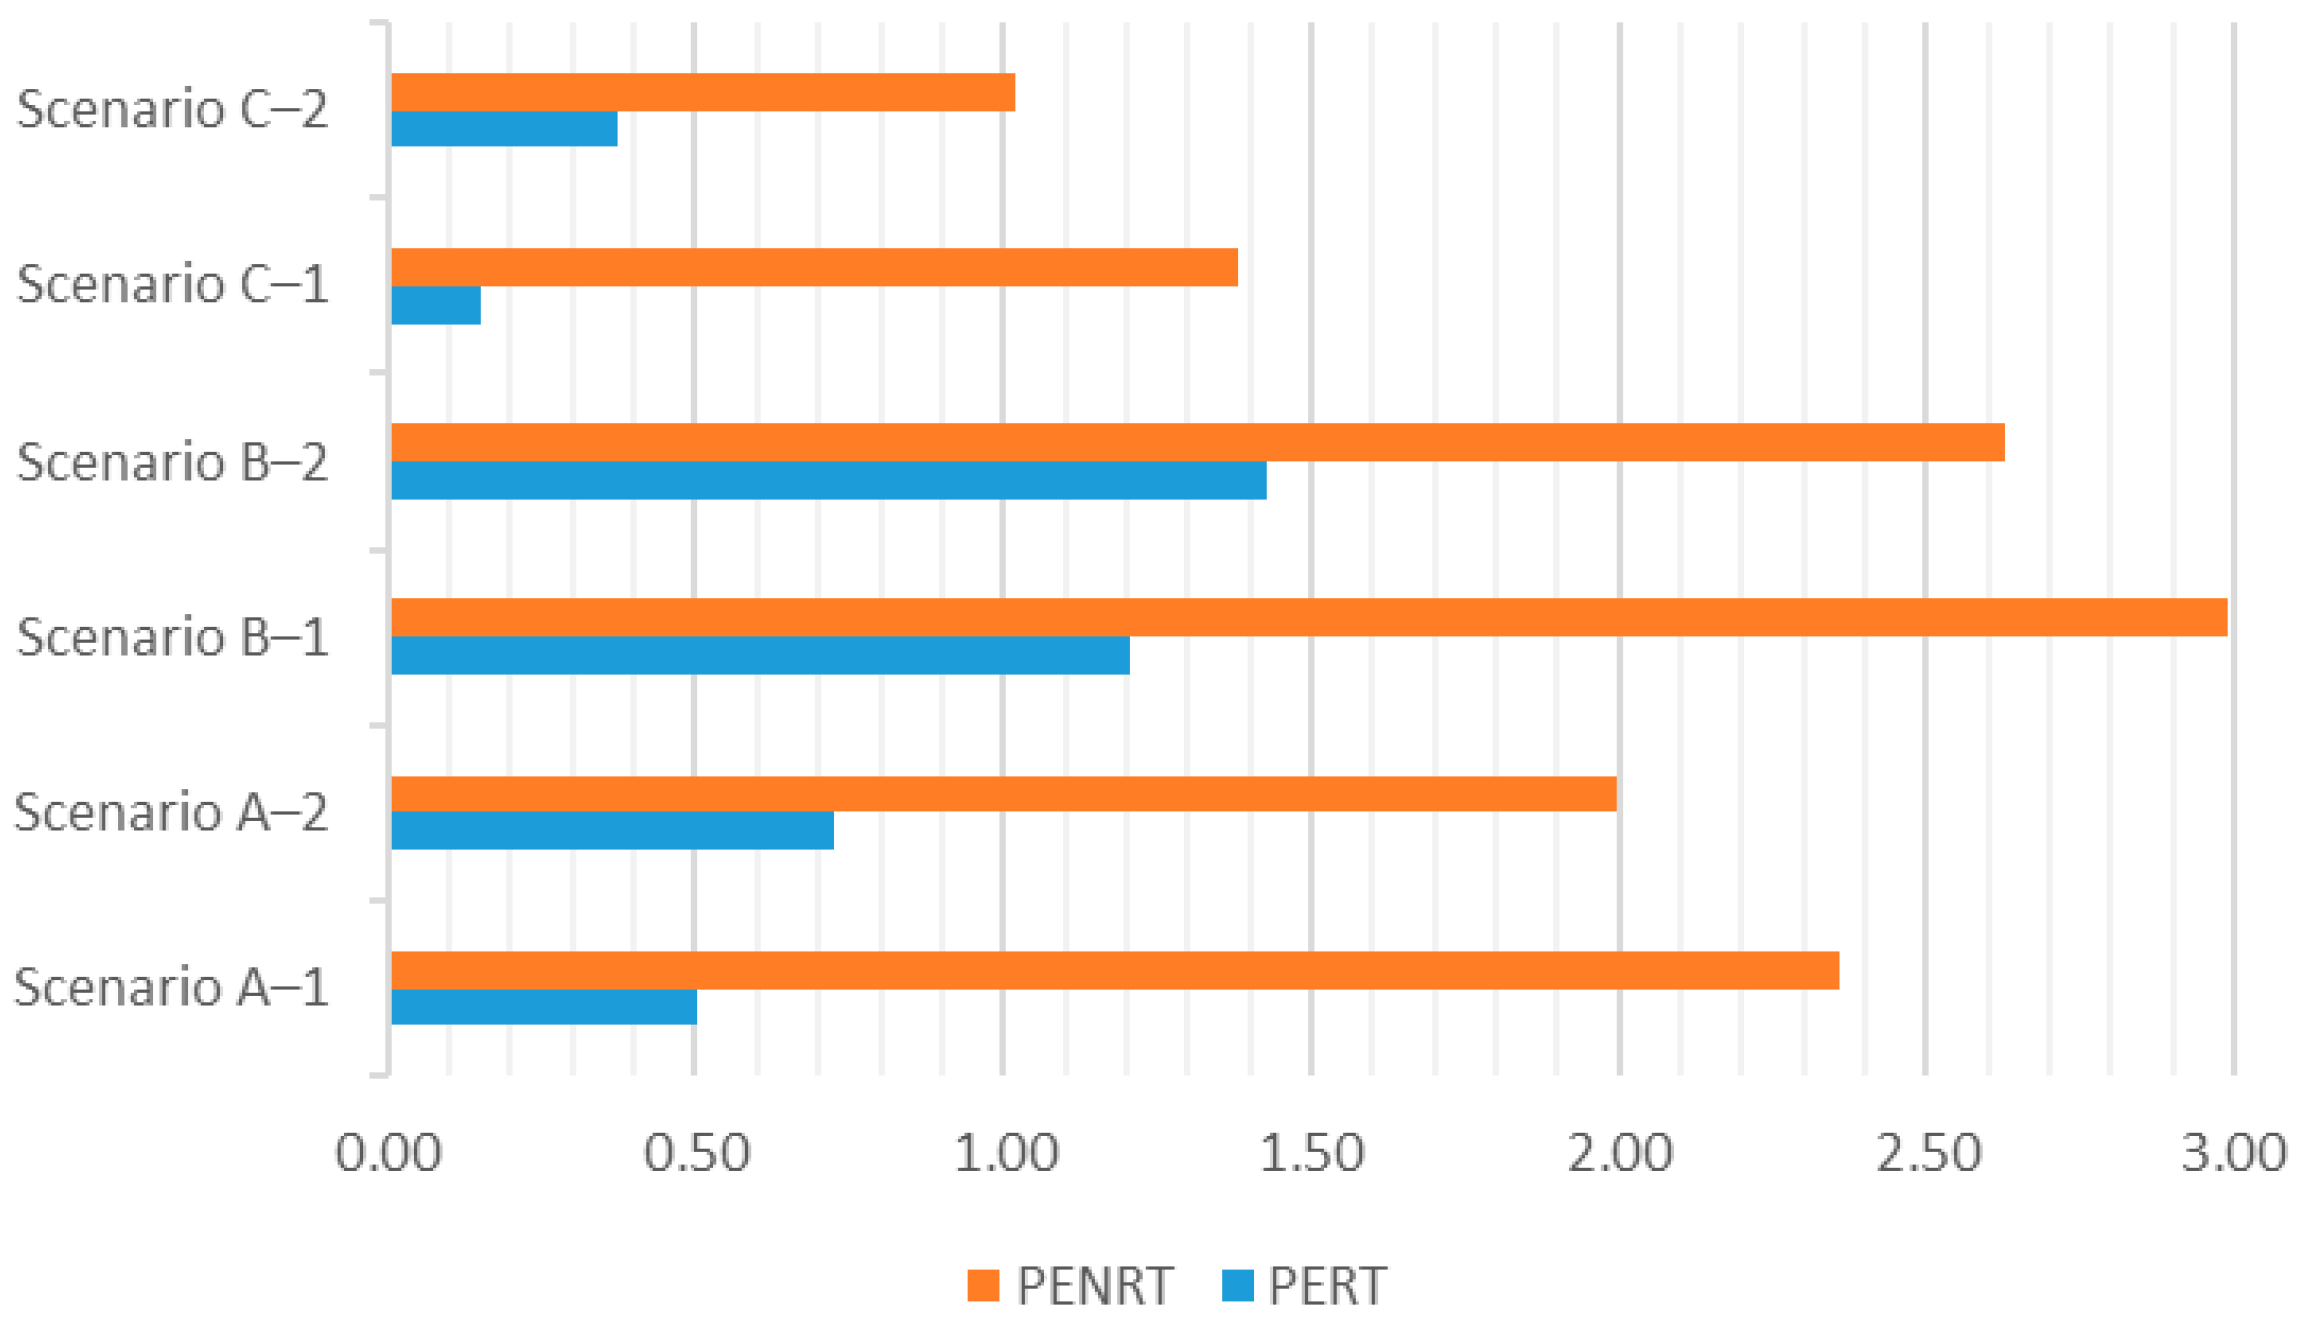
3.5. Primary Energy Share

Referring to the distribution of the primary energy of the materials (Figure 9; Appendix A, Table A1), a high proportion of fossil resources is visible. Surprisingly, the overall higher cumulative energy demand (CED) for wood-fibre insulation (scenarios B–1 and B–2) compared to mineral insulation (Scenarios A–1, A–2, C–1 and C–2) is observed in both cases of window selection. Among the monitored categories, scenario C–2 appears to be the most favourable, showing the lowest impact in the category of primary non-renewable energy resource consumption (PENRT).

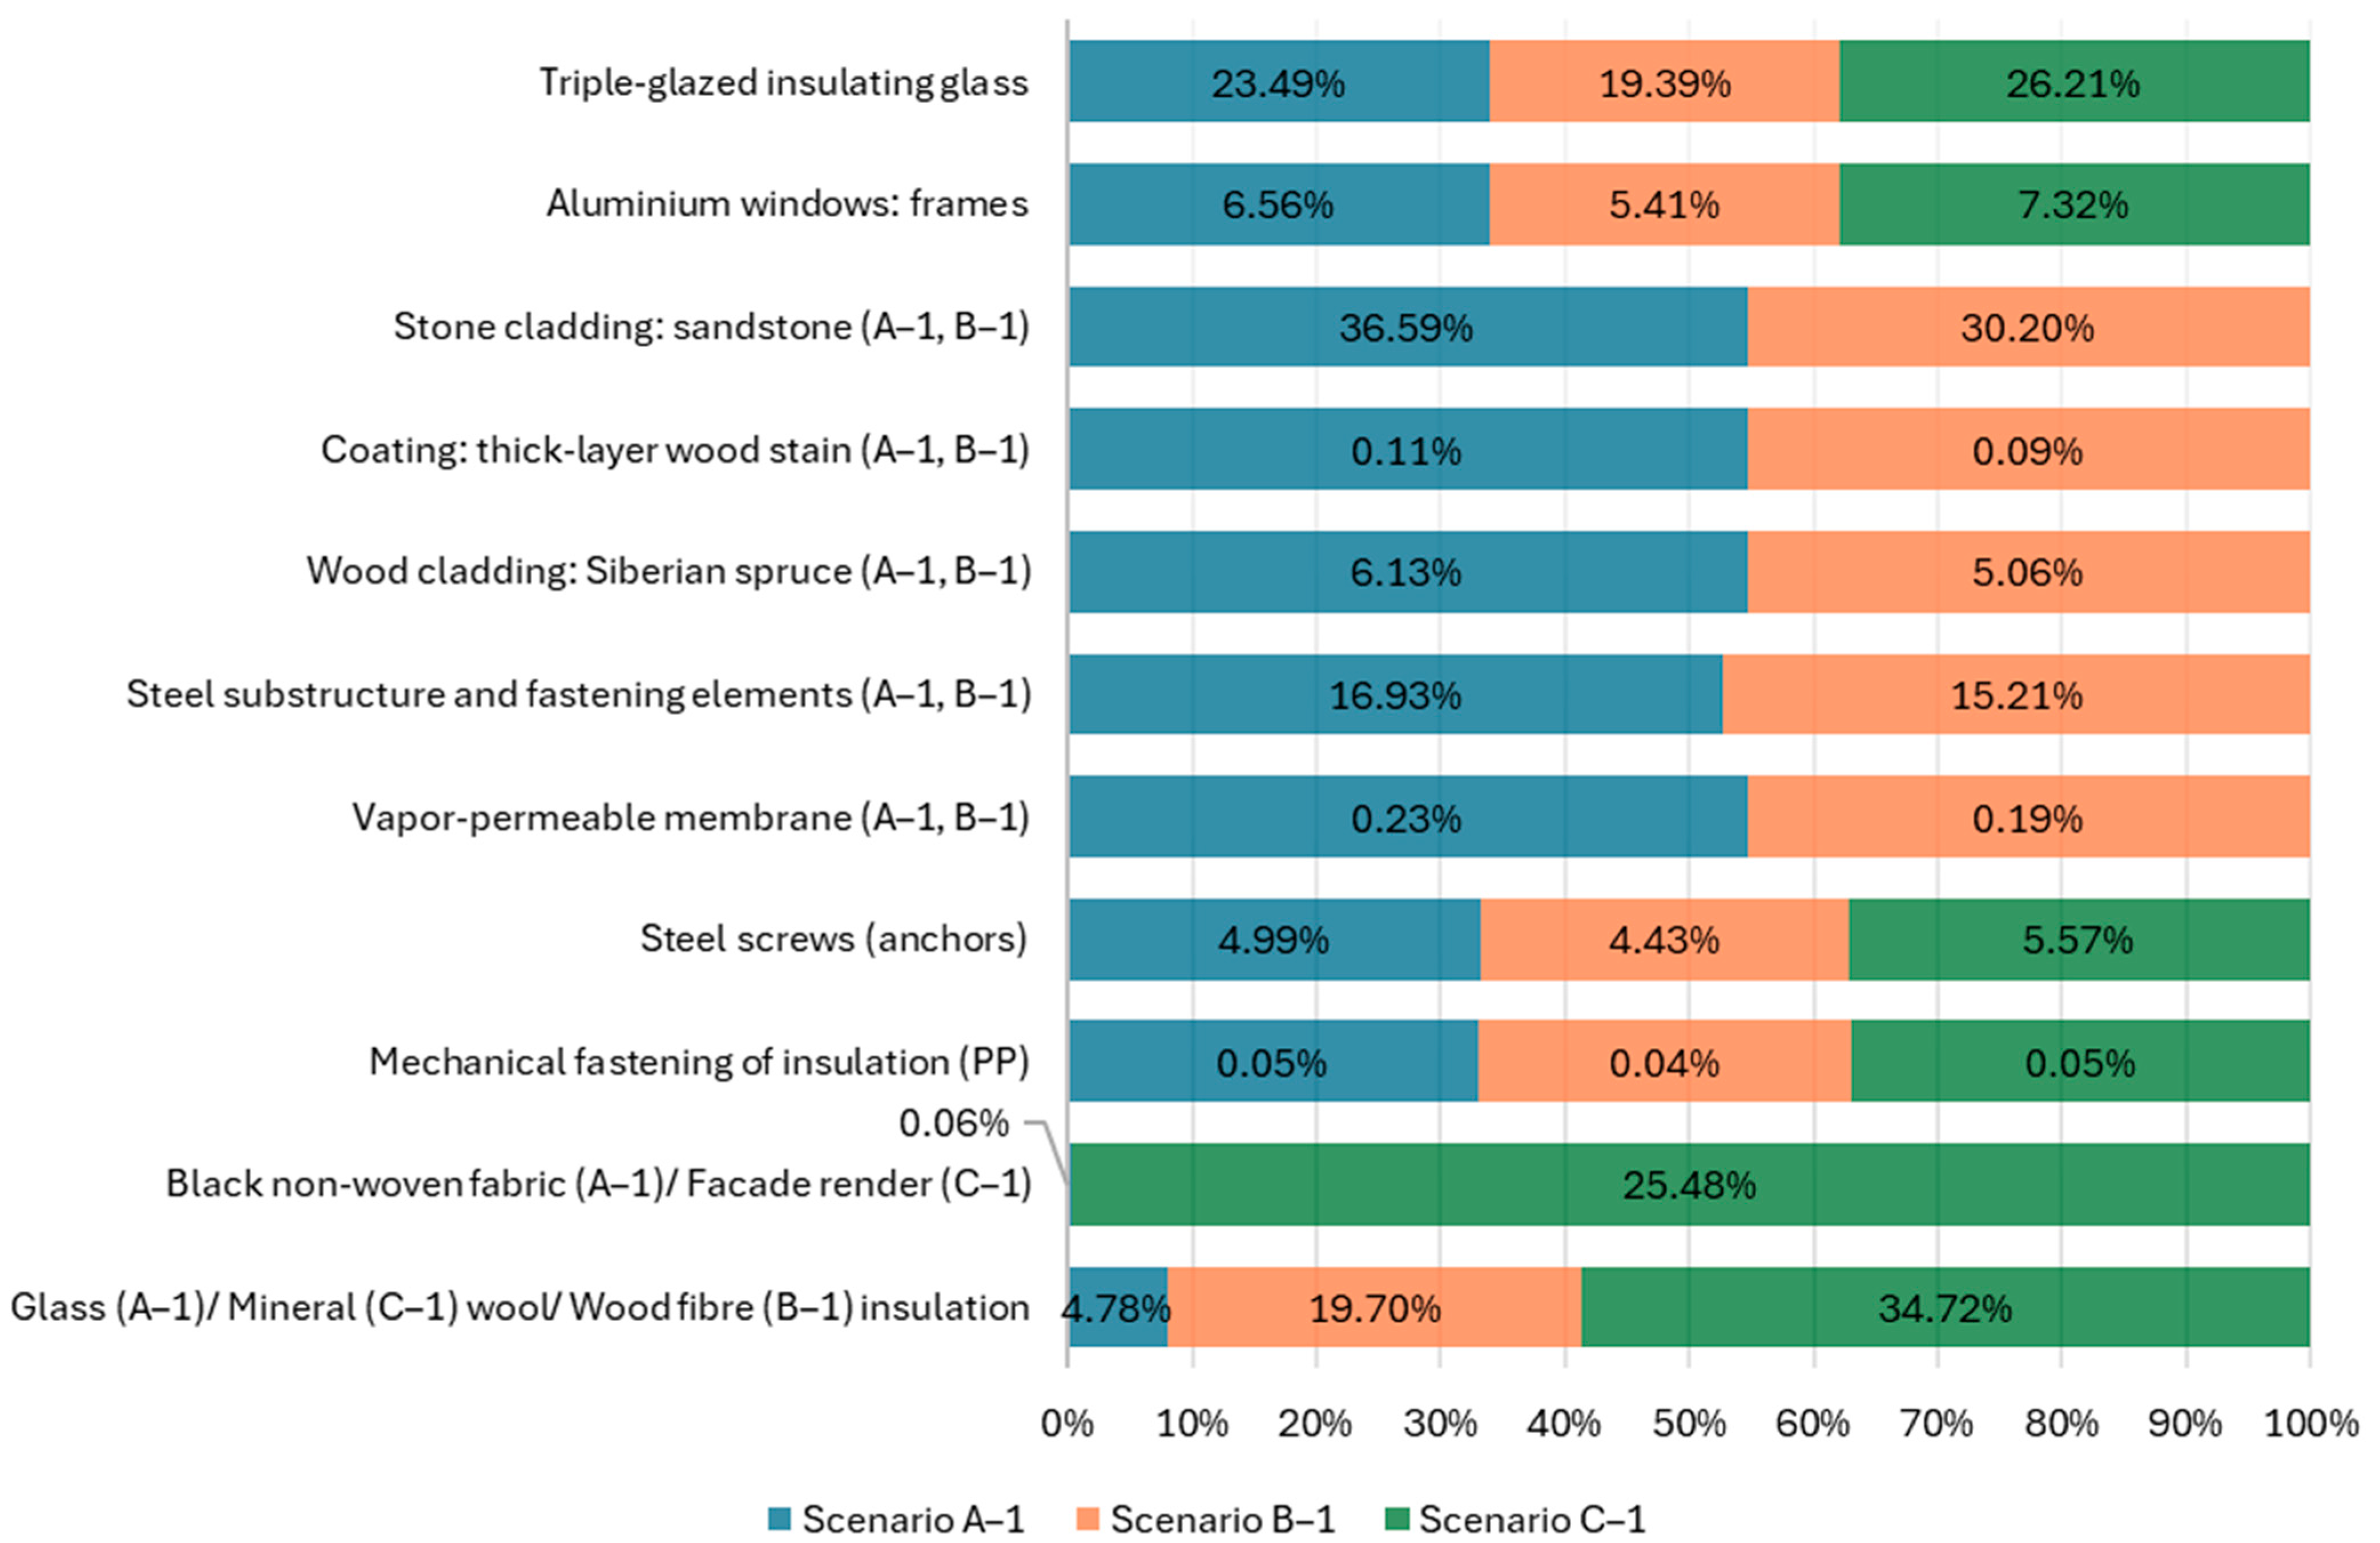
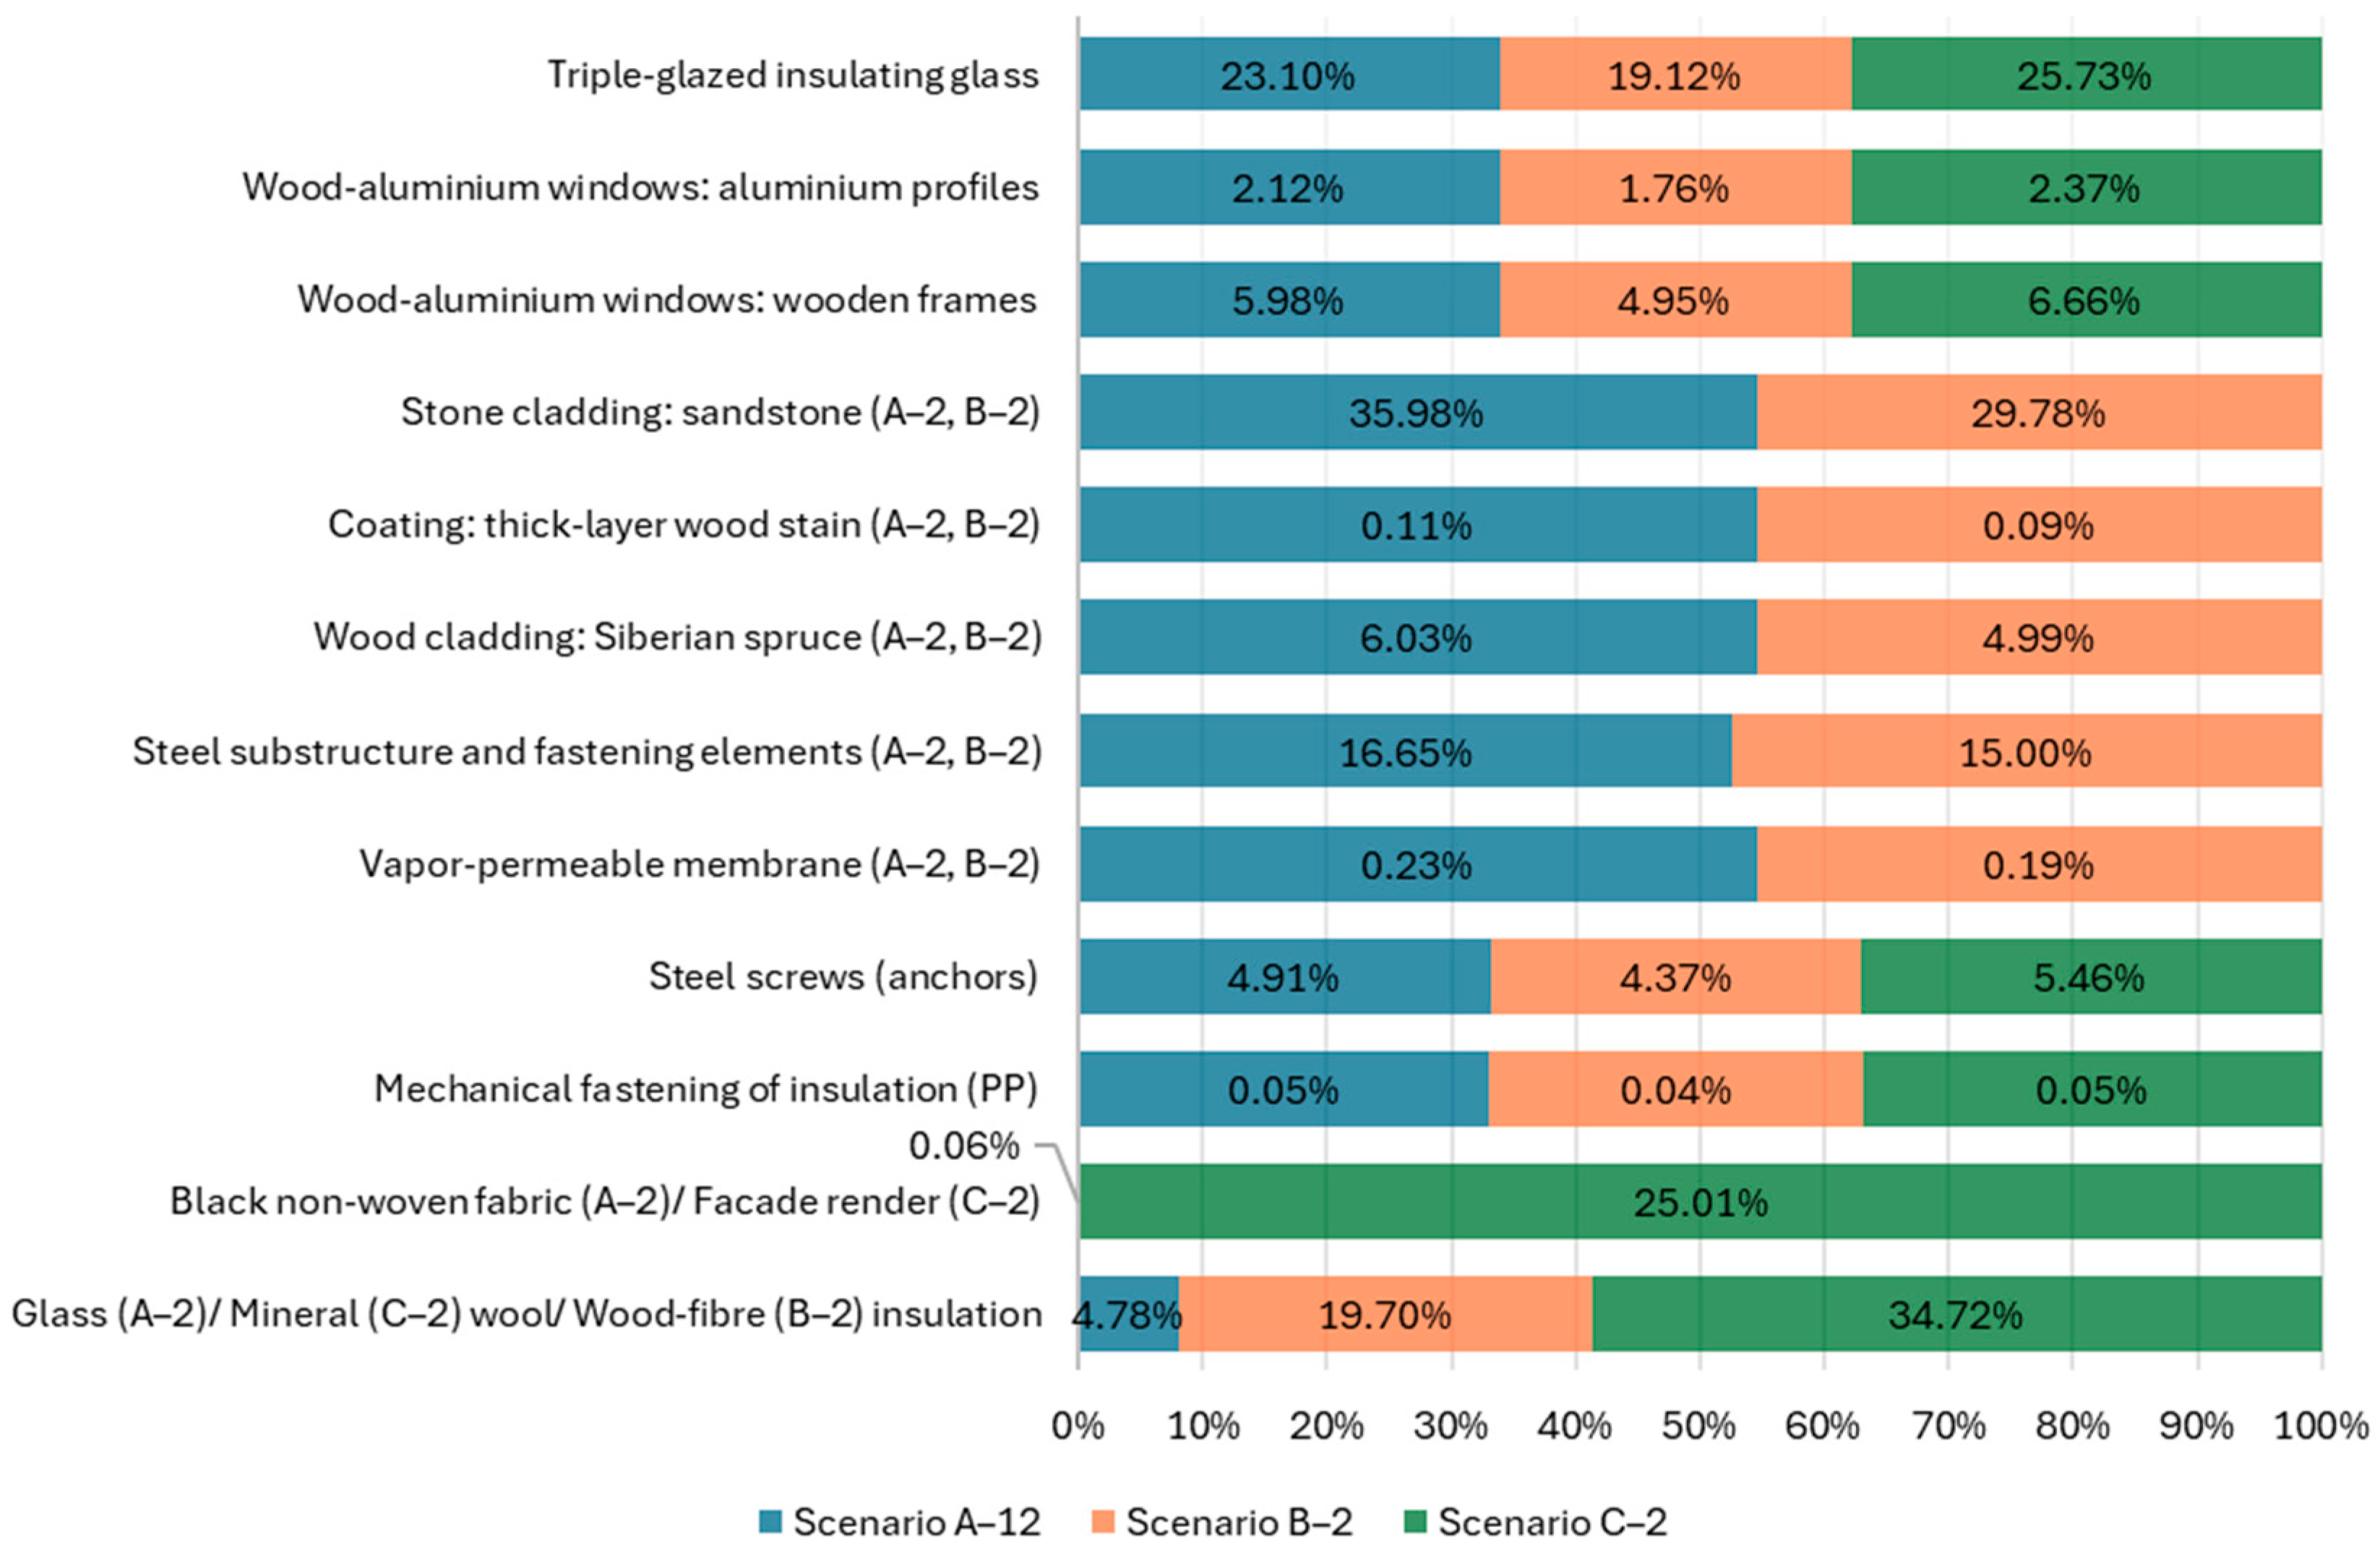
3.6. Proportional Impact of Construction Elements

Within the assessed scenarios, it is important to evaluate the environmental impact of each construction material used in the renovation individually. Trends of each scenario from A to C are specific, varying slightly according to the chosen window type (Figure 10). The smallest difference between insulation and cladding, which does not exceed 2% of the impact on all four toxicity categories, is observed in scenario A (A–1 and A–2), with cladding having a higher impact. Similarly, this trend is observed in the categories of ADF, GWP, ODP, POCP, AP and EP. However, in these categories, the impact is dominated by windows, accounting for at least 36.62% (EP) and up to 48.70% (POCP). Only in the ADE category is insulation dominant, reaching 41.13%. The influence of anchoring ranges from 6.16% in the POCP category of scenario A–1 to 12.79% in the TE category of scenario A–2.
The influence of cladding in scenario B has the highest impact in the categories of ADE, HT, FAE, MAE and TE, reaching 68.89% in the latter. The insulation mostly influences the ADF, ODP, POCP and EP categories, reaching 37.73%, 55.25%, 43.33% and 33.39% in scenario B–1, respectively. Windows bear most of the load in the GWP and AP categories, accounting for 34.98% and 39.32% in the same scenario, respectively. The impact of anchoring varies across the categories and extends from around 4% in the ODP to above 20% in the TE category. The percentual distribution of scenarios A and B construction element’s environmental impact is shown in Figure 10.
In scenario C–1 (Figure 11), insulation dominates in the ADE and all toxicity-related categories. Windows carry most of the impact in the remaining categories. A similar trend in scenario C–2 is observed, with the difference in the GWP and ODP categories, where the ratio is almost balanced, with insulation having a slightly higher impact than windows. Figure 11 shows the percentage distribution of the environmental impact of construction elements in scenario C.

3.7. Composite Environmental Index (CEI) Assessment

To compare the performance of the modelled scenarios, the proposed composite environmental index (CEI) approach is applied. The CEI results (Figure 12) are twofold. First, they present the index values for each scenario across individual impact categories, which are then aggregated into a single CEI score per scenario. A higher index indicates a greater environmental impact. Scenarios that differ only in window type exhibit similar trends, suggesting that façade composition has a more significant influence on the overall index than window selection. This is particularly evident in the ADE, HT, and TE categories, where the index values are nearly identical. These findings imply that these categories are primarily affected by the façade materials rather than the window type. The cumulative index identifies scenario B–2 as the least favourable option, with a value of 30.77, while scenario C–2 performs best, with a cumulative index of 16.44.

3.8. Uncertainty Assessment

Slight uncertainty ranging from 11% to 14% regarding each scenario is observed in the categories of GWP, AP and ODP, suggesting the most reliable outcomes. Slightly higher values not exceeding the appreciable 30% uncertainty range encompass the POCP, ADF, and ADE categories.
The results of eutrophication uncertainty among the scenarios range from around 32% to 39%, suggesting relatively stable backgrounds. FAE and MAE overlap from moderate to high uncertainty. Specifically, high uncertainty is found for scenario A (64.50% and 55.90%) and scenario C (53.40% and 53.70%), respectively.
Significant variability above 50% of the outcomes across all scenarios is identified in the categories of HT and TE, resulting in weak interpretation results. Especially, in the latter, the CV starts at the 176% uncertainty level for the A–1 scenario and reaches 1050% uncertainty in the C–2 scenario. Table 7 presents the coefficient of variation resulting from the uncertainty analysis.

3.9. Limitations of the Study

The study is limited by the scope, reliance on generic data, and exclusion of dynamic or site-specific factors such as operational energy performance and future recyclability. The scope covers only part of the B5 stage and focuses only on the embodied environmental impact of the construction materials selected for façade renovation. At the current stage of the building’s renovation, only the project documentation has been prepared, and the construction contractor has not yet been selected. Due to the complexity of obtaining detailed information about the reconstruction process (such as the timeline, tools used, equipment like cranes, scaffolding, etc.), we limited our assessment to the material basis of the building envelope renovation. These limitations suggest that while the conclusions are directionally valuable, they may not fully represent real-world outcomes without further contextualisation or sensitivity testing. The economic and social dimensions of sustainability are also omitted.

4. Discussion

Investigating the environmental impacts of renovating the external envelope of older buildings is currently a key issue in guiding decisions on whether to refurbish existing structures or replace them with new constructions. When renovation is chosen, the selection of construction materials plays an equally significant role in determining the overall sustainability of the project. The findings highlight that the choice of insulation material can substantially shift the environmental profile of a façade system. This opens a wider discussion about context-sensitive material selection considering regional environmental priorities, building function, and long-term sustainability goals. Environmental concerns vary by region. A dry area may prioritise water usage, while an industrial area may be more affected by air pollution or toxicity. Localised sustainability goals should therefore guide material choices and building strategies [33,34].
Another outcome highlights the transformative potential of thoughtful façade and window combinations [35,36]. A careful selection of façade materials and windows may significantly improve building performance, either environmentally or in terms of energy efficiency [37,38]. According to Apostolopoulos et al. [38], a planned renovation can reduce the primary energy needs and CO2eq emissions by 91% and 95%, respectively. However, prioritizing envelope systems in practice often ends with choosing the most economically beneficial option. From this perspective, the use of government green subsidies appears more effective than green public procurement [39]. The findings of Xue et al. [40] demonstrate that legal energy standards for deep renovation projects can be achieved in a cost-effective manner while maintaining low overall greenhouse gas emissions (GHG).
The initial evaluation aimed to determine the mass and volume distribution within the renovation scenarios (A–C). In scenarios A–1 (36.59%) and B–1 (30.20%), sandstone façade cladding represents the largest share of materials (Figure 4). In contrast, scenario C–1 is dominated by thermal insulation (34.72%), followed by façade render (25.01%). In scenario A–1, triple-glazed insulation glass (23.49%) and steel with fastening elements (16.93%) are the second and third most significant components by weight. Similarly, in scenario B–1, wood-fibre insulation (19.70%) and triple-glazed insulation glass (19.39%) rank as the second and third heaviest material components, respectively. In scenarios incorporating wood–aluminium windows (Figure 5), the materials with the highest weight proportions in scenario A–2 are sandstone cladding (35.98%), triple-glazed insulation glass (23.10%), and steel fastening elements (16.65%). In scenario B–2, sandstone cladding again dominates (29.78%), followed by wood-fibre insulation (19.70%) and triple-glazed insulation glass (19.12%). Scenario C–2 is characterised by thermal insulation (34.72%) and triple-glazed insulation glass (25.73%) as the most prominent materials by mass, with façade render (25.01%) ranking third. Figure 6 indicates that wood-fibre thermal insulation occupies the greatest volume in scenario B, followed by glass wool in scenario A, mineral wool in scenario C, and wooden façade cladding in both scenarios A and B.
It is worth emphasizing that conventional insulation materials with a high degree of industrial processing—e.g., expanded polystyrene (EPS)—tend to have significantly greater environmental impacts compared to natural alternatives like cork, wood fibre, and sheep’s wool, or recycled options such as cellulose fibre [22]. Interestingly, in two scenarios (B–1 and B–2), wood-fibre insulation exhibits a higher cumulative energy demand (CED) compared to the glass and mineral wool insulation in scenarios A and C (Figure 9, Appendix A, Table A1). Füchsl et al. [41] suggest that renewable-based materials tend to have a lower environmental impact but are not necessarily better. In the assessment of the impact of the window types used, wood–aluminium windows show lower environmental impacts in the PENRT indicator across all scenarios (A–C). Pawelzik et al. [42] show that if a conventional product has high energy consumption (as in the case of aluminium), a bio–based material with slightly higher energy requirements but low land use appears more favourable than a bio–based material with low energy requirements but high land use. A study by Hill et al. [43] also documents similar results related to GWP.
When comparing the environmental impact of each construction material (Figure 10 and Figure 11), sandstone cladding contributed between 18.01% (ODP, scenario B–1) and 68.89% (TE, scenario B–2) of the total impacts across all categories. Windows (aluminium and wood–aluminium) account for 4.14% (HT, scenario A–2) to 67.24% (POCP, scenario C–1) of the total impact across all assessed categories. Thermal insulation is responsible for between 8.96% (TE, scenario B–1) and 95.11% (TE, scenario C–2) of the total impact. Results published by Sedláková et al. [44] demonstrated that materials such as mineral insulation and steel have the greatest impact across the assessed environmental categories (e.g., ODP, AP, EP, POCP, ADP–FF). This corresponds with the findings of our study, in which cladding, windows, and insulation—listed in that order—accounted for the highest shares across the assessed categories (e.g., ADE, HT, FAE, TE).
Using a wide spectrum of environmental impacts provides a greater overview of environmental profile, not only within GWP as the most indicated environmental problem. Assessing abiotic depletion (ADE, ADF) and primary energy (PERT, PENRT) of raw materials reflects the long-term sustainability of natural resource use, understanding the rate at which the limited natural capital is consumed [45]. Toxicity-related environmental impact assessment is crucial because it addresses one of the most serious and long-term threats to both human health and ecosystem stability [46]. Including both ODP and POCP in environmental assessments provides a full picture of atmospheric impacts, helps decision-makers avoid unintended harm, ensures compliance with air quality and climate regulations, and supports the use of healthy and environmentally safe materials [47]. The assessment of acidification (AP) and eutrophication (EP) reveals potential hidden damage to soil, forests, and water. Therefore, these indicators are vital for protecting ecosystems, maintaining water quality, and ensuring long-term environmental health [48,49].
The observed variation in the magnitude of individual impact categories highlights the complexity of environmental assessment and the need for transparent, structured evaluation tools. When comparing materials or design alternatives, trade-offs often arise—such as better performance in toxicity-related indicators versus poorer results in climate-related categories. This raises critical questions about how different types of environmental impacts should be weighted and what compromises are acceptable in the pursuit of more sustainable building solutions. Several normalisation and weighting approaches have been developed to address this challenge, including those proposed by the Joint Research Centre of the European Commission [50]. These methods aim to enable meaningful comparisons across diverse impact categories and are embedded in various life cycle assessment (LCA) frameworks. In this context, the composite environmental index (CEI) introduced in this study offers a practical and adaptable tool for aggregating multiple environmental indicators into a single score. Grounded in the principles of multi-criteria decision analysis (MCDA) and aligned with the EU Environmental Footprint methodology [51], the CEI facilitates comparative assessments across scenarios and supports informed decision-making in early design stages. Its application in this study demonstrates its potential to guide sustainable material selection and scenario evaluation, particularly when multiple environmental dimensions must be considered simultaneously. Similar composite indexing methods have been successfully applied in previous studies to evaluate the environmental performance of buildings, construction materials, and life cycle scenarios [6,52,53].
When measuring the impact of individual categories, all four toxicities are gaining noticeable influence, especially with marine ecotoxicity significantly exceeding the others. While GWP is given the most important aspect globally, MAE seems to dominate the remaining impact categories. This raises legitimate concerns about potential environmental impacts, especially if toxic effects are neglected or not systematically assessed in environmental analyses. Although GWP is often considered the main indicator of environmental burden, toxicity-oriented categories can have long-term and often less visible, but no less serious consequences. Ignoring these aspects can lead to an underestimation of real environmental risks, which can be cumulative, with a delayed effect in sensitive ecosystems [46].
According to the performed uncertainty analysis, the reliability of characterisation results varies between individual impact categories. GWP, AP, and ODP achieve a low variability in outcomes, indicating relatively robust impact modelling and high reliability of datasets resulting in a high degree of reliability in comparing the impacts of individual scenarios. In contrast, toxicity-related categories, especially HT, TE show very high variability indicating the poor data quality of the datasets used. Therefore, the interpretation of these results is limited and should be further examined prior to qualitative comparison application. Overall, categories with low results of CV should be key parameters in the decision-making process, while other categories may complement the environmental analysis within a broader context.

5. Conclusions

Europe’s building stock is predominantly aging, and the need for renovation is growing due to increasingly strict performance standards and regulatory requirements. These evolving frameworks are designed to meet modern expectations for energy efficiency and structural integrity. Consequently, stakeholders in the real estate sector are frequently confronted with the choice between demolishing and rebuilding or pursuing deep renovation. Although various factors influence this decision, the building’s sustainability throughout its life cycle remains a key consideration. The integration of life cycle assessment (LCA) into decision-making processes in the construction sector enables targeted reduction in CO2 emissions, supports sustainable building practices, and thereby directly contributes to achieving the EU’s climate goals for 2050. In this context, the composite environmental index (CEI) was developed to enhance the interpretability and decision-making value of the life cycle assessment (LCA) results. By aggregating multiple environmental impact categories into a single, weighted score, the CEI enables a more intuitive and transparent comparison of façade renovation scenarios. The study applies this approach to evaluate and compare the embodied environmental impacts of alternative renovation strategies for a university office building in Central Slovakia. Three alternative façade types (scenarios A–C), each featuring two window variants (aluminium and wood–aluminium), were analysed. Within the scenarios, various design variants were compared: scenario A was based on a renovation proposal that preserved the architects’ requirements for the overall appearance of the building (insulation: glass wool, façade cladding made of sandstone and Siberian spruce). Scenario B represents an alternative to the approved construction solution, involving the use of wood-fibre insulation instead of glass wool while maintaining identical thermal performance parameters. Scenario C is an alternative without façade cladding, utilizing the ETICS contact insulation system with façade render. The life cycle assessment focused on selected environmental aspects—specifically, the abiotic depletion of elements (ADE) and fossil fuels (ADF); global warming potential (GWP); ozone depletion potential (ODP); human toxicity (HT); freshwater aquatic ecotoxicity (FAE); marine aquatic ecotoxicity (MAE), and terrestrial ecotoxicity (TE); photochemical ozone creation potential (POCP); acidification potential (AP); eutrophication potential (EP), and energy performance indicators (PERT, PENRT) across the B5 life cycle stage. The scope of the study encompasses the renovation stage of the office building, covering only the manufacturing of the renovated construction materials.
The main conclusions of this study are as follows:
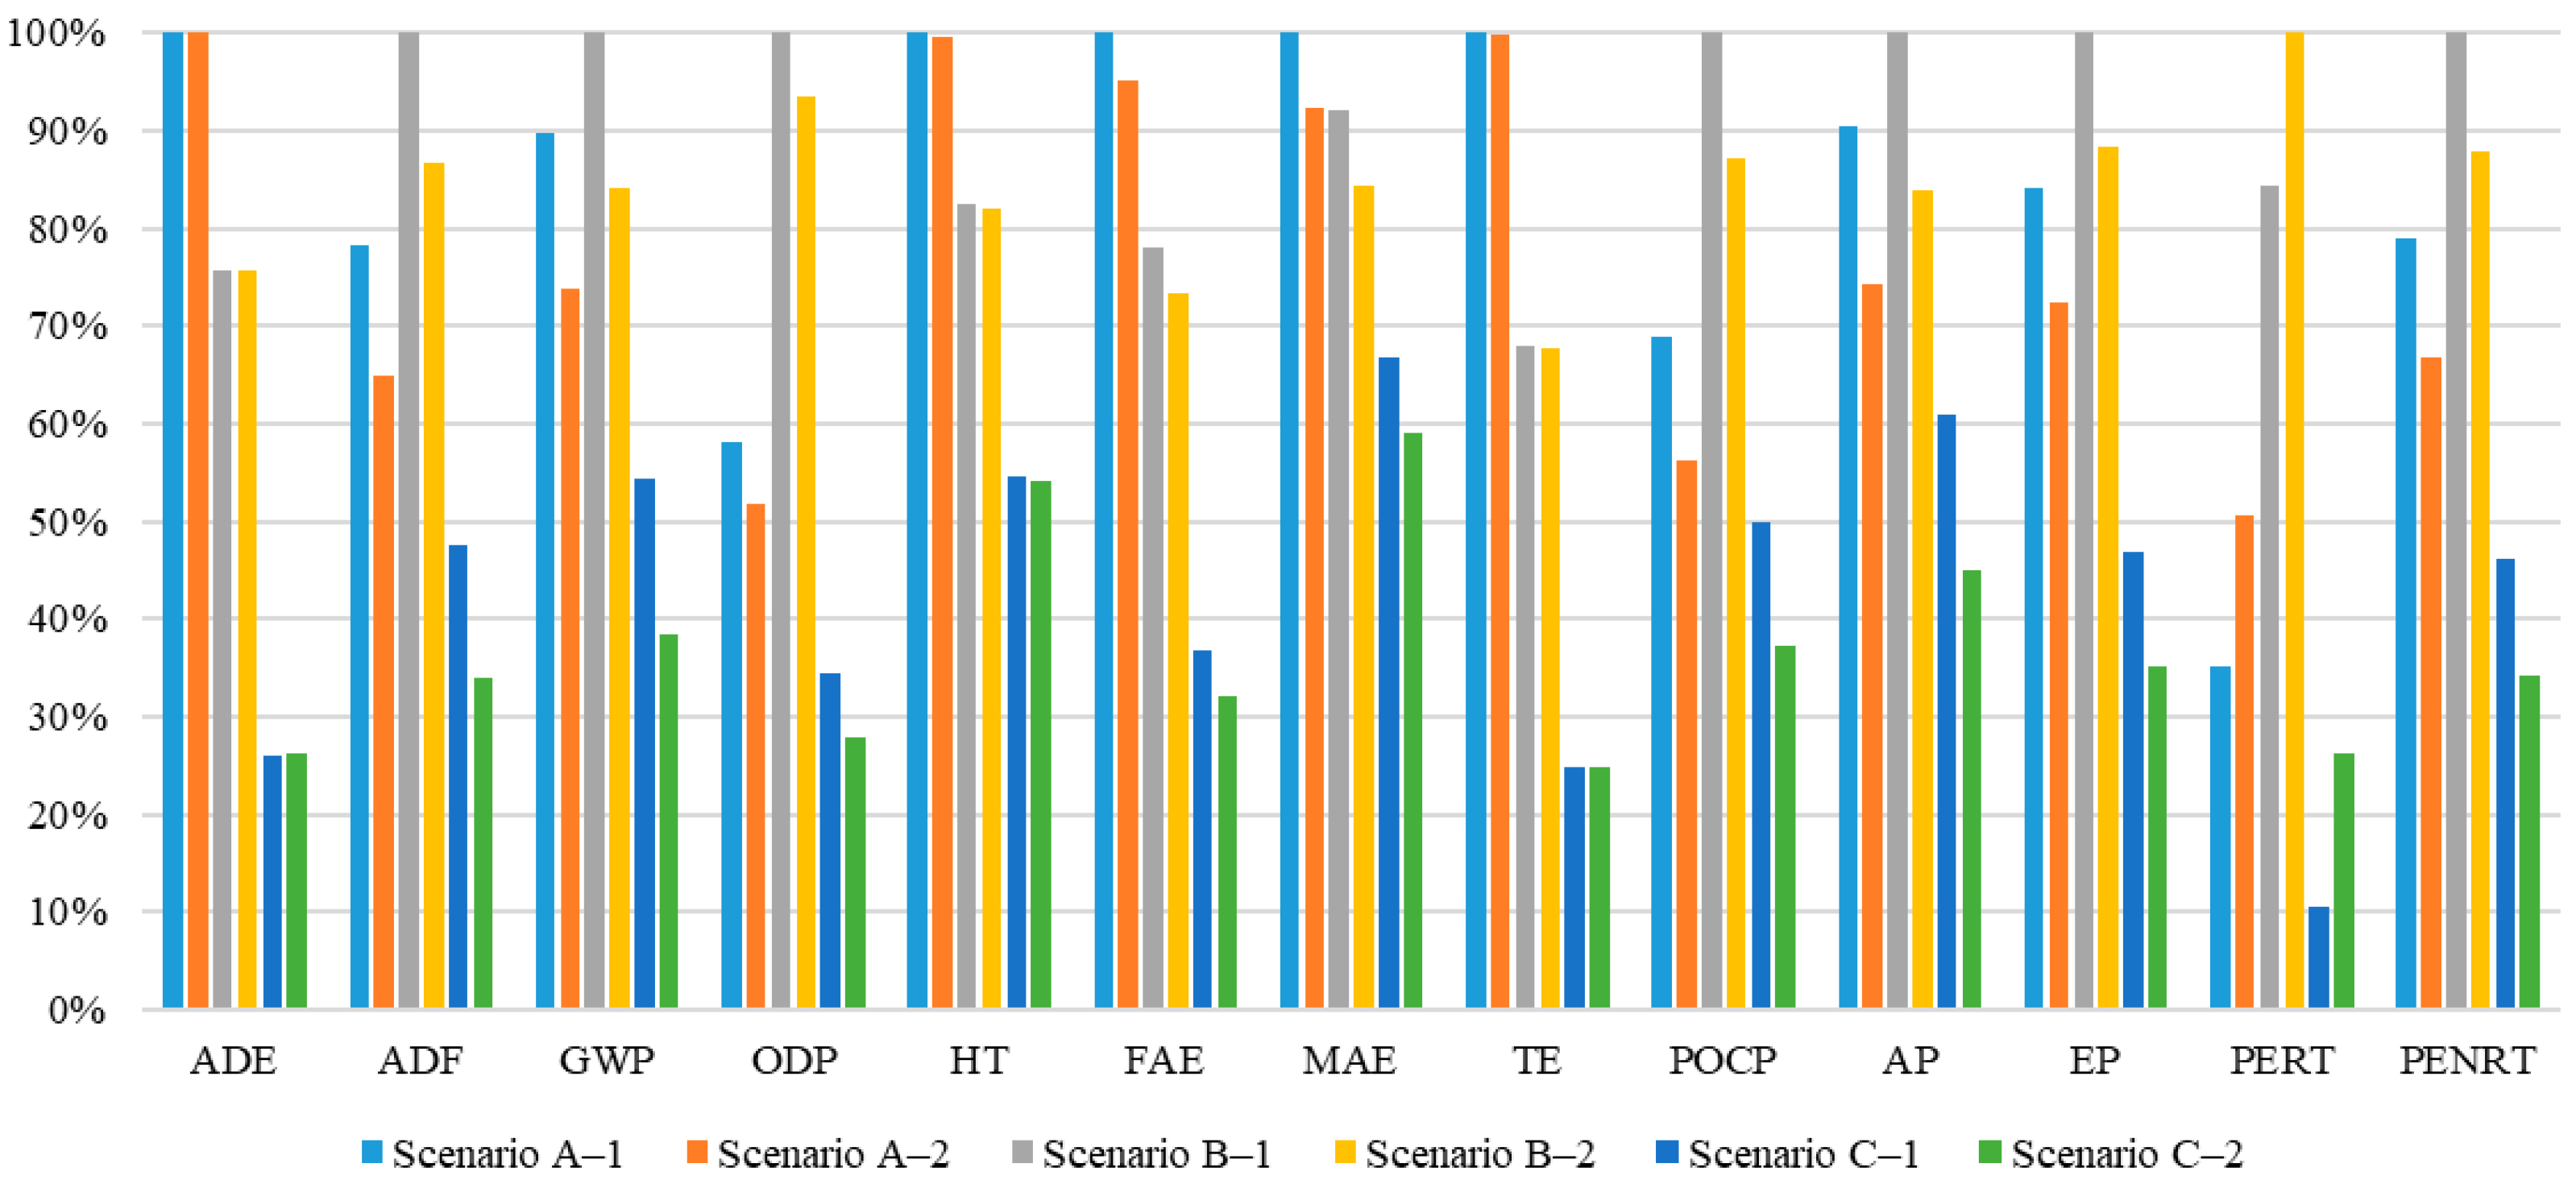
  • Wood–aluminium windows (scenarios A–2, B–2 and C–2) have a lower impact than aluminium windows (scenarios A–1, B–1 and C–1) in the categories ADF, GWP, ODP, FAE, MAE, POCP, AP, and EP, and a comparable impact in the categories ADE, HT, and TE;
  • The building façade in scenario A (A–1 and A–2) shows the worst performance in the categories ADE, HT, FAE, MAE, and TE;
  • Scenario B performs the worst in the categories ADF, GWP, ODP, POCP, AP, and EP;
  • Scenario C (C–1 and C–2) exhibits the most favourable environmental performance, showing the lowest impact in all assessed categories;
  • Based on the assessment, the contact façade system using mineral wool and façade render (ETICS), in combination with wood–aluminium windows (scenario C–2), is clearly identified as the most environmentally favourable variant across all evaluated categories.
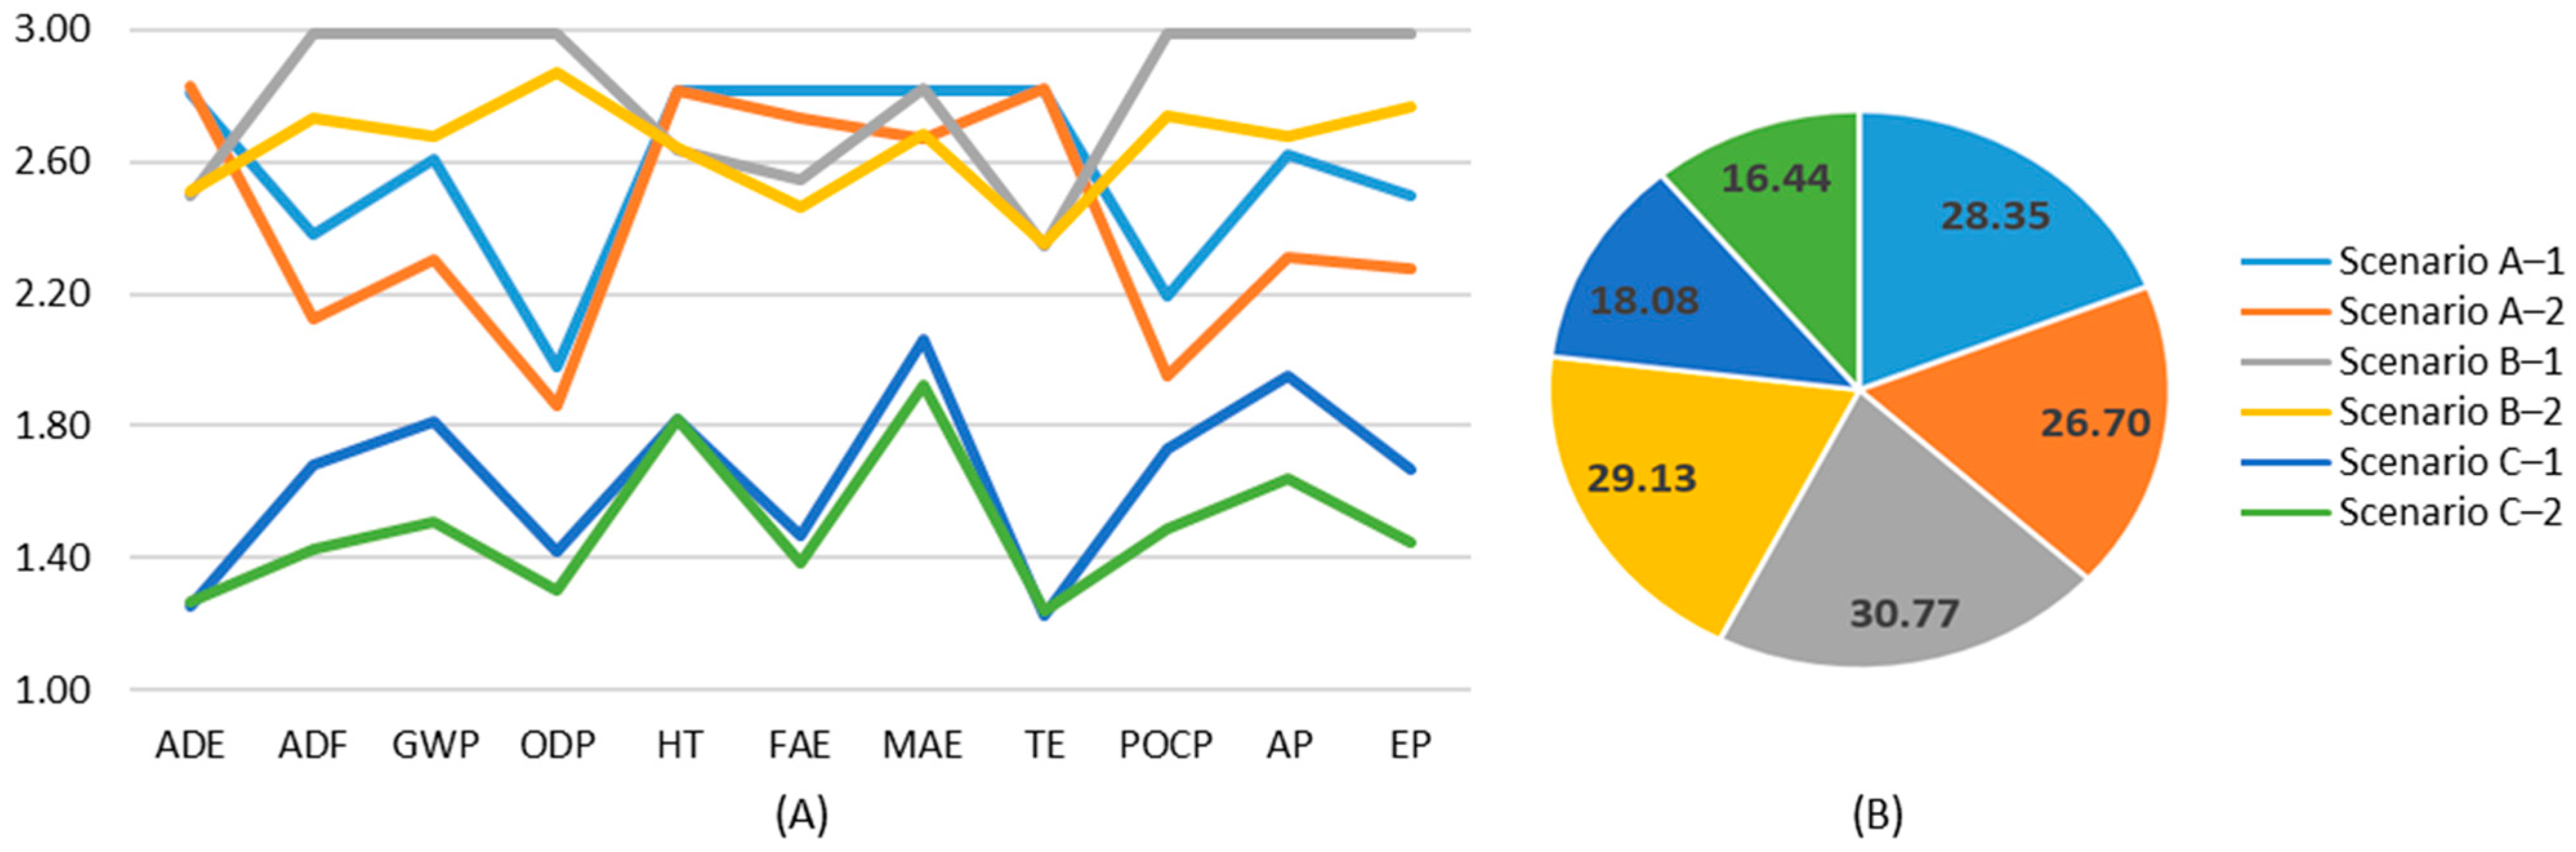
  • The application of the composite environmental index (CEI) revealed that façade composition has a more significant impact on overall environmental performance than window type, with scenario C–2 emerging as the most favourable option and scenario B–2 as the least, based on cumulative index values.
  • Uncertainty analysis revealed that HT and TE categories are unreliable, so further validation is needed when using these values for direct decision-making. On the other hand, the results of GWP, AP and ODP showed the highest reliability.
The paper demonstrates that materials have diverse and sometimes contrasting impacts across various environmental categories. This complexity challenges the idea of universally sustainable materials. Promoting a multi-criteria assessment approach provides a more accurate sustainability profile but may confuse decision-making. In this regard, it would be beneficial to tailor strategies to local priorities and conditions. Establishing impact thresholds based on the most critical local environmental problem allows for more meaningful evaluation of materials.
Ultimately, sustainable development is not just about selecting the greenest material overall but about making context-aware decisions that balance multiple impacts in line with regional and global goals. Aligning our practices with this mindset is key to truly resilient and responsible building strategies. The study highlights that material selection should be guided by targeted environmental priorities, as materials performing well in one impact category may have a significantly worse performance in another. This underlines the importance of context-specific decision-making. The selection of suitable construction materials presents an essential role in optimizing the environmental sustainability of renovations, especially regarding façades in order to enhance the thermal–technical characteristics of buildings. Low-carbon and low resource-depleting materials, as well as toxic-free substances considerably reduce overall impacts while simultaneously improving the reliability of the outcomes. Conversely, materials with unknown or harmful compositions increase uncertainty and decrease the credibility of environmental assessments. The use of a composite environmental index (CEI) further strengthens this approach by providing a clear, aggregated measure of environmental performance, allowing for more informed and transparent decision–making. This method provides a comprehensive and transparent framework for evaluating renovation strategies, allowing for the balanced consideration of diverse environmental impacts such as climate change, resource use, and toxicity. Moreover, it facilitates flexible prioritisation by enabling the adjustment of impact category weights to align with specific regional or project-level sustainability objectives. Rather than applying a universally standard distinction in sustainability, parameters based on partial, localised goals should be generated and used in sustainable decision-making practises. Developing regionally adapted policies that reflect these specific priorities can lead to more meaningful and effective environmental protection. This approach supports smarter material choices and encourages a more nuanced understanding of sustainability in practice and might shape the future direction of sustainable architecture.

Author Contributions

Conceptualisation, P.Š. and R.V.; methodology, P.Š. and R.V.; software, R.V.; validation, P.Š., R.V. and S.J.; formal analysis, P.Š., R.V. and S.J.; investigation, P.Š. and R.V.; resources, P.Š. and R.V.; data curation, P.Š. and R.V.; writing—original draft preparation, P.Š., R.V. and S.J.; writing—review and editing, P.Š. and R.V.; visualisation, P.Š. and R.V.; supervision, P.Š. and R.V.; project administration, P.Š.; funding acquisition, P.Š. All authors have read and agreed to the published version of the manuscript.

Funding

This research was funded by the EU NextGenerationEU through the Recovery and Resilience Plan for Slovakia under the project No. 09I03-03-V05-00016.

Institutional Review Board Statement

Not applicable.

Informed Consent Statement

Not applicable.

Data Availability Statement

The original contributions presented in this study are included in the article. Further inquiries can be directed to the corresponding author.

Acknowledgments

The authors wish to thank the architectural design studio STAVING PROJEKT s.r.o. and the Technical University in Zvolen.

Conflicts of Interest

The authors declare no conflicts of interest.

Appendix A

Table A1 shows the characterisation results of the assessment for each scenario of façade renovation.
Table A1. Characterisation results for each scenario.
Impact CategoryUnitScenario A–1Scenario A–2Scenario B–1Scenario B–2Scenario C–1Scenario C–2
ADEg Sb eq3.113.122.362.360.810.82
ADFGJ2.111.752.702.341.280.92
GWPkg CO2 eq202.56166.58225.53189.54122.4386.44
ODPmg CFC-11 eq1.371.222.362.210.810.66
HTt 1,4-DB eq3.813.793.143.122.072.06
FAEkg 1,4-DB eq656.40625.12512.63481.35241.33210.05
MAEkt 1,4-DB eq1.221.131.131.030.820.72
TEkg 1,4-DB eq81.5881.4955.3855.3020.3220.23
POCPg C2H4 eq51.5041.9374.6765.0937.3027.73
APkg SO2 eq1.020.841.130.950.690.51
EPg PO43-eq281.21241.85334.46295.10156.54117.18
PERTGJ0.500.721.211.430.150.37
PENRTGJ2.362.002.992.631.381.02

References

  1. Hesse, T.; Braungardt, S. EU 2040 Climate Target: Contributions of the Buildings Sector; Oeko Institute: Freiburg, Germany, 2024. [Google Scholar]
  2. Österbring, M.; Mata, É.; Thuvander, L.; Wallbaum, H. Explorative life-cycle assessment of renovating existing urban housing-stocks. Build. Environ. 2019, 165, 106391. [Google Scholar] [CrossRef]
  3. Gkatzogias, K.; Veljkovic, A.; Pohoryles, D.; Tsionis, G.; Bournas, D.; Crowley, H.; Norlén, H.; Butenweg, C.; Gervasio, H.; Manfredi, V.; et al. Policy Practice and Regional Impact Assessment for Building Renovation—REEBUILD: Integrated Techniques for the Seismic Strengthening and Energy Efficiency of Existing Buildings; Gkatzogias, K., Tsionis, G., Eds.; Publications Office of the European Union: Luxembourg, 2022; JRC131250. [Google Scholar] [CrossRef]
  4. European Commission. A Renovation Wave for Europe—Greening Our Buildings, Creating Jobs, Improving Lives; European Commission: Brussels, Belgium, 2020. [Google Scholar]
  5. Berg, F.; Fuglseth, M. Life cycle assessment and historic buildings: Energy-efficiency refurbishment versus new construction in Norway. J. Archit. Conserv. 2018, 24, 152–167. [Google Scholar] [CrossRef]
  6. Vilches, A.; Garcia-Martinez, A.; Sanchez-Montañes, B. Life Cycle Assessment (LCA) of Building Refurbishment: A Literature Review. Energy Build. 2017, 135, 286–301. [Google Scholar] [CrossRef]
  7. ISO 14040:2006; Environmental Management—Life Cycle Assessment—Principles and Framework. Technical Committee ISO/TC 207. ISO: Geneva, Switzerland, 2006.
  8. ISO 14044:2006; Environmental Management—Life Cycle Assessment—Requirements and Guidelines. ISO/TC 207/SC 5. ISO: Geneva, Switzerland, 2006.
  9. Fahlstedt, O.; Rasmussen, N.F.; Temeljotov-Salaj, A.; Huang, L.; Bohne, A.R. Building renovations and life cycle assessment—A scoping literature review. Renew. Sustain. Energy Rev. 2024, 203, 114774. [Google Scholar] [CrossRef]
  10. Fahlstedt, O.; Temeljotov-Salaj, A.; Lohne, J.; Bohne, A.R. Holistic assessment of carbon abatement strategies in building refurbishment literature—A scoping review. Renew. Sustain. Energy Rev. 2022, 167, 112636. [Google Scholar] [CrossRef]
  11. Bragadin, A.M.; Guardigli, L.; Calistri, C.; Ferrante, A. Demolishing or Renovating? Life Cycle Analysis in the Design Process for Building Renovation: The ProGETonE Case. Sustainability 2023, 15, 8614. [Google Scholar] [CrossRef]
  12. Rabani, M.; Madesaa, B.H.; Ljungström, M.; Aamodt, L.; Løvvold, S.; Nord, N. Life cycle analysis of GHG emissions from the building retrofitting: The case of a Norwegian office building. Build. Environ. 2021, 204, 108159. [Google Scholar] [CrossRef]
  13. Bragadin, A.M.; Calistri, M.; Predari, G. LCA-based strategic evaluation for building renovation construction projects. In Proceedings of the 12th Nordic Conference on Construction Economics and Organisation, Trondheim, Norway, 30–31 May 2024. [Google Scholar]
  14. Chandrasekaran, V.; Dvarioniene, J.; Vitkute, A.; Gecevicius, G. Environmental Impact Assessment of Renovated Multi-Apartment Building Using LCA Approach: Case Study from Lithuania. Sustainability 2021, 13, 1542. [Google Scholar] [CrossRef]
  15. Hasik, V.; Escott, E.; Bates, R.; Carlisle, S.; Faircloth, B.; Bilec, M.M. Comparative whole-building life cycle assessment of renovation and new construction. Build. Environ. 2019, 161, 1062018. [Google Scholar] [CrossRef]
  16. Wrålsen, B.; O’Born, R.; Skaar, C.H. Life cycle assessment of an ambitious renovation of a Norwegian apartment building to nZEB standard. Energy Build. 2018, 177, 197–206. [Google Scholar] [CrossRef]
  17. Schaubroeck, S.; Schaubroeck, T.; Baustert, P.; Gibon, T.; Benetto, E. When to replace a product to decrease environmental impact?—A consequential LCA framework and case study on car replacement. Int. J. Life Cycle Assess. 2020, 25, 1500–1521. [Google Scholar] [CrossRef]
  18. Huuhka, S.; Moisio, M.; Salmio, E.; Köliö, A.; Lahdensivu, J. Renovate or replace? Consequential replacement LCA framework for buildings. Build. Cities 2023, 4, 212–228. [Google Scholar] [CrossRef]
  19. Kuittinen, M.; Häkkinen, T. Reduced carbon footprints of buildings: New Finnish standards and assessments. Build. Cities 2020, 1, 182–197. [Google Scholar] [CrossRef]
  20. Lechtenböhmer, S.; Schüring, A. The potential for large-scale savings from insulating residential buildings in the EU. Energy Effic. 2011, 4, 257–270. [Google Scholar] [CrossRef]
  21. Mišík, M.; Oravcová, V. Energy efficiency of buildings in Central and Eastern Europe: Room for improvement. Energy Effic. 2023, 17, 32. [Google Scholar] [CrossRef]
  22. Kamel, E.; Memari, A.M. Residential Building Envelope Energy Retrofit Methods, Simulation Tools, and Example Projects: A Review of the Literature. Buildings 2022, 12, 954. [Google Scholar] [CrossRef]
  23. Sojkova, K.; Volf, M.; Lupisek, A.; Bolliger, R.; Vachal, T. Selection of favourable concept of energy retrofitting solution for social housing in the Czech Republic based on economic parameters, greenhouse gases, and primary energy consumption. Sustainability 2019, 11, 6842. [Google Scholar] [CrossRef]
  24. Motuziene, V.; Juodis, E.S. Simulation based complex energy assessment of office building fenestration. J. Civ. Eng. Manag. 2010, 16, 345–351. [Google Scholar] [CrossRef]
  25. Košir, M.; Gostiša, T.; Kristl, Ž. Influence of architectural building envelope characteristics on energy performance in Central European climatic conditions. J. Build. Eng. 2018, 15, 278–288. [Google Scholar] [CrossRef]
  26. Wang, G.; Luo, T.; Luo, H.; Liu, R.; Liu, Y.; Liu, Z. A Comprehensive Review of Building Lifecycle Carbon Emissions and Reduction Approaches. City Built Environ. 2024, 2, 12. [Google Scholar] [CrossRef]
  27. Obead, R.; Khaddour, L.; D’Amico, B. Historical Building Energy Retrofit Focusing on the Whole Life Cycle Assessment—A Systematic Literature Review. Architecture 2025, 5, 49. [Google Scholar] [CrossRef]
  28. Favi, C.; Germani, M.; Marconi, M.; Mandolini, M. The Application of Life Cycle Assessment in Buildings: Challenges, and Directions for Future Research. Int. J. Life Cycle Assess. 2022, 27, 1221–1240. [Google Scholar] [CrossRef]
  29. STN 73 0540-2: 2019; Thermal Protection of Buildings. Thermal Performance of Buildings and Components. Part 2: Functional Requirements. Slovak Office of Standards, Metrology and Testing: Bratislava, Slovakia, 2019.
  30. Goedkoop, M.; Oele, M.; Leijting, J.; Ponsioen, T.; Meijer, E. Introduction to LCA with SimaPro; PRé Sustainability: Amersfoort, The Netherlands, 2016; Available online: https://pre-sustainability.com/files/2014/05/SimaPro8IntroductionToLCA.pdf (accessed on 20 July 2025).
  31. Ecoinvent. Ecoinvent v3.11. Available online: https://ecoinvent.org/ecoinvent-v3-11/#webinar-introduction-to-ecoinvent-version-3-11 (accessed on 20 July 2025).
  32. STN EN 15804+A2 2020; Sustainability of Construction Works. Environmental Product Declarations. Core Rules for the Product Category of Construction Products. Slovak Office of Standards, Metrology and Testing: Bratislava, Slovakia, 2020.
  33. Moghtadernejad, S.; Chouinard, L.E.; Mirza, M.S. Design strategies using multi-criteria decision-making tools to enhance the performance of building façades. J. Build. Eng. 2020, 30, 101247. [Google Scholar] [CrossRef]
  34. Tahmasbi, F.; Khdair, I.A.; Aburumman, A.G.; Tahmasebi, M.; Thi, H.N.; Afrand, M. Energy-efficient building façades: A comprehensive review of innovative technologies and sustainable strategies. J. Build. Eng. 2025, 99, 111643. [Google Scholar] [CrossRef]
  35. Beneito, L.; Konsantinou, T.; Torres-Ramo, J.; Sánches-Ostiz, A. Towards decarbonisation in the built environment: A comparative analysis of conventional vs. industrialised façades in nearly zero-energy building renovations. Energy Build. 2025, 342, 115885. [Google Scholar] [CrossRef]
  36. Gonçalves, M.; Figueiredo, A.; Almeida, F.S.M.R.; Vicente, R. Dynamic façades in buildings: A systematic review across thermal comfort, energy efficiency and daylight performance. Renew. Sustain. Energy Rev. 2024, 199, 114474. [Google Scholar] [CrossRef]
  37. Van Gulck, L.; Van de Putte, S.; Delghust, M.; Van den Bossche, N.; Steeman, M. Environmental and financial assessment of façade renovations designed for change: Developing optimal scenarios for apartment buildings in Flanders. Build. Environ. 2020, 183, 107178. [Google Scholar] [CrossRef]
  38. Apostolopoulos, V.; Mamounakis, I.; Seitaridis, A.; Tagkoulis, N.; Korkoumpas, S.D.; Iliadis, P.; Angelakoglou, K.; Nikolopoulos, N. An integrated life cycle assessment and life cycle costing approach towards sustainable building renovation via a dynamic online tool. Appl. Energy 2023, 334, 120710. [Google Scholar] [CrossRef]
  39. Gao, J.; Lu, F. Evaluating green policies: A comparative analysis of subsidies and public procurement in green transition. Econ. Anal. Policy 2025, 86, 1675–1694. [Google Scholar] [CrossRef]
  40. Xue, Q.; Wang, Z.; Chen, Q. Multi-Objective Optimization of Building Design for Life Cycle Cost and CO2 Emissions: A Case Study of a Low-Energy Residential Building in a Severe Cold Climate. Build. Simul. 2022, 15, 83–98. [Google Scholar] [CrossRef]
  41. Füchsl, S.; Rheude, F.; Röder, H. Life cycle assessment (LCA) of thermal insulation materials: A critical review. Clean. Mater. 2022, 5, 10011. [Google Scholar] [CrossRef]
  42. Pawelzik, P.; Carus, M.; Hotchkiss, J.; Narayan, R.; Selke, S.; Wellisch, M.; Weiss, M.; Wicke, B.; Patel, K.M. Critical aspects in the life cycle assessment (LCA) of bio-based materials Reviewing methodologies and deriving recommendations. Resour. Conserv. Recycl. 2013, 73, 211–228. [Google Scholar] [CrossRef]
  43. Hill, C.; Norton, A.; Dibdiakova, J. A comparison of the environmental impacts of different categories of insulation materials. Energy Build. 2018, 162, 12–20. [Google Scholar] [CrossRef]
  44. Sedláková, A.; Vilčeková, S.; Burák, D.; Tomková, Ž.; Moňoková, A.; Doroudiani, S. Environmental impacts assessment for conversion of an old mill building into a modern apartment building through reconstruction. Build. Environ. 2020, 172, 106734. [Google Scholar] [CrossRef]
  45. Beylot, A.; Ardente, F.; Sala, S.; Zampori, L. Accounting for the dissipation of abiotic resources in LCA: Status, key challenges and potential way forward. Resour. Conserv. Recycl. 2020, 157, 104748. [Google Scholar] [CrossRef] [PubMed]
  46. Rey-Álvarez, B.; Silvestre, J.; García-Martínez, A.; Sánchez-Montañés, B. A comparative approach to evaluate the toxicity of building materials through life cycle assessment. Sci. Total Environ. 2024, 912, 168897. [Google Scholar] [CrossRef] [PubMed]
  47. Rasul, G.M.; Arutla, R.K.L. Environmental impact assessment of green roofs using life cycle assessment. Energy Rep. 2020, 6, 503–508. [Google Scholar] [CrossRef]
  48. Kobetičová, K.; Černý, R. Terrestrial eutrophication of building materials and buildings: An emerging topic in environmental studies. Sci. Total Environ. 2019, 689, 1316–1328. [Google Scholar] [CrossRef] [PubMed]
  49. Lebrun, N.M.; Dorber, M.; Verones, F.; Henderson, D.A. Novel Endpoint Characterization Factors for Life Cycle Impact Assessment of Terrestrial Acidification. Ecol. Indic. 2025, 171, 113241. [Google Scholar] [CrossRef]
  50. JRC Technical Reports. Development of a Weighting Approach for the Environmental Footprint. Available online: https://publications.jrc.ec.europa.eu/repository/bitstream/JRC106545/jrc106545_weighting__on_line-1.pdf (accessed on 20 July 2025).
  51. Beylot, A.; Ardente, F.; Sala, S.; Zampori, L. Development of a Weighting Approach for the Environmental Footprint. JRC Technical Reports. 2020. Available online: https://publications.jrc.ec.europa.eu/repository/handle/JRC118681 (accessed on 14 July 2025).
  52. Bribián, Z.I.; Capilla, A.V.; Usón, A.A. Life Cycle Assessment of Building Materials: Comparative Analysis of Energy and Environmental Impacts and Evaluation of the Eco-Efficiency Improvement Potential. Build. Environ. 2011, 46, 1133–1140. [Google Scholar] [CrossRef]
  53. Prado, V.; Cinelli, M.; Ter Haar, S.F.; Ravikumar, D.; Heijungs, R.; Guinée, J.; Seager, T.P. Sensitivity to weighting in life cycle impact assessment (LCIA). Int. J. Life Cycle Assess. 2020, 25, 2393–2406. [Google Scholar] [CrossRef]
Figure 1. The main building of the Technical University in Zvolen prior to renovation (source: official website of the Technical University in Zvolen).
Sustainability 17 06766 g001
Figure 2. Investigated wall assemblies: 1—glass wool (scenario A)/wood-fibre insulation (scenario B); 2—anchoring elements; 3—vapor-permeable membrane; 4—ventilated air layer (52 mm thick); 5—Siberian spruce cladding (18 mm thick); 6—mineral wool (ETICS) insulation (scenario C); 7—façade render.
Sustainability 17 06766 g002
Figure 3. Detailed schematic diagram of system boundaries for LCA evaluation.
Sustainability 17 06766 g003
Figure 4. The percentage distribution by mass of construction materials across the complete renovation scenarios (scenarios A–1, B–1, and C–1).
Sustainability 17 06766 g004
Figure 5. The percentage distribution by mass of construction materials across the complete renovation scenarios (scenarios A–2, B–2 and C–2).
Sustainability 17 06766 g005
Figure 6. Building materials employed across all reconstruction scenarios (A–C), classified according to their volumetric share (in %).
Sustainability 17 06766 g006
Figure 7. Percentage-based comparison of environmental impacts across scenarios A–C.
Sustainability 17 06766 g007
Figure 8. Normalised values of selected impact factors for renovation scenarios A–C.
Sustainability 17 06766 g008
Figure 9. Distribution of primary energy: renewable (PERT) vs. non-renewable (PENRT) sources.
Sustainability 17 06766 g009
Figure 10. Environmental impact distribution by construction elements for scenarios A and B.
Sustainability 17 06766 g010
Figure 11. Environmental impact distribution by construction elements for scenario C.
Sustainability 17 06766 g011
Figure 12. CEI assessment results for individual scenarios: (A) detailed by impact category; (B) aggregated results.
Sustainability 17 06766 g012
Table 1. Geometric parameters of the building.
ParameterTotal Value
Total floor area (A)21,553 m2
Volume of heated space (V)81,786 m3
Surface area of the thermal envelope14,118 m2
Total surface area of the perimeter walls, including window openings9545.1 m2
Shape factor (A/V ratio)0.26 m2/m3
Table 2. Overview of façade renovation scenarios and key parameters.
ScenarioInsulation TypeFaçade FinishWindow TypeInsulation Thickness (Brick/Concrete)Architectural Preservation
A–1Glass woolWood + stone claddingAluminium160 mm/180 mmYes
A–2Glass woolWood + stone claddingWood–aluminium160 mm/180 mmYes
B–1Wood-fibreWood + stone claddingAluminium180 mm/200 mmYes
B–2Wood-fibreWood + stone claddingWood–aluminium180 mm/200 mmYes
C–1Mineral wool (ETICS)RenderAluminium160 mm/180 mmNo
C–2Mineral wool (ETICS)RenderWood–aluminium160 mm/180 mmNo
Table 3. Thermal and technical properties of external wall assemblies in scenarios A–C.
Scenario Heat Transfer Coefficient U (W∙m−2∙K−1)Thermal
Resistance R (m2∙K∙W−1)
Water Vapor (kg∙m−2∙Year−1) Phase Shift of Thermal
Oscillation Ψ (h)
Thermal Damping
Factor ν (-)
Annual Amount of Condensed Water VaporBalance of
Annual Amount of Condensed and
Evaporated Water Vapor
A0.1895.0931111.917294.622
B0.1915.0161119.724668.808
C0.1875.1660.352−1.661 212.941286.827
1 No amount of condensed water vapor, without condensation inside the structures. 2 The building envelope demonstrates a favourable annual moisture balance, with condensation effectively offset by evaporation.
Table 4. Energy performance indicators before and after the building renovation.
ParameterState of the BuildingTotal Value 1Unit
Specific heat loss of the buildingBefore renovation30,918.58[W/K]
After renovation13,776.70
Total heat lossesBefore renovation2,287,340.44[kWh/year]
After renovation1,019,194.02
Annual heating energy demandBefore renovation1,643,718.55[kWh/year]
After renovation365,051.91
Specific heating energy demandBefore renovation100.34[kWh/m2∙year]
After renovation22.28
Before renovation26.80[kWh/m3∙year]
After renovation5.95
1 The values are reported for the least favourable scenario (scenario B).
Table 5. Construction materials used in the refurbishment of the office building’s external walls.
VariantMaterialUnitQuantityBulk Density [kg/Unit]Mass [kg] 2
Scenario AGlass wool insulation (160 mm)m3643.542316,281.46
Glass wool insulation (180 mm)m3354.29238963.64
Black non-woven fabric (bonded to the glass wool insulation)m25990.400.05329.47
Mechanical fastening of insulation using polypropylene (PP) anchorsm30.23990245.03
Steel screws (anchors)m33.00785025,905.00
Vapor-permeable membrane 1m25990.400.191219.05
Steel substructure and fastening elements for external claddingm310.18785087,936.08
Wood cladding: Siberian spruce 1m372.4040031,855.03
Coating: thick layer of wood stain 1m30.481050557.46
Stone cladding: sandstone 1m371.972400190,011.89
Aluminium windows: frames 1m311.46270034,047.81
Triple-glazed insulating glass 1m342.662600121,997.30
Wood–aluminium windows: wood frames 1m371.7640031,574.62
Wood–aluminium windows: aluminium profiles 1m33.78270011,217.30
Scenario BWood-fibre insulation (180 mm)m3314.9311038,106.29
Wood-fibre insulation (200 mm)m3723.9811087,601.34
Mechanical fastening of insulation using polypropylene (PP) anchorsm30.25990269.53
Steel screws (anchors)m33.23785027,847.88
Steel substructure and fastening elements for external claddingm311.08785095,695.14
Scenario CMineral wool insulation (160 mm)m3643.54150106,183.44
Mineral wool insulation (180 mm)m3354.2915058,458.51
Façade renderm359.901800118,609.92
Mechanical fastening of insulation using polypropylene (PP) anchorsm30.23990245.03
Steel screws (anchors)m33.00785025,905.00
1 The type and quantity of materials are identical in both scenario A and scenario B. 2 The reported weight includes a 10% allowance.
Table 6. Environmental impact categories selected for the assessment.
Impact IndicatorImpact CategoryDescriptionUnit
ADEAbiotic depletion of elementsReduction in non-renewable natural resources—minerals and metals[kg Sb eq]
ADFAbiotic depletion of fossilsReduction in non-renewable natural resources—fossil fuels[MJ]
GWPGlobal warming potentialIncrease in average atmospheric
temperature caused by greenhouse
gas emissions
[kg CO2 eq]
ODPOzone depletion potentialThinning of the ozone layer[kg CFC-11 eq]
HTHuman toxicityAdverse effect of chemical substances on human health[kg 1,4-DCB eq]
FAEFreshwater aquatic ecotoxicityAdverse effect of chemical substances on freshwater, marine, and soil ecosystems [kg 1,4-DCB eq]
MAEMarine aquatic ecotoxicity[kg 1,4-DCB eq]
TETerrestrial ecotoxicity[kg 1,4-DCB eq]
POCPPhotochemical ozone creation potentialPollution due to the presence of
unburnt hydrocarbons and
nitrogen oxides
[kg C2H4 eq]
APAcidification potentialLowering the pH of lakes, rivers,
forests, and soils
[kg SO2 eq]
EPEutrophication potentialLowering of oxygen content in soils
and surface waters
[kg PO43− eq]
PERTPrimary energy renewable totalEnergy content of renewable and non-renewable resources before its conversion[GJ]
PENRTPrimary energy non-renewable total[GJ]
Table 7. Coefficient of variation results of the uncertainty analysis.
Impact CategoryScenario A–1Scenario A–2Scenario B–1Scenario B–2Scenario C–1Scenario C–2
ADE22.20%22.90%19.40%21.80%23.50%21.60%
ADF17.50%16.30%13.90%13.70%18.90%16.60%
AP12.80%14.00%12.00%11.30%13.60%12.90%
EP37.20%38.30%36.70%32.30%33.00%36.00%
FAE64.50%55.90%49.90%50.00%34.20%39.00%
GWP12.10%13.20%10.70%10.10%12.80%11.70%
HT61.40%71.00%55.00%77.60%68.30%102.00%
MAE41.60%41.50%41.20%40.50%53.40%53.70%
ODP11.80%11.90%11.50%11.80%12.50%12.60%
POCP15.40%13.70%13.10%10.90%17.20%13.50%
TE176.00%407.00%235.00%812.00%339.00%1050.00%
Disclaimer/Publisher’s Note: The statements, opinions and data contained in all publications are solely those of the individual author(s) and contributor(s) and not of MDPI and/or the editor(s). MDPI and/or the editor(s) disclaim responsibility for any injury to people or property resulting from any ideas, methods, instructions or products referred to in the content.

