Article

The Synergistic Evolution and Coordination of the Water–Energy–Food Nexus in Northeast China: An Integrated Multi-Method Assessment

1
Academy of Eco-Civilization Development for Jing-Jin-Ji Megalopolis, Tianjin Normal University, Tianjin 300387, China
2
State Key Laboratory of Water Cycle and Water Security, China Institute of Water Resources and Hydropower Research (IWHR), Beijing 100038, China
3
State Key Laboratory of Hydroscience and Engineering, Tsinghua University, Beijing 100084, China
4
School of Civil Engineering, Tianjin Chengjian University, Tianjin 300384, China
5
Tianjin Key Laboratory of Civil and Structure Protection and Reinforcement, Tianjin 300384, China
*
Author to whom correspondence should be addressed.
Sustainability 2025, 17(15), 6745; https://doi.org/10.3390/su17156745
Submission received: 5 June 2025 / Revised: 19 July 2025 / Accepted: 21 July 2025 / Published: 24 July 2025

Abstract

The interconnections among water, energy, and food (WEF) systems are growing increasingly complex, making it essential to understand their evolutionary mechanisms and coordination barriers to enhance regional resilience and sustainability. In this study, we investigated the WEF system in Northeast China by constructing a comprehensive indicator system encompassing resource endowment and utilization efficiency. The coupling coordination degree (CCD) of the WEF system was quantitatively assessed from 2001 to 2022. An obstacle degree model was employed to identify key constraints, while grey relational analysis was used to evaluate the driving influence of individual indicators. Furthermore, a co-evolution model based on logistic growth and competition–cooperation dynamics was developed to simulate system interactions. The results reveal the following: (1) the regional WEF-CCD increased from 0.627 in 2001 to 0.769 in 2022, reaching the intermediate coordination level, with the CCDs of the food, water, and energy subsystems rising from 0.39 to 0.62, 0.38 to 0.60, and 0.40 to 0.55, respectively, highlighting that the food subsystem had the most stable and significant improvement; (2) Jilin Province attained the highest WEF-CCD, 0.850, in 2022, while that for Heilongjiang remained the lowest, at 0.715, indicating substantial interprovincial disparities; (3) key indicators, such as food self-sufficiency rate, electricity generation, and ecological water use, functioned as both core constraints and major drivers of system performance; (4) co-evolution modeling revealed that the food subsystem exhibited the fastest growth, followed by water and energy ( α 3   >   α 1 >   α 2 > 0), with mutual promotion between water and energy subsystems and inhibitory effects from the food subsystem, ultimately converging toward a stable equilibrium state; and (5) interprovincial co-evolution modeling indicated that Jilin leads in WEF system development, followed by Liaoning and Heilongjiang, with predominantly cooperative interactions among provinces driving convergence toward a stable and coordinated equilibrium despite structural asymmetries. This study proposes a transferable, multi-method analytical framework for evaluating WEF coordination, offering practical insights into bottlenecks, key drivers, and co-evolutionary dynamics for sustainable resource governance.

1. Introduction

1.1. Background

Water, energy, and food are fundamental resources essential for human survival and strategic assets for socioeconomic development [1]. With the rapid growth of the global population, accelerated economic development, and intensifying climate change, the interconnections among these three systems have become increasingly complex, leading to mounting challenges, such as resource scarcity and environmental degradation. It is estimated that, between 2007 and 2025, water demand will have increased by 50% in developing countries and by 18% in developed countries. Global energy consumption is projected to rise by 48% from 2012 to 2040, and food demand is expected to increase by 50% by 2050 [2,3]. Ensuring adequate and secure supplies of water, energy, and food has thus become a critical challenge for countries worldwide. Currently, the availability of clean freshwater resources is declining, exacerbating the pressures affecting energy demand, food production, and water supply security. Moreover, rapid regional economic development is often accompanied by substantial energy consumption, further highlighting the interdependencies and trade-offs among water, energy, and food systems. At the same time, uncertainties stemming from external policies, economic dynamics, social change, and environmental variability contribute to the imbalanced development of the water–energy–food (WEF) nexus, widening resource gaps. Therefore, gaining a comprehensive understanding of the WEF nexus is essential for promoting ecological well-being and advancing sustainable development [4,5].
There exists a close and complex interplay among the water, food, and energy systems. Changes in any one of these subsystems may significantly affect the others [6]. Specifically, water resources are essential for energy-related activities, yet these water resources must undergo processes such as extraction, desalination, transportation, and wastewater treatment, all of which require substantial energy input. Likewise, the extraction, processing, and conversion of fossil fuels—such as coal and oil—consume large quantities of water. In the food subsystem, every stage of agricultural production, from planting and irrigation to harvesting and processing, depends on both water and energy inputs. However, agricultural residues, such as straw, can be utilized as raw materials for biomass energy production. Thus, these three subsystems are interdependent, forming a highly integrated and constrained system characterized by multivariable coupling. The specific relationships within the WEF system are shown in Figure 1. Fundamentally, the WEF system aims to align the development of these resources within the framework of sustainability. Strategically addressing the WEF system is vital for reconciling the tension between economic development and resource scarcity and for achieving regional sustainable development.

1.2. Literature Review

In recent years, research on the WEF system has become more diverse in terms of spatial scale. Many scholars have conducted WEF system evaluations at national and regional scales, while others have addressed river basins and even household levels [7,8,9], covering a wide range of geographic contexts. Focusing on the global food–energy–water nexus, Scanlon et al. [10] emphasized the potential strategies to achieve food and energy security within the constraints of the planet’s finite renewable water resources. Similarly, D’Odorico et al. [11] highlighted the intrinsic interconnections among food, water, and energy systems, which offer valuable opportunities to formulate synergistic strategies—such as circular economy approaches—for achieving sustainable security across the three sectors. Ju et al. [12] evaluated the WEF security status of 30 provinces in China by constructing an indicator system based on the pressure–state–response framework. Zheng et al. [13] quantified food production efficiency in China through the lens of the WEF nexus and found that overall food production efficiency has shown an upward trend, although significant spatial disparities exist across provinces. Foroushani et al. [14] adopted a systems-based approach to develop decision-making policies for integrated water resource management in Iran, using the water–energy–food nexus as a foundation. Wang et al. [15] incorporated potential trade-offs and synergies in their development of a system dynamics model for Hunan Province that integrates water, energy, food, society, economy, and the environment to track the evolution of the regional nexus system. Xia et al. [16] explored the impacts of China’s new urbanization strategy on resource pressures from the WEF perspective, and their findings suggest that demographic and social urbanization significantly intensify WEF system pressures, whereas economic and spatial urbanization contribute to their alleviation.
Methodologically, recent studies on the WEF system have employed a variety of analytical approaches, including input–output analysis [17,18], life cycle assessment (LCA) [19,20], system dynamics models [21,22,23,24,25,26], water footprint analysis [27,28], coupling coordination degree models [29,30,31,32,33,34], and integrated optimization frameworks [35,36,37]. For instance, Bellezoni et al. [38] applied an eco-economic input–output model to assess the impacts of various ethanol supply scenarios on water, energy, land use, and greenhouse gas emissions in Brazil and proposed targeted policy recommendations. Sánchez-Zarco and Ponce-Ortega [39] developed a multi-objective optimization approach integrating circular economy principles with LCA, ecological footprint analysis, and social benefit evaluation to enhance regional WEF security. In China, Wen et al. [40] established a WEF nexus feedback model for resource-dependent regions in Daqing using a system dynamics model. By designing five future policy scenarios, they analyzed the effects of different government interventions on the WEF system. Similarly, Du et al. [41] constructed a household-level food–energy–water nexus model for Melbourne, Australia, using a system dynamics model to evaluate water conservation, energy savings, and carbon emission reductions across 4 scenarios and 37 sub-scenarios. They found that behavioral changes among residents had the greatest impact on reducing resource consumption, while equipment upgrades and price adjustments were less effective. Yue and Guo [42] proposed a novel water–energy–food–environment nexus optimization model that balances multiple objectives—including maximizing net economic benefit and renewable energy production and minimizing water and carbon footprints—thereby enabling trade-off solutions among socioeconomic development, resource utilization, and environmental sustainability. Due to their computational simplicity and effectiveness in quantifying the degree of synergy among multiple systems, the coupling coordination degree (CCD) model has become a widely used tool for analyzing the coordinated evolution of complex systems. Mondal et al. [43] developed a CCD model to examine the WEF nexus at the sub-national level in India for the years 2011 and 2021, identifying regions where improvements in WEF security coordination are needed. Wang et al. [44] applied an advanced CCD model and the geographic detector method within a theoretical framework linking the WEF nexus and poverty to evaluate the spatiotemporal coupling between the two in the Yellow River Basin and to identify key influencing factors. Cheng et al. [45] used the CCD model to quantitatively assess the interactions and coordination level among China’s food, water, and energy systems in the context of Sustainable Development Goals 2, 6, and 7. Qin et al. [46] expanded the traditional WEF framework by incorporating ecological and land systems and employed an entropy weight method, composite index model, and CCD model to evaluate the coupling coordination development in the Yangtze River Delta region.
Over the past few years, growing climate uncertainty and increasing socioecological pressures have prompted a surge in multidimensional and cross-sectoral research on the WEF system. Marouani et al. [47] proposed an integrated “WEF–Health” coupling framework, which innovatively repositions health from being a passive burden to being an active system resource and driver. Similarly, Devlin et al. [48] underscored the urgent need to address the public health risks associated with climate change, advocating for a place- and context-specific interdisciplinary collaboration pathway with valuable applications in the southeastern United States. At the micro-practice level, Di Giuseppe et al. [49] demonstrated that organic insulating materials—such as combinations of marshmallow and straw—can significantly mitigate late frost damage in vineyards, while reducing energy consumption, providing a scalable and cost-effective solution for climate-resilient agriculture. In terms of methodological innovation, Yao et al. [50] developed a water–energy–land–food (WELF) performance index to assess China’s low-carbon transition, identifying regional disparities in resource efficiency and emphasizing the need for differentiated policy responses. Chang et al. [51] introduced a Copula-based joint risk model and a three-dimensional security evaluation framework (Rel-Cor-Res) to dynamically quantify the coupling security of the agricultural system in Northeast China. Focusing on climate change as a dominant risk driver, Herrera-Franco et al. [52] conducted a comprehensive review of over 1200 studies, highlighting the profound governance and sustainability implications of WEF–climate interlinkages. Collectively, these studies expand the scope of WEF system research by incorporating dimensions such as health integration, climate adaptation, joint risk assessment, regional differentiation, and technological innovation. Together, they provide both a theoretical foundation and a practical direction for advancing more resilient and sustainable development strategies in the future.
In summary, although existing studies have made considerable progress in promoting the sustainable development of the WEF system, several critical gaps remain. First, most current indicator systems focus primarily on resource inputs or the evaluation of individual subsystems, with limited attention to multidimensional features, such as system efficiency and sustainability. There is also a lack of systematic identification and quantitative characterization of key “high-barrier + high-driver” variables that constrain or promote system performance. Second, the majority of studies adopt static analytical approaches to assess system conditions, which fail to capture the nonlinear interactions and dynamic feedback mechanisms that evolve over time among WEF subsystems. As a result, the identification of competitive or synergistic relationships often remains at a qualitative level, lacking a robust theoretical framework or quantitative tools for evaluating system stability and resilience.

1.3. Novelty

This study builds upon the synergy evolution model proposed by Sun et al. [53], who employed logistic growth dynamics and synergy theory to examine the competitive and cooperative relationships among WEF subsystems across China. While their work provides a valuable foundation, it primarily focuses on national-scale static classification and lacks dynamic simulation of inter-regional coupling and stability mechanisms. Inspired by their framework, this study introduces a series of theoretical innovations and methodological advancements, with particular emphasis on dynamic interaction mechanisms, multidimensional evaluation, and regional applicability.
First, the three northeastern provinces of China—Liaoning, Jilin, and Heilongjiang—are selected as the empirical setting. These regions are not only key national grain production bases but also exhibit distinct resource endowments, strong subsystem interdependencies, and varied environmental constraints. This makes them an ideal case for exploring the complexity and regional heterogeneity of WEF system coordination and evolution, which has received limited attention in previous literature.
Second, a novel multi-method integrated evaluation framework is developed. Specifically, this study makes the following contributions: (1) A scientifically grounded and system-specific indicator system is developed to comprehensively capture the structural characteristics, efficiency, and sustainability of the WEF system, and then a coupling coordination degree model is constructed using a comprehensive weighting method that integrates the entropy weight method and the CRITIC method. (2) An obstacle degree diagnosis model is introduced to identify the key limiting factors that hinder system coordination, while grey relational analysis is employed to quantify the relative influence of driving variables, thereby deepening our understanding of how these factors shape the coordinated evolution of the WEF system. (3) A logistic-based co-evolution model is established to dynamically characterize the competitive–synergistic relationships among the water, energy, and food subsystems. By identifying dynamic equilibrium points among subsystems, this research advances our theoretical understanding of how cross-sectoral systems can transition from disordered interaction to synergistic stability over time. (4) The model is further extended to an interprovincial scale, enabling the comparative analysis of subsystem interactions and coordination differences across administrative boundaries—an aspect rarely quantified in prior studies.
Third, from a policy application perspective, the proposed framework generates region-specific insights that are directly relevant to improving WEF system governance under climate and socioeconomic stressors. The findings support more targeted and adaptive strategies for balancing resource allocation, enhancing coordination efficiency, and promoting resilient development in Northeast China, offering a transferable analytical paradigm for other resource-intensive or agriculturally strategic regions.
In summary, this study contributes a novel, dynamic, and policy-relevant analytical approach to WEF nexus research, bridging gaps in spatial scale, indicator integration, interaction modeling, and regional differentiation.

2. Materials and Methods
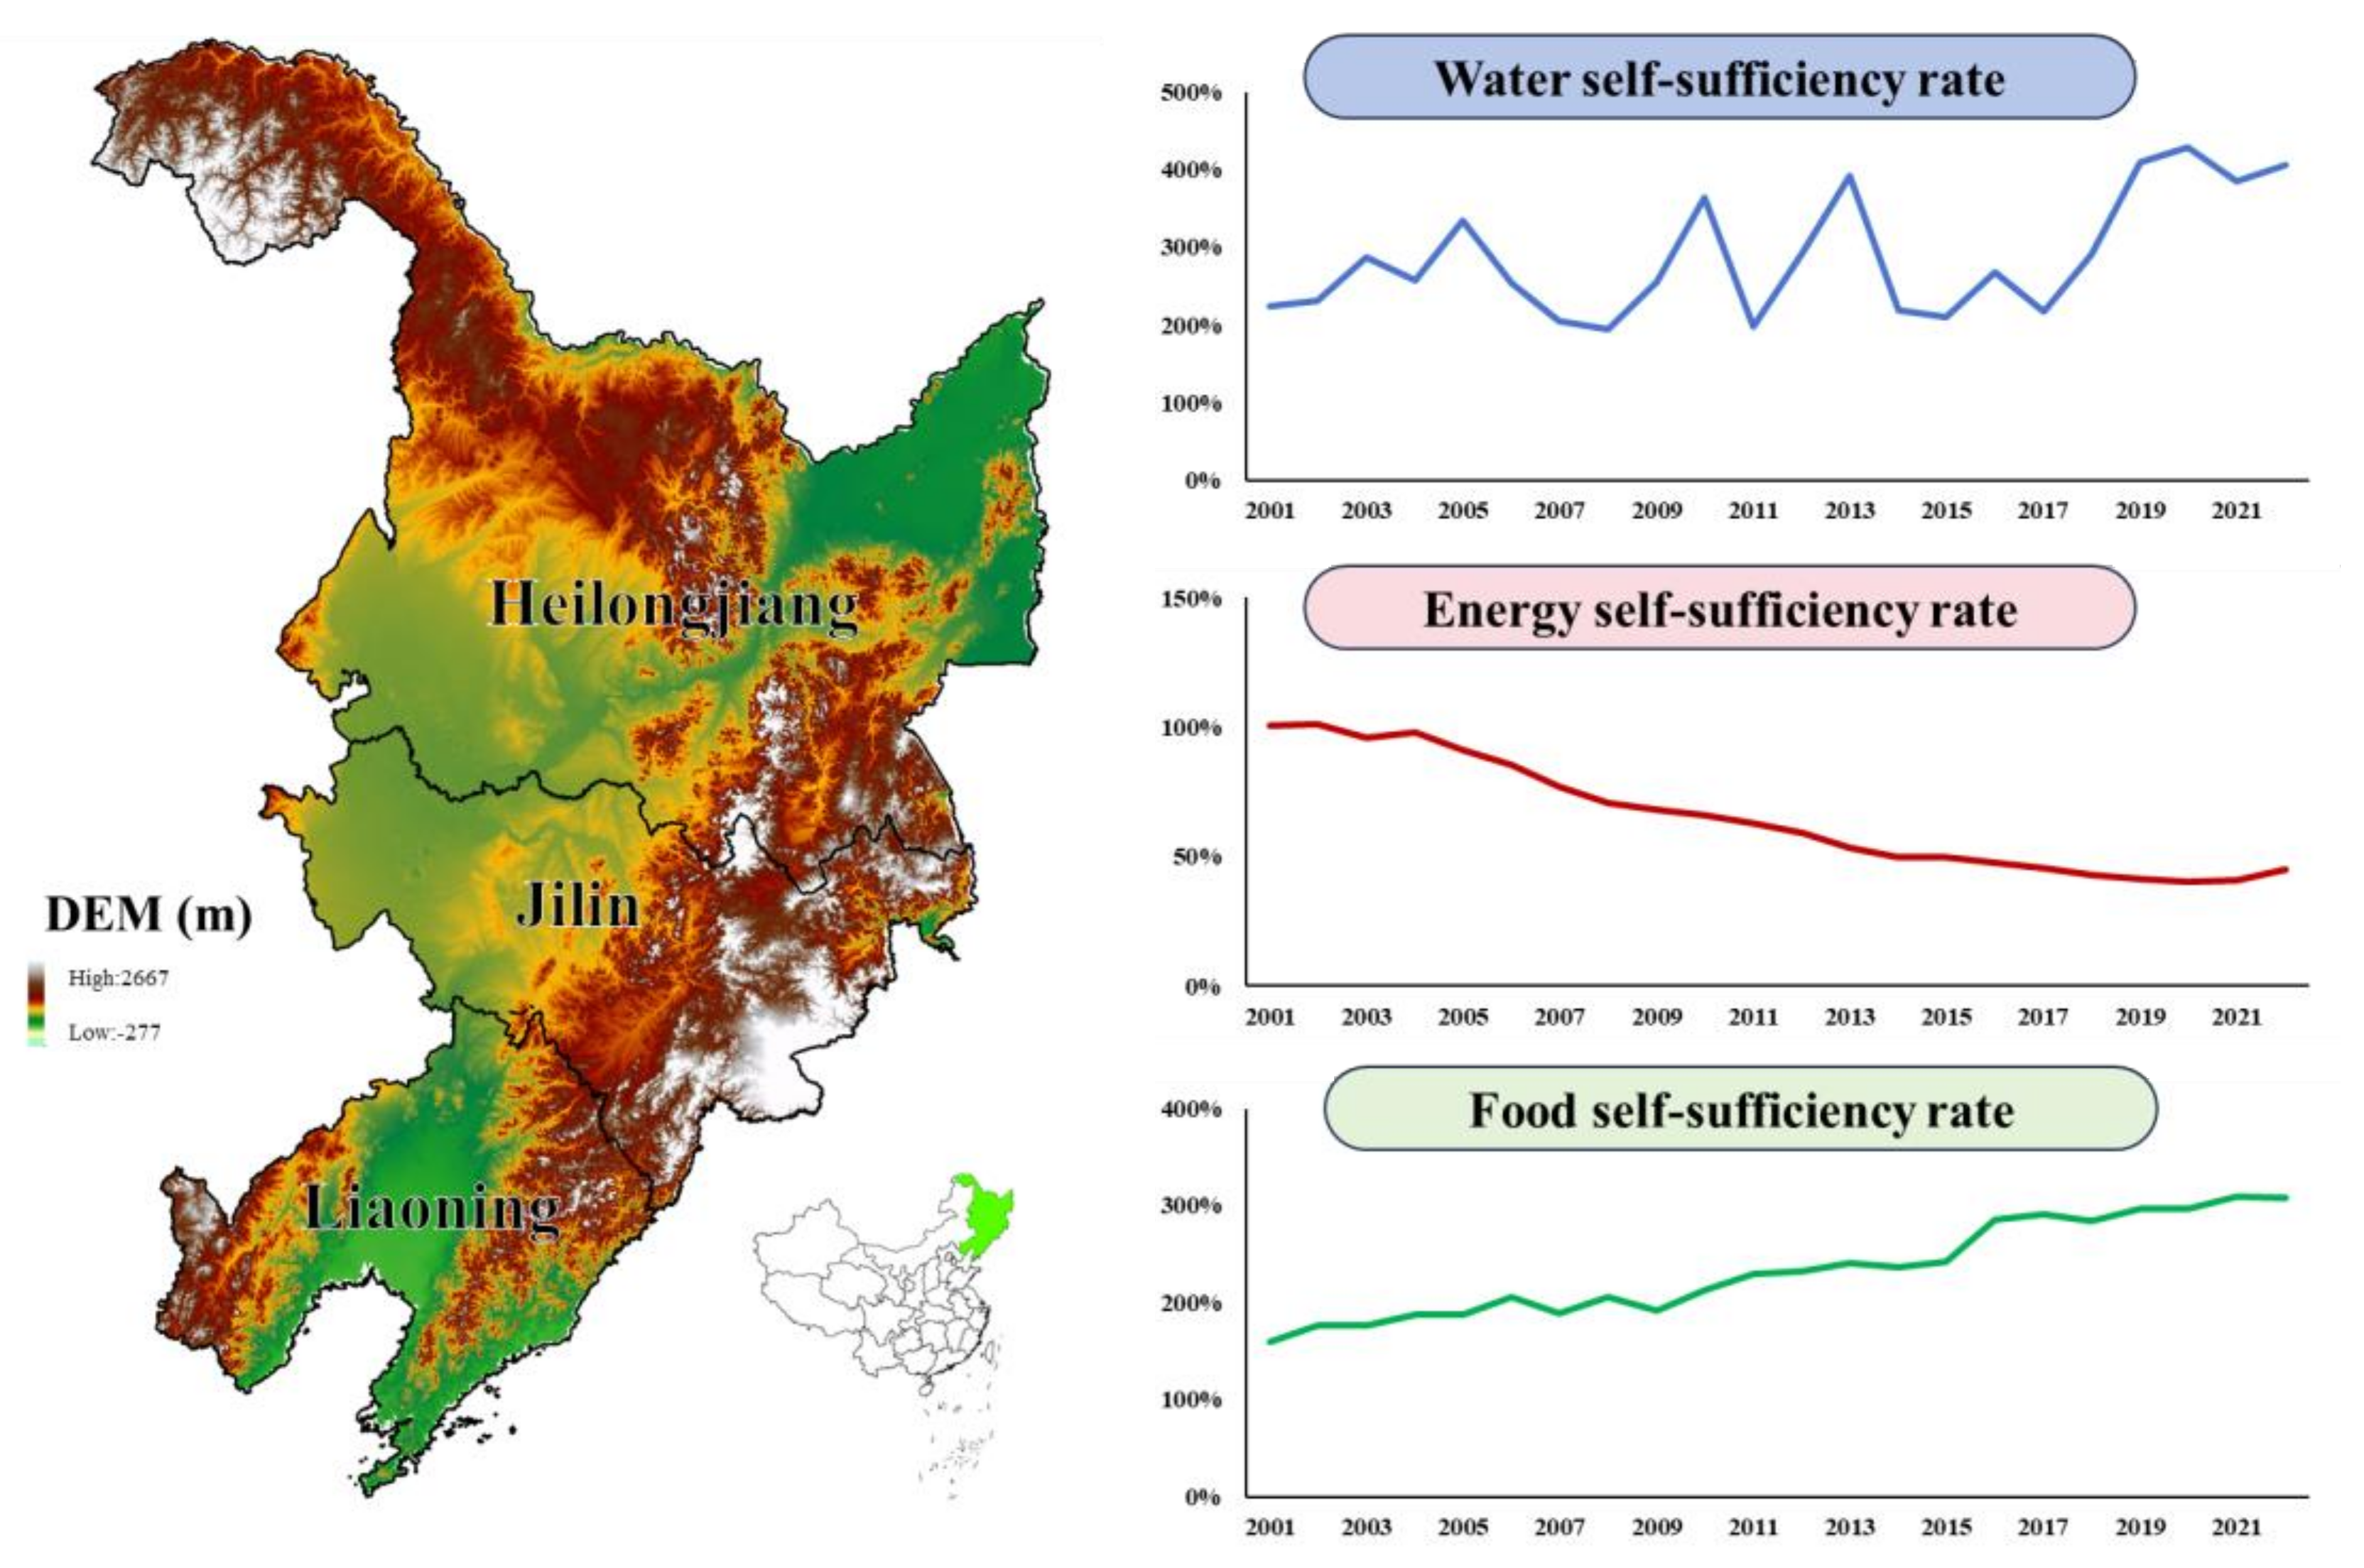
2.1. Study Area

In this study, Northeast (NE) China, encompassing the provinces of Liaoning (LN), Jilin (JL), and Heilongjiang (HLJ), is selected as a representative case study area (see Figure 2). Covering a total area of approximately 916,000 km2, the region serves as a major national base for commercial food production and energy development, playing a pivotal role in ensuring China’s food and energy security. Situated in the mid-latitude temperate monsoon climate zone, the region exhibits high seasonal precipitation and a pronounced spatial and temporal imbalance in water resource distribution. With the continued growth in water demand for agriculture, industry, and urban use, the imbalance between water supply and demand has become increasingly acute. The long-term average water self-sufficiency rate (water resources/water use) in the region stands at approximately 287%. In terms of energy, Northeast China has traditionally relied on fossil fuels, notably coal and oil, and is home to major resource-based energy hubs, such as the Daqing Oilfield and the Fushun Mining Area. In recent years, the region has seen the accelerated development of clean energy, including wind power. However, the energy sector remains heavily dependent on traditional resources, facing considerable pressure to embark upon industrial transformation and structural optimization. Energy utilization efficiency remains low, and the regional energy self-sufficiency rate (energy production/energy consumption) has declined to below 50% in recent years. The three provinces constitute one of China’s most important food-producing regions, characterized by strong land resource endowment and high levels of agricultural mechanization. The region has consistently ranked among the top scorers in national food output and marketability, with a long-term average food self-sufficiency rate (food production/food consumption) of 234%. Nevertheless, the sustainability of the food system is increasingly challenged by climate change and rising agricultural input costs. Overall, the WEF systems in Northeast China are characterized by strong coupling and mutual constraints. Understanding the synergistic evolution and coordination of these systems is essential for ensuring regional resource security and promoting green development. Therefore, it is of critical scientific importance to identify the key limiting factors, clarify the mechanisms of inter-system coordination, and enhance the sustainability of the WEF nexus in this strategically significant region.

2.2. WEF Indicator System

To comprehensively reflect the operational characteristics and coordinated development status of the WEF systems in Northeast China, this study establishes an integrated indicator system encompassing the three major subsystems. The selection of indicators adheres to the principles of scientific rigor, system completeness, and data availability. Drawing on the relevant literature [54,55,56,57], the indicators are designed to capture key dimensions, such as resource input, process efficiency, utilization structure, and development potential, while also accounting for regional heterogeneity and the actual stage of socioeconomic development. The specific indicators are presented in Table 1.
The study period spans from 2001 to 2022. Socioeconomic, energy, water resource, and agricultural data are primarily obtained from the China Statistical Yearbook, Liaoning Statistical Yearbook, Jilin Statistical Yearbook, Heilongjiang Statistical Yearbook, Liaoning Water Resources Bulletin, Jilin Water Resources Bulletin, Heilongjiang Water Resources Bulletin, China Water Resources Statistical Yearbook, Songliao River Basin Water Resources Bulletin, China Energy Statistical Yearbook, and Rural Statistical Yearbook. For years with missing data, linear interpolation was employed to estimate missing values using adjacent annual observations. Data sources and calculation methods for WEF indicators can be found in Table A1.

2.3. Coupling Coordination Evaluation Method

2.3.1. Indicator Normalization

Due to differences in dimensions and directions across the original indicators, all variables were first standardized to ensure comparability. The min–max normalization method is used, with separate formulas applied depending on the indicator direction.
For positive indicators (“+”, the higher, the better), the following formula is applied:
x i j = x i j min x j max x j min x j
For negative indicators (“−”, the lower, the better), the following formula is applied:
x i j = max x j x i j max x j min x j
where x i j denotes the original value of the j-th indicator in year i, and x i j represents its normalized value.

2.3.2. Comprehensive Weighting Method

To fully capture both the objective variability and internal conflicts among indicators, this study adopts a combined weighting approach that integrates the entropy weight method (EWM) and the criteria importance through intercriteria correlation (CRITIC) method.
The EWM evaluates the information entropy of each indicator to measure its level of dispersion.
e j = k i = 1 n p i j ln p i j ,   p i j = x i j i = 1 n x i j ,   k = 1 ln n
The entropy weight is calculated as follows:
w j E =   1 e j j = 1 m 1 e j
The CRITIC method accounts for both the variability (standard deviation σ j ) and the conflict (correlation) among indicators. The conflict intensity is derived from the correlation coefficient matrix r j k .
The CRITIC weight is calculated as follows:
w j C =   C j j = 1 m C j ,   C j =   σ j k = 1 m 1 r j k
The final weight is a linear combination of the two methods, with equal importance assigned to each ( λ   = 0.5), as follows:
w j =   λ w j E + 1 λ w j C

2.3.3. Coupling Coordination Degree

To evaluate the integrated development level of the three subsystems (water, energy, food), a weighted aggregation is first performed using normalized indicator values and combined weights. The comprehensive score U i for subsystem i is calculated as follows:
U i =   j = 1 m w i j x i j
(1)
Coupling Degree (C)
C reflects the strength of the interaction among the three subsystems, as follows:
C   =   U 1 U 2 U 3 U 1 + U 2 + U 3 3 1 / 3 3
(2)
Comprehensive Development Index (T)
T measures the overall development level. Equal weights are assigned to each subsystem ( a 1 = a 2 = a 3 = 1 / 3 ), as follows:
T   =   i = 1 3 a i U i
(3)
Coordination Degree (CCD)
The CCD captures both the coordination level and overall system development, as follows:
C C D   =   C T
The CCD ranges from 0 to 1, with higher values indicating stronger coupling and better coordinated development. Classification thresholds are shown in Table 2.

2.4. Obstacle Degree and Grey Relational Models

2.4.1. Obstacle Degree Model

To identify the key factors hindering the coordinated development of the WEF system in Northeast China, this study adopts the obstacle degree model. This model is used to quantitatively evaluate the extent to which each indicator constrains the coupling coordination level of its respective system by jointly considering the indicator’s relative underperformance and its assigned weight.
The obstacle degree is calculated as follows:
O i j =   1 x i j w j
O i = O i j j = 1 m O i j
where O i j represents the obstacle degree value of the j-th indicator in year i, and O i denotes the relative obstacle degree in year i. A higher obstacle degree indicates that the indicator has a stronger negative influence on the system’s coordination level and is a critical factor limiting high-quality synergy within the WEF system.

2.4.2. Grey Relational Analysis Method

To explore the relationship between each indicator and the WEF-CCD, this study applies grey relational analysis (GRA). GRA measures the consistency of variation trends between variables by calculating grey relational coefficients between a reference sequence and comparison sequences, making it particularly suitable for identifying relationships in multidimensional, heterogeneous systems.
(1)
Construction of the Reference and Comparison Sequences
Let X 0 = { x 0 ( 1 ) , x 0 ( 2 ) , , x 0 ( n ) } denote the reference sequence representing the WEF-CCD over time, and X j = { x j ( 1 ) , x j ( 2 ) , , x j ( n ) } denote the normalized sequence of the j-th indicator.
(2)
Calculation of the Grey Relational Coefficient
ξ j k = min j min k x 0 k x j k + ρ max j max k x 0 k x j k x 0 k x j k + ρ max j max k x 0 k x j k
where ξ j k is the grey relational coefficient between the WEF-CCD and the j-th indicator at time k; ρ is the distinguishing coefficient, typically set to 0.5; x 0 k and x j k are the values of the reference and comparison sequences at time k, respectively.
(3)
Calculation of the Grey Relational Degree
γ j = 1 n k = 1 n ξ j k
where γ j denotes the grey relational degree between the j-th indicator and the WEF-CCD, with a range of [0, 1]. A higher value of γ j indicates a stronger explanatory or influencing power of the corresponding indicator on the system’s coordinated evolution.

2.5. Co-Evolutionary Model

2.5.1. Model Construction

In coupled systems, synergy refers to the process by which subsystems coordinate and synchronize their development, transitioning from a disordered to an ordered state. This evolutionary process typically follows an S-shaped growth pattern and can be effectively described using a logistic growth model as follows:
d X d t   =   α X ( 1 X )
where X denotes the development level of the coupled system, and α is the intrinsic growth rate. The right X represents the growth factor, increasing over time, while ( 1 X ) is the deceleration factor, decreasing as the system increases. This nonlinear dynamic captures both positive and negative feedback mechanisms.
Let X ¯ 1 ,   X ¯ 2 , and X ¯ 3 represent the coupling coordination degrees of the water, energy, and food subsystems, respectively. Considering inter-system interactions, we introduce β i j ( i , j   = 1 , 2 , 3 ) to denote the competitive influence of subsystem j on subsystem i. The extended co-evolution model for multi-subsystems can then be expressed as follows:
d X ¯ 1 d t   =   f 1 X ¯ 1 , X ¯ 2 , X ¯ 3   =   Y 1 =   α 1 X ¯ 1 1 X ¯ 1 β 12 X ¯ 2 β 13 X ¯ 3 d X ¯ 2 d t   =   f 2 X ¯ 1 , X ¯ 2 , X ¯ 3   =   Y 2 =   α 2 X ¯ 2 1 X ¯ 2 β 21 X ¯ 1 β 23 X ¯ 3 d X ¯ 3 d t   =   f 3 X ¯ 1 , X ¯ 2 , X ¯ 3   =   Y 3 =   α 3 X ¯ 3 1 X ¯ 3 β 31 X ¯ 1 β 32 X ¯ 2
where α 1 , α 2 , and α 3 represent the intrinsic growth coefficients of the respective subsystems. A positive α i indicates growth, while a negative value indicates decline. The coefficients β i j characterize inter-system influence: β i j > 0 implies competition, and β i j   < 0 implies cooperation.

2.5.2. Stability Analysis of the Co-Evolution Model

The coupled system reaches equilibrium when the following apply:
f 1 X ¯ 1 , X ¯ 2 , X ¯ 3   =   0 f 2 X ¯ 1 , X ¯ 2 , X ¯ 3   =   0 f 3 X ¯ 1 , X ¯ 2 , X ¯ 3   =   0
The following five equilibrium points ( X 10 , X 20 , X 30 ) can be obtained: E 1 ( 0 , 0 , 0 ) , E 2 ( 0 , 0 , 1 ) , E 3 ( 0 , 1 , 0 ) , E 4 ( 1 , 0 , 0 ) , and E 5 ( A 1 A , A 2 A , A 3 A ) .
Based on Cramer’s law, the following can be obtained:
A   =   1 β 12 β 13 β 21 1 β 23 β 31 β 32 1 ,   A 1 =   1 β 12 β 13 1 1 β 23 1 β 32 1 , A 2 =   1 1 β 13 β 21 1 β 23 β 31 1 1 , A 3 =   1 β 12 1 β 21 1 1 β 31 β 32 1
The coordinates of E 5 ( A 1 A , A 2 A , A 3 A ) can be obtained, as follows:
X 10 =   1 β 23 β 32 + β 12 β 23 β 12 + β 13 β 32 β 13 1 + β 12 β 23 β 31 + β 13 β 21 β 32 β 23 β 32 β 12 β 21 β 13 β 31 , X 20 =   1 β 23 + β 23 β 31 β 21 + β 13 β 21 β 13 β 31 1 + β 12 β 23 β 31 + β 13 β 21 β 32 β 23 β 32 β 12 β 21 β 13 β 31 , X 30 =   1 β 32 + β 31 β 12 β 12 β 21 + β 21 β 32 β 31 1 + β 12 β 23 β 31 + β 13 β 21 β 32 β 23 β 32 β 12 β 21 β 13 β 31 .
Whether an equilibrium point qualifies as a stable point can be determined by evaluating the following three parameters: p, q, and r. The detailed derivation and calculation procedures for these parameters are provided in Appendix A.1.
Specifically, an equilibrium point ( X 10 , X 20 , X 30 ) is considered stable if the following conditions are met: p   <   0 ,   q   <   0 ,   r   <   0 . Conversely, if p   0 , the equilibrium point is unstable.

2.5.3. Optimization Objective and Parameter Estimation

To estimate the parameters α and β in the WEF co-evolution model, we construct a multi-objective nonlinear optimization problem, as shown in Equation (20). The objective function minimizes the sum of squared errors between the simulated system trajectories ( f 1 ,   f 2 ,   f 3 ) and the actual normalized coordination scores ( Y 1 ,   Y 2 ,   Y 3 ) across all three subsystems over the study period. The model includes constraints on system status variables and parameters to ensure the boundedness and convergence of the solution, as follows: p   < 0 , q   < 0 , r   < 0 , 0 < X   < 1 .
f = min 1 3 [ y = 1 y e a r ( Y 1 f 1 ) 2 + y = 1 y e a r ( Y 2 f 2 ) 2 + y = 1 y e a r ( Y 3 f 3 ) 2 ]
To solve this constrained nonlinear optimization problem, a genetic algorithm (GA) is used due to its strong global search capability and suitability for complex, non-convex problems. The GA iteratively evolves a population of candidate solutions { z 1 , z 2 , , z l } within predefined variable bounds [ a j , b j ], as shown in Equation (21). The initial parameter ranges are determined based on empirical knowledge and prior studies [53,58]. All optimization tasks are implemented in MATLAB R2020b using the Global Optimization Toolbox on a Windows 11 platform (Intel Core i7 CPU, 32 GB RAM).
min   f ( z 1 , z 2 , , z l ) ,       s . t .     a j z j b j ,     j = 1,2 , , l

2.5.4. Equilibrium Point

The WEF coupled system evolves dynamically over time but ultimately trends toward a stable state. Among the five equilibrium points, E 1 (0, 0, 0) is unstable and represents the system’s initial undeveloped state. Points E 2 ( 0 , 0 , 1 ) , E 3 ( 0 , 1 , 0 ) , and E 4 ( 1 , 0 , 0 ) represent the extreme dominance of a single subsystem—water, energy, or food—while the others collapse, which lacks practical sustainability. In contrast, E 5 ( X 10 , X 20 , X 30 ) represents a balanced and cooperative development state, where all three subsystems coexist with mutual competition and collaboration. Under certain conditions, the system can evolve towards this stable configuration, which reflects an optimal state of coordinated resource development.

3. Results

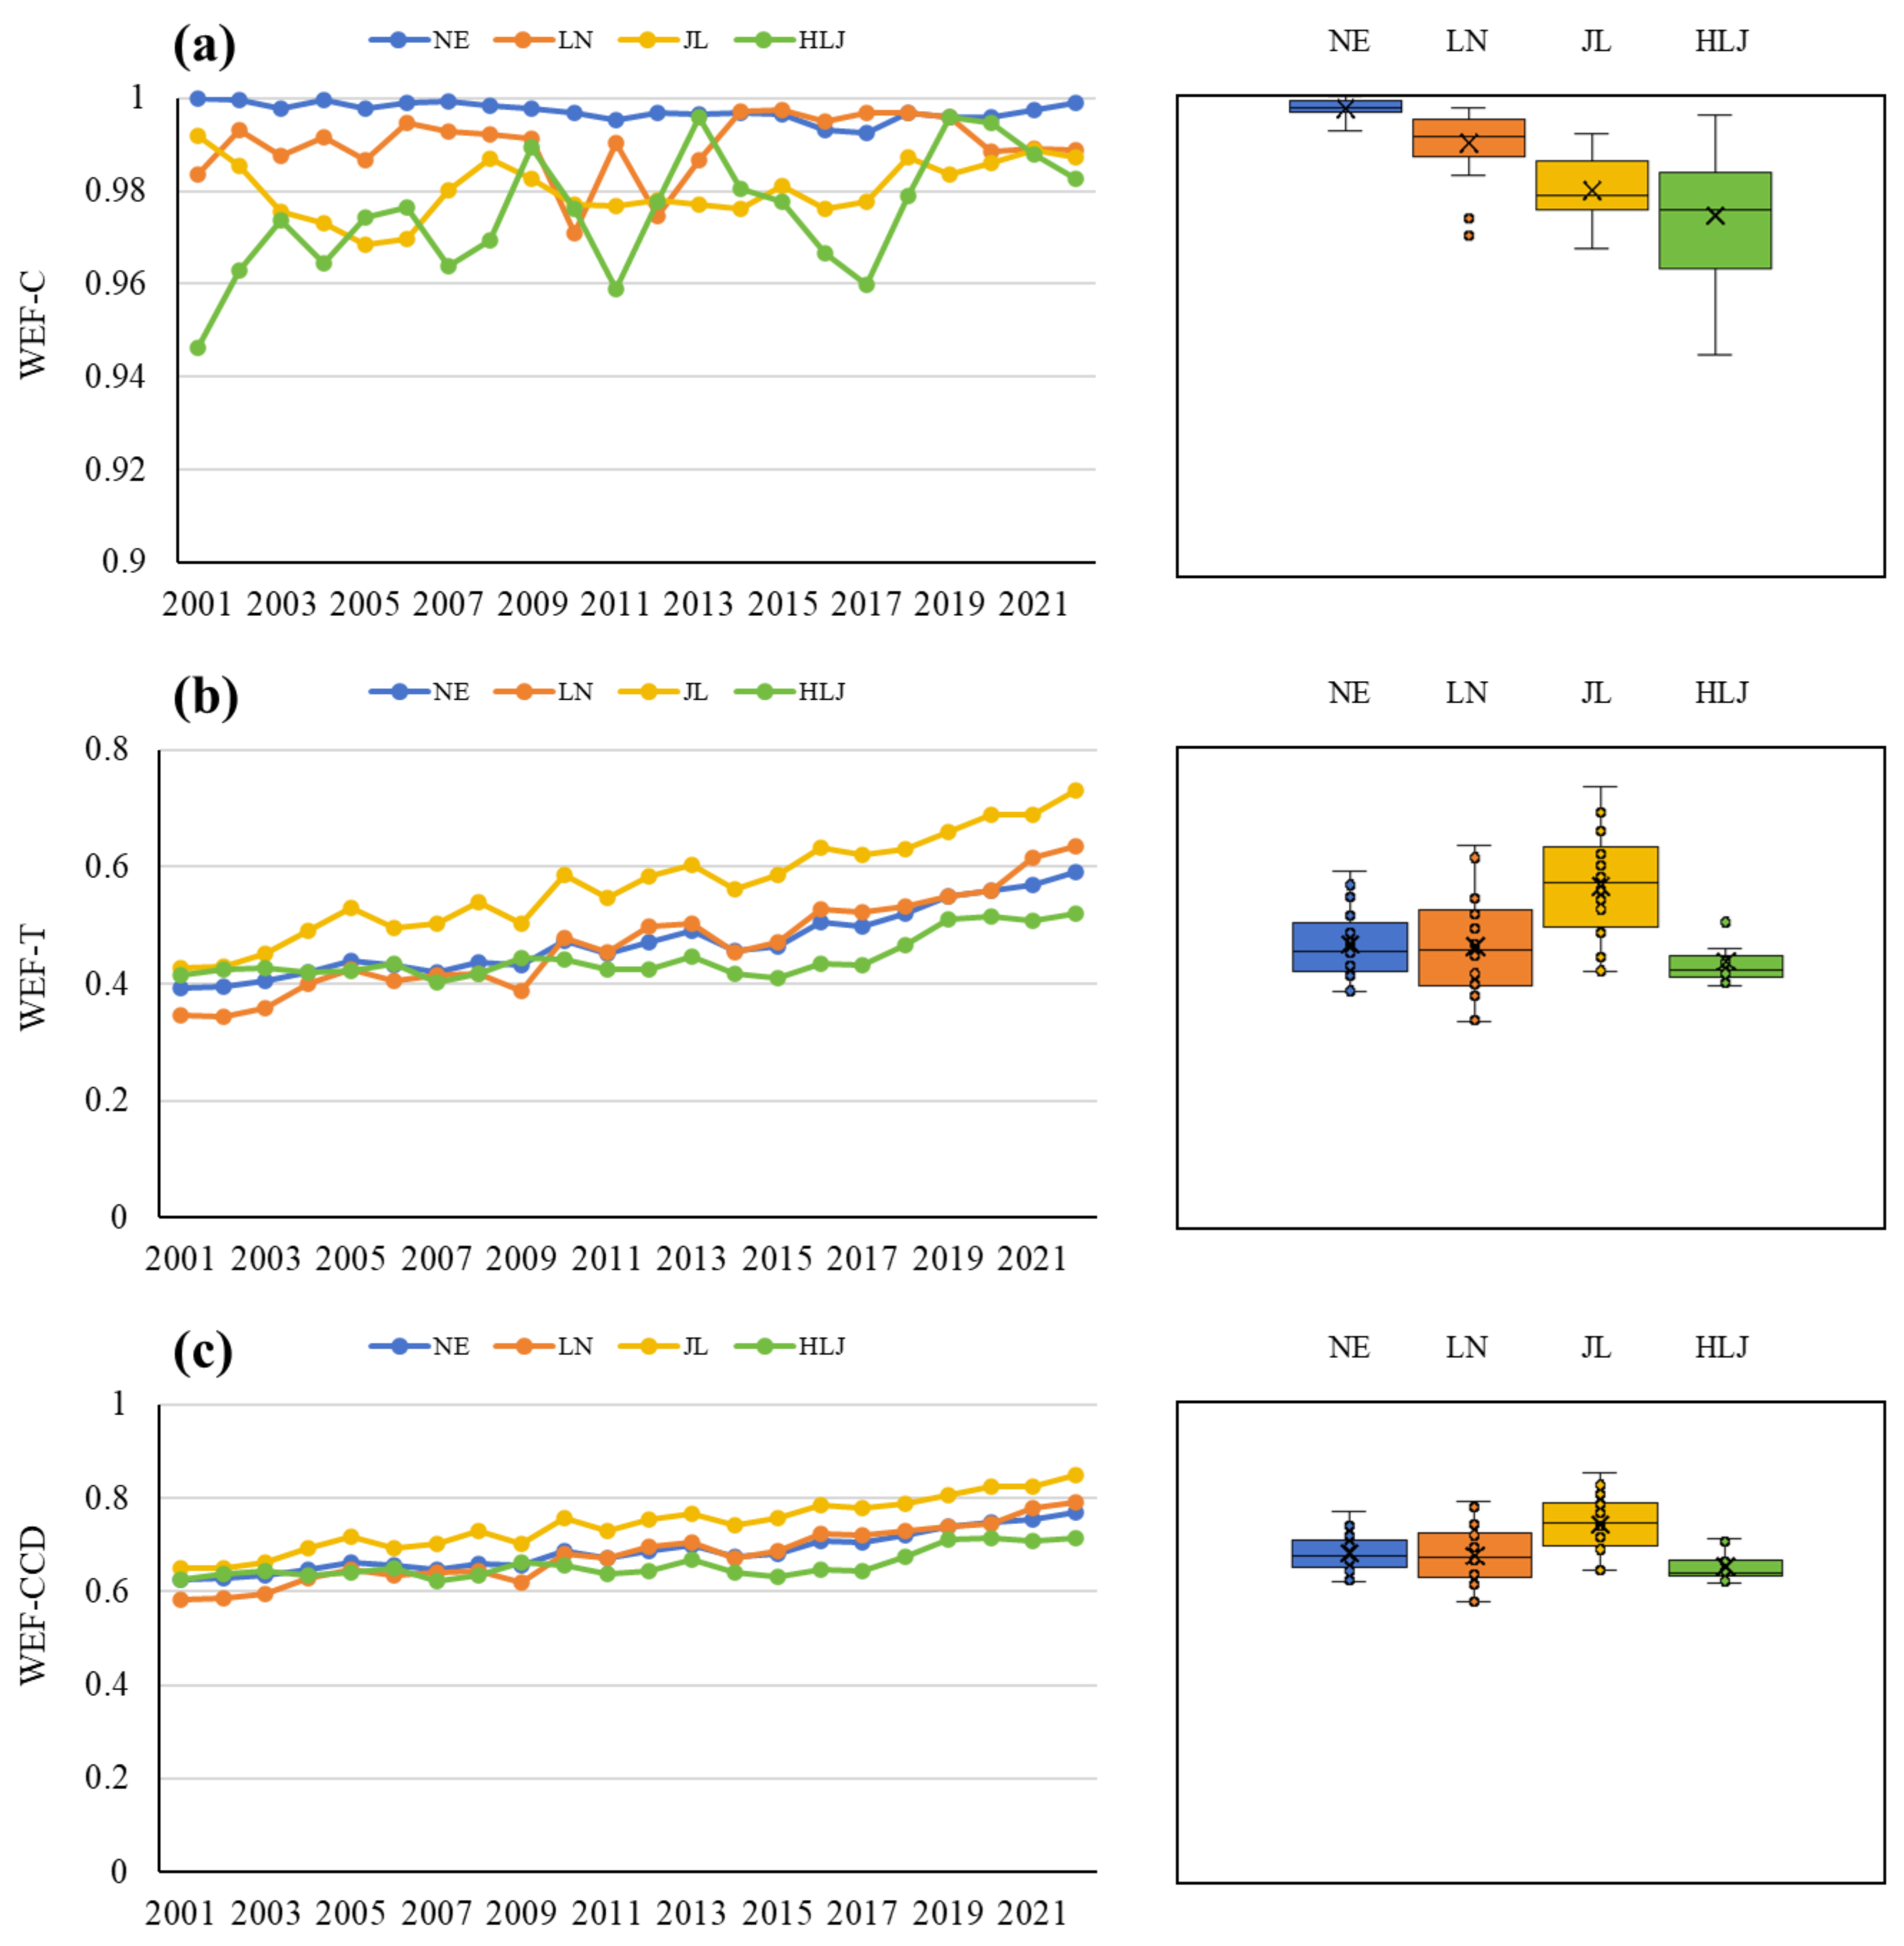
3.1. Evolutionary Analysis of the CCD of the WEF System in Northeast China

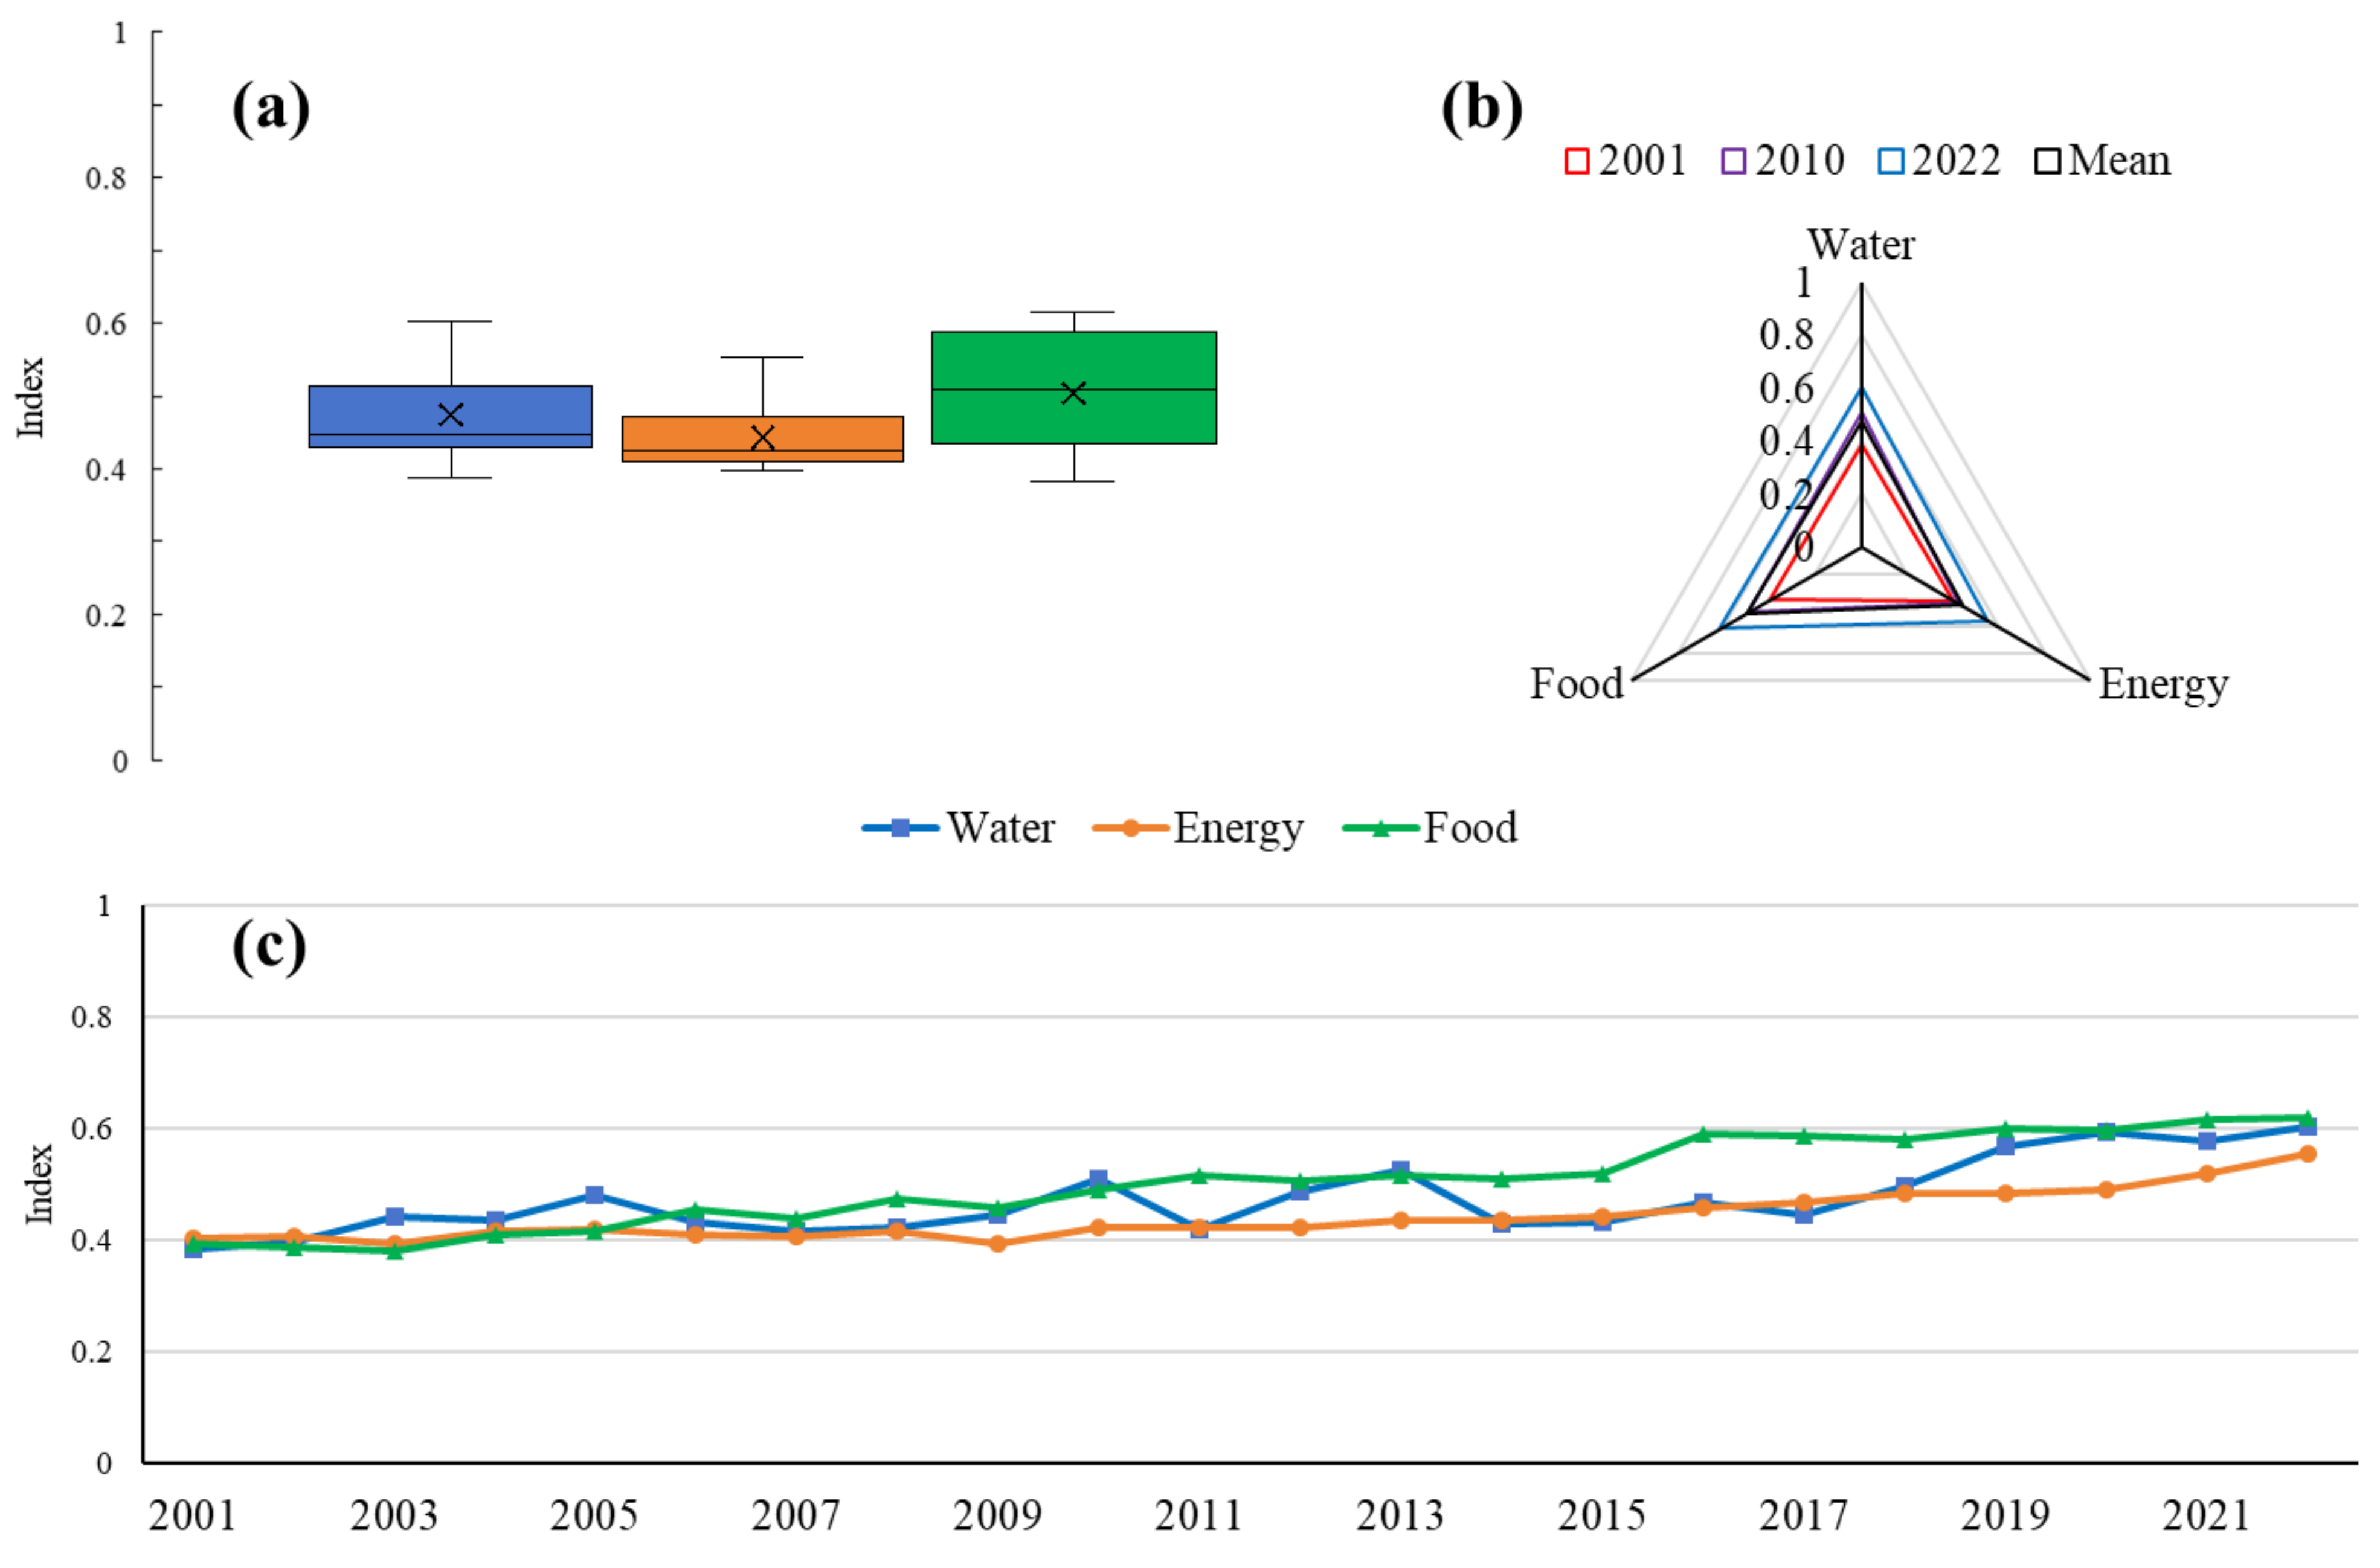
3.1.1. Evolutionary Analysis of the CCD in the WEF Subsystems

The temporal evolution of the CCD of the WEF subsystems in Northeast China from 2001 to 2022 is shown in Figure 3, Figure 4, Figure 5 and Figure 6. While all three subsystems exhibit long-term improvement trends, their development trajectories and spatial characteristics differ notably across the provinces of Liaoning, Jilin, and Heilongjiang.
At the regional scale (Figure 3), the food subsystem demonstrated the most significant and stable growth, with its CCD increasing from 0.39 in 2001 to 0.62 in 2022, successfully reaching the primary coordination level. The water subsystem also showed a marked improvement, with its CCD rising from 0.38 to 0.60 during the same period, reflecting steady infrastructure and policy investment. In contrast, the energy subsystem improved more modestly, with its CCD increasing from 0.40 to 0.55, remaining within the limited coordination level. A boxplot analysis revealed that both the water and energy subsystems had values concentrated in the lower CCD range, indicating persistent underdevelopment and limited fluctuation, while the food subsystem had a more balanced and sustained upward trajectory. The long-term average CCD values of the water, energy, and food subsystems were 0.47, 0.44, and 0.50, respectively.
At the provincial level, Liaoning Province (Figure 4) displayed a rapid rise in its water subsystem, with its CCD increasing from 0.43 in 2001 to 0.77 in 2022, nearing the good coordination level, and its food subsystem—despite starting at the lowest level (a CCD of 0.28)—achieved significant progress, reaching a CCD of 0.59. However, its energy subsystem remained relatively weak, with its CCD increasing from 0.33 to 0.55. The average CCDs for water, energy, and food were 0.55, 0.41, and 0.45, respectively. The boxplot analysis reveals that, while water coordination improved rapidly, its values fluctuated more, suggesting episodic progress likely driven by infrastructure upgrades.
Jilin Province (Figure 5) exhibited the most favorable performance across all three subsystems. Both its water and food subsystems reached CCD values above 0.80 by 2022, reaching the good coordination level, while the energy subsystem showed gradual but consistent growth, reaching a CCD of 0.57. The average CCDs were 0.61 (water), 0.43 (energy), and 0.67 (food), indicating balanced and sustained subsystem development. The food subsystem in Jilin was particularly stable, likely benefiting from strong agricultural foundations and continuous technological investment.
In contrast, Heilongjiang Province (Figure 6) showed a less optimistic pattern. The CCD of the water subsystem experienced strong fluctuations without a clear upward trend, ending at 0.39 in 2022, belonging to the severe discoordination level. The CCD of the energy subsystem began relatively high at 0.59, dropped to 0.46 in 2016, and slowly recovered to 0.58, suggesting structural inefficiencies and limited transition momentum. The CCD of the food subsystem rose from 0.39 to 0.59, exhibiting a moderate improvement. The average CCD values were 0.34 (water), 0.53 (energy), and 0.47 (food), with energy coordination outperforming the others but lacking strong supporting momentum from water or agricultural resilience.
Comparatively, Jilin stands out for achieving high-quality coordination in both water and food systems and moderate progress in energy, making it the regional driver of WEF coordination. Liaoning shows uneven development, with strong gains in water coordination, but it lags in energy transformation. Heilongjiang faces structural constraints in all three subsystems, particularly water, despite better energy metrics.

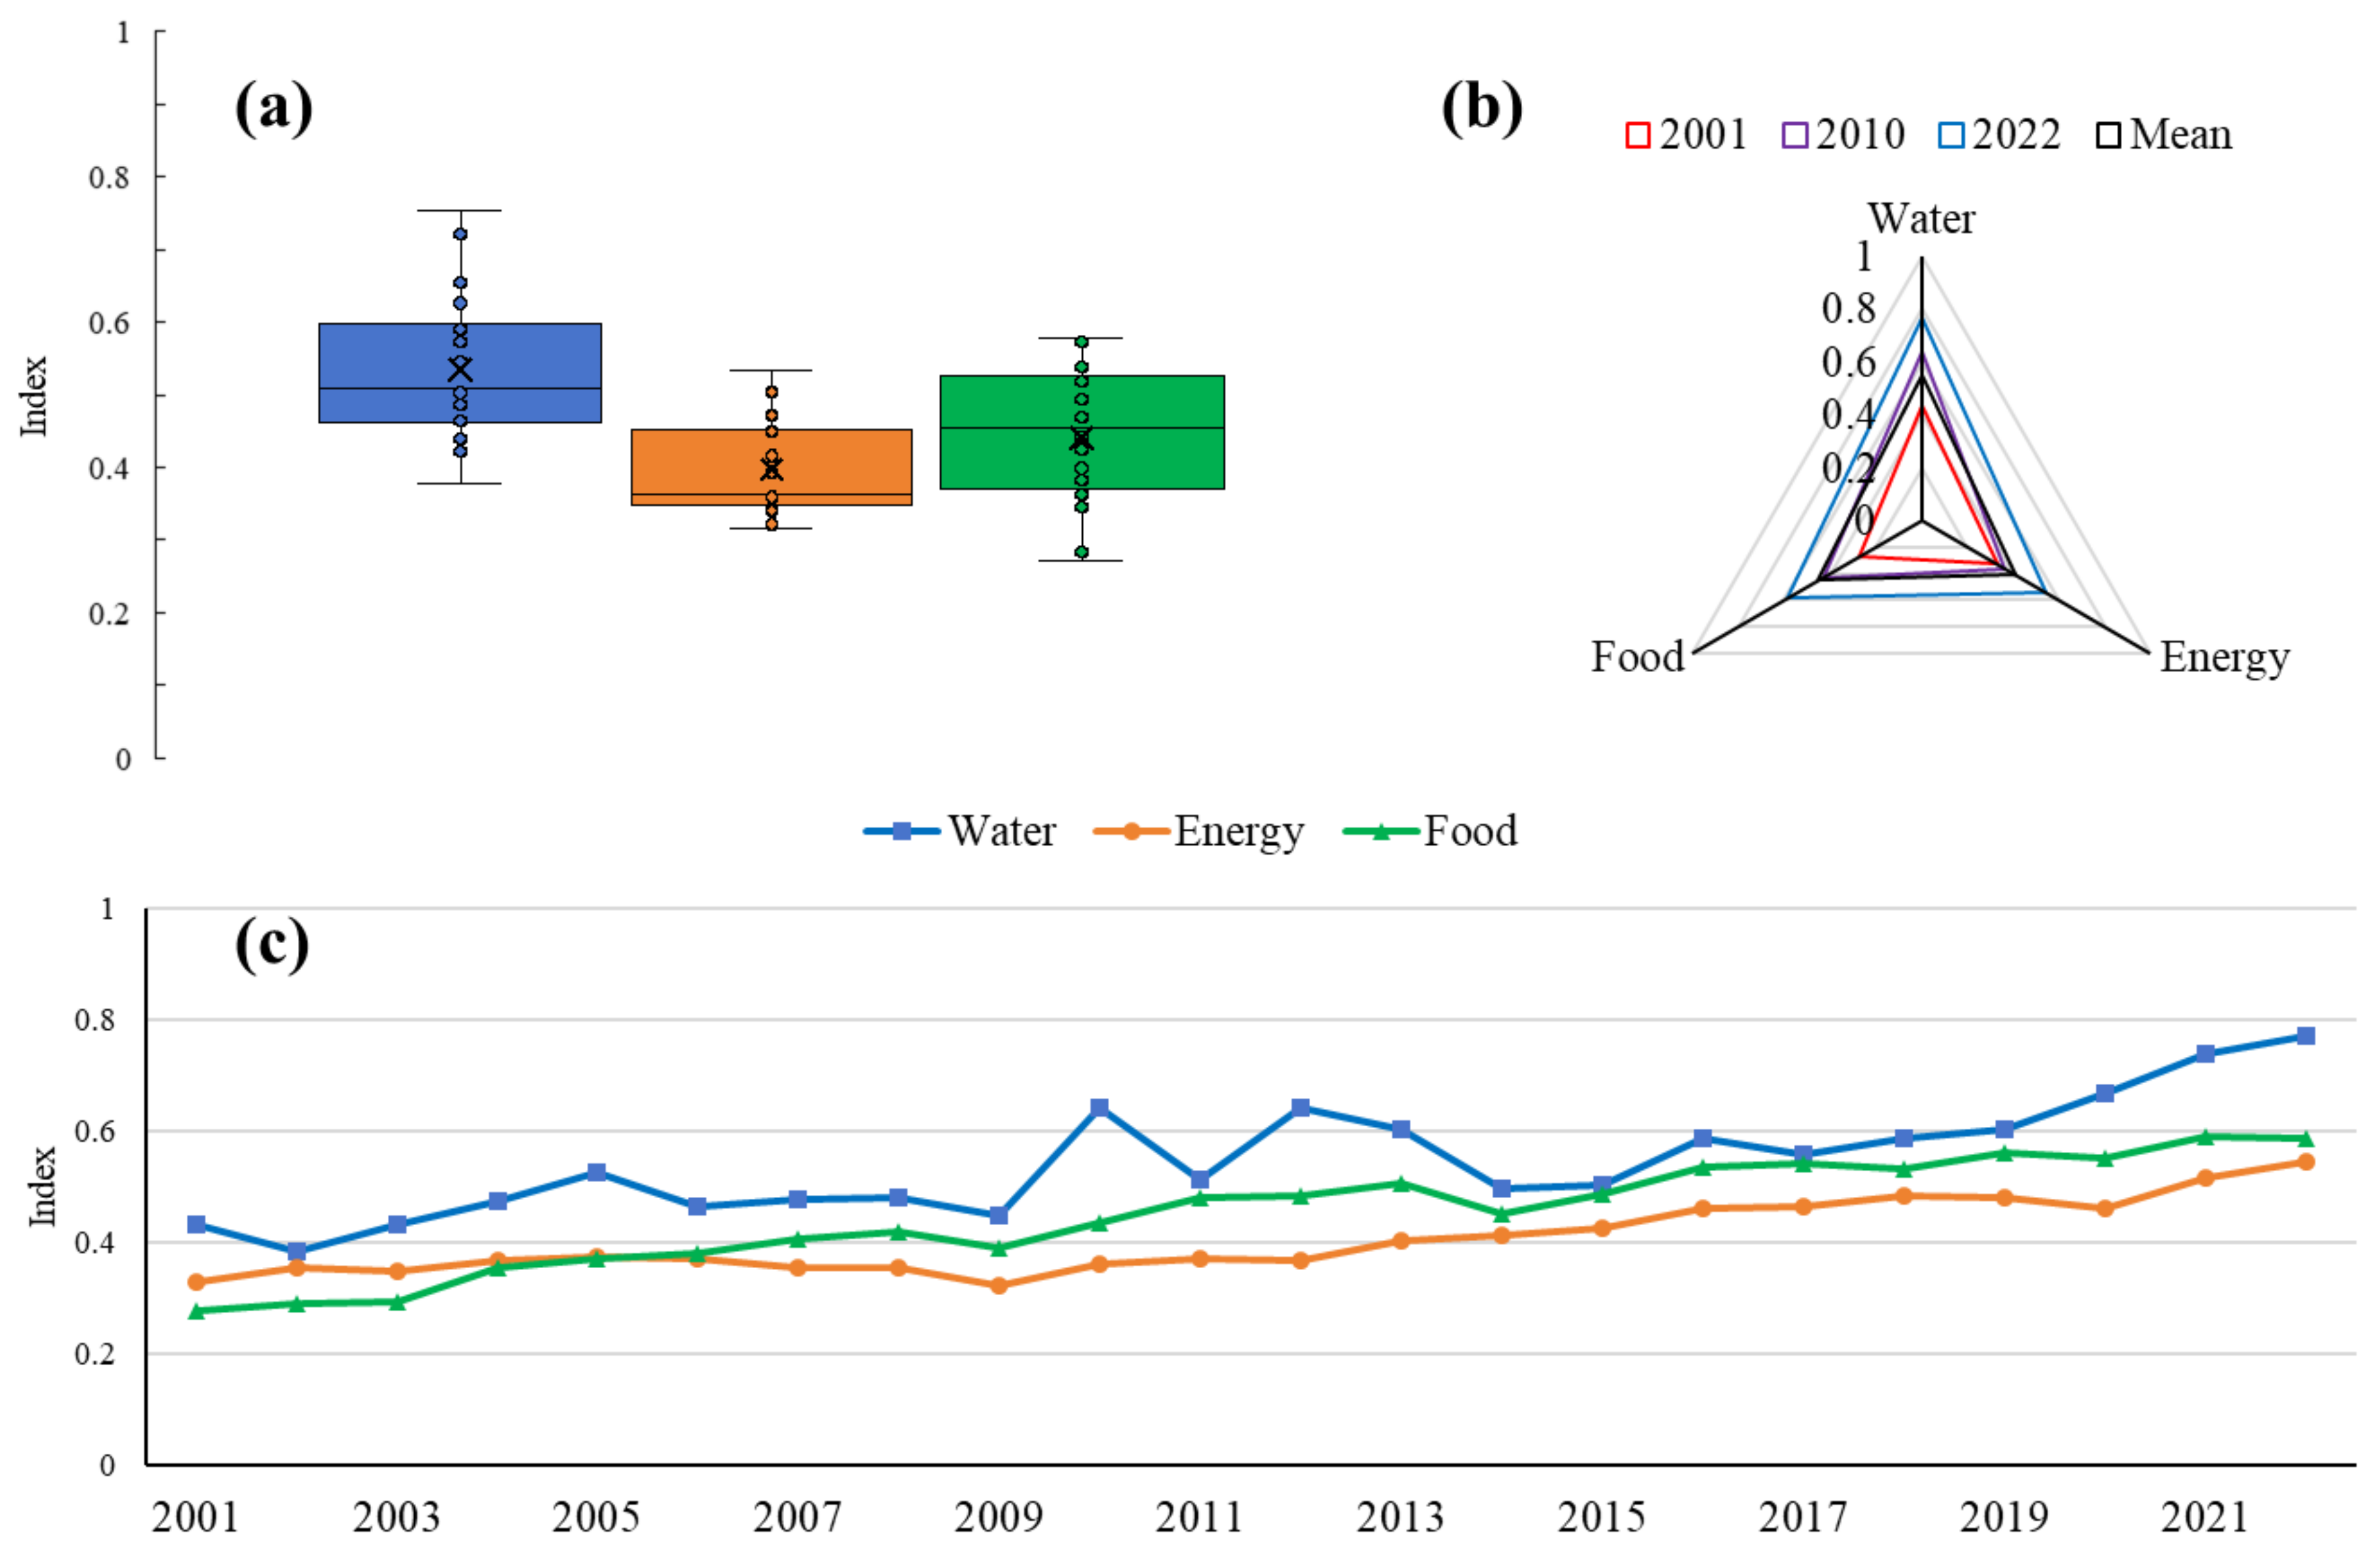
3.1.2. Evolutionary Analysis of the WEF-CCD at the Provincial Level

The evolution of the WEF-C, WEF-T, and WEF-CCD in Northeast China is presented in Figure 7. As shown in Figure 6a, the overall Northeast region exhibits the highest WEF-C value, suggesting strong interconnections facilitated by the mutual compensation of water, energy, and food resources across the three provinces. Liaoning follows, with a long-term average WEF-C of 0.99, then Jilin with 0.98, while Heilongjiang recorded the lowest average WEF-C at 0.975 and also shows the greatest variability, with WEF-C values ranging from 0.946 to 0.996. The WEF-T, which denotes the comprehensive development index, increased steadily in all provinces. Jilin showed the fastest and greatest growth, with an average WEF-T of 0.568, rising from 0.426 in 2001 to 0.732 in 2022. The overall Northeast region ranked second, with a long-term average WEF-T of 0.472 and an increase from 0.393 to 0.592 during the same period. Liaoning followed, with an average WEF-T of 0.468, growing from 0.344 to 0.634. Heilongjiang had the lowest average WEF-T at 0.444; after fluctuating in earlier years, it began a slow increase in 2017, eventually reaching 0.520 by 2022.
Jilin Province achieved the best WEF-CCD, which increased from an initial value of 0.650, corresponding to the primary coordination level, to 0.850 in 2022, reaching the good coordination level. Its long-term average was 0.744. The overall Northeast region ranked second, with an initial CCD of 0.627 that gradually rose to 0.769 in 2022, indicating a transition from the primary to the intermediate coordination level, with a mean value of 0.685. Liaoning Province started at a lower initial CCD value of 0.584, the lowest among all regions, which was within the limited coordination level. Despite rapid improvement to 0.792 in 2022—close to the good coordination level—its long-term average CCD remained at 0.678. Heilongjiang Province had the weakest overall performance. Although it started at a CCD of 0.627, the system evolved slowly and only reached a CCD of 0.715 by 2022, which barely met the threshold for the intermediate coordination level. Its average CCD value was 0.657.

3.2. Obstacle Degree and Grey Relational Analysis

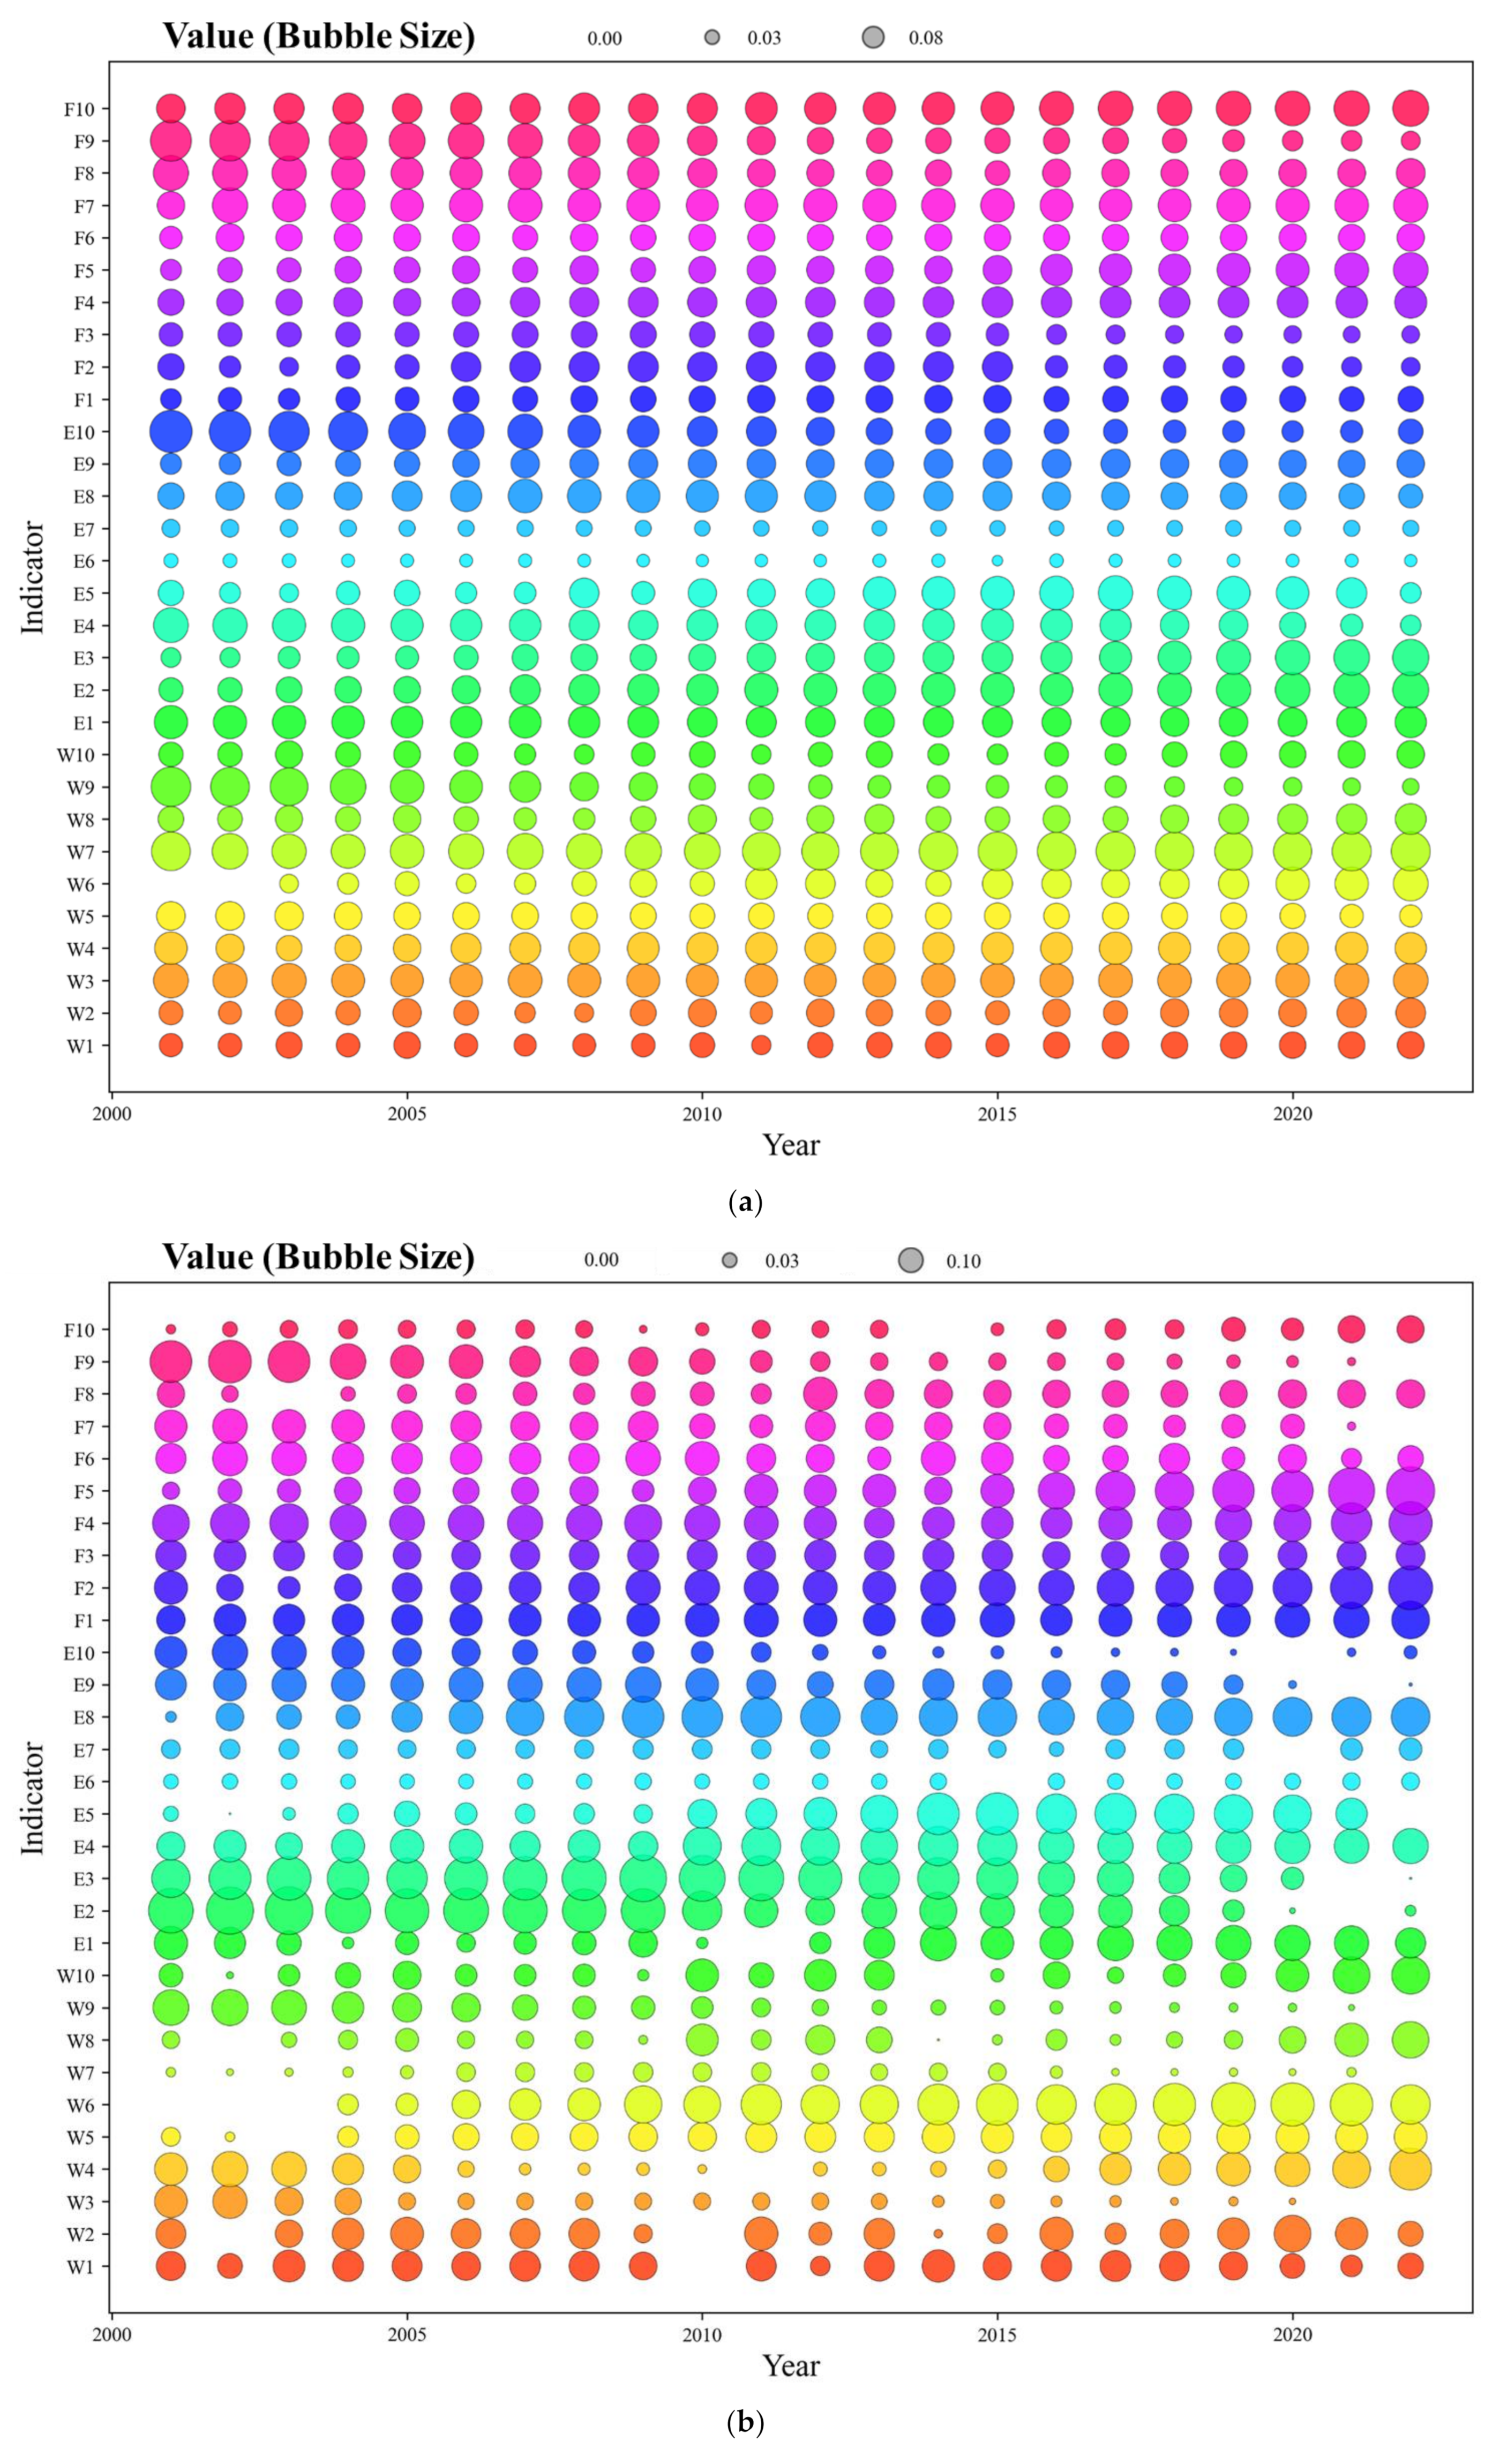
3.2.1. Obstacle Degree Analysis

To systematically identify the key factors hindering the coordinated development of the WEF system in Northeast China, we applied the obstacle degree model to assess barrier contributions in Liaoning, Jilin, Heilongjiang, and the region as a whole from 2001 to 2022. The obstacle degree results for each province are illustrated in Figure 8.
At the regional scale, the top five indicators with the highest obstacle degrees are per capita water use (W7), reservoir capacity (W3), proportion of agricultural water use (F7), food self-sufficiency rate (F10), and energy consumption (E2), with respective values of 0.0577, 0.0468, 0.0459, 0.0437, and 0.0413. Their cumulative contribution reaches 0.2355. These findings indicate significant constraints related to water use efficiency, the agricultural water-saving structure, and food security in the region. In Liaoning Province, the top five obstacle indicators are electricity generation (E3), energy consumption (E2), agricultural fertilizer application (F4), energy consumption per CNY 10,000 of GDP (E8), and proportion of ecological water use (W6), with obstacle degrees of 0.0612, 0.0557, 0.0534, 0.0531, and 0.0507, respectively, totaling 0.2742. These results suggest that Liaoning faces considerable challenges in reducing energy intensity, improving the greenness of its energy structure, and controlling agricultural water use and non-point source pollution. In Jilin Province, the top five obstacle indicators are food self-sufficiency rate (F10), reservoir capacity (W3), proportion of clean energy in power generation (E5), multiple cropping index (F8), and per capita water use (W7), with respective obstacle degrees of 0.0566, 0.0519, 0.0513, 0.0474, and 0.0469, adding up to 0.2542. As a major agricultural province, Jilin needs to strengthen its food self-reliance capacity, enhance its water storage capabilities, improve cropping intensity, and accelerate the transition to clean energy. In Heilongjiang Province, the top five obstacle indicators are energy self-sufficiency rate (E10), energy consumption per CNY 10,000 of GDP (E8), water use per CNY 10,000 of GDP (W9), per capita water use (W7), and primary energy production (E1), with corresponding obstacle degrees of 0.0622, 0.0536, 0.0532, 0.0526, and 0.0519, totaling 0.2736. These results reveal dual constraints in energy independence and high energy–water consumption intensity per unit output, highlighting bottlenecks in both energy efficiency and water resource management.
Across all three provinces, five indicators—per capita water use (W7), reservoir capacity (W3), food self-sufficiency rate (F10), energy consumption (E2), and energy consumption per CNY 10,000 of GDP (E8)—appear repeatedly among the top five. This indicates that these represent core regional constraints, reflecting widespread challenges in per capita resource allocation, water storage capacity, food system resilience, and energy structure optimization. A classification analysis of the top five obstacle indicators across all provinces reveals that water-related indicators (e.g., W3, W7, W9, and W10) account for 35%, energy-related indicators (e.g., E2, E3, E5, E8, and E10) account for the largest share at 40%, and food-related indicators (e.g., F4, F7, F8, and F10) make up 25%. These findings suggest that, under the current resource environment conditions, the energy and water subsystems remain the principal bottlenecks to the coordinated evolution of the WEF system in Northeast China. The most prominent issues are low energy efficiency and extensive water resource management. While the food subsystem is relatively more resilient, its high dependence on water resources and limited cropping flexibility indicate lingering vulnerabilities. Therefore, to promote high-quality coordinated development of the WEF nexus in Northeast China, it is essential to focus on these high-frequency obstacle indicators, formulate targeted and differentiated regulation strategies, enhance integrated water–energy governance, and improve resource use efficiency, while strengthening the resilience and synergy of the entire system.

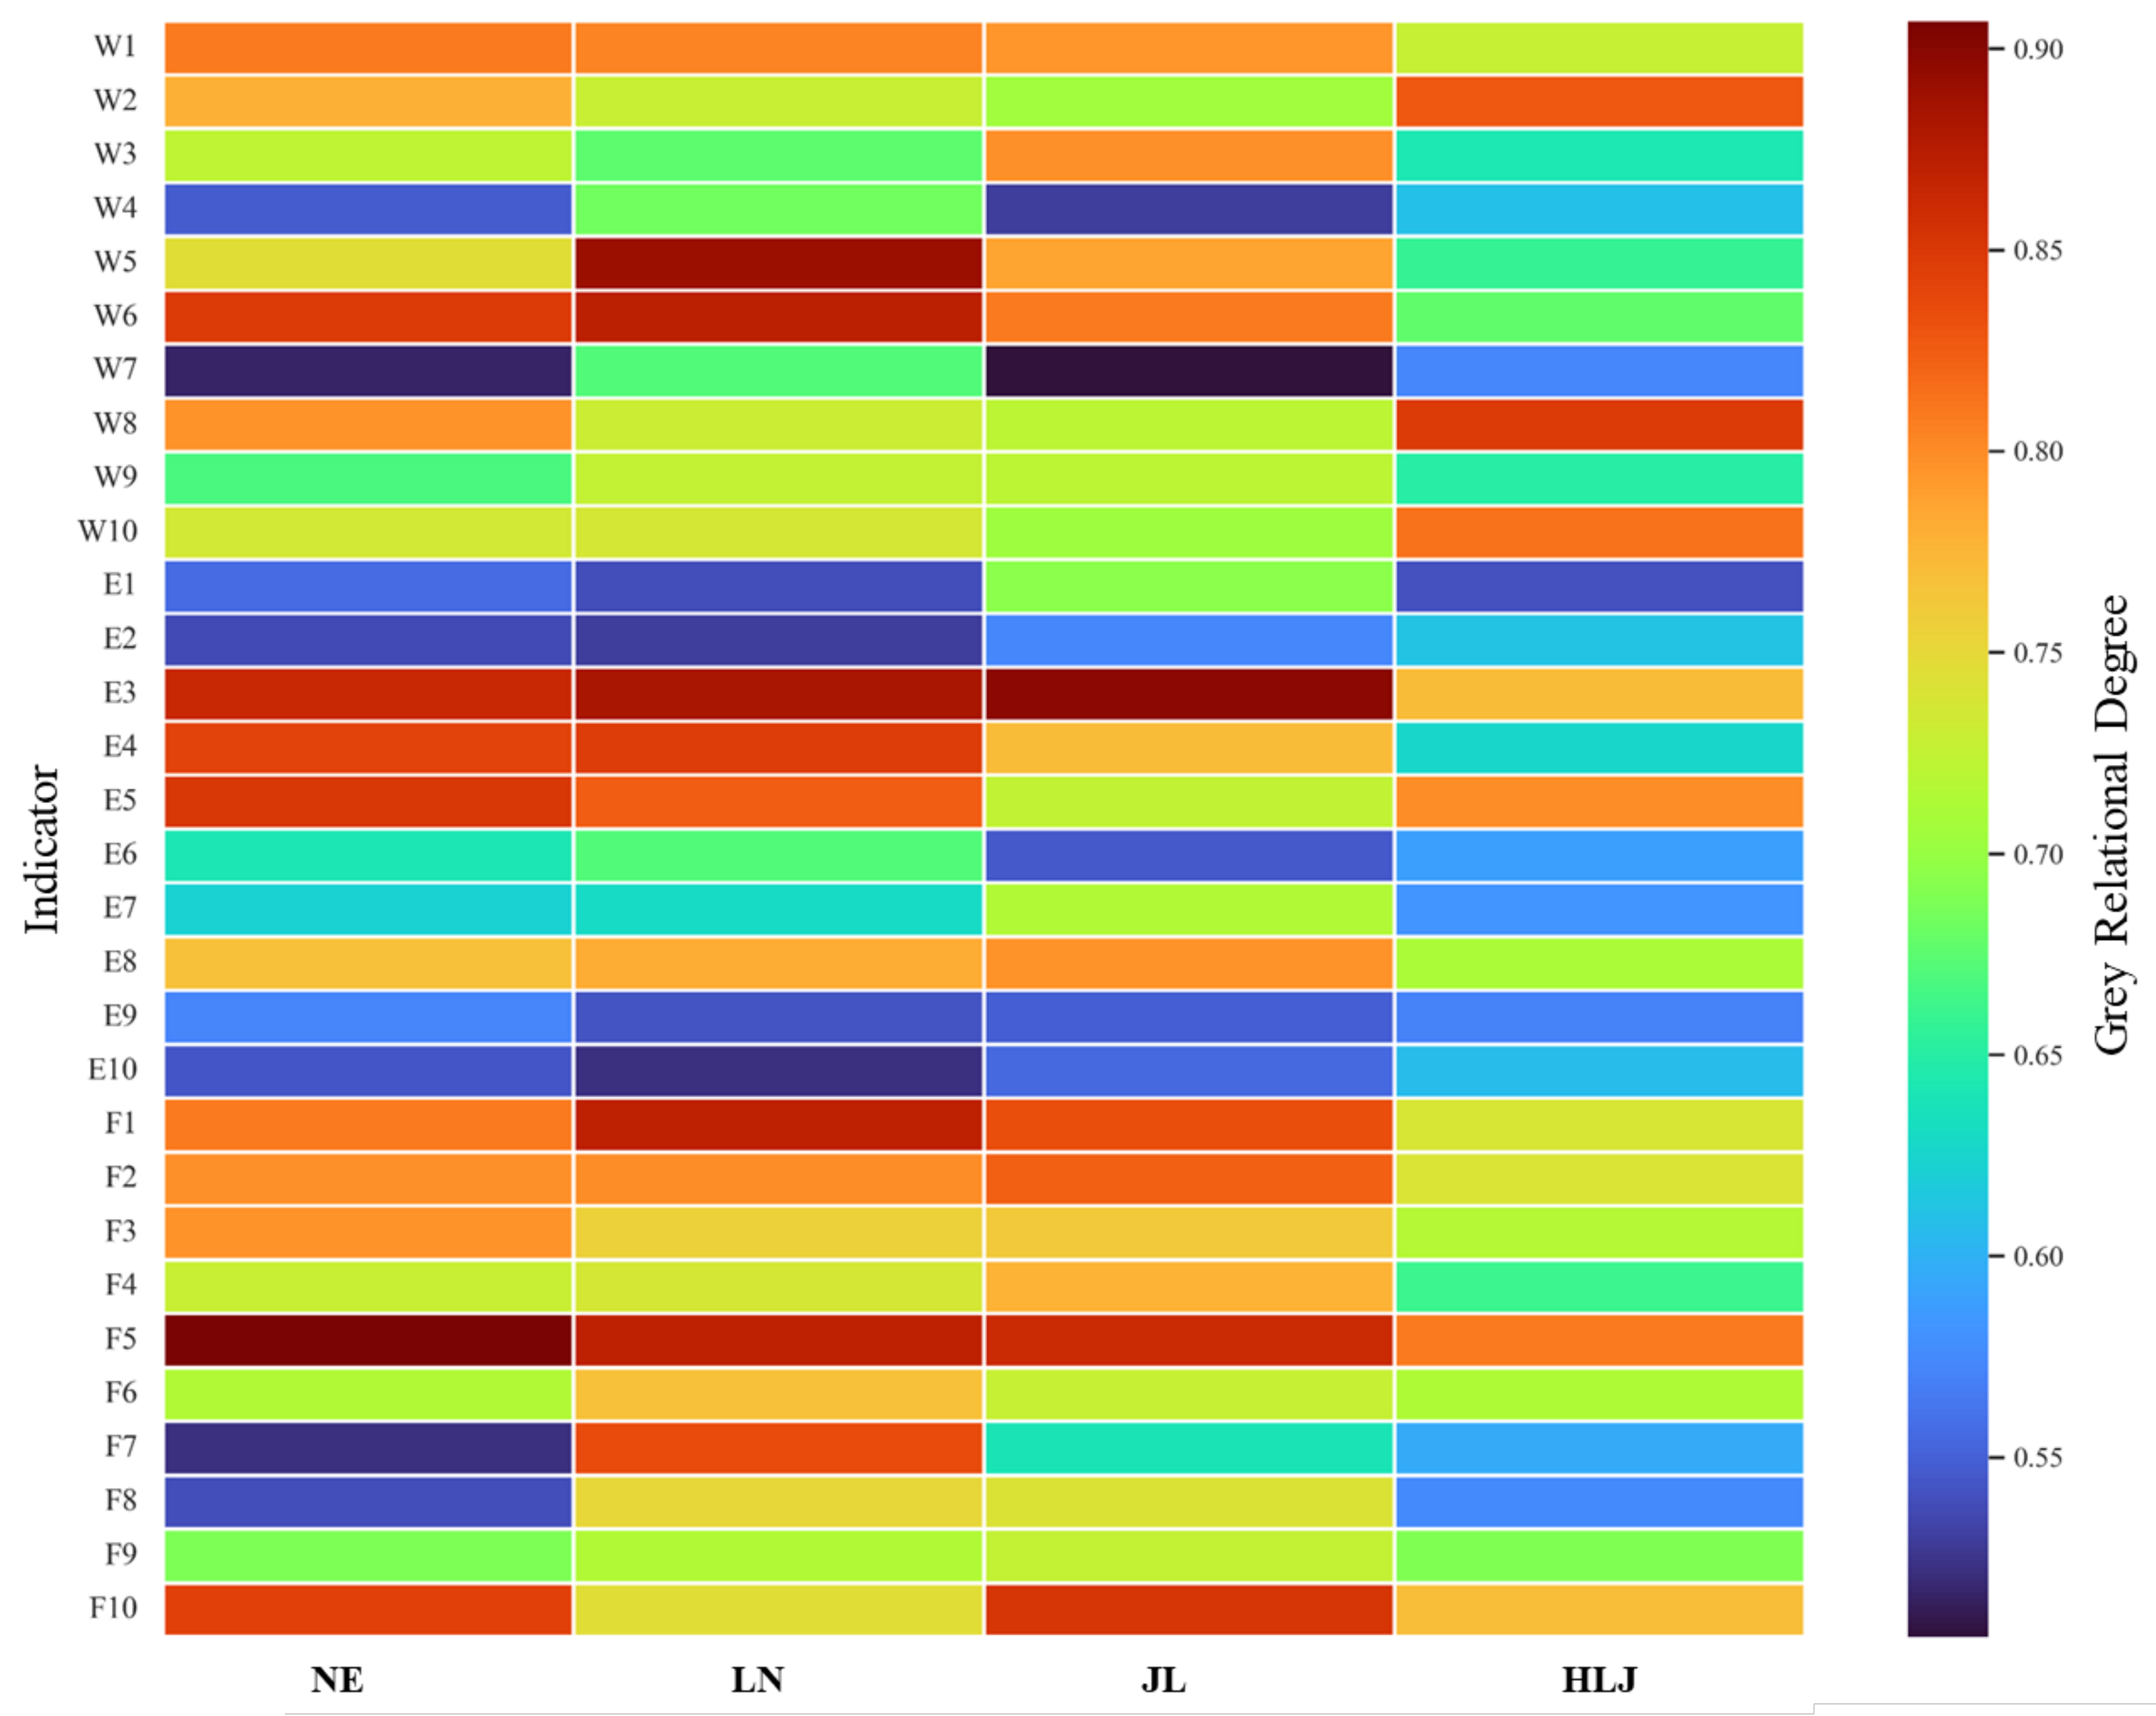
3.2.2. Grey Relational Analysis

To further uncover the influence of individual indicators within the WEF system on the evolution of the WEF-CCD, this study employs a grey relational analysis model based on grey system theory. The results are shown in Figure 9.
At the regional scale, the top five indicators with the highest grey relational degrees are food production water efficiency (F5), electricity generation (E3), proportion of clean energy in power generation (E5), proportion of ecological water use (W6), and food self-sufficiency rate (F10), with respective values of 0.9069, 0.8632, 0.8517, 0.8479, and 0.8435. Of these, F5 ranks the highest, indicating that improving agricultural water-use efficiency is the most influential driver of WEF system coordination. In Liaoning Province, the key grey relational degree indicators are proportion of groundwater supply (W5), electricity generation (E3), proportion of ecological water use (W6), food production water efficiency (F5), and food production (F1). The high relational degrees of W5 (0.8910) and W6 (0.8717) highlight the critical role of ecological water use and water resource management in enhancing system coordination and promoting sustainable development in the province. In Jilin Province, the top five indicators are electricity generation (E3), food production water efficiency (F5), food self-sufficiency rate (F10), food production (F1), and food sown area (F2). Notably, four out of the top five indicators belong to the food subsystem, emphasizing Jilin’s status as a major food-producing province. The strong alignment between the food subsystem and CCD evolution underscores the pivotal role of agricultural productivity and efficiency in driving system coordination. In Heilongjiang Province, the top five indicators are per capita water resources (W8), total water resources (W2), water self-sufficiency rate (W10), food production water efficiency (F5), and proportion of clean energy in power generation (E5). The high relational degree of W8 (0.8484) suggests that the province’s natural abundance of water resources provides a fundamental advantage for system development. In addition, clean energy and high-efficiency agriculture serve as important pillars for sustainable progress.
Across the three provinces, common high-impact indicators, such as food production water efficiency (F5), electricity generation (E3), proportion of clean energy in power generation (E5), proportion of ecological water use (W6), food self-sufficiency rate (F10), and food production (F1), frequently appear, underscoring their broad importance in enhancing coordination. In terms of category contribution, water-related indicators account for 30%, energy indicators for 25%, and food indicators for 45%, indicating that the food subsystem serves as the key driver of WEF system coordination, while water systems provide foundational support across provinces.
A comparative analysis utilizing the obstacle degree results in Section 3.2.1 reveals that several indicators exhibit both high obstacle degrees and high grey relational degrees, indicating that they are not only significant in determining system coordination but also deviate considerably from their optimal states. These indicators thus represent critical leverage points for system improvement. Accordingly, we define these as “high-barrier + high-driver” variables. Specifically, we identify the top five indicators by obstacle degree and grey relational degree for each of the three northeastern provinces and the overall region. Indicators appearing in both rankings are classified as “high-barrier + high-driver” variables. Based on this approach, three indicators—food self-sufficiency rate (F10), electricity generation (E3), and proportion of ecological water use (W6)—emerge as both major constraints and key contributors to system performance. Their dual role highlights them as strategic priorities for enhancing future WEF nexus coordination and resilience.

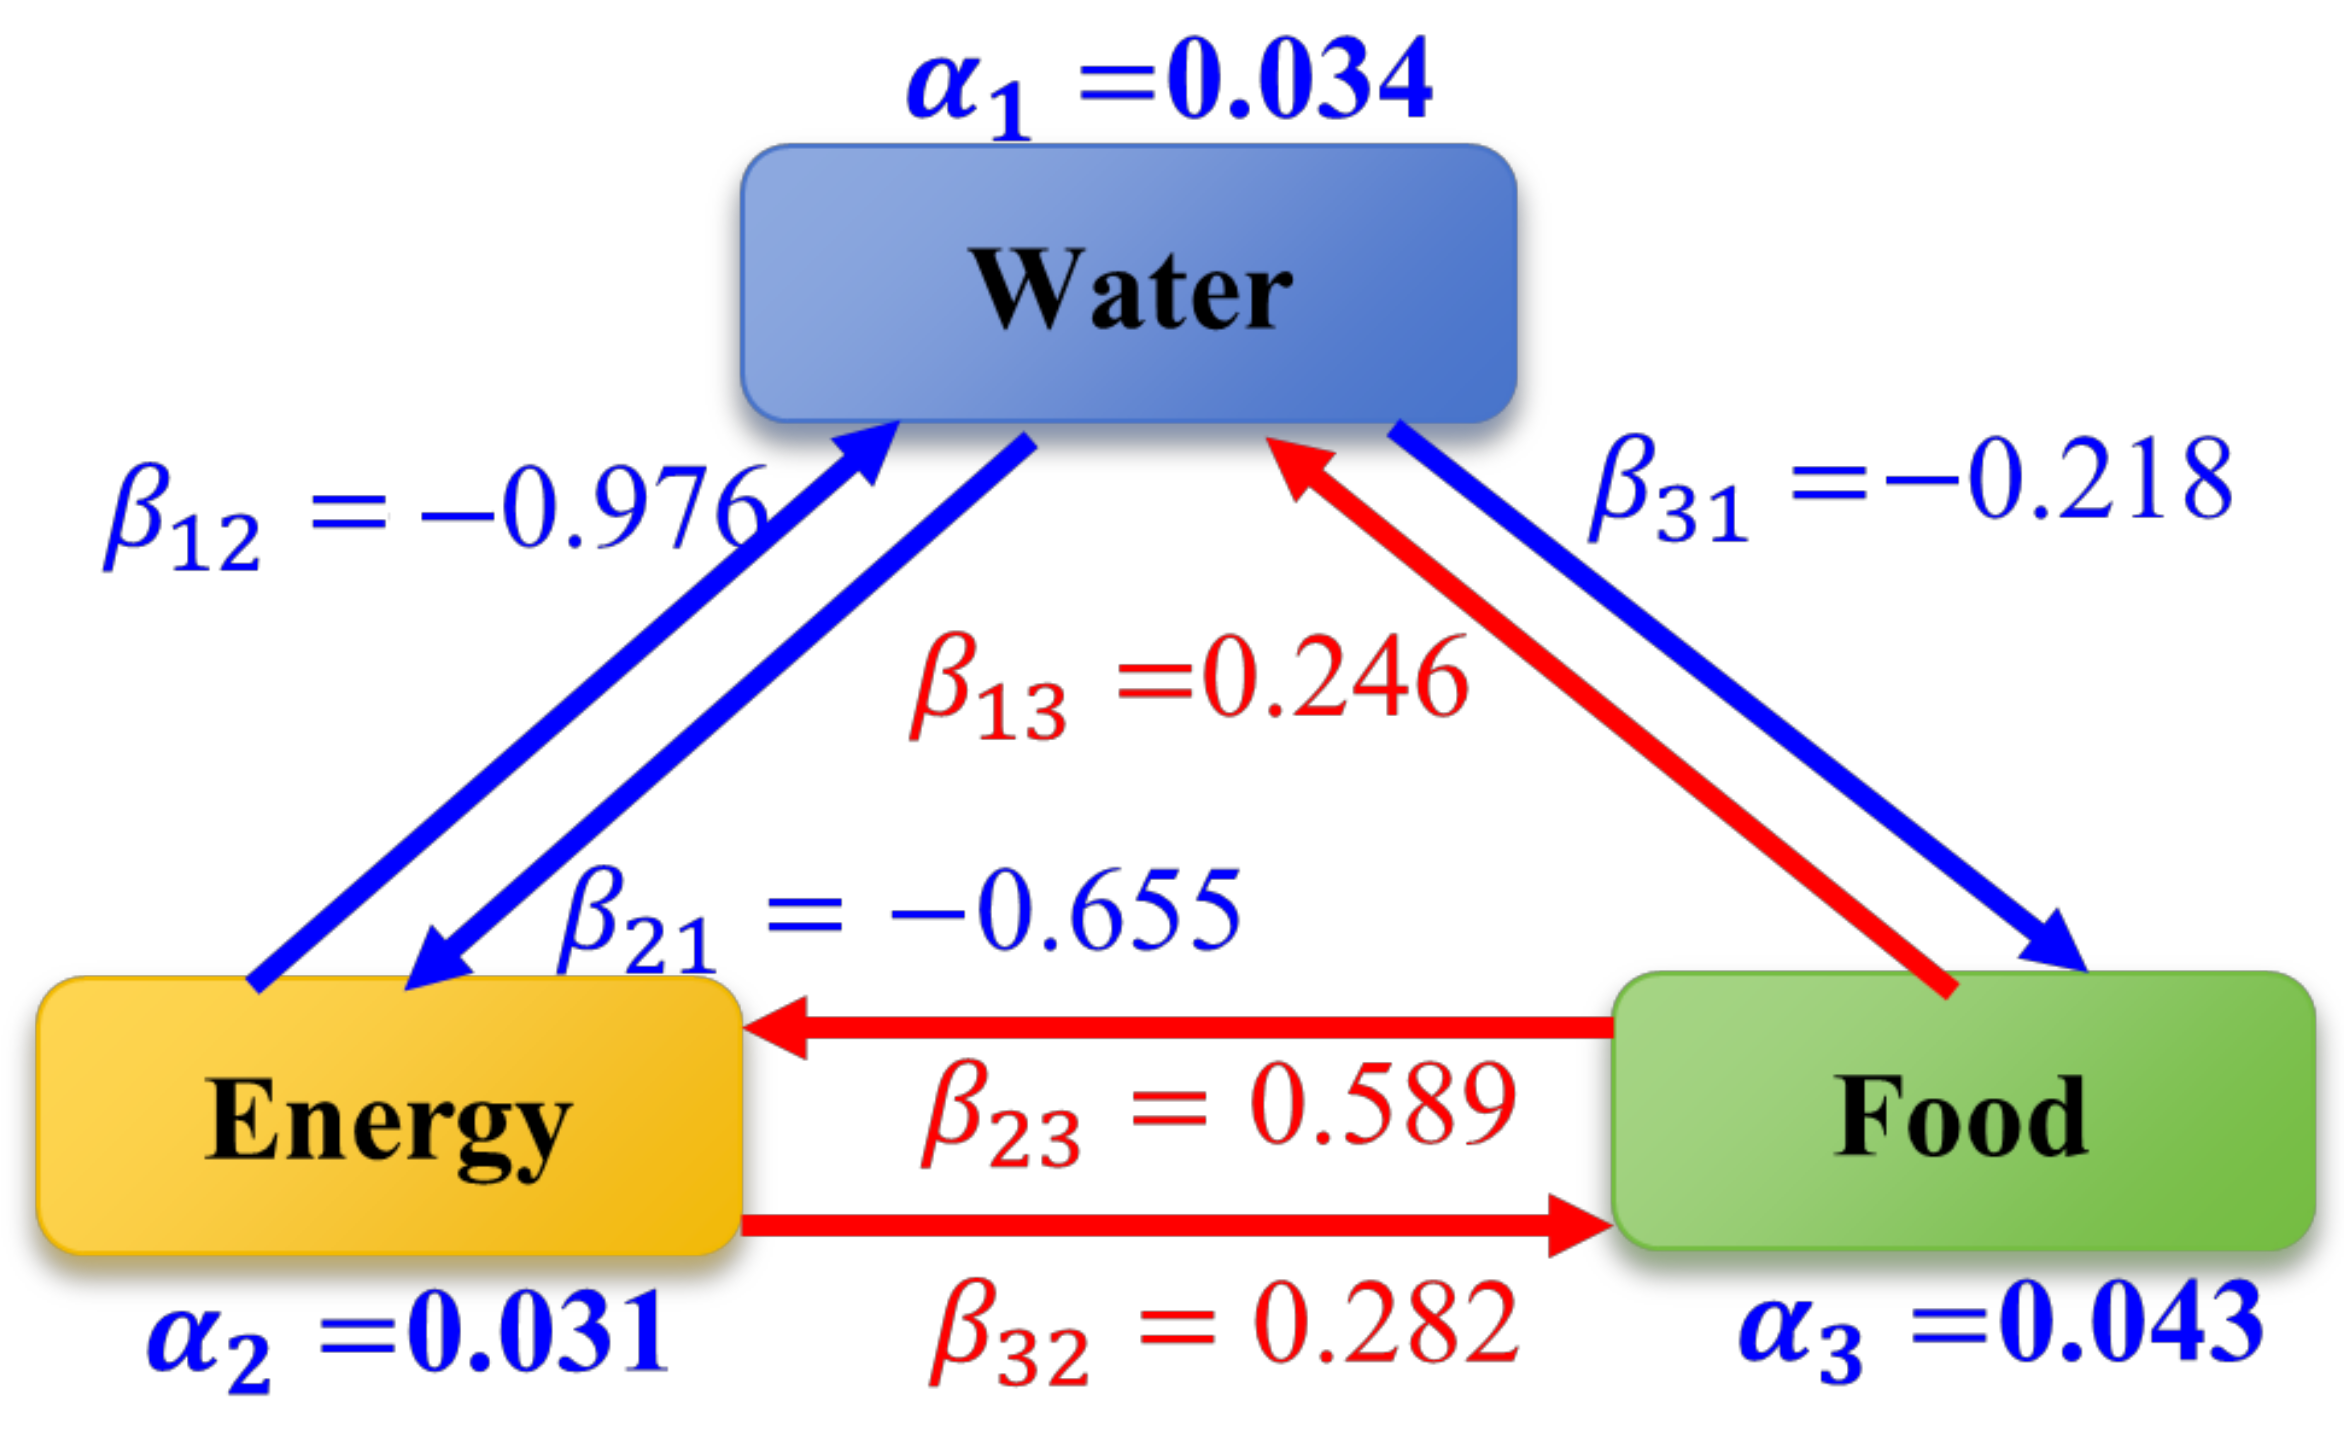
3.3. Co-Evolution Results of the WEF System in Northeast China

3.3.1. Analysis of Competition and Cooperation Among WEF Subsystems

Based on the calculated CCD of the water, energy, and food subsystems in Northeast China, a co-evolution model is established through parameter optimization. The estimated parameters and equilibrium points, E 1 ( 0 , 0 , 0 ) , E 2 ( 0 , 0 , 1 ) , E 3 ( 0 , 1 , 0 ) , E 4 ( 1 , 0 , 0 ) , and E 5 ( x 1 , x 2 , x 3 ) , along with their corresponding stability coefficients, p, q, and r, are presented in Figure 10 and Table 3.
The parameters indicate that α 3   >   α 1   > α 2   > 0, suggesting that all three subsystems are in a developmental phase, with the food subsystem growing the fastest, followed by the water subsystem, while the energy subsystem lags behind. This finding aligns with the policy-driven progress observed since 2001. Specifically, the food subsystem has benefited from national initiatives, such as black soil conservation, agricultural technology investment, and farmland rotation policies, which have significantly enhanced its growth potential. The water subsystem has improved due to the implementation of large-scale diversion, regulation, and protection projects. Meanwhile, the energy subsystem has faced constraints, such as a coal-dominated structure and low energy self-sufficiency, leading to slower development.
β 12 < 0 and β 13 > 0 indicate that the energy subsystem promotes the water subsystem, likely due to synergistic infrastructure, such as hydropower stations, pumped storage, and water regulation projects. Conversely, the food subsystem inhibits the water subsystem due to increased agricultural water demands that exacerbate stress on limited water resources.
β 21 < 0 and β 23 > 0 indicate that the water subsystem promotes the energy subsystem, reflecting water’s fundamental role in cooling, hydropower generation, and coal processing. The food subsystem inhibits the energy subsystem as agricultural development raises energy consumption through mechanization and irrigation.
β 31 < 0 and β 32 > 0 indicate that the water subsystem promotes the food subsystem, as water availability is critical for agricultural output. However, the energy subsystem inhibits the food subsystem, especially due to land competition, resource reallocation, and environmental pressure from industry development.
Among the five equilibrium points, only E 5 ( x 1 , x 2 , x 3 ) satisfies the conditions for system stability, indicating that the WEF system in Northeast China is evolving toward a stable co-evolutionary equilibrium. Despite internal competition and cooperation dynamics, the overall water–energy–food system in the region is converging toward a stable and balanced state.

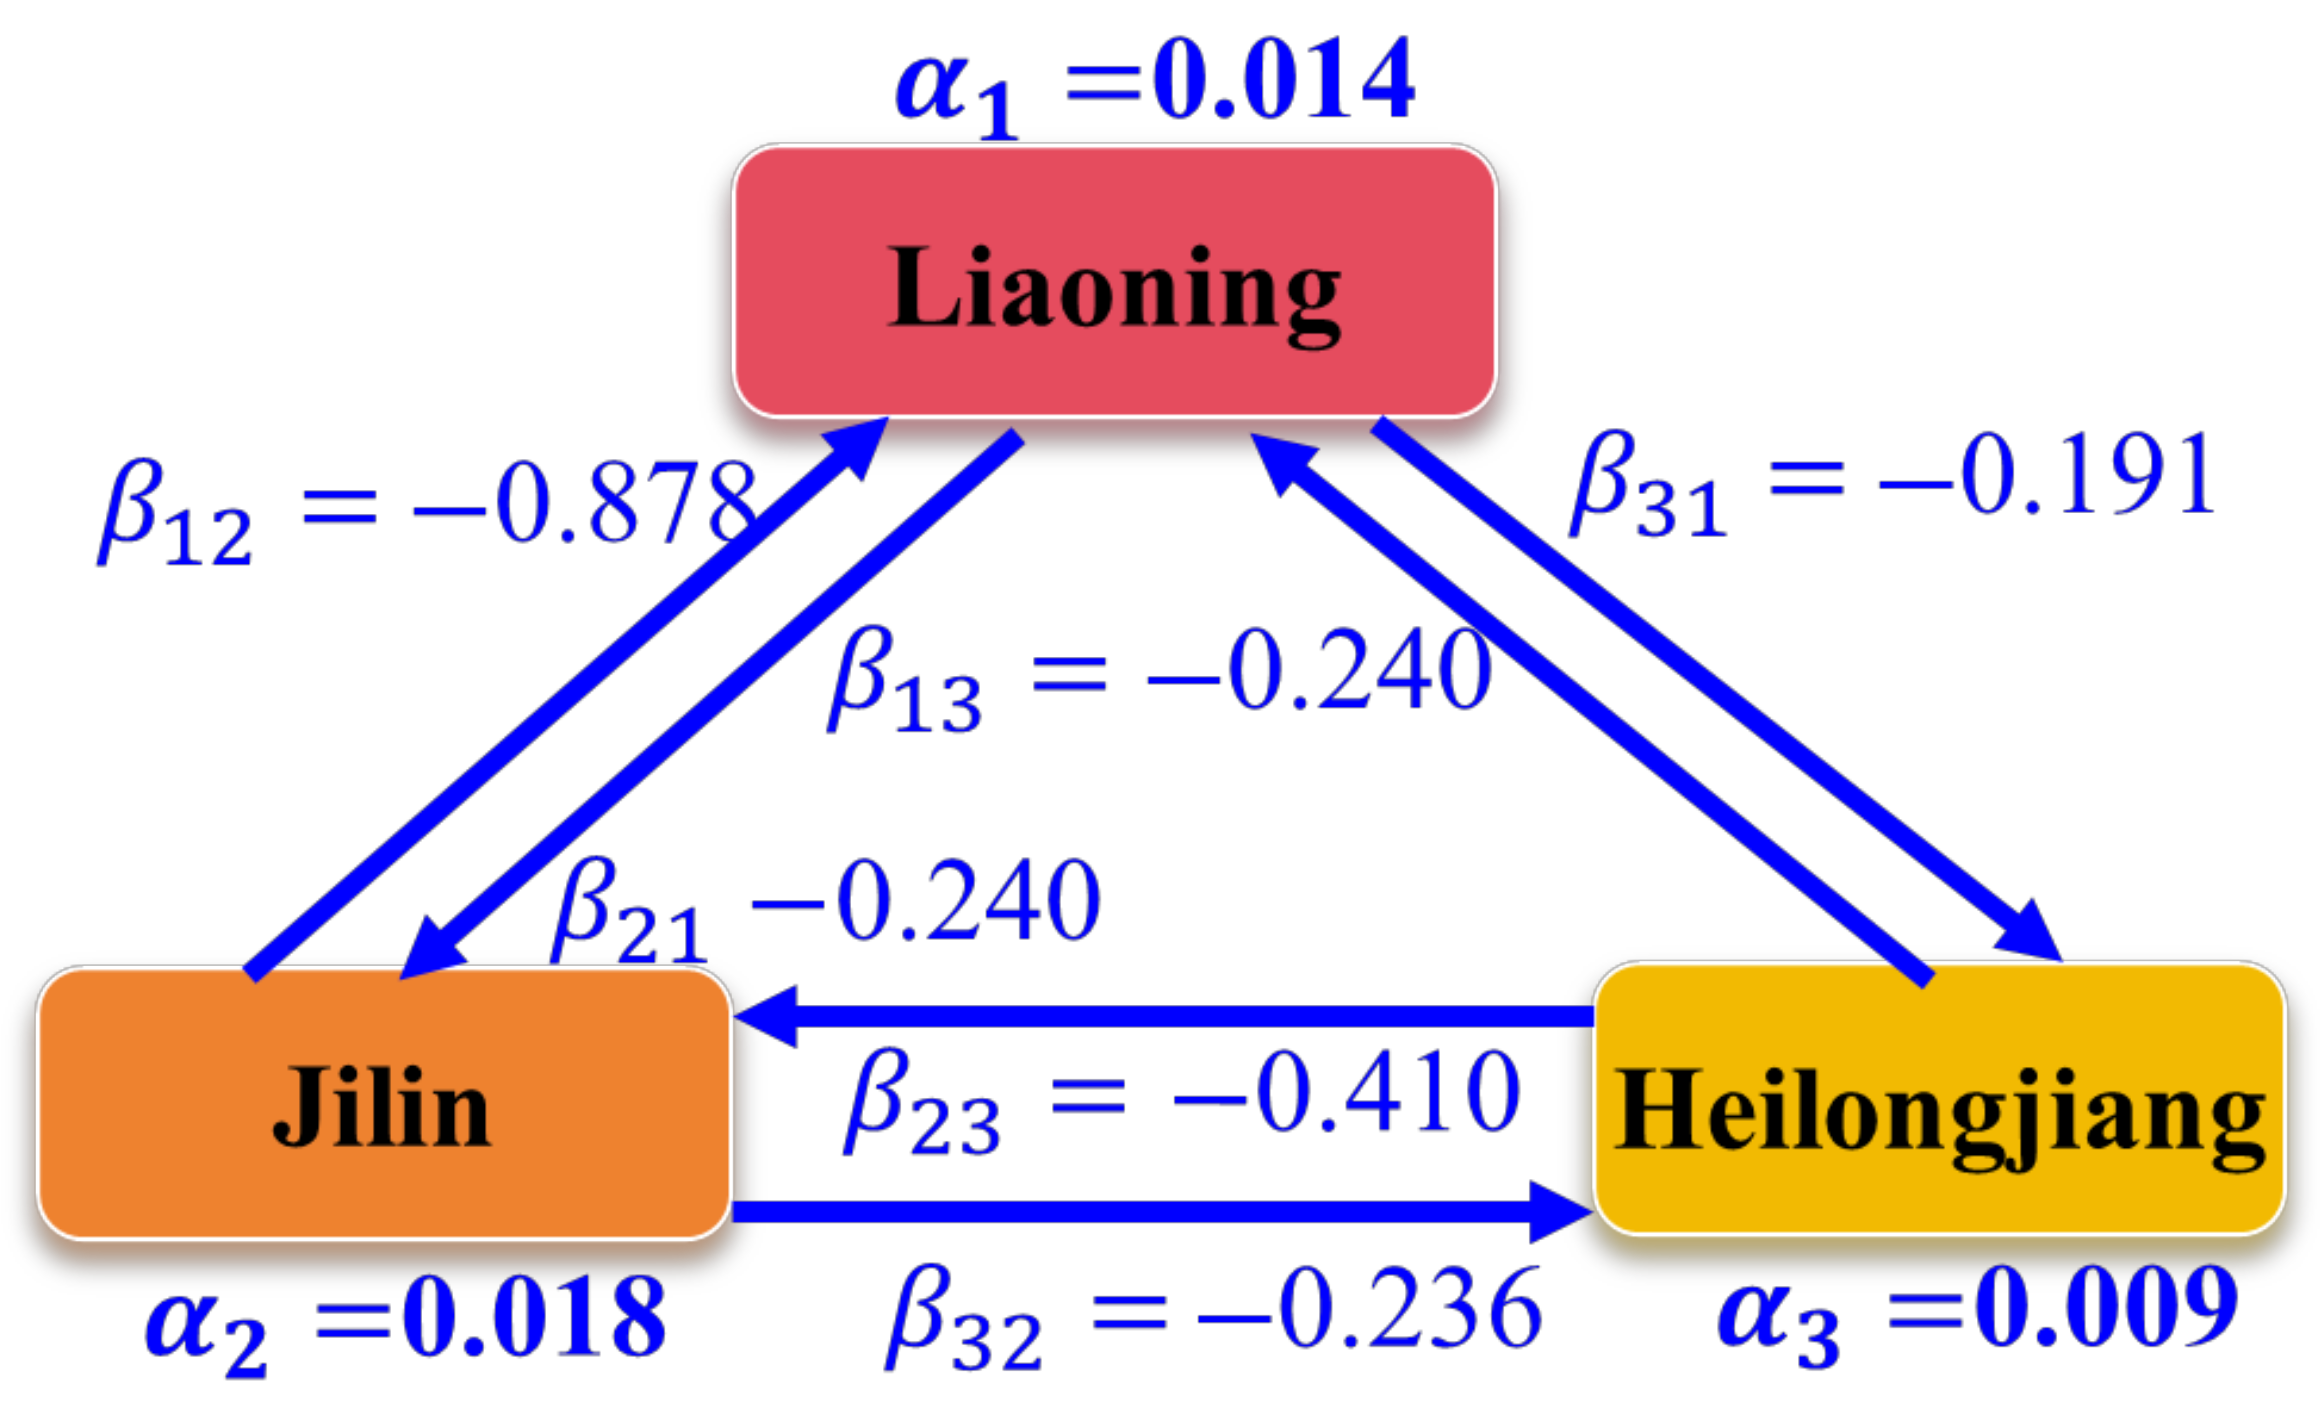
3.3.2. Analysis of Competition and Cooperation Among Three Northeastern Provinces

In addition to the internal interactions among the water, energy, and food subsystems, there is also competition and cooperation among the three provinces of Northeast China—Liaoning, Jilin, and Heilongjiang—during their respective development processes. To quantitatively examine the interprovincial dynamics of WEF system co-evolution, this study constructs a synergistic evolution model using the WEF-CCD of each province, denoted as X ¯ 1 , X ¯ 2 , and X ¯ 3 for Liaoning, Jilin, and Heilongjiang, respectively. The estimated model parameters and corresponding equilibrium points— E 1 ( 0 , 0 , 0 ) , E 2 ( 0 , 0 , 1 ) , E 3 ( 0 , 1 , 0 ) , E 4 ( 1 , 0 , 0 ) , and E 5 ( x 1 , x 2 , x 3 ) —are shown in Figure 11, and their stability characteristics are presented in Table 4.
The parameter values satisfy α 2 >   α 1 >   α 3 > 0, indicating that all three provinces are undergoing WEF system development. Among them, Jilin is progressing the fastest, followed by Liaoning, while Heilongjiang lags behind. Jilin has made notable advances in agricultural modernization, water infrastructure, and energy transition, enhancing its WEF coordination. Liaoning benefits from a developed infrastructure but faces structural transition pressures. Despite its abundant resources, Heilongjiang’s development is constrained by population outflow, a weak industrial base, and insufficient system resilience.
From the parameters β 12 < 0, β 13 < 0, it is evident that both Jilin and Heilongjiang positively influence Liaoning’s WEF system, with Jilin playing a more prominent role. Jilin’s strength in food production, water regulation, and regional collaboration supports Liaoning. This positive influence can be economically interpreted as follows: Jilin’s abundant food output reduces Liaoning’s dependency on external food imports, thereby lowering logistical and trade costs. Moreover, water management infrastructure in Jilin benefits from regional integration projects, such as inter-basin transfers, which indirectly reduce the capital investment burden for downstream provinces like Liaoning. Heilongjiang, although less connected economically, provides complementary resources, such as surplus water and raw food materials, offering supply-side security for Liaoning’s industrial and urban sectors.
Similarly, the parameters β 21 < 0, β 23 < 0 show that Liaoning and Heilongjiang both promote Jilin’s WEF development, with Heilongjiang’s contribution being greater. Heilongjiang’s abundant water resources and strong agricultural capacity provide a stable supply of essential inputs—such as irrigation water and raw food products—which help lower production costs and enhance food security in Jilin. These upstream advantages support Jilin’s agro-processing industry and reduce its dependency on external resources. Meanwhile, Liaoning contributes through energy provision and technical cooperation, including grid connectivity and industrial support for clean energy and equipment. Although Liaoning’s role is positive, its impact is somewhat limited by geographic distance and industrial structure differences, which reduce the degree of system integration. Nonetheless, these interprovincial linkages collectively enhance Jilin’s overall WEF coordination capacity.
The parameters β 31 < 0, β 32 < 0 indicate that both Liaoning and Jilin support the development of Heilongjiang’s WEF system, with Jilin having a stronger effect due to close geographic proximity and tighter agricultural and water system linkages. However, this support may also entail competitive spillovers. Liaoning and Jilin, with more advanced infrastructure and innovation capacity, may draw away capital and labor from Heilongjiang, creating asymmetries in investment and innovation flow. This explains why Heilongjiang remains the weakest subsystem despite strong natural endowment.
The stability analysis of the five equilibrium points reveals that only E 5 ( x 1 , x 2 ,   x 3 ) is stable, suggesting that the three provincial systems will co-evolve toward this steady-state configuration. Hence, despite competitive and asymmetric interactions, the WEF systems of Liaoning, Jilin, and Heilongjiang are collectively progressing toward a stable and coordinated state.
In summary, the core parameters of the co-evolutionary model—the growth coefficients ( α ) and competitive influence coefficients ( β )—not only quantify the speed of the WEF system evolution and the direction of interprovincial interactions but also reflect underlying differences in institutional capacity, resource endowments, and development stages across regions. Provinces with higher α values (e.g., Jilin) typically demonstrate stronger policy responsiveness, greater infrastructure investment, and more effective internal coordination mechanisms, resulting in accelerated progress in agricultural modernization, energy transition, and water resource regulation. In contrast, provinces with lower α values (e.g., Heilongjiang) often face constraints, such as rigid industrial structures, population outmigration, and inefficient resource allocation, which hinder systemic development momentum. The β coefficients reveal the nature of interprovincial relationships in terms of cooperation and competition. Negative values of β ( β < 0) often stem from cooperative mechanisms, including complementary grain supply chains, joint construction of water infrastructure, and interprovincial electricity grid connectivity. Conversely, positive β values ( β > 0) may reflect competition over capital, labor, and market access, resulting in negative externalities. These patterns are consistent with regional economic theories that emphasize the asymmetry of factor mobility and the imbalance of policy coordination across spatial units.

4. Discussion

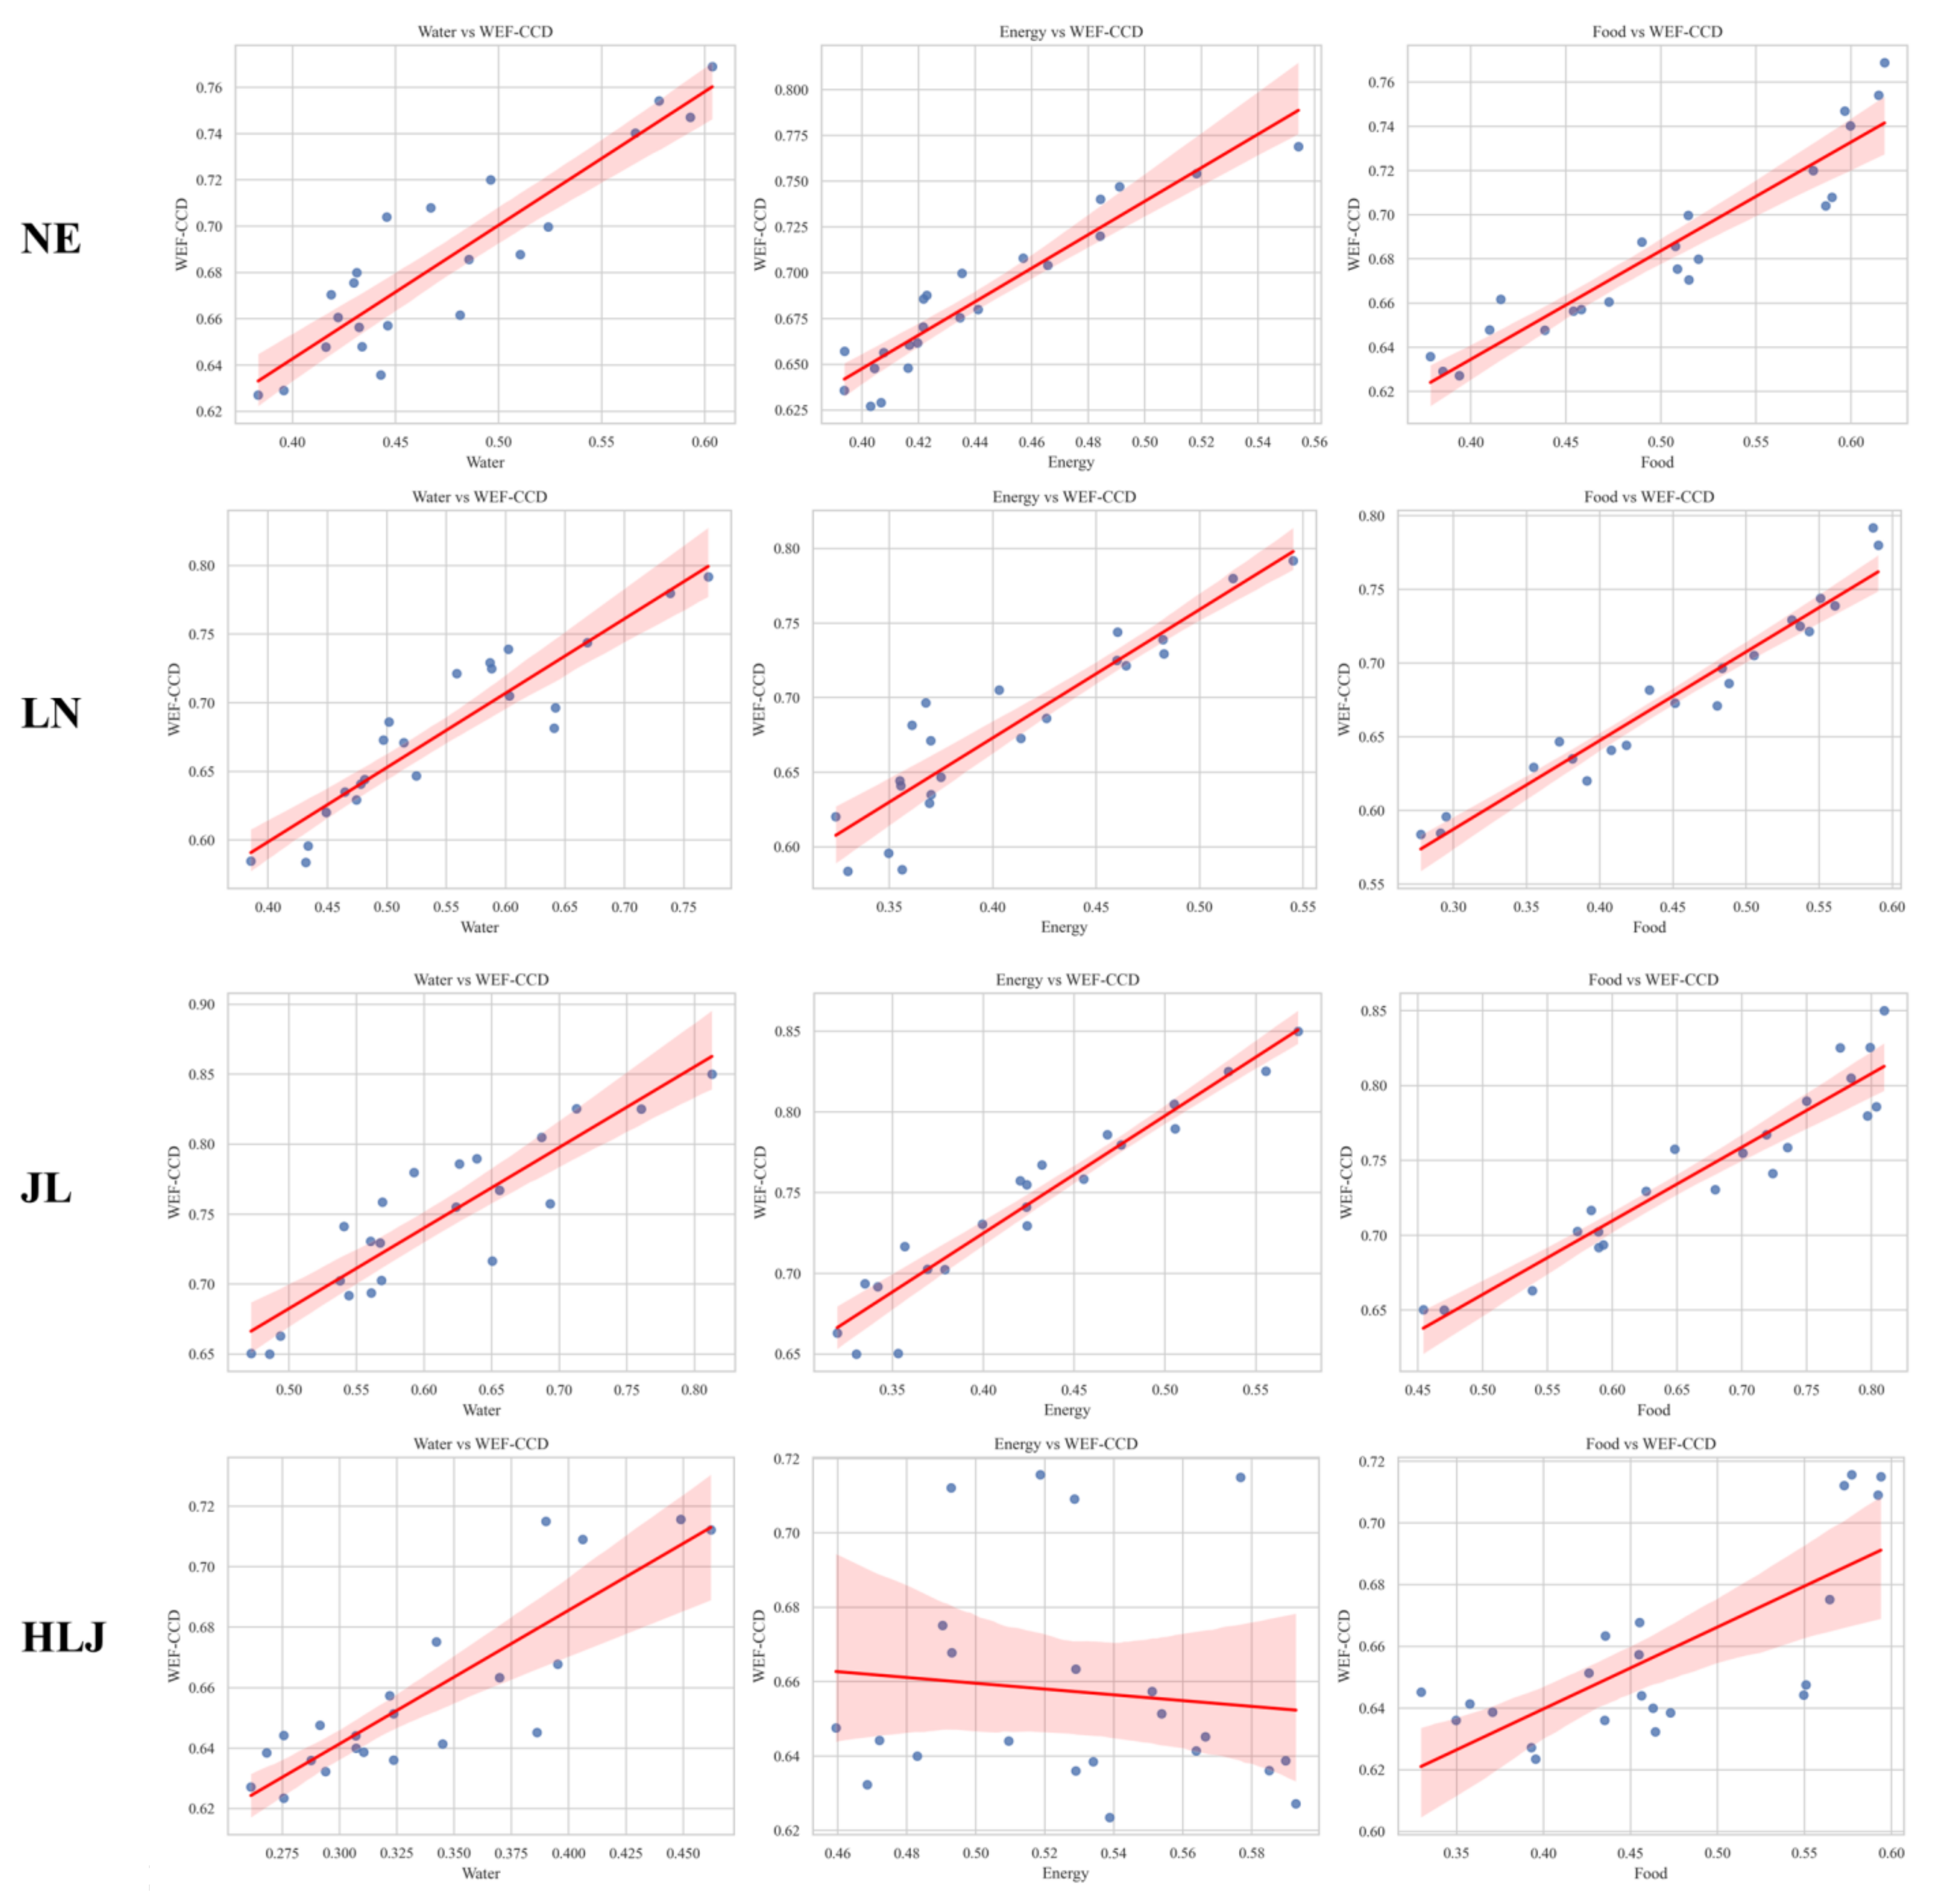
4.1. Relationship Between WEF Subsystems and WEF-CCD

To analyze the impact of the water, energy, and food subsystems on the overall WEF-CCD in Northeast China, we conducted a linear regression analysis using data from Liaoning, Jilin, Heilongjiang, and the region as a whole for the period 2001–2022. The results are presented in Figure 12.
At the regional level, the energy subsystem exhibits the highest regression slope and coefficient of determination with respect to the WEF-CCD (slope = 1.049, R2 = 0.894), followed by the water subsystem (slope = 0.656, R2 = 0.819), with the food subsystem ranking lowest (slope = 0.588, R2 = 0.719). Statistically, this indicates that fluctuations in the energy subsystem exert the greatest influence on WEF-CCD variation. However, considering its developmental trajectory over the past two decades, the energy subsystem in Northeast China has experienced the slowest growth and maintains the lowest baseline level. As such, energy acts as a “high-sensitivity” yet constraining factor—a bottleneck-type driver—requiring priority optimization. These findings may be partly explained by the substantial barriers to capital investment associated with energy infrastructure transformation in Northeast China. The transition from a coal-dominated energy structure to renewable and smart-grid systems involves significant upfront costs and long payback periods, which may be particularly challenging due to the region’s constrained fiscal capacity and limited private investment incentives. In addition, the declining energy self-sufficiency rate—now below 50%—may expose the system to increased external supply risks, potentially amplifying the energy subsystem’s sensitivity and reinforcing its role as a bottleneck in the overall WEF coordination process. In contrast, the water subsystem demonstrates relative stability, serving as the foundational support for the coordinated operation of the WEF system. The food subsystem, while exhibiting the weakest marginal driving force, plays an irreplaceable role in ensuring long-term systemic resilience and security.
In Liaoning Province, both the energy subsystem (R2 = 0.838, slope = 0.860) and the water subsystem (R2 = 0.855, slope = 0.542) have significant positive effects on WEF-CCD. Although the food subsystem has a slightly lower R2 (0.775), it presents a higher slope value (0.688), indicating its strong marginal contribution. These results suggest that, while energy and water subsystems are important structural drivers, the food subsystem’s latent influence should not be underestimated, particularly given its potential to support coordination in transitional contexts. In Jilin Province, the energy subsystem has the strongest influence (R2 = 0.931, slope = 1.113), followed by the water subsystem (R2 = 0.800, slope = 0.457) and the food subsystem (R2 = 0.743, slope = 0.554). This reflects a well-integrated structure where energy development and water infrastructure together support agricultural resilience, highlighting the need to strengthen WEF interlinkages to sustain this synergy. In contrast, Heilongjiang’s energy subsystem exhibits almost no explanatory power for WEF-CCD (R2 = 0.012, slope = 0.071), indicating potential structural redundancy or inefficiencies. The water subsystem remains the primary driver (R2 = 0.747, slope = 0.653), especially in agricultural irrigation, while the food subsystem (R2 = 0.646, slope = 0.629) continues to play a stabilizing role.
These provincial differences reflect underlying variations in resource endowments, industrial structures, and institutional capacities. In Liaoning, the energy subsystem’s high sensitivity may stem from its mature industrial base and energy-saving potential, implying that clean energy transition in heavy industries can offer both feasible and high-return improvements in coordination. Jilin’s agricultural advantage and institutional continuity support the food subsystem’s strong contribution, suggesting that policies should focus on improving agricultural eco-efficiency and integrating energy–water use in rural areas. In Heilongjiang, the weakness of the energy subsystem points to the need for structural adjustment, improved resource allocation, and enhanced interprovincial cooperation, especially in energy infrastructure and innovation.

4.2. Policy Recommendations

Although the water subsystem exhibits an overall upward development trend ( α 1 > 0), the empirical results indicate that its coordination still faces bottlenecks and structural challenges. The grey relational analysis reveals that indicators such as the proportion of ecological water use (W6), proportion of groundwater supply (W5), and water self-sufficiency rate (W10) have significant positive impacts on the WEF coordination level, underscoring the water system’s critical role in maintaining regional ecological balance and resource security. Meanwhile, indicators like per capita water use (W7), reservoir capacity (W3), and water use per unit GDP (W9) frequently emerge as major obstacles, reflecting inefficiencies in water use and infrastructural deficiencies. In response, efforts should focus on strengthening ecological protection for rivers and lakes and enhancing groundwater recharge. This goal can be achieved by establishing watershed ecological compensation mechanisms and piloting water rights trading schemes to incentivize multi-stakeholder participation in water conservation. At the regional level, cross-basin water transfer and integrated water network construction should be promoted through public–private partnership (PPP) models to improve allocation efficiency and system resilience. For agricultural water saving, high-efficiency irrigation equipment should be included in agricultural machinery subsidy lists, and large-scale agricultural entities should be guided to adopt water-saving technologies via performance-based incentives. Additionally, differentiated water pricing and tradable water quota systems, supported by water use performance assessments, can encourage high-water-consuming industries to reduce water use and costs. Infrastructure-wise, green bonds or re-lending mechanisms can be leveraged to support reservoir expansion and the development of intelligent dispatching systems, thereby enhancing the system’s storage and stability capacities.
The energy subsystem is currently the slowest-growing component within the WEF nexus, and its improvement is significantly constrained. The analysis shows that electricity generation (E3) and the proportion of clean energy in power generation (E5) have strong positive influences in the grey relational model, emphasizing the pivotal role of energy structure optimization in system coordination. Conversely, indicators such as total energy consumption (E2), energy consumption per CNY 10,000 of GDP (E8), energy self-sufficiency rate (E10), and primary energy production (E1) frequently act as obstacle factors, reflecting the suppressive effects of a high-consumption, high-dependency energy system on overall coordination. To address this, the regional clean energy development plan should be accelerated. Based on local resource endowments, renewable energy subsidies and tax incentives should be introduced to promote investments in wind and solar power. Simultaneously, clean energy grid access and capacity pricing mechanisms should be improved to enhance market integration. For high-energy-consuming industries, energy efficiency benchmarking and retrofit programs, coupled with interest-subsidized green loans, should be implemented to improve overall efficiency. Furthermore, optimizing the structure and circulation of energy production and encouraging interprovincial electricity connectivity can enhance the subsystem’s self-sufficiency and flexibility.
The food subsystem demonstrates stable growth overall ( α 3 > 0), playing a fundamental role in supporting regional food security. However, the analysis reveals that it imposes a significant suppressive effect on the water subsystem ( β 13 > 0), indicating that behind its high output lies a strong resource consumption externality, which may exacerbate water pressure and inter-system imbalance. The grey relational analysis identifies food production water efficiency (F5), food production (F1), and food self-sufficiency rate (F10) as key positive drivers of system coordination, suggesting that improving output efficiency and self-sufficiency is essential for stable system evolution. In contrast, proportion of agricultural water use (F7), agricultural fertilizer application (F4), and multiple cropping index (F8) frequently appear as obstacles, indicating structural challenges, such as high input intensity and ecological burdens. To address these issues, policies should include cultivated land protection compensation, soil fertility enhancement subsidies, and high-standard farmland investment programs to ensure stable and efficient grain production. On the technical front, drought-resistant crop varieties and precision fertilization equipment should be promoted, along with green agriculture certification and subsidies for environmentally friendly inputs. To enhance system resilience, mechanisms such as agricultural meteorological index insurance and grain price support with strategic reserves should be established to cope with extreme climate and market shocks. Simultaneously, reasonable caps on agricultural water use and fertilizer application should be set to guide agriculture toward a green and low-carbon transition, thereby reinforcing the food system’s foundational role within the WEF system.

4.3. Limitations

Although this study establishes a relatively comprehensive analytical framework and makes progress in indicator design, obstacle identification, and co-evolution modeling, several limitations remain that warrant further improvement in future research.
While the constructed indicator system covers multiple dimensions—including resource endowment and utilization efficiency—it still lacks granularity in capturing the physical process relationships between water and energy systems. For instance, the specific flow of water within the energy system (e.g., for thermal power plant cooling or pumped irrigation) and the actual energy consumption in water resource management (e.g., inter-basin transfer projects or urban water supply systems) are not fully represented. This limits the system’s ability to characterize internal feedback mechanisms and the intensity of resource coupling within the system. Future studies could address this by incorporating remote sensing data, water–energy process simulations, or physically based integrated models to enhance the system’s understanding of multidimensional interactions and dynamic responses within the WEF system.
In addition, the co-evolution model in this study is based on a logistic growth assumption, with parameter estimation relying primarily on historical time-series data. While this model effectively captures gradual system evolution trends, it may be less suitable for addressing discontinuous shocks, such as abrupt policy changes, extreme climate events, or technological breakthroughs. Future research may benefit from integrating scenario simulation, Bayesian updating, or uncertainty analysis methods to improve the model’s adaptability for forecasting and its responsiveness to policy interventions.

5. Conclusions

This study provides an integrated multi-method framework for assessing the coupling coordination and co-evolution of the WEF system in Northeast China. Through a combination of entropy–CRITIC weighting, obstacle diagnosis, grey relational analysis, and co-evolution modeling, our study provides critical insights into subsystem dynamics and regional disparities. The key conclusions are as follows:
(1) WEF coordination has improved but remains uneven. From 2001 to 2022, the regional WEF-CCD increased from 0.627 to 0.769, reaching the intermediate coordination level. The food subsystem demonstrated the most stable and significant improvement, with its CCD rising from 0.39 to 0.62, followed by the water (from 0.38 to 0.60) and energy (from 0.40 to 0.55) subsystems. At the provincial level, Jilin achieved the highest WEF-CCD (0.850 in 2022), while that for Heilongjiang remained the lowest (0.715), indicating substantial interprovincial disparities.
(2) Key bottlenecks and drivers were identified. Obstacle analysis revealed that the core constraints consistently included per capita water use (W7), reservoir capacity (W3), food self-sufficiency rate (F10), energy consumption (E2), and energy consumption per unit GDP (E8), which appear among the top five in all three provinces. Water- and energy-related indicators together account for 75% of high-impact barriers, confirming these two subsystems are the primary bottlenecks for WEF coordination. Complementarily, grey relational analysis identified food production water efficiency (F5), electricity generation (E3), proportion of ecological water use (W6), food self-sufficiency rate (F10), and food production (F1) as the most influential drivers of system coordination, each with a grey relational degree exceeding 0.83. Notably, F10, E3, and W6 simultaneously ranked among the top obstacles and drivers within individual provinces and are thus defined as “high-barrier + high-driver” variables. Their dual role highlights them as strategic priorities for enhancing future WEF nexus coordination and resilience.
(3) The WEF system in Northeast China exhibits a complex interplay of competition and cooperation. Co-evolution modeling revealed that all three subsystems are undergoing development, with the food subsystem exhibiting the fastest growth (α3 = 0.043), followed by the water (α1 = 0.034) and energy (α2 = 0.031) subsystems. The interaction coefficients indicate complex dynamics, as follows: the energy subsystem promotes the water subsystem (β12 = −0.976), while the food subsystem inhibits it (β13 = 0.246); water promotes energy (β21 = −0.655), whereas food suppresses it (β23 = 0.589); and water also supports food (β31 = −0.218), while energy exerts a negative effect (β32 = 0.282). Among the five equilibrium points, only E5(x1, x2, x3) satisfies the stability conditions, confirming that the WEF system is converging toward a stable co-evolutionary equilibrium. These quantified results highlight the asymmetric yet interdependent relationships among subsystems and underscore the region’s gradual transition toward long-term coordination and resilience. At the provincial scale, co-evolution modeling showed that Jilin’s WEF system is developing the fastest (α2 = 0.018), followed by those of Liaoning (α1 = 0.014) and Heilongjiang (α3 = 0.009). The positive interaction coefficients (β < 0) between provinces suggest cooperative dynamics, as follows: Jilin and Heilongjiang promote Liaoning’s coordination; Heilongjiang strongly supports Jilin; and both Liaoning and Jilin enhance Heilongjiang’s development. Despite structural asymmetries, only one stable equilibrium point was identified, indicating that the three provinces are converging toward a coordinated and balanced co-evolutionary state.
Future research should aim to (1) incorporate physical flow data and process-based simulation models to better capture the internal mechanisms of WEF interactions; (2) explore scenario-based or stochastic modeling approaches to evaluate the impacts of policy shifts, climate variability, or technological innovation; and (3) examine the socioeconomic and institutional dimensions of WEF governance, including stakeholder behavior and policy implementation feasibility.

Author Contributions

Conceptualization, H.C. and N.F.; data curation, Z.H.; formal analysis, J.Y. and Z.H.; funding acquisition, H.C.; methodology, Y.C. and H.R.; resources, Y.C.; software, J.Y.; supervision, H.C.; validation, H.R.; writing—original draft, H.C.; writing—review and editing, H.C. and N.F. All authors have read and agreed to the published version of the manuscript.

Funding

This research was funded by the National Natural Science Foundation of China (grant no. 52409041, 52379021), the Natural Science Foundation of Tianjin (grant no. 24JCQNJC01320), the Open Research Fund of the State Key Laboratory of Water Cycle and Water Security (IWHR) (grant no. IWHR-SKL-KF202412), and the Open Research Fund Program of the State Key Laboratory of Hydroscience and Engineering (grant no. sklhse-KF-2025-B-02).

Data Availability Statement

Data will be made available on request.

Acknowledgments

We greatly appreciate the suggestions made by the anonymous reviewers and editors.

Conflicts of Interest

The authors declare no conflicts of interest.

Appendix A

Appendix A.1. Determination of the Stability of Equilibrium Points

To evaluate the stability of the equilibrium points ( X 10 , X 20 , X 30 ) within the co-evolution model, we adopted a classical nonlinear dynamical system analysis framework. This system is governed by a set of three coupled logistic-type differential equations representing the growth and interaction of the water–energy–food subsystems. For any given equilibrium point, the local stability is determined by linearizing the system around the equilibrium and analyzing the signs of the characteristic parameters p, q, and r derived from the Jacobian matrix of the system.
p = f 1 X 10 , X 20 , X 30 X 10 + f 2 X 10 , X 20 , X 30 X 20 + f 3 X 10 , X 20 , X 30 X 30
q = f 1 X 10 , X 20 , X 30 X 10 f 1 X 10 , X 20 , X 30 X 20 f 1 X 10 , X 20 , X 30 X 30 f 2 X 10 , X 20 , X 30 X 10 f 2 X 10 , X 20 , X 30 X 20 f 2 X 10 , X 20 , X 30 X 30 f 3 X 10 , X 20 , X 30 X 10 f 3 X 10 , X 20 , X 30 X 20 f 3 X 10 , X 20 , X 30 X 30
r = f 1 X 10 , X 20 , X 30 X 10 f 2 X 10 , X 20 , X 30 X 20 f 1 X 10 , X 20 , X 30 X 10 f 3 X 10 , X 20 , X 30 X 30 f 2 X 10 , X 20 , X 30 X 20 f 1 X 10 , X 20 , X 30 X 10 + f 2 X 10 , X 20 , X 30 X 30 f 3 X 10 , X 20 , X 30 X 20 + f 1 X 10 , X 20 , X 30 X 20 f 2 X 10 , X 20 , X 30 X 10 + f 1 X 10 , X 20 , X 30 X 30 f 3 X 10 , X 20 , X 30 X 10 .
where:
f 1 X ¯ 1   =   α 1 1 2 X ¯ 1 β 12 X ¯ 2 β 13 X ¯ 3 , f 1 X ¯ 2   =   α 1 β 12 X ¯ 1 , f 1 X ¯ 3   =   α 1 β 13 X ¯ 1 ; f 2 X ¯ 2   =   α 2 1 2 X ¯ 2 β 21 X ¯ 1 β 23 X ¯ 3 , f 2 X ¯ 1   =   α 2 β 21 X ¯ 2 , f 2 X ¯ 3   =   α 2 β 23 X ¯ 2 ; f 3 X ¯ 3   =   α 3 1 2 X ¯ 3 β 31 X ¯ 1 β 32 X ¯ 2 , f 3 X ¯ 1   =   α 3 β 31 X ¯ 3 , f 3 X ¯ 2   =   α 3 β 32 X ¯ 3 ;

Appendix A.2. Data Sources and Calculation Methods for WEF Indicators

Table A1. Data sources and calculation methods for WEF indicators.
CodeAcquisition MethodData Source or Calculation Formula
W1Statistical Data1 Liaoning, Jilin, Heilongjiang Water Resources Bulletin;
2 China Water Resources Statistical Yearbook;
3 Songliao River Basin Water Resources Bulletin
W2Statistical Data
W3Statistical Data
W4Statistical Data
W5CalculatedGroundwater supply/Total water supply;
Sources: 1, 2, 3
W6CalculatedEcological water use/Total water use;
Sources: 1, 2, 3
W7CalculatedTotal water use/Total population;
Sources: 1, 2, 3, 4, 5
W8CalculatedTotal water resources/Total population;
Sources: 1, 2, 3, 4, 5
W9CalculatedTotal water use/GDP (CNY 10,000);
Sources: 1, 2, 3, 4, 5
W10CalculatedTotal water resources/Total water use;
Sources: 1, 2, 3
E1Statistical Data4 Liaoning, Jilin, Heilongjiang Statistical Yearbook;
E2Statistical Data5 China Statistical Yearbook;
E3Statistical Data6 China Energy Statistical Yearbook
E4CalculatedCoal consumption/Total energy consumption;
Sources: 4, 5, 6
E5CalculatedClean energy generation/Total electricity generation;
Sources: 4, 5, 6
E6CalculatedAverage growth rate of energy production/Average growth rate of GDP;
Sources: 4, 5, 6
E7CalculatedAverage growth rate of energy consumption/Average growth rate of GDP;
Sources: 4, 5, 6
E8CalculatedEnergy consumption/GDP (10,000 CNY);
Sources: 4, 5, 6
E9CalculatedEnergy consumption/Total population;
Sources: 4, 5, 6
E10CalculatedEnergy production/Energy consumption;
Sources: 4, 5, 6
F1Statistical Data1 Liaoning, Jilin, Heilongjiang Water Resources Bulletin;
F2Statistical Data4 Liaoning, Jilin, Heilongjiang Statistical Yearbook;
F3Statistical Data5 China Statistical Yearbook;
F4Statistical Data7 China Rural Statistical Yearbook;
F5CalculatedFood production/Agricultural water use;
Sources: 1, 4, 5
F6CalculatedFood production/Sown area;
Sources: 4, 5
F7CalculatedAgricultural water use/Total water use;
Sources: 1, 2, 3
F8CalculatedSown area/Cultivated land area;
Sources: 4, 5
F9CalculatedAgricultural water use/Primary industry GDP (10,000 CNY);
Sources: 1, 2, 3, 4, 5, 7
F10CalculatedFood production/Food consumption;
Sources: 4, 5, 7

References

  1. Keairns, D.L.; Darton, R.C.; Irabien, A. The energy-water-food nexus. Annu. Rev. Chem. Biomol. Eng. 2016, 7, 239–262. [Google Scholar] [CrossRef] [PubMed]
  2. Elmqvist, T.; Andersson, E.; Frantzeskaki, N.; McPhearson, T.; Olsson, P.; Gaffney, O.; Folke, C. Sustainability and resilience for transformation in the urban century. Nat. Sustain. 2019, 2, 267–273. [Google Scholar] [CrossRef]
  3. Thacker, S.; Adshead, D.; Fay, M.; Hallegatte, S.; Harvey, M.; Meller, H.; Hall, J.W. Infrastructure for sustainable development. Nat. Sustain. 2019, 2, 324–331. [Google Scholar] [CrossRef]
  4. Jalilov, S.M.; Keskinen, M.; Varis, O.; Amer, S.; Ward, F.A. Managing the water–energy–food nexus: Gains and losses from new water development in Amu Darya River Basin. J. Hydrol. 2016, 539, 648–661. [Google Scholar] [CrossRef]
  5. Hao, L.; Wang, P.; Yu, J.; Ruan, H. An integrative analytical framework of water-energy-food security for sustainable development at the country scale: A case study of five Central Asian countries. J. Hydrol. 2022, 607, 127530. [Google Scholar] [CrossRef]
  6. Al-Saidi, M.; Elagib, N.A. Towards understanding the integrative approach of the water, energy and food nexus. Sci. Total Environ. 2017, 574, 1131–1139. [Google Scholar] [CrossRef] [PubMed]
  7. White, D.J.; Hubacek, K.; Feng, K.; Sun, L.; Meng, B. The Water-Energy-Food Nexus in East Asia: A tele-connected value chain analysis using inter-regional input-output analysis. Appl. Energy 2018, 210, 550–567. [Google Scholar] [CrossRef]
  8. Karabulut, A.; Egoh, B.N.; Lanzanova, D.; Grizzetti, B.; Bidoglio, G.; Pagliero, L.; Mubareka, S. Mapping water provisioning services to support the ecosystem–water–food–energy nexus in the Danube river basin. Ecosyst. Serv. 2016, 17, 278–292. [Google Scholar] [CrossRef]
  9. Wa’el, A.H.; Memon, F.A.; Savic, D.A. A risk-based assessment of the household water-energy-food nexus under the impact of seasonal variability. J. Clean. Prod. 2018, 171, 1275–1289. [Google Scholar]
  10. Scanlon, B.R.; Ruddell, B.L.; Reed, P.M.; Hook, R.I.; Zheng, C.; Tidwell, V.C.; Siebert, S. The food-energy-water nexus: Transforming science for society. Water Resour. Res. 2017, 53, 3550–3556. [Google Scholar] [CrossRef]
  11. D’Odorico, P.; Davis, K.F.; Rosa, L.; Carr, J.A.; Chiarelli, D.; Dell’Angelo, J.; Rulli, M.C. The global food-energy-water nexus. Rev. Geophys. 2018, 56, 456–531. [Google Scholar] [CrossRef]
  12. Ju, K.; Wang, J.; Wei, X.; Li, H.; Xu, S. A comprehensive evaluation of the security of the water-energy-food systems in China. Sustain. Prod. Consum. 2023, 39, 145–161. [Google Scholar] [CrossRef]
  13. Zheng, D.; An, Z.; Yan, C.; Wu, R. Spatial-temporal characteristics and influencing factors of food production efficiency based on WEF nexus in China. J. Clean. Prod. 2022, 330, 129921. [Google Scholar] [CrossRef]
  14. Samadi-Foroushani, M.; Keyhanpour, M.J.; Musavi-Jahromi, S.H.; Ebrahimi, H. Integrated water resources management based on water governance and water-food-energy nexus through system dynamics and social network analyzing approaches. Water Resour. Manag. 2022, 36, 6093–6113. [Google Scholar] [CrossRef]
  15. Wang, X.; Dong, Z.; Sušnik, J. System dynamics modelling to simulate regional water-energy-food nexus combined with the society-economy-environment system in Hunan Province, China. Sci. Total Environ. 2023, 863, 160993. [Google Scholar] [CrossRef] [PubMed]
  16. Xia, Q.; Tian, G.; Zhao, D.; Zhao, Q.; Varis, O. Effects of new-type urbanization on resource pressure: Evidence from a water-energy-food system perspective in China. Sustain. Cities Soc. 2024, 107, 105411. [Google Scholar] [CrossRef]
  17. Tabatabaie, S.M.H.; Murthy, G.S. Development of an input-output model for food-energy-water nexus in the pacific northwest, USA. Resour. Conserv. Recycl. 2021, 168, 105267. [Google Scholar] [CrossRef]
  18. Saray, M.H.; Baubekova, A.; Gohari, A.; Eslamian, S.S.; Klove, B.; Haghighi, A.T. Optimization of Water-Energy-Food Nexus considering CO2 emissions from cropland: A case study in northwest Iran. Appl. Energy 2022, 307, 118236. [Google Scholar] [CrossRef]
  19. Armengot, L.; Beltrán, M.J.; Schneider, M.; Simón, X.; Pérez-Neira, D. Food-energy-water nexus of different cacao production systems from a LCA approach. J. Clean. Prod. 2021, 304, 126941. [Google Scholar] [CrossRef]
  20. Del Borghi, A.; Tacchino, V.; Moreschi, L.; Matarazzo, A.; Gallo, M.; Vazquez, D.A. Environmental assessment of vegetable crops towards the water-energy-food nexus: A combination of precision agriculture and life cycle assessment. Ecol. Indic. 2022, 140, 109015. [Google Scholar] [CrossRef]
  21. Li, J.; Yu, Y.; Wang, X.; Zhou, Z. System dynamic relationship between service water and food: Case study at Jinghe River Basin. J. Clean. Prod. 2022, 330, 129794. [Google Scholar] [CrossRef]
  22. Li, X.; Zhang, L.; Hao, Y.; Zhang, P.; Xiong, X.; Shi, Z. System dynamics modeling of food-energy-water resource security in a megacity of China: Insights from the case of Beijing. J. Clean. Prod. 2022, 355, 131773. [Google Scholar] [CrossRef]
  23. Ravar, Z.; Zahraie, B.; Sharifinejad, A.; Gozini, H.; Jafari, S. System dynamics modeling for assessment of water–food–energy resources security and nexus in Gavkhuni basin in Iran. Ecol. Indic. 2020, 108, 105682. [Google Scholar] [CrossRef]
  24. Sušnik, J.; Masia, S.; Indriksone, D.; Brēmere, I.; Vamvakeridou-Lydroudia, L. System dynamics modelling to explore the impacts of policies on the water-energy-food-land-climate nexus in Latvia. Sci. Total Environ. 2021, 775, 145827. [Google Scholar] [CrossRef] [PubMed]
  25. Barati, A.A.; Pour, M.D.; Sardooei, M.A. Water crisis in Iran: A system dynamics approach on water, energy, food, land and climate (WEFLC) nexus. Sci. Total Environ. 2023, 882, 163549. [Google Scholar] [CrossRef] [PubMed]
  26. Wu, L.; Elshorbagy, A.; Pande, S.; Zhuo, L. Trade-offs and synergies in the water-energy-food nexus: The case of Saskatchewan, Canada. Resour. Conserv. Recycl. 2021, 164, 105192. [Google Scholar] [CrossRef]
  27. Ghani, H.U.; Silalertruksa, T.; Gheewala, S.H. Water-energy-food nexus of bioethanol in Pakistan: A life cycle approach evaluating footprint indicators and energy performance. Sci. Total Environ. 2019, 687, 867–876. [Google Scholar] [CrossRef] [PubMed]
  28. Wang, C.; Chen, Y.; Sun, M.; Wu, J. Potential of technological innovation to reduce the carbon footprint of urban facility agriculture: A food–energy–water–waste nexus perspective. J. Environ. Manag. 2023, 339, 117806. [Google Scholar] [CrossRef] [PubMed]
  29. Qi, Y.; Farnoosh, A.; Lin, L.; Liu, H. Coupling coordination analysis of China’s provincial water-energy-food nexus. Environ. Sci. Pollut. Res. 2022, 29, 1–11. [Google Scholar]
  30. Song, S.; Chen, X.; Liu, T.; Zan, C.; Hu, Z.; Huang, S.; Sun, Y. Indicator-based assessments of the coupling coordination degree and correlations of water-energy-food-ecology nexus in Uzbekistan. J. Environ. Manag. 2023, 345, 118674. [Google Scholar] [CrossRef] [PubMed]
  31. Wang, S.; Yang, J.; Wang, A.; Liu, T.; Du, S.; Liang, S. Coordinated analysis and evaluation of water–energy–food coupling: A case study of the Yellow River basin in Shandong Province, China. Ecol. Indic. 2023, 148, 110138. [Google Scholar] [CrossRef]
  32. Fu, N.; Liu, D.; Liu, H.; Pan, B.; Ming, G.; Huang, Q. Evaluation of the coupled coordination of the water–energy–food–ecology system based on the sustainable development goals in the upper Han River of China. Agronomy 2024, 14, 706. [Google Scholar] [CrossRef]
  33. Lv, Y.; Li, Y.; Zhang, Z.; Luo, S.; Feng, X.; Chen, X. Spatio-temporal evolution pattern and obstacle factors of water-energy-food nexus coupling coordination in the Yangtze river economic belt. J. Clean. Prod. 2024, 444, 141229. [Google Scholar] [CrossRef]
  34. Hu, Y.; Duan, W.; Zou, S.; Chen, Y.; De Maeyer, P.; Van de Voorde, T.; Goethals, P.L. Coupling coordination analysis of the water-food-energy-carbon nexus for crop production in Central Asia. Appl. Energy 2024, 369, 123584. [Google Scholar] [CrossRef]
  35. Wa’el, A.H.; Memon, F.A.; Savic, D.A. An integrated model to evaluate water-energy-food nexus at a household scale. Environ. Model. Softw. 2017, 93, 366–380. [Google Scholar]
  36. Li, M.; Fu, Q.; Singh, V.P.; Ji, Y.; Liu, D.; Zhang, C.; Li, T. An optimal modelling approach for managing agricultural water-energy-food nexus under uncertainty. Sci. Total Environ. 2019, 651, 1416–1434. [Google Scholar] [CrossRef] [PubMed]
  37. Zhang, X.; Vesselinov, V.V. Integrated modeling approach for optimal management of water, energy and food security nexus. Adv. Water Resour. 2017, 101, 1–10. [Google Scholar] [CrossRef]
  38. Bellezoni, R.A.; Sharma, D.; Villela, A.A.; Junior, A.O.P. Water-energy-food nexus of sugarcane ethanol production in the state of Goiás, Brazil: An analysis with regional input-output matrix. Biomass Bioenergy 2018, 115, 108–119. [Google Scholar] [CrossRef]
  39. Sánchez-Zarco, X.G.; Ponce-Ortega, J.M. Water-energy-food-ecosystem nexus: An optimization approach incorporating life cycle, security and sustainability assessment. J. Clean. Prod. 2023, 414, 137534. [Google Scholar] [CrossRef]
  40. Wen, C.; Dong, W.; Zhang, Q.; He, N.; Li, T. A system dynamics model to simulate the water-energy-food nexus of resource-based regions: A case study in Daqing City, China. Sci. Total Environ. 2022, 806, 150497. [Google Scholar] [CrossRef] [PubMed]
  41. Du, S.; Liu, G.; Li, H.; Zhang, W.; Santagata, R. System dynamic analysis of urban household food-energy-water nexus in Melbourne (Australia). J. Clean. Prod. 2022, 379, 134675. [Google Scholar] [CrossRef]
  42. Yue, Q.; Guo, P. Managing agricultural water-energy-food-environment nexus considering water footprint and carbon footprint under uncertainty. Agric. Water Manag. 2021, 252, 106899. [Google Scholar] [CrossRef]
  43. Mondal, K.; Chatterjee, C.; Singh, R. Examining the coupling and coordination of water-energy-food nexus at a sub-national scale in India–Insights from the perspective of Sustainable Development Goals. Sustain. Prod. Consum. 2023, 43, 140–154. [Google Scholar] [CrossRef]
  44. Wang, Y.; Song, J.; Zhang, X.; Sun, H.; Bai, H. Coupling coordination evaluation of water-energy-food and poverty in the Yellow River Basin, China. J. Hydrol. 2022, 614, 128461. [Google Scholar] [CrossRef]
  45. Cheng, Y.; Wang, J.; Shu, K. The coupling and coordination assessment of food-water-energy systems in China based on sustainable development goals. Sustain. Prod. Consum. 2023, 35, 338–348. [Google Scholar] [CrossRef]
  46. Qin, Q.; He, W.; Yuan, L.; Degefu, D.M.; Ramsey, T.S. Coupled and coordinated development of water-energy-food-ecology-land system in the Yangtze River Delta, China. npj Clean Water 2025, 8, 1–12. [Google Scholar] [CrossRef]
  47. Marouani, I.E.; Khomsi, K.; Mohtar, R.; Khalis, M. The WEF HEALTH NEXUS: Assessment of Strategies & Co-Benefits in the Eastern Mediterranean Region. ISEE Conf. Abstr. 2023, 2023. [Google Scholar] [CrossRef]
  48. Devlin, L.; Goralnik, M.; Ross, W.G., Jr.; Tart, K.T. Climate Change and Public Health in North Carolina: A Unique State Offers a Unique Perspective. Environ. Health Perspect. 2014, 122, A146–A147. [Google Scholar] [CrossRef] [PubMed]
  49. Di Giuseppe, A.; Gambelli, A.M.; Rossi, F.; Nicolini, A.; Ceccarelli, N.; Palliotti, A. Insulating Organic Material as a Protection System against Late Frost Damages on the Vine Shoots. Sustainability 2020, 12, 6279. [Google Scholar] [CrossRef]
  50. Yao, Q.; Cao, H.; Zhang, R. Water–Energy–Land–Food Nexus Performance and Regional Inequality Toward Low-Carbon Transition in China. Land 2025, 14, 1343. [Google Scholar] [CrossRef]
  51. Chang, H.; Zhao, Y.; Cao, Y.; Ren, H.; Yao, J.; Liu, R.; Li, W. Evaluating Coupling Security and Joint Risks in Northeast China Agricultural Systems Based on Copula Functions and the Rel–Cor–Res Framework. Agriculture 2025, 15, 1338. [Google Scholar] [CrossRef]
  52. Herrera-Franco, G.; Bollmann, H.A.; Lofhagen, J.C.P.; Bravo-Montero, L.; Carrión-Mero, P. Approach on Water-Energy-Food (WEF) Nexus and Climate Change: A Tool in Decision-Making Processes. Environ. Dev. 2023, 46, 100858. [Google Scholar] [CrossRef]
  53. Sun, C.Z.; Hao, S. Research on the Competitive and Synergistic Evolution of the Water–Energy–Food System in China. J. Clean. Prod. 2022, 365, 132680. [Google Scholar] [CrossRef]
  54. Chang, H.; Cao, Y.; Zhao, Y.; He, G.; Wang, Q.; Yao, J.; Ren, H.; Yang, H.; Hong, Z. Competitive and synergic evolution of the water–food–ecology system: A case study of the Beijing–Tianjin–Hebei region, China. Sci. Total Environ. 2024, 923, 171509. [Google Scholar] [CrossRef] [PubMed]
  55. Chang, H.; Zhao, Y.; Cao, Y.; He, G.; Wang, Q.; Liu, R.; Li, W. Evaluating Sustainability of Water–Energy–Food–Ecosystems Nexus in Water-Scarce Regions via Coupled Simulation Model. Agriculture 2025, 15, 1271. [Google Scholar] [CrossRef]
  56. Li, W.; Jiang, S.; Zhao, Y.; Li, H.; Zhu, Y.; He, G.; Xu, Y.; Shang, Y. A copula-based security risk evaluation and probability calculation for water–energy–food nexus. Sci. Total Environ. 2023, 856, 159236. [Google Scholar] [CrossRef] [PubMed]
  57. Chang, H.; Zhang, B.; Han, J.; Zhao, Y.; Cao, Y.; Yao, J.; Shi, L. Evaluation of the coupling coordination and sustainable development of water–energy–land–food system on a 40-year scale: A case study of Hebei, China. Land 2024, 13, 1089. [Google Scholar] [CrossRef]
  58. Zhao, Z. The Coupling Mechanism of “Water Resources–Water Environment–Social Economy” Complex System and Industrial Structure Regulation Strategy in the Yangtze River Economic Belt. Ph.D. Thesis, Beijing Normal University, Beijing, China, 2021. (In Chinese). [Google Scholar]
Figure 1. Specific relationships within the WEF system.
Sustainability 17 06745 g001
Figure 2. Study area.
Sustainability 17 06745 g002
Figure 3. The evolution of the WEF subsystems in Northeast China from 2001 to 2022, displayed in (a) box chart, (b) radar chart, and (c) line chart.
Sustainability 17 06745 g003
Figure 4. The evolution of the WEF subsystems in Liaoning, China, from 2001 to 2022, displayed in (a) box chart, (b) radar chart, and (c) line chart.
Sustainability 17 06745 g004
Figure 5. The evolution of the WEF subsystems in Jilin, China, from 2001 to 2022, displayed in (a) box chart, (b) radar chart, and (c) line chart.
Sustainability 17 06745 g005
Figure 6. The evolution of the WEF subsystems in Heilongjiang, China, from 2001 to 2022, displayed in (a) box chart, (b) radar chart, and (c) line chart.
Sustainability 17 06745 g006
Figure 7. The evolution of the (a) WEF-C, (b) WEF-T, and (c) WEF-CCD in Northeast China from 2001 to 2022.
Sustainability 17 06745 g007
Figure 8. Annual obstacle factors in Northeast China from 2001 to 2022. (a) NE; (b) LN; (c) JL; (d) HLJ.
Sustainability 17 06745 g008aSustainability 17 06745 g008b
Figure 9. Grey relational analysis of each indicator and the WEF-CCD across provinces.
Sustainability 17 06745 g009
Figure 10. Competitive and cooperative relationships among the WEF subsystems.
Sustainability 17 06745 g010
Figure 11. Competitive and cooperative relationships among the three northeastern provinces.
Sustainability 17 06745 g011
Figure 12. Linear regression results between WEF subsystems and WEF-CCD across different provinces.
Sustainability 17 06745 g012
Table 1. WEF indicator system.
Target LayerCriterion LayerIndicatorDimensionsUnitAttributeCodeWeight
WEF-CCDWater-CCDPrecipitationResourcesmm+W10.071
Total Water ResourcesResources108 m3+W20.084
Reservoir CapacityResources108 m3+W30.116
Total Water UseResources108 m3W40.104
Proportion of Groundwater SupplyEfficiency%W50.069
Proportion of Ecological Water UseEfficiency%+W60.117
Per Capita Water UseEfficiencym3/personW70.156
Per Capita Water ResourcesEfficiencym3/person+W80.089
Water Use per CNY 10,000 of GDPEfficiencym3/CNY 10,000W90.124
Water Self-Sufficiency RateEfficiency%+W100.071
Energy-CCDPrimary Energy ProductionResources104 tce (tons of coal equivalent)+E10.095
Total Energy ConsumptionResources104 tceE20.149
Electricity GenerationResources108 kWh+E30.138
Proportion of Coal in Energy ConsumptionEfficiency%E40.103
Proportion of Clean Energy in Power GenerationEfficiency%+E50.117
Energy Production Elasticity CoefficientEfficiency%+E60.02
Energy Consumption Elasticity CoefficientEfficiency%E70.026
Energy Consumption per CNY 10,000 of GDPEfficiency104 tce/CNY 10,000E80.111
Per Capita Energy ConsumptionEfficiencytce/personE90.086
Energy Self-Sufficiency RateEfficiency%+E100.156
Food-CCDFood ProductionResources104 tons+F10.078
Food Sown AreaResources103 ha+F20.093
Effectively Irrigated AreaResources103 ha+F30.069
Agricultural Fertilizer ApplicationResources104 tons+F40.096
Food Production Water EfficiencyEfficiencykg/m3+F50.111
Food Yield per Sown AreaEfficiencykg/ha+F60.077
Proportion of Agricultural Water UseEfficiency%F70.119
Multiple Cropping IndexEfficiency%+F80.101
Water Use per CNY 10,000 of Primary Industry GDPEfficiencym3/CNY 10,000F90.135
Food Self-Sufficiency RateEfficiency%+F100.12
Table 2. Classification of coupling coordination degree.
Coupling Coordination Degree[0, 0.4)[0.4, 0.5)[0.5, 0.6)[0.6, 0.7)[0.7, 0.8)[0.8, 0.9)[0.9, 1]
Coordination LevelSevere DiscoordinationNear DiscoordinationLimited CoordinationPrimary CoordinationIntermediate CoordinationGood CoordinationHigh-Quality Coordination
Table 3. Stability discrimination of equilibrium points of the WEF subsystem.
Equilibrium Pointpqr
E1(0,0,0)0.10860.0000−0.0039
E2(0,0,1)−0.00470.00000.0013
E3(0,1,0)0.0675−0.00010.0010
E4(1,0,0)0.0701−0.00010.0008
E5(x1,x2,x3)−0.2318−0.0001−0.0109
Table 4. Stability discrimination of the equilibrium points of the three northeastern provinces.
Equilibrium Pointpqr
E1(0,0,0)0.04150.0000−0.0006
E2(0,0,1)0.03380.00000.0004
E3(0,1,0)0.01980.00000.0000
E4(1,0,0)0.01940.00000.0002
E5(x1,x2,x3)−0.1405−0.0000−0.0053
Disclaimer/Publisher’s Note: The statements, opinions and data contained in all publications are solely those of the individual author(s) and contributor(s) and not of MDPI and/or the editor(s). MDPI and/or the editor(s) disclaim responsibility for any injury to people or property resulting from any ideas, methods, instructions or products referred to in the content.

