Article

Using Machine Learning to Model the Acceptance of Domestic Low-Carbon Technologies

by
Paul van Schaik
1,*,
Heather Clements
1,
Yordanka Karayaneva
2,
Elena Imani
3,
Michael Knowles
4,
Natasha Vall
5 and
Matthew Cotton
6
1
Department of Psychology, Teesside University, Middlesbrough TS1 3BX, UK
2
Department of Computing and Games, Teesside University, Middlesbrough TS1 3BX, UK
3
Engineering Department, Teesside University, Middlesbrough TS1 3BX, UK
4
School of Computing and Engineering, Teesside University, Middlesbrough TS1 3BX, UK
5
Faculty of Liberal Arts and Sciences, University of Greenwich, London SE10 9LS, UK
6
Department of Humanities and Social Sciences, Teesside University, Middlesbrough TS1 3BX, UK
*
Author to whom correspondence should be addressed.
Sustainability 2025, 17(15), 6668; https://doi.org/10.3390/su17156668
Submission received: 5 May 2025 / Revised: 11 July 2025 / Accepted: 16 July 2025 / Published: 22 July 2025

Abstract

This research addresses two specific knowledge gaps. The first regards the influence of domestic low-carbon technology (LCT) installation approaches and occupier status on user acceptance. The second is to demonstrate the role of machine learning techniques in producing an enhanced model-based understanding of domestic LCT acceptance. Together, these two approaches provide new insights into LCT acceptance through the theory of planned behaviour and demonstrate the value of machine learning for modelling such acceptance. Our aim is therefore to contribute to model-based knowledge about the acceptance of domestic LCTs. Specifically, we contribute new knowledge of the acceptance of LCTs according to the theory of planned behaviour and of the value of machine-learning techniques for modelling this acceptance. Through empirical research using an online quasi-experiment with 3813 English residents, we developed a model of low-carbon technology adoption and evaluated machine learning for model analysis. The design factors were the installation approach and occupier status, with main outcomes including adoption intention, willingness to accept, willingness to pay, attitude, subjective norm, and perceived behavioural control. To examine residents’ technology acceptance, we created two virtual reality models of technology implementation, differing in installation approach. For machine learning analysis, we employed nine techniques for model validation and predictor selection: linear regression, LASSO regression, ridge regression, support vector regression, regression tree (decision tree regression), random forest, XGBoost, k-NN, and neural network. LASSO regression emerged as the best technique in terms of predictor selection, with (near-)optimal model fit (R2 and MSE). We found that attitude, subjective norm, and perceived behavioural control significantly predicted the intention to adopt low-carbon technologies. The installation approach influenced willingness to accept, with higher intention for new-build installations than retrofits. Homeownership positively predicted perceived behavioural control, while age negatively predicted several outcomes. This study concludes with implications for policy and future research, a specific emphasis upon contemporary UK policy towards Future Homes Standards, and public information campaigns targeted to specific demographic user groups. This research demonstrates the value of an extended theory of planned behaviour model to study the acceptance of LCTs and the value of machine learning analysis in acceptance modelling.

1. Introduction

Buildings contribute to about a third of global energy consumption and greenhouse gas emissions [1,2]. Reducing and decarbonizing energy use in buildings is crucial for meeting climate targets and achieving long-term environmental sustainability [3,4]. Domestic-scale technologies include solar photovoltaic cells, and air- and ground source heat pumps are major low-carbon technologies (LCTs) for meeting national decarbonization goals [5]. A recent review of technology approaches, technology choice and LCT implementation challenges shows a range of beneficial effects from domestic LCT uptake [6]. Positive effects of the implementation of domestic LCTs include improvement in health through reduced outdoor and indoor air pollution, leading to improved air quality, and increased employment through investment in low-carbon buildings (both retrofit and new build). LCTs can also alleviate long-term energy poverty and improve domestic energy security, though the capital outlay can also exclude those living in poverty from being able to afford LCT purchase [7]. Policy, regulatory and institutional capacity barriers, investment and finance-related barriers, and informational and technical barriers have been identified that pose challenges to the practical implementation of LCTs [8]. Thus, in countries such as the UK, despite increased deployment of LCTs in homes, the uptake rate remains insufficient to meet climate goals [9]. An understanding of the factors that influence the acceptance of LCTs among domestic users is needed to inform national greenhouse gas emissions reduction strategies.
This paper analyses the acceptance of domestic LCTs in an English sample. It employs the Theory of Planned Behaviour (TPB) [10] and machine learning for model validation and predictor selection to assess LCT acceptance. More specifically, nine common machine learning techniques are used to model LCT acceptance in a large novel dataset. While social acceptance is influenced by a broad range of factors (e.g., attitudes, norms, demographics, and housing characteristics), traditional statistical models might not be able to capture this complexity. Machine learning offers several advantages such as improved predictive accuracy, interpretability in some cases, and applicability to new datasets. This was confirmed by a recent review, which advocates using machine learning analysis for modelling the acceptance of energy technologies [11]. Some of the machine-learning techniques employed in this study achieved high predictive performance and offered interpretability in terms of feature selection. In particular, the feature selection capability shows the importance of individual features for LCT acceptance within the TPB framework. In addition, once the models are trained, they can be applied to new datasets across new population samples. While some of the machine learning techniques lacked the feature selection capability (i.e., black-box models), they were used to show the upper limits of model performance and assess overfitting. To the best of our knowledge, this is the first study to employ machine learning within a TPB framework to model LCT acceptance.

2. Literature Review

2.1. Models for Understanding the Acceptance of Low-Carbon Technologies

Recent literature review studies identify three main approaches to understanding LCT behaviours, including the acceptance of LCTs [12,13]. The first is the TPB [10], which proposes that behaviour is directly determined by adoption intention (see Figure 1). Adoption intention is influenced by attitude towards the behaviour, perceived social pressures (subjective norms), and perceived behavioural control [14]. Various demographics and individual-difference variables also influence TPB model variables.
The second approach is the Norm-Activation Model (NAM) [15], which focuses on moral norms. The NAM proposes that behaviour is determined by an individual’s sense of moral obligation to carry out a specific behaviour within a given context, referred to as personal norms. Personal norms are activated by awareness of the consequences and the ascription of responsibility [13]. The Value–Belief–Norm Theory [16] extends the NAM to incorporate value theory and the new ecological paradigm into a causal model of environmental behaviours. Values related to self-interest, concern for others, and environmental protection shape individuals’ beliefs about human–environment interactions. These beliefs foster an awareness of environmental consequences and a sense of personal responsibility, which in turn activate personal norms that influence behaviour [13].
The third approach is the Attitude–Behaviour–External Condition (ABC) model, which proposes that behaviour is determined through the interaction of attitudes, including beliefs, norms, and values, and external factors such as costs, policy, or infrastructure [17]. The strength of the relationship between attitudes and behaviour will be weaker where external factors place strict constraints on behaviour but will increase as external constraints ease. Similarly, the influence of external factors will be diminished where an individual holds a stronger attitude but will increase as strength of the attitude weakens [12].
Although the three aforementioned models are commonly used in a complementary capacity to provide a more complete understanding of behaviour [13], the TPB is most appropriate when attempting to explain behaviours which are of direct benefit to the individual, whereas models incorporating moral norms (i.e., the NAM or the Value–Belief–Norm Theory) are more appropriate to explain behaviours related to the public good [18]. Therefore, as the adoption of LCTs may directly benefit the individual via factors such as reduced energy costs and increased thermal warmth [19], we adopt a TPB approach as a conceptual framework within the study design.
Previous TPB research has commonly used extended models, which incorporate additional variables to increase predictive power [20]. These include two types of normative beliefs. The first are injunctive norms, which account for an individual’s beliefs regarding how others think they should behave; the second are descriptive norms, which account for the individual’s perceptions about others’ actual behaviour [21,22]. Furthermore, several demographic factors, such as income and education level [23], have also been shown to be associated with low-carbon consumption behaviours. Thus, we extend the TPB model to incorporate descriptive and injunctive norms, and relevant demographic factors.

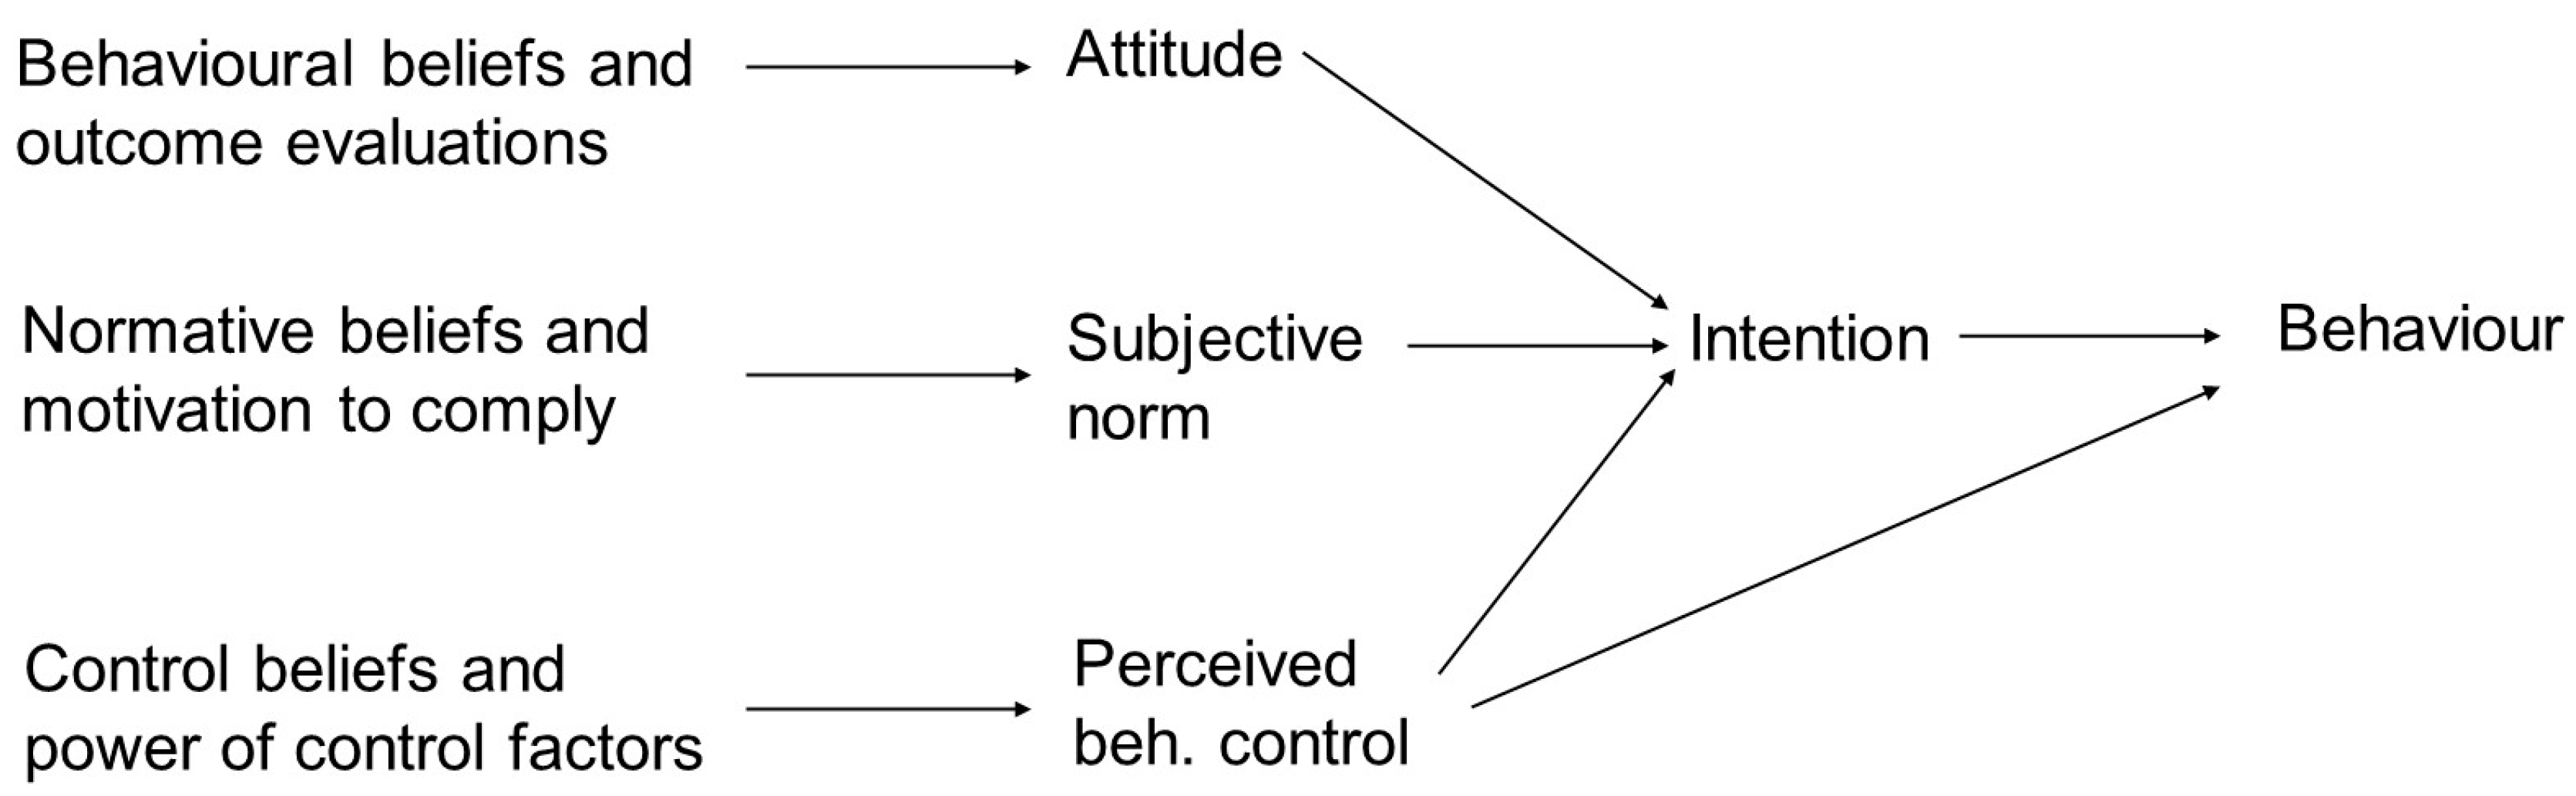
2.2. Acceptance Through the Lens of the Theory of Planned Behaviour

The TPB is widely used to study LCTs and energy consumption behaviours [20]. Notable examples include studies on university students’ intent to use home electricity monitors in England [24] and citizens’ intent to adopt a residential energy management system in Singapore [25]. Studies in Malaysia [26], Jordan [27], Vietnam [28], and India [29] also apply an extended TPB model incorporating factors like perceived usefulness, environmental consciousness, and policy initiatives.
Findings on the TPB’s utility in explaining LCT acceptance are not, however, wholly conclusive. While some researchers have demonstrated increased explanatory power from including additional variables in the model [13], other studies have failed to find evidence of the expected relationships between the core constructs (attitude, subjective norm, perceived behavioural control) and adoption intention [30,31]. This highlights the complexity of the determinants of the acceptance of LCTs and the need for further research to refine and extend the TPB model.

2.3. Acceptance Endpoints

The TPB explains individual behaviours, in which acceptance is measured as adoption intention. Acceptance thus directly influences whether a behaviour is performed. Yuriev et al. [20] found that about one-third of studies assessed only adoption intention, and few justified not measuring actual pro-environmental behaviours. While measuring actual behaviour is preferable, this study focuses on the acceptance of LCTs among individuals who have not (yet) fully committed to using them. Thus, adoption intention was selected as the endpoint.
The traditional approach to measuring acceptance as adoption intention involves participants indicating the likelihood of performing a behaviour. This approach is widely used in TPB research, including applications to renewable energy and other LCTs. For example, Liobikienė et al. [31] used a 5-point Likert scale to measure intention to use renewable energy, finding that perceived behavioural control and subjective norms significantly contributed to adoption intention.
In economic theory, willingness-to-pay (WTP) and willingness-to-accept (WTA) are alternative approaches to assessing adoption intention. WTP is the maximum price an individual is willing to pay for a product or service. WTA is the minimum amount an individual would accept for the loss of a product, service, or right. Both WTP and WTA have been used in research examining LCT acceptance. For example, Bull [32] found that information about running costs or emissions increased WTP for energy-efficient washing machines. Gosnell and McCoy [33] found that 85% of UK participants would adopt a smart meter for a £200 subsidy. Collins and Curtis [34] found that higher costs were associated with a lower likelihood of energy retrofit acceptance in Ireland, but WTP was higher among individuals with existing retrofit.
Studies have considered WTP within the TPB context, often adopting WTP as an alternative measure of adoption intention [35,36]. However, few researchers have considered both traditional measurements of adoption intention and WTP/WTA within the same study. Therefore, this research considered traditional measures of adoption intention alongside WTP/WTA to achieve a more complete understanding of LCT acceptance.

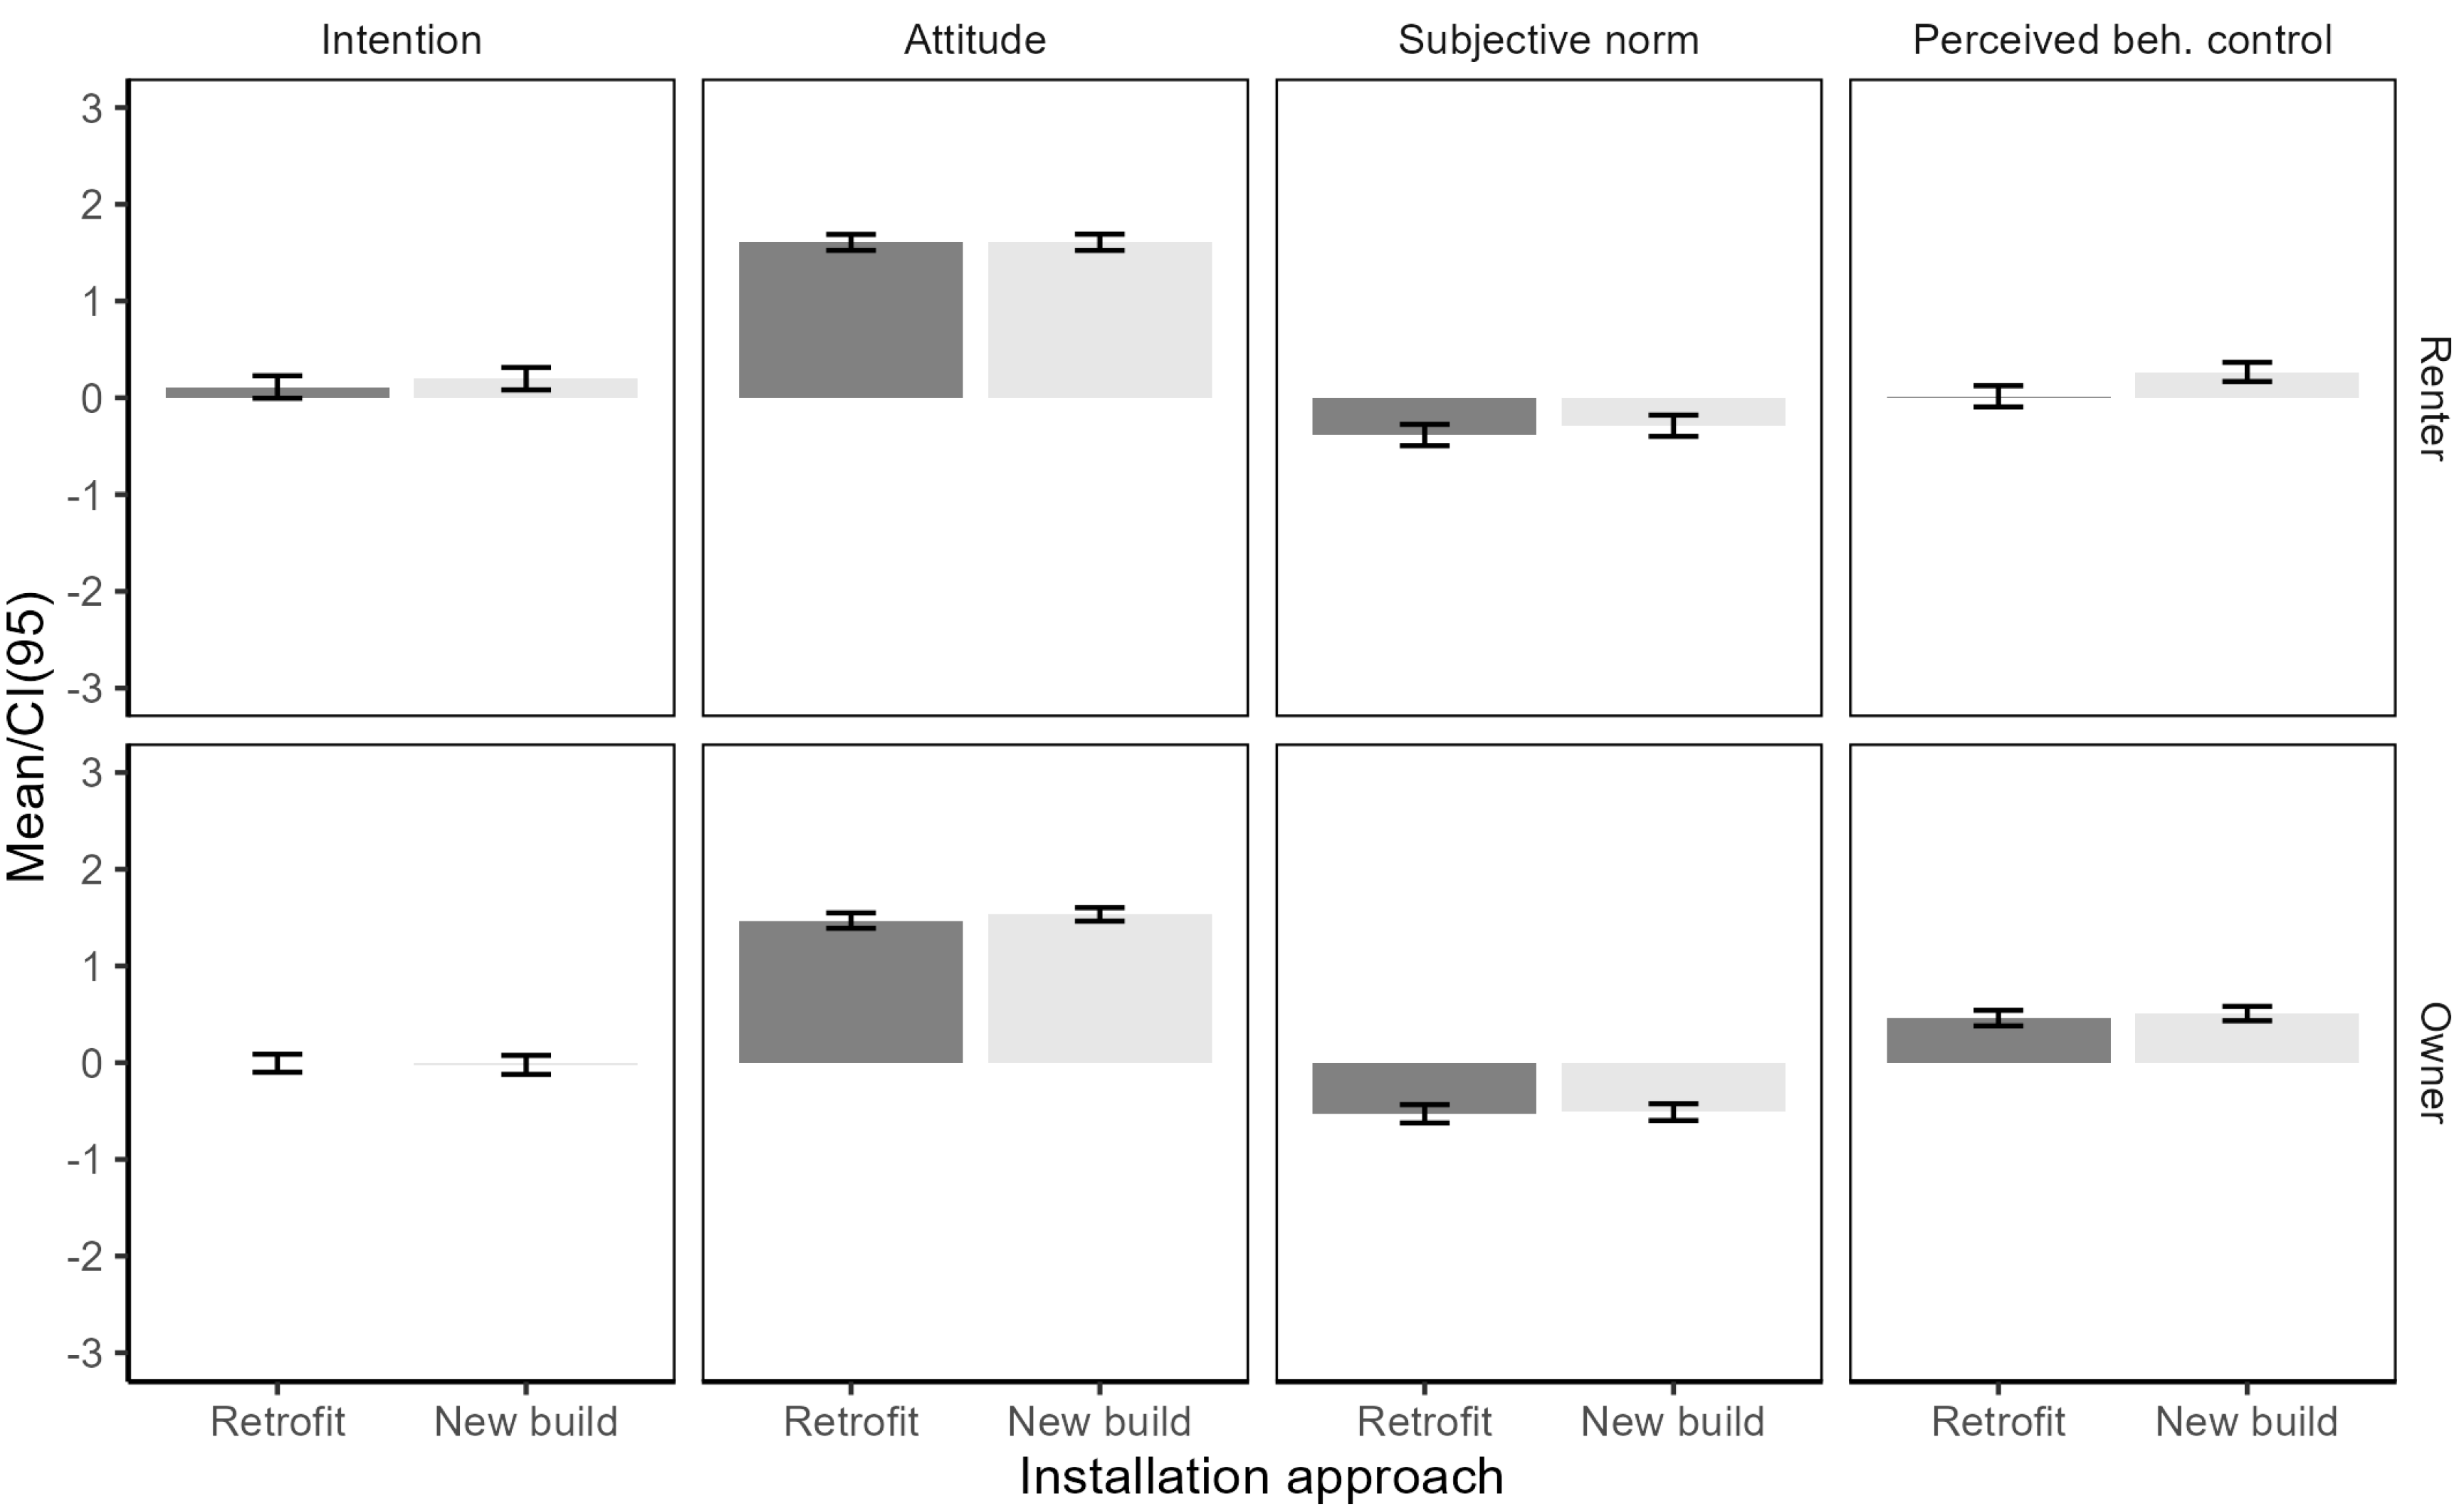
2.4. Acceptance and Approach to Low-Carbon Technology Installation

The rate of new home construction in the UK is low compared to the quantity of existing buildings, with at least 80% of the 2050 housing stock already built [37]. Therefore, both designing new builds with integrated LCTs and retrofitting existing properties are necessary to achieve net-zero targets by 2050. In the UK, the new Future Homes Standard in 2025 provides guidance and building regulations for low-carbon design, though there is currently no legal requirement for existing privately owned homes to be retrofitted. There is also no requirement for users to install low-carbon heating technologies at the point of obsolescence (i.e., older natural gas boilers reaching the end of life can be replaced with new natural gas boilers rather than a heat pump or hydrogen boiler). The LCT uptake for homeowners of existing properties therefore depends upon a combination of adoption intention and market dynamics.
There are multiple barriers to the acceptance of LCTs for both new-build and retrofit properties. Common barriers include large upfront costs, the need to manage numerous contractors during installation, skill gaps in the workforce, and residents’ incorrect use of technologies affecting performance [38]. Specific barriers for new builds include the construction industry’s reluctance to alter current practices or materials [38] and poor compliance with building regulations regarding energy efficiency [39]. For retrofits, substantial disruption to residents over a prolonged period may stymie acceptance [40]. Aesthetics, the historical significance of existing buildings, heritage, and building conservation measures [38], and existing heating features (such as the presence of log-burning stoves) may influence the decision to retrofit [41]. Some thermal retrofit approaches, including insulation and changes to heating systems, may have adverse impacts on air quality, ventilation, or damp coursing within buildings, aggravating existing health conditions such as asthma or bronchitis [42].
Given the differences in barriers to LCT acceptance between new-build properties and retrofitted existing properties, this may impact WTP for these technologies. A retrofit approach involves short-term disruption during installation, while benefits occur in the long term, which are discounted when people make decisions [43]. In a new-build approach, short-term disruption is less applicable. Therefore, adoption intention would likely be greater for new-build homes than for retrofit homes. Furthermore, for homeowners, another consideration is the difference between potential additional upfront costs of LCTs on purchasing a new build and the costs for retrofitting an existing house with LCTs. In the context of a new build, the costs of LCT installation are a fraction of the total costs, but in the context of a retrofit the costs of LCT installation are the only costs. Given the principle of diminishing sensitivity, changes in value are experienced more strongly closer to the reference value of 0 (retrofit) than at a greater distance from the reference [43]. Therefore, adoption intention would be greater for owners in the new-build scenario. Given these collective differences in barriers to LCT acceptance between new-builds and retrofits, differences in willingness-to-pay (WTP) for these technologies are expected. It is therefore essential to study the acceptance of both new-build installation and retrofit installation. This study considers whether differences in acceptance for LCTs exist between these approaches.

2.5. Low-Carbon Technology Acceptance and Occupier Status

Recent research on LCT acceptance has predominantly focused upon owner-occupiers, which is unsurprising given that most housing stock in the EU falls within this category [44]. In England, around 65% of homes are owner-occupied, with the remaining households comprising approximately 19% private rentals and 16% social housing [45]. However, under conditions of prolonged low interest rates leading to rising house prices and suppressed wage growth, younger people face significant barriers to home ownership and a decline in low-cost social housing availability, leading to growth in the private rental sector [46]. Understanding LCT acceptance among tenants is therefore equally important as acceptance among owner-occupiers. Therefore, this research studies both.
Rental properties introduce additional challenges for LCT acceptance. For example, a study in Wales found that social housing residents found retrofitting extremely disruptive, with poor communication about the scale of disruption affecting uptake [40]. Another study in Scotland found that residents may refuse access to contractors for maintenance [47]. A major barrier in rental properties is the split-incentive problem [19], where the benefits of LCTs, such as reduced energy costs and increased thermal comfort, are experienced by the resident(s), while the owner bears the upfront costs. This creates little incentive for landlords to bear the costs, and it is unclear whether the presence of LCTs is associated with a willingness to pay higher rent.
In most cases, owner-occupiers of single-use buildings (houses, bungalows, townhouses) retain control over decisions about changes to their property, including installing LCTs. In shared buildings such as flats or multiple occupancy spaces, other mechanisms of joint decision making may be necessary. Tenants in the private rental sector and social housing sector have considerably less control over the building fabric. Therefore, perceived behavioural control would be typically higher for owner-occupiers than for tenants. This study analyses how occupier status influences perceived behavioural control in relation to LCTs.

2.6. Machine Learning for Acceptance Modelling

In the context of analyzing data within theoretical frameworks such as the TPB in LCT adoption research, the literature has identified broader concerns regarding the adequacy of statistical data analysis techniques commonly used in behavioural and social science research. In most research, overall model fit with the (original) data is analyzed but not verified with a new dataset, an independent subset of the data, or a set of splits of the original data. This lack of validation is a serious problem, as model results (on the original dataset) can suffer from overfitting. This would be demonstrated if the model fit on the new data, independent data, or data splits is worse. The replication crisis in the social and behavioural sciences and academic research more generally may, at least in part, be attributable to this lack of verification.
Overly complex models pose a further problem, and an argument is made for parsimony in model building, with as few components as possible [48]. This facilitates our understanding of how a model’s predicted values relate to the model components (predictors), the diagnosis of problems underlying poor model performance, and the testing of potential solutions. A related concept is the bias–variance trade-off: the balance between model flexibility (in terms of model parameters) and the generalizability of the model in terms of predicting outcome values on new datasets. Machine learning can be described as statistical modelling with the aim of achieving a balanced model fit and has been proposed as an exceedingly significant part of the solution to the problems outlined above. Recent work in psychology [49], sociology [50], and politics [48] has argued and demonstrated the benefits of using machine learning in the behavioural and social sciences. For example, the study of [48] advocates the use of techniques such as penalized regression and tree-based techniques that support parsimony in model evaluation by way of variable selection.
A recent review [11] shows that machine-learning techniques have not been used in research on the social acceptance of energy technologies. The review makes the case for the use of machine-learning techniques in this research area, but it does not present or review specific techniques, their strengths, their limitations or their specific application.
The current study used machine learning to achieve parsimony in modelling LCT adoption, based on the TPB, and to establish potential upper limits to model performance. This is particularly important in the current research, as each of the outcomes in the modelling had a large predictor set.

3. Current Study

Existing research has not systematically empirically studied and modelled the influence of the approach to installation and occupier status on the acceptance of LCTs. Neither has the existing research used and evaluated machine-learning techniques for modelling this acceptance. In terms of novelty, our research addresses these gaps in existing knowledge.
We use the TPB as the basis for our modelling work. This is because, according to existing research, this is most appropriate to use when attempting to explain behaviours which are of direct benefit to the individual (Section 2.1) and because the acceptance of LCTs may lead to direct benefits such as reduced energy costs and increased thermal warmth [19]. As extended models are shown to have increased explanatory power [20], injunctive and descriptive norms and demographics factors are also included within the model. Furthermore, this research includes WTP/WTA alongside traditional measures of adoption intention to provide a more complete understanding of the acceptance of LCTs.
Therefore, our overarching aim is to contribute to model-based knowledge about the acceptance of domestic LCTs. The first objective of this research is to develop an understanding of the acceptance of LCTs according to the TPB, with consideration of the approach to LCT installation (new build versus retrofit) and occupier status (owner-occupier versus tenant). The second objective is to evaluate the use of machine learning techniques for modelling the acceptance of LCTs.
Based on the literature that was reviewed in Section 2, the following hypotheses are proposed and tested in the current study. The research model represents our hypotheses in relation to each other (Figure 2).
Hypothesis 1.1. 
Adoption intention is higher for new builds than for retrofits.
Hypothesis 1.2. 
WTA is higher for new builds than for retrofits.
Hypothesis 1.3. 
WTP is higher for new builds than for retrofits.
Hypothesis 2. 
Perceived behavioural control is higher for owner-occupiers than for tenants (2.5).
Hypothesis 3a.1. 
Attitude positively predicts acceptance adoption intention.
Hypothesis 3a.2. 
Attitude positively predicts acceptance WTA.
Hypothesis 3a.3. 
Attitude positively predicts acceptance WTP.
Hypothesis 3b.1. 
Subjective norm positively predicts acceptance adoption intention.
Hypothesis 3b.2. 
Subjective norm positively predicts acceptance WTA.
Hypothesis 3b.3. 
Subjective norm positively predicts acceptance WTP.
Hypothesis 3c.1. 
Perceived behavioural control positively predicts adoption intention.
Hypothesis 3c.2. 
Perceived behavioural control positively predicts acceptance WTA.
Hypothesis 3c.3. 
Perceived behavioural control positively predicts acceptance WTP.
Hypothesis 4. 
Behavioural beliefs predict attitude.
Hypothesis 5. 
Normative beliefs predict subjective norm.
Hypothesis 6. 
Control beliefs predict perceived behavioural control.
Hypothesis 7.1. 
Demographic factors predict adoption intention.
Hypothesis 7.2. 
Demographic factors predict WTA.
Hypothesis 7.3. 
Demographic factors predict acceptance WTP.
Hypothesis 7.4. 
Demographic factors predict attitude.
Hypothesis 7.5. 
Demographic factors predict subjective norm.
Hypothesis 7.6. 
Demographic factors predict perceived behavioural control.

4. Materials and Methods

4.1. Research Design

A quasi-experimental independent-measure survey design was used. The independent variable was approach to LCT installation (levels: retrofit or new build). The non-experimental factor was current occupier status (main statuses: tenant or owner). The outcomes were the core TPB variables: intention, attitude, subjective norm (social influence), and perceived behavioural control (all four from the TPB), as well as WTP and WTA. Covariates were demographics, current house type, house size (number of bedrooms), and current LCT use.

4.2. Participants

Ethics approval was obtained from the first author’s institution, and online informed consent was obtained from each participant. To demonstrate and benefit from model verification by way of both cross-validation and test validation, a dataset with preferably thousands of cases should be analyzed for statistical modelling (‘machine learning’) [51]. This makes it possible to build models with stable generalization capabilities and reduced overfitting. We used quota sampling by gender and age; inclusion criteria were living in England, age 18 or above, and not using a domestic heat pump. Recruited were 3813 participants (retrofit study condition: 1931; new-build study condition: 1882) through an online survey panel service: 61% were women, 38% were men; 90% were aged 54 or under; and the age range 18–54 was approximately uniformly distributed. Mean age was 46 years (SD = 16). Most participants were of white ethnicity (90%). The most common highest levels of education were, in order, degree (28%), A-level (22%), and GCSE (19%). Most participants were employed (58%) or retired (16%). The most common house types were semi-detached (32%), detached (22%), and mid-terrace (16%). The most common occupier status was self-owned/mortgaged (55%), followed by rented (privately or through social housing) (38%). The most frequent (modal) number of bedrooms was 3, with a median of 3 (semi-interquartile range = 0.5).

4.3. Materials

Two VR building models were created and incorporated in two versions of a video production, illustrating the implementation of domestic LCTs for sustainability: retrofit and new build (https://osf.io/38yjs/files/osfstorage, accessed on 15 July 2025). Each video showed a house with LCTs installed, providing a visual reference point for respondents. The video consisted of a walkthrough and stills with audio narration and showed solar panels, an air source heat pump and boiler, and battery storage. Duration of the retrofit video was 4:10, and of the new-build video was 4:34. The videos were displayed on a 2D computer screen, were not immersive, and did not present a 360° view.
The visual walkthroughs used to present the house design were created using Autodesk Revit 2022 (https://www.autodesk.com/uk/products/revit/, accessed 15 July 2025), employing its built-in walkthrough animation tool. These walkthroughs were standard perspective videos rendered along a fixed and pre-defined camera path, without user interaction or 360° viewing capabilities and were therefore non-immersive. Viewers accessed the content via standard monitors rather than VR headsets.
The videos were structured to provide a comprehensive spatial overview, beginning with a 35-s exterior walkthrough highlighting outdoor components such as photovoltaic panels on the roofs and outdoor components. Interior walkthroughs were recorded separately: a 30-s video showcased ground-floor spaces, including the dining and living rooms, as well as utility spaces. This video features retrofit elements like large radiators (in the retrofit version), skirting boards, water tank, and battery storage. Additional videos focused on upper floors, with approximately 1 minute dedicated to the first floor and 45 s to the second floor, which highlighted how retrofit interventions (radiators and flooring changes) impacted the size and configuration of interior spaces.
Materials and lighting were modelled to approximate realistic appearances with Revit objects and rendering capabilities. Although users could not control the view or movement, narration was added after rendering with PowerPoint to guide viewers through the spaces and explain the retrofit strategies and their effects on building usability and appearance.
An online survey (see Supplementary Materials S1) was created in JISC Online Surveys Version 2 (https://www.jisc.ac.uk/online-surveys, accessed 15 July 2025). Demographic items included gender and age. Housing-related items were house type, owner status, and house size (bedrooms). Current use of LCTs was collected with questions about solar generation, battery energy storage, thermal insulation, and smart meter. Valuation items measured WTP for the installation of the combined LCTs that were shown in the video and WTA for each individual LCT. TPB components were measured with items according to existing guidelines [52]. Questionnaire items measuring behavioural beliefs, normative beliefs, and control beliefs were created from the results of a previous qualitative study within this project [53] and used 7-point Likert scales. The items for the core TPB constructs (intention, attitude towards behaviour, subjective norm, and perceived behavioural control) were subjected to exploratory factor analysis, with principal-axis extraction and direct oblimin rotation. A four-factor solution was identified, after six items with poor loadings or cross-loadings (2 items for intention, subjective norm, and perceived behavioural control, each) were removed (Table 1). Reliability analysis was conducted on the remaining items within each factor as a scale. The four scales, intention, attitude, subjective norm, and perceived behavioural control demonstrated good reliability (Table 1). Next, for each of the core constructs, scale scores were calculated as unweighted averages and used in subsequent analysis.

4.4. Procedure

After consenting, participants completed demographics questions, housing-related questions, and questions related to their current use of LCTs. Then, the video was presented showing the use of LCTs in either a new build or an existing (retrofit) home (see above), followed by a written testimony of the experience of living in a low-carbon home. Subsequently, they answered the WTP and WTA questions and the TPB items (see Supplementary Materials S1).

4.5. Data Analysis

Explorative data analysis was conducted through descriptives/graphs of outcome measures, correlations between TPB measures and principal component analysis (PCA) of WTA measures to reduce their dimensionality, and hypothesis testing through supervised machine-learning techniques. At 7% of the total sample, the percentage of occupier status ‘other’ was an extremely small sub-group below the proposed cut-off of 10% for extreme split of nominal variables [54]. Therefore, this sub-group was not analyzed in any of the following analyses with inferential statistics. Consequently, in these analyses the total sample size was N = 3813 − 283 = 3530, comprising 40% tenants and 60% owner-occupiers.
To facilitate interpretation, rating-scale values were centred, with a range of −3 to 3. Therefore, centred values below 0 indicate a negative/low response and centred values above the middle scale value of 0 indicate a positive/high response. For statistical tests, the confidence level was set at 0.95. As per TPB [10], product terms were created consisting of corresponding behavioural beliefs and outcome evaluations, descriptive norms, and identification with referent, injunctive norms and motivation to comply, and control beliefs and power of control factors; these product terms were then used as predictors in the analysis of the outcome variables.

4.5.1. Supervised Machine Learning and Criteria for Machine-Learning Analysis

We selected the following nine commonly used supervised-learning machine learning techniques [55]. All these techniques are applicable to the analysis of our model of LCT adoption, as each analysis involves one dependent variable (‘label’) and several independent variables (predictors or ‘features’), which requires supervised learning.
Linear regression is a statistical machine-learning technique used to model the relationship between one dependent variable and one or more independent variables. Simple linear regression is used when only one independent variable exists; multiple linear regression is applicable to datasets with multiple independent variables, as in the current study. A main assumption of linear regression is the existence of a linear relationship between the dependent variable and the independent variable(s). This supervised model is known for its simplicity, and it is often used as a baseline model.
LASSO (Least Absolute Shrinkage and Selection Operator) regression is an improvement to classical linear regression by preventing overfitting and providing feature selection. Overfitting is a common problem in machine learning, where the model learns the training data very well and fails to generalize when presented with unseen data. The LASSO model prevents overfitting by imposing an L1 penalty term to penalize the absolute values of coefficients. Hence, some coefficients are forced to zero, which contributes to feature selection and interpretability.
Ridge regression (RR) is another improvement to linear regression, which addresses the issue of multicollinearity. Common practice has shown that the independent variables can be correlated, a condition known as multicollinearity. Ridge regression uses an L2 penalty term to penalize the sum of squared coefficients. Hence, ridge regression can shrink coefficients close to zero, while it still retains those predictors. LASSO, however, can effectively eliminate irrelevant features by performing predictor selection.
Support vector regression (SVR) is a supervised regression technique which aims to find a function that best fits the data and predicts continuous output values given the inputs. The overall purpose is to find a hyperplane that best fits the data and reduces errors. In addition, SVR is known for the use of kernels that can be linear and nonlinear. As the name implies, nonlinear kernels can effectively handle nonlinear relationships between the independent variable(s) and the dependent variable.
A regression tree (RT), also known as decision tree regression, is a supervised machine-learning technique that uses a tree-like structure to predict continuous outcomes. This regression technique splits the data based on yes/no conditions, known as decision nodes. The final tree nodes are known as leaf nodes, and they represent continuous outcomes. Considering this, the decision tree regression is a technique recognized for its interpretability and feature importance evaluation.
Random forest regression (RFR) is an ensemble regression technique that uses the predictive capabilities of multiple decision trees. Specifically, RFR calculates the average of the continuous predictions of a pre-selected number of decision trees. While RT is commonly prone to overfitting, RFR is known for effectively reducing overfitting by combining the capabilities of multiple decision trees. In addition to this, RFR often exhibits better performance than individual decision trees. Similar to RT, RFR provides an evaluation of feature importance. However, RFR lacks the interpretability of RT and is commonly considered a ‘black box’.
XGBoost (extreme gradient boosting) regression is a powerful technique known for its superior performance, speed, and efficiency. Similar to RFR, XGBoost is an ensemble technique, which uses the decisions of multiple decision trees. While each subsequent tree in RFR is built independently, each subsequent XGBoost tree is trained to overcome the errors of the previous trees, an approach known as boosting.
K-Nearest Neighbours (k-NNs) is a non-parametric and lazy-learning technique. Specifically, the technique is non-parametric in the sense that k-NN does not make assumptions about the underlying data distribution. In addition, k-NN only stores the data during training and performs its calculations during the test phase. This regression technique assumes that closer data points (where one data point is a row vector with one value on each of the collective model predictors) are more related to each other in terms of their continuous label (dependent variable value). Therefore, k-NN calculates the distance between a test sample and all training samples. Finally, it assigns the calculated average continuous label to the test sample, based on the continuous label of the k-nearest neighbours.
Neural Networks (NNs) are complex models inspired by the function and structure of the human brain. NNs consist of interconnected units, known as nodes or neurons, which send signals to each other. Commonly, NNs are used for very large datasets as they are often referred to as ‘data-hungry’. NNs are highly uninterpretable models known as ‘black boxes’. While NNs have shown superior performance on very large and complex datasets, they were used in this project to test and evaluate their capabilities with a smaller problem set than usual for NNs.
To produce results that can be meaningfully interpreted to evaluate the TPB (or other theories/models for that matter), we propose the following criteria (C) for modelling techniques.
C1: The model is intrinsically interpretable [56]. The model provides information to evaluate the underlying psychological/behavioural model; meaningful results are provided in terms of how each feature/predictor contributes to explaining variance in the outcome measure (for example, linear positive or linear negative).
C2: Variable selection is performed explicitly by regularization or other means [55].
C3: The model fit equals or exceeds the fit of other models [55].
C4: The fitted model does not or only to a small degree suffer from overfitting; the model fit of test dataset and train dataset is approximately equal [55].
We evaluated these techniques based on the first two theoretical criteria (Table 2). LASSO is known for its feature selection capability, while RT is also known for its interpretability and ability to perform feature selection. Conversely, some of the techniques (e.g., k-NN, NN) are known for their “black box” nature, thus lacking the interpretability capability. Three techniques fully meet the first two criteria: LASSO, RT, and XGBoost. Although the regression techniques and the tree-based techniques are both considered intrinsically interpretable, they differ in their link with existing theory. Specifically, the regression techniques directly map onto the TPB. By contrast, the tree-based techniques represent the relation between outcome (e.g., intention) and predictors (e.g., attitude, subjective norm, and perceived behavioural control) as a series of hierarchical splits on the value of model predictors. The other techniques still have a role to play, in terms of providing potential upper limits of model performance.
The third, empirical, criterion was analyzed based on model results in terms of R2 and MSE, which are two metrics commonly used for regression model evaluation. R2 is the percentage of variance of the dependent variable, which can be explained by the independent variables. More specifically, R2 is normally a value between 0 and 1. Values closer to one suggest higher percentage of the explained variance, which corresponds to a better fit of the model. MSE (Mean Squared Error) calculates the average squared difference between the actual values and the predicted values by the model. Therefore, values closer to zero are desirable as they correspond to smaller errors.
This study is the first to apply machine learning to a dataset of 3530 participants to evaluate their acceptance of LCT within the TPB framework. Nine common supervised machine-learning techniques are deployed, and the two performance evaluation metrics (R2 and MSE) allow for a direct comparison between the predictive capabilities of the selected techniques. Hence, in this study, we wanted to compare and discover the most effective and interpretable machine-learning techniques for predicting the user acceptance of LCT in a novel dataset within the context of TPB. It is difficult, in general, to define good or acceptable values for R2 and MSE. While the values for these metrics differ between fields and datasets, they are expected to be lower for psychological and behavioural studies due to several factors. Human behaviours are complex and can include a significant number of unknown factors that are difficult to fully capture in a model. In addition, many constructs such as intention and attitude are latent variables, which cannot be directly measured. Finally, human behaviour is inherently complex and cannot be easily predicted by a set of variables.
The fourth empirical criterion was also analyzed based on model fit and was considered acceptable if train R2 and test R2 were approximately equal, with a margin of 0.05 difference. Model fit was evaluated three times: on the train set as a whole (80% of the sample), by 10-fold cross-validation on the train dataset (to select optimal hyperparameter values [‘hyperparameter-tuning’], e.g., the penalty parameter to apply to regression coefficients in LASSO), and on the test dataset (20% of the sample). For each analysis, the dataset was split by stratification on the outcome measure and with a random seed for replication.

4.5.2. Hyperparameter Selection in Machine Learning Analysis

To ensure parsimony at a minor loss of model fit [48,55], the final LASSO regression model in each analysis was selected by balancing model fit against parsimony; specifically, we define the final model by the smallest cost parameter lambda value that results in deselecting at least 50% of predictors, subject to the constraint of a 10% loss in model fit at most. For comparability, in RR, the final model was defined by the same cost parameter lambda value as the final LASSO model. For the other six selected analysis techniques with hyperparameters, the final model was the model that maximizes the average cross-validated R2, based on an analysis-specific constellation of hyperparameters (according to the statistical procedures available in the scikit-learn library, https://scikit-learn.org). The constellation of hyperparameters for each of the final models in this Results Section is presented in Supplementary Materials S2.

4.5.3. Implementation of Analysis

Data wrangling used R (Version 4.4.1, with tidyverse and Rstudio Version 2024.04.2) and Python (version 3.12.4, with various Python libraries/Jupyter Notebook). We conducted machine learning analysis with Python (Scikit-learn/Jupyter Notebook). For graphical presentation we used R (ggplot Version 3.5.1 and Rstudio).

5. Results

5.1. Descriptives

5.1.1. Main Components of the Theory of Planned Behaviour

For both approaches to LCT installation and across occupier statuses, adoption intention to change to a low-carbon home was middling (around the middle scale value) (Figure 3). Therefore, increasing intention will be important in the future to boost the adoption of LCTs. By contrast, attitude towards changing to a low-carbon home was positive (substantially above the middle). Subjective norm was slightly negative but close to middling. By contrast, perceived behavioural control was slightly positive but close to middling, in particular for owners and new-build properties.

5.1.2. Willingness to Pay and Willingness to Accept

The PCA results indicated a one-component solution; therefore, a single WTA component score was calculated from the eight log-transformed WTA variables as an average score and used in subsequent analyses. Both WTP and WTA were comparatively high for the new-build implementation of LCTs relative to retrofit (Figure 4).

5.2. Associations of Adoption Intention and Related Outcomes

Per TPB variable, Pearson’s correlations (Table 3) equal to or exceeding a threshold of 0.10 (10% variance overlap) are interpreted here as substantial [54]. The following results are consistent with the TPB. Adoption intention was positively correlated with attitude, subjective norm, and perceived behavioural control. Attitude was positively correlated with positive outcomes of changing to a low-carbon home but not (or negligibly) correlated with negative outcomes. Subjective norm was strongly positively correlated with injunctive norms (for example, from family/friends) and descriptive norms (for example, from other residents). Perceived behavioural control was moderately positively correlated with facilitators, and there were low negative correlations with barriers.

5.3. Model Evaluation

Models were created and evaluated on the data with the nine techniques for machine learning.

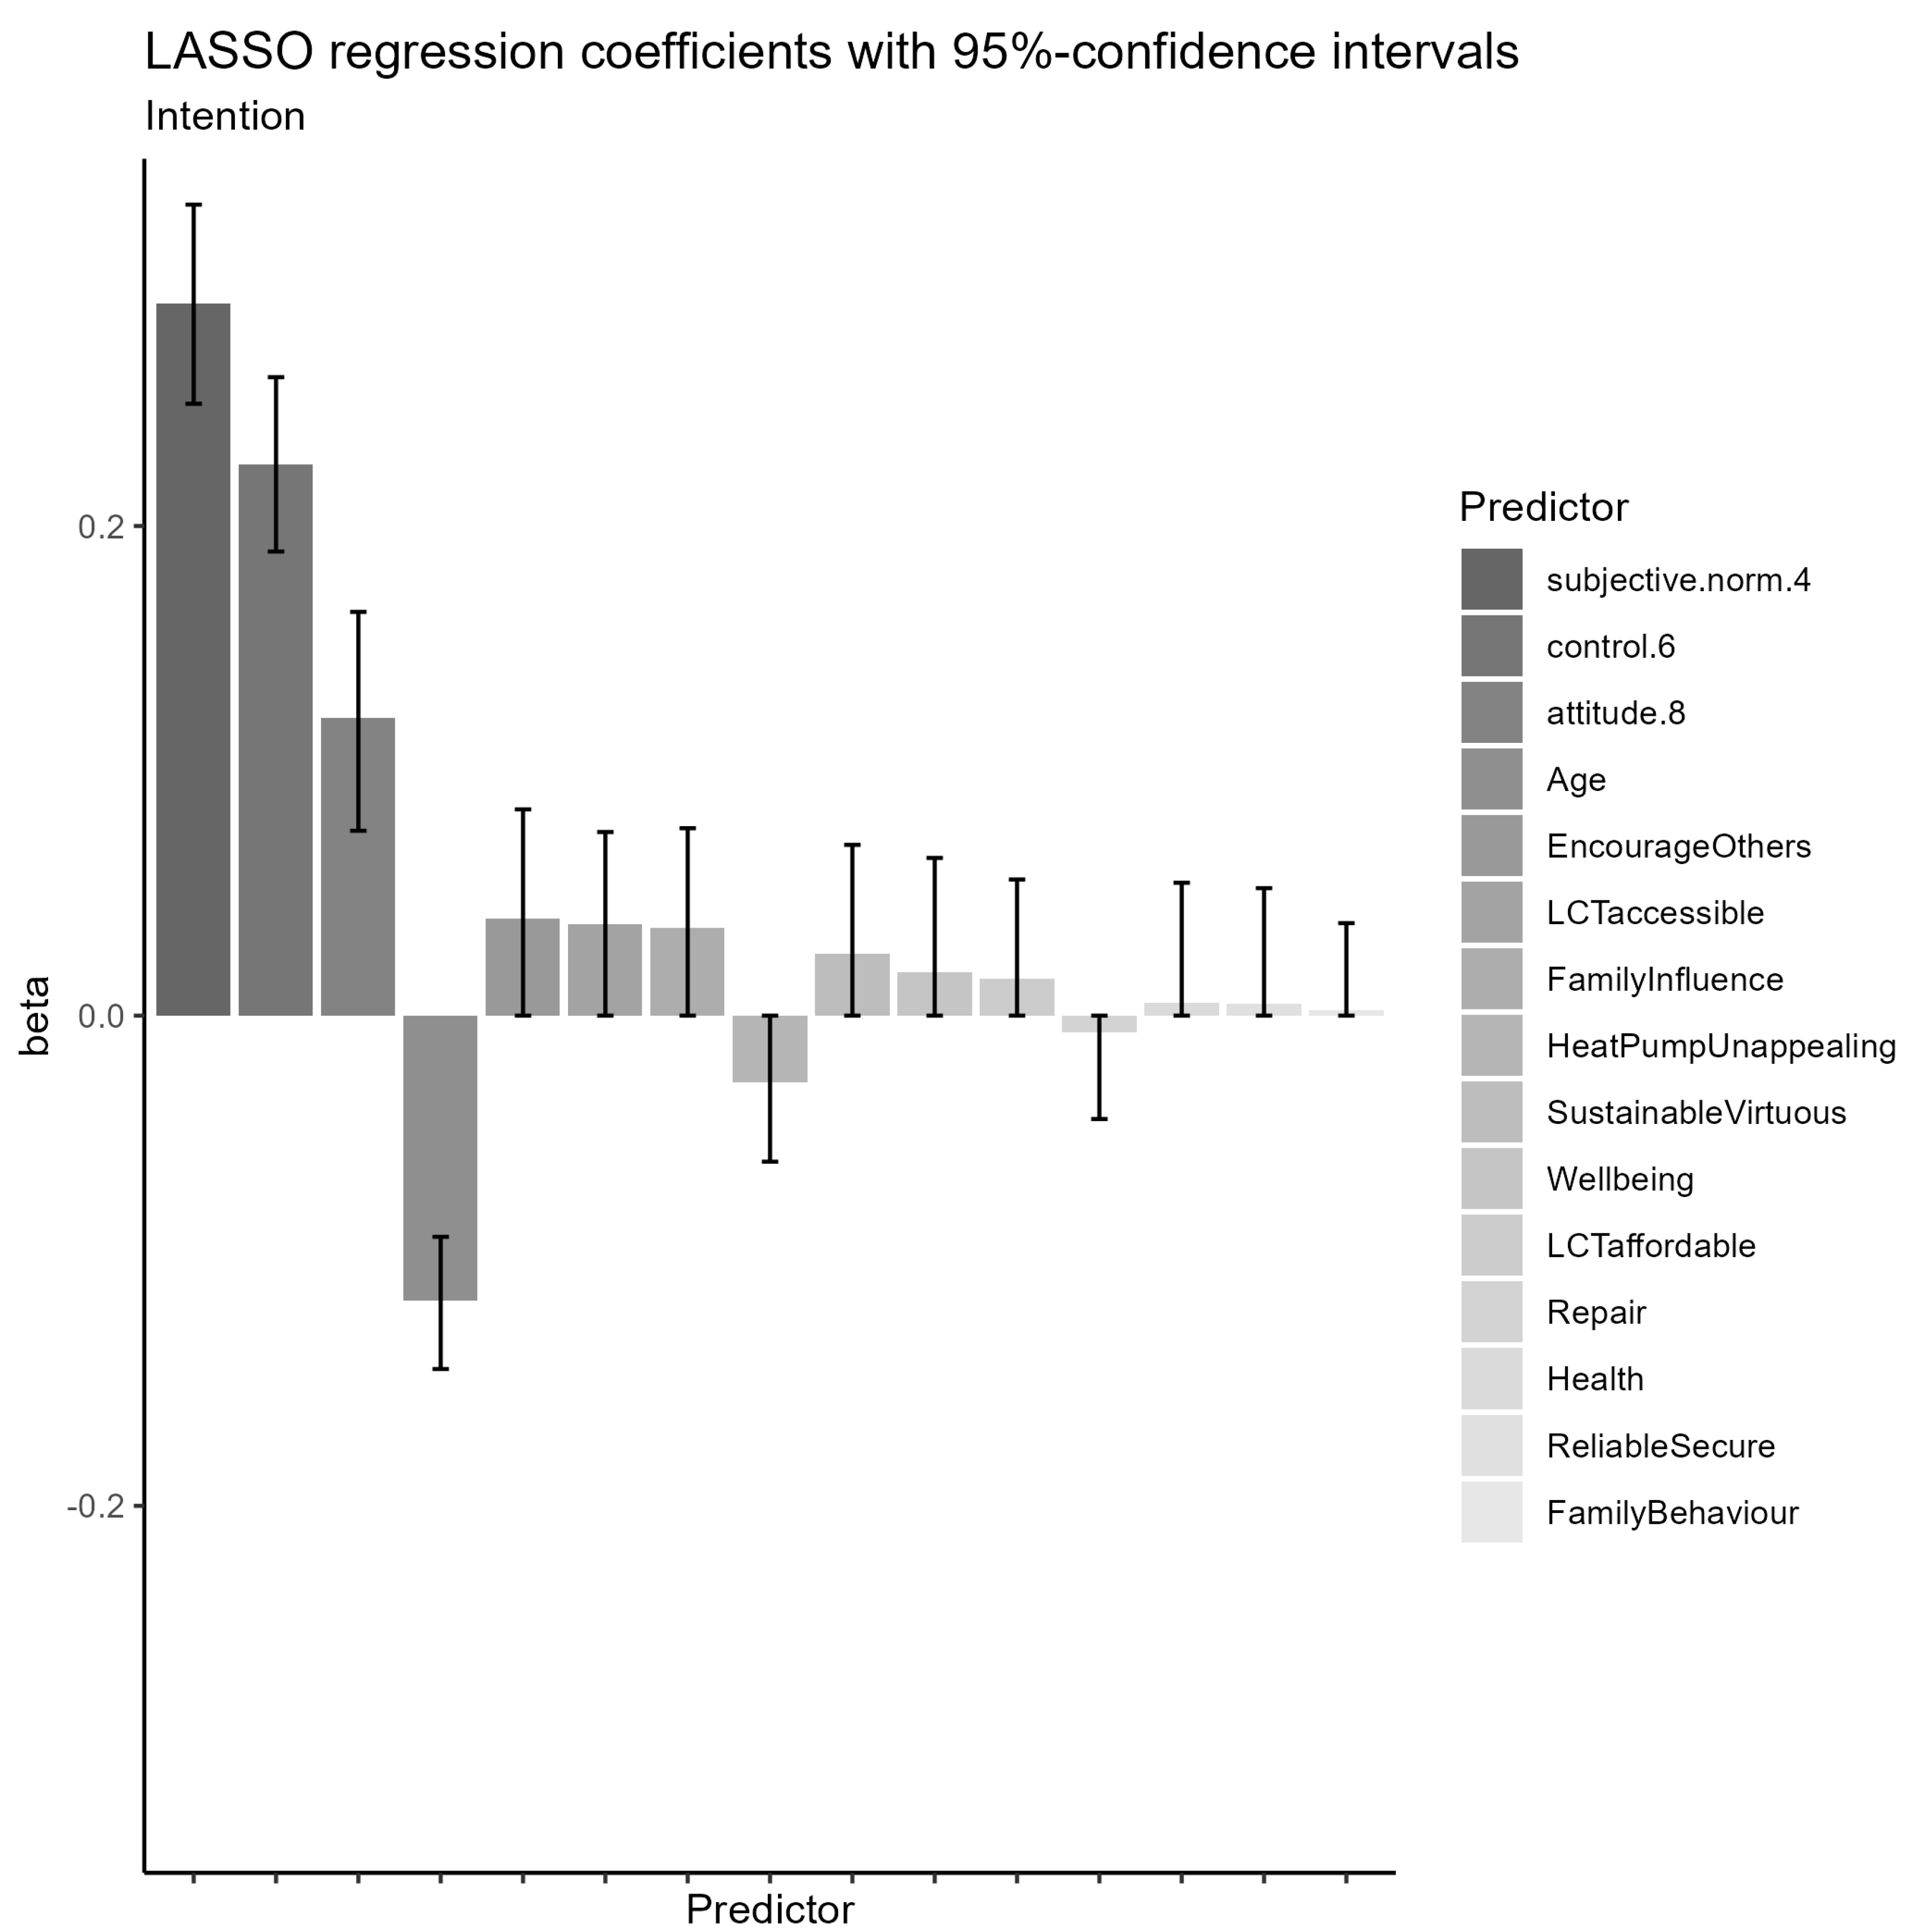
5.3.1. Adoption Intention: Hypotheses 1, 3abc, and 7

The best-performing techniques were LR, RR, LASSO, and SVR (test R2 = 0.56; test MSE = 0.44) (Table 4). Four of the nine techniques (k-NN, RT, RFR and NN) suffered from substantial overfitting. The train MSE and test MSE of XGBoost were higher than those of each of the three LR models. In the LASSO model (cost parameter alpha = 0.02) evaluation, 15 out of 38 predictors were selected; these were further reduced to 4, based on 95%-confidence intervals of the LASSO regression coefficients (Figure 5). Significant positive predictors were attitude towards LCTs, subjective norms, and perceived behavioural control; age was a negative predictor.

5.3.2. Willingness to Pay for/Willingness to Accept a Low-Carbon Technology Home: Hypotheses 3babc, 7

WTA, tenant: The best-performing technique was SVR (test R2 = 0.13; test MSE = 0.87), closely followed by LR, RR, and LASSO (test R2 = 0.11; test MSE = 0.89) (Table 4). Four of the nine techniques (k-NN, RT, RFR, and NN) suffered from substantial overfitting. In the LASSO model (alpha = 0.01) evaluation, 16/37 predictors were selected; these were further reduced to 2 (Figure 6). The installation approach was a significant positive predictor (higher WTA for new build); age was a negative predictor.
WTA, owner: Model fit was poor across the nine techniques. LASSO model fit was R2 = 0.02, MSE = 0.98, both for new build and retrofit. For retrofit, significant LASSO predictors were the number of bedrooms (positive), solar installation, and age (both negative). For WTP, all solutions had a poor model fit.

5.3.3. Attitude Towards Living in a Low-Carbon Home: Hypotheses 4, 7

The best-performing techniques were LR, RR, and LASSO (test R2 = 0.61; test MSE = 0.39) (Table 4). Four of the techniques (k-NN, RT, RFR, and NN) suffered from substantial overfitting. In the LASSO model (alpha = 0.02), 12/25 predictors were selected; these were further reduced to 8 with regression coefficients beyond ±0.01 (Figure 7). Significant positive predictors were a reduction in energy bills, improvement in health, an increase in wellbeing, protection of the environment, the encouragement of others to switch to LCTs, having reliable energy by way of solar panels, feeling virtuous by living more sustainably, and feeling secure from having reliable energy.

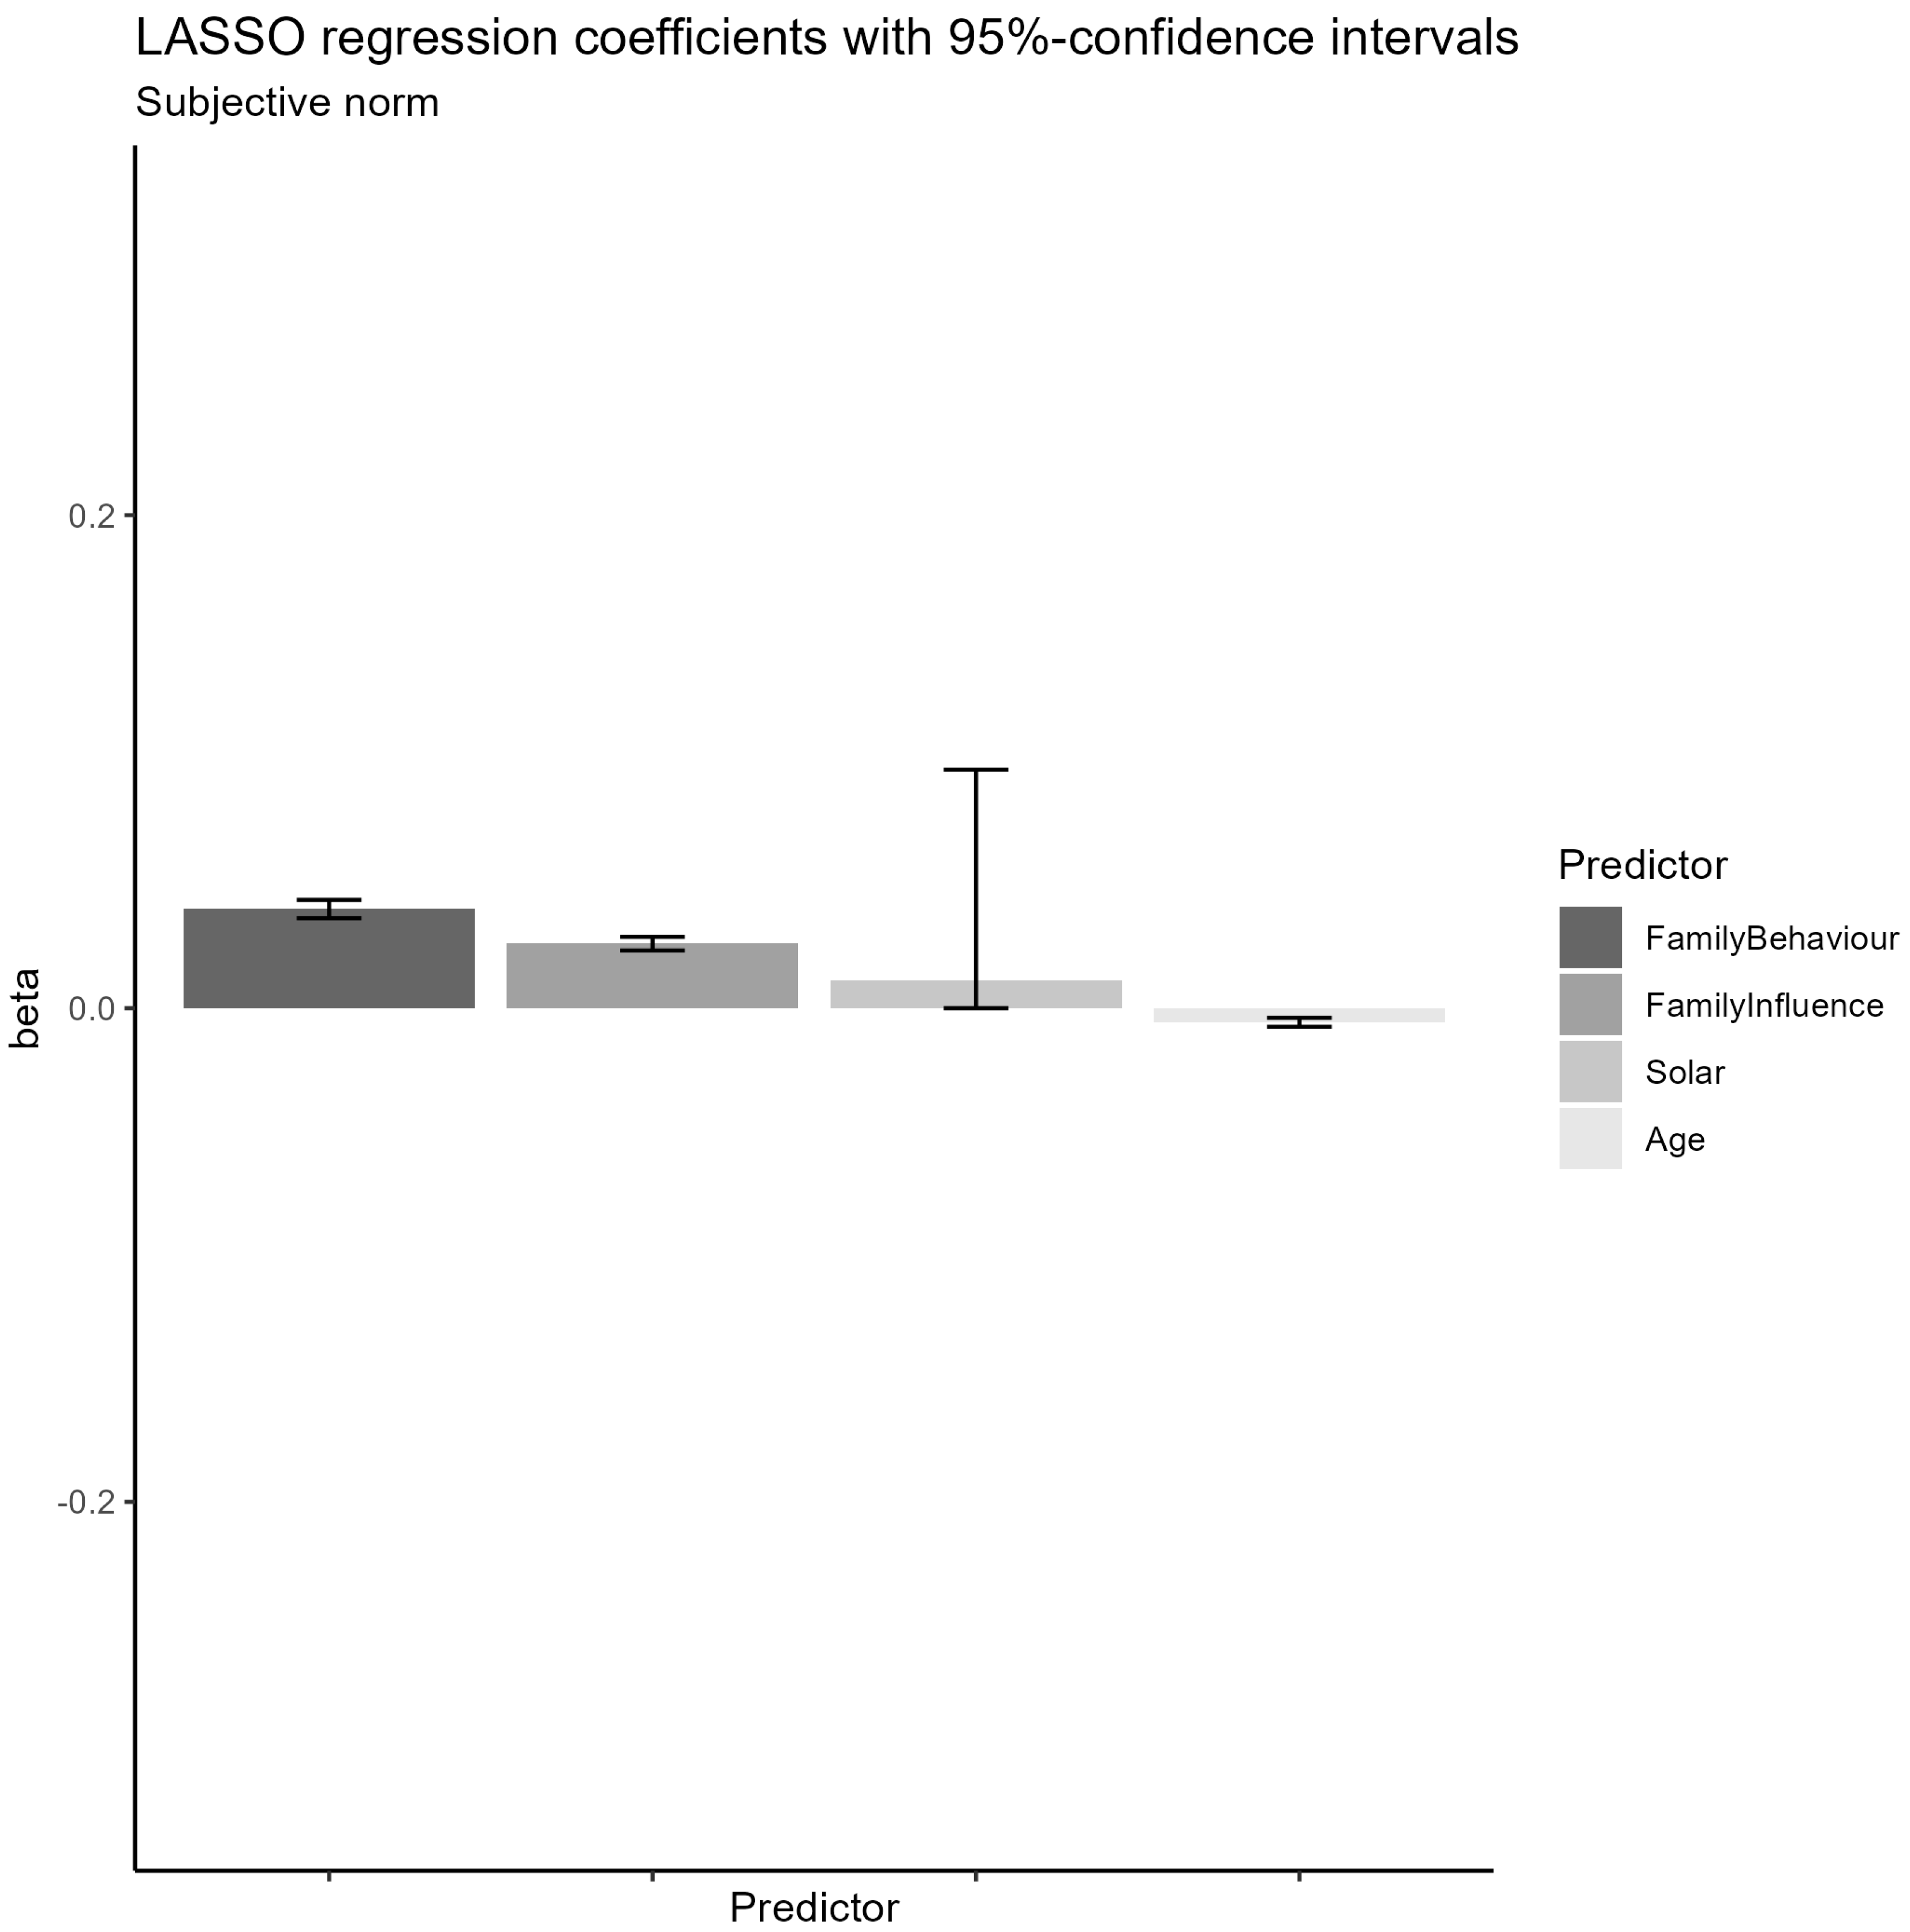
5.3.4. Subjective Norm: Hypotheses 5, 7

The best-performing techniques were NN (test R2 = 0.49; test MSE = 0.51), SVR (R2 = 0.48, MSE = 0.52), LR, RR, and LASSO (test R2 = 0.47, MSE = 0.53) (Table 4). In the LASSO model (alpha = 0.02), 4/16 predictors were selected; these were further reduced to 3 (Figure 8). Significant positive predictors were family influence and family behaviour; age was a negative predictor. In support of these findings, the NN solution and the SVR solution showed that by far the most influential predictors were family behaviour (59% and 51% of the collective predictors’ importance scores, respectively) and family influence (35% and 44%, respectively).

5.3.5. Perceived Behavioural Control: Hypotheses 2, 6, 7

The best-performing techniques were LR, RR, and SVR (test R2 = 0.30; test MSE = 0.70), followed by LASSO (test R2 = 0.27; test MSE = 0.73) (Table 4). In the LASSO model (alpha = 0.04), 11/22 predictors were selected; these were reduced to 8 with regression coefficients beyond ±0.01 (Figure 9). Significant positive predictors were government support, the accessibility of LCTs, the affordability of LCTs, the number of bedrooms, and homeownership. Negative predictors were insufficient space to install LCTs, the possible need to repair LCTs, and age.

5.3.6. Summary of Results

Model fitTable 4 presents the model fit results by machine-learning technique and outcome measure. Generally, the linear regression techniques, in particular LASSO, performed (near-)optimal in terms of R2 model fit, MSE model fit, and the difference between train- and test R2 fit and MSE fit (overfitting). In the analysis of WTA, tenant and subjective norm, SVR performed marginally better than the regression models in terms of the two fit measures and the two fit differences. Therefore, the fit measures and fit differences were consistent in terms of the best modelling results across the techniques.
LASSO regression results: The main results of the model predictors from the LASSO regression models are presented in Table 5. The strongest model predictors (regression coefficient beyond ±0.10) were subjective norm, perceived behavioural control, attitude and age for adoption intention, age, and installation approach for WTA/tenant, solar installation and bedrooms for WTA/owner/retrofit, and occupier status for perceived behavioural control.

6. Discussion

This research contributes new knowledge of the acceptance of LCTs according to the TPB and of the value of machine-learning techniques for modelling this acceptance. We discuss our findings accordingly in the next two sections. Finally, we present strengths and limitations of our work, as well as future research.

6.1. The Acceptance of Low-Carbon Technologies

The first objective of this research was to develop an understanding of the acceptance of LCTs according to the TPB, with consideration of the approach to LCT installation (new build versus retrofit) and occupier status (owner-occupier versus tenant). Our results confirm subjective norm [23], perceived behavioural control [23], and attitude [10] as the main predictors of adoption intention, attitude less so potentially because of the attitude–intention gap [57].

6.1.1. Evaluation of Hypotheses

Overall, the LASSO regression models performed best in terms of predictor selection and (near-)optimal model fit in terms of R2 and MSE. The following evaluation of the hypotheses is therefore based on the LASSO results.
Hypothesis 1a/b/c: Acceptance (adoption intention, WTA, WTP) is higher for new build than for retrofit. The approach to LCT installation was a significant predictor of WTA in tenants, with a higher intention for new-build installation. This may be due to a focus on domestic disruption during installation and the discounting of long-term benefits [43]. Previous research supports this, indicating that disruption can reduce acceptance [40]. Future research could verify this link by presenting scenarios of LCTs in new-build and retrofit properties to manipulate the potential extent of disruption and observe the effect on WTA and other intention measures. The effect of the installation approach on other acceptance measures (intention to adopt and WTP) was not significant. This may be because WTP was a single measure of willingness to pay for the full domestic LCT solution and may have been too general to reflect differences in willingness. By contrast, the WTA measure was constructed from eight elements of the solution and required participants to consider each element in turn.
Hypothesis 2: Perceived behavioural control is higher for owner-occupiers than for tenants. Occupier status/homeownership was a significant positive predictor of perceived behavioural control in relation to LCTs. Homeowners have more control over their home environment than tenants, and this is reflected in their higher perceived behavioural control [10]. Homeowners can decide whether to install LCTs in their home but may be constrained by finances. Our results show that both homeownership and the number of bedrooms (as an indicator of wealth) predict perceived behavioural control. This has implications for the actual adoption of LCTs, as occupier status predicts perceived behavioural control, which in turn predicts adoption intention and subsequent actual adoption [10]. Adoption would be greater in more affluent occupants and those higher in perceived behavioural control.
Hypotheses 3a: Attitude, subjective norm, and perceived behavioural control predict adoption intention. Our results show that attitude, subjective norm, and perceived behavioural control positively predicted adoption intention to adopt LCTs. Previous research supports this, showing that these factors explain a significant portion of the variance in participants’ intention to monitor energy usage and adopt LCTs [24,58,59,60]. Subjective norm and perceived behavioural control were relatively strong predictors than attitude. This suggests that interventions focusing on subjective norm and perceived behavioural control could be more effective in increasing adoption intention than those focusing on attitude. Additionally, mean attitude was already high relative to subjective norm and perceived behavioural control, providing less scope to further increase adoption intention.
Hypotheses 3b: Attitude, subjective norm, and perceived behavioural control predict WTP. Our findings show that attitude, subjective norm, and perceived behavioural control were not positive predictors of WTP. Using a single measure of WTP may have contributed to this result. Previous studies that found support for these hypotheses used multiple Likert scale items [35] or single items for a time-limited monthly additional payment or a one-off donation for single benefits [61]. Therefore, using multiple WTP measures or single measures to capture WTP for relatively simple benefits may provide better measurement in relation to TPB predictors.
Hypothesis 3c.1/3c.2/3c.3: Attitude, subjective norm, and perceived behavioural control predict WTA. Attitude, subjective norm, and perceived behavioural control were not predictors of WTA. Compared to the current study, previous studies used relatively simple benefits [62,63], which may facilitate the mapping of attitude and perceived behavioural control onto WTA. In these studies, attitude, subjective norms, and perceived behavioural control were predictors of WTA.
Hypothesis 4: Behavioural beliefs predict attitude. Beliefs regarding several outcomes (bills reduced, health improved, wellbeing improved, environment improved, encourage others, reliable energy, sustainable virtuous, and reliable secure) predicted attitude towards LCTs. A striking finding here is that these were all beneficial rather than disadvantageous outcomes. This result suggests a mechanism similar to Herzberg’s model of job satisfaction [64] and Hassenzahl’s user experience (UX) model [65]. In both models and in our results, favourable outcomes lead to a positive evaluation (attitude), but the absence of unfavourable outcomes does not. Therefore, although it is important to address/mitigate potential negative outcomes of the implementation of LCTs, this will merely dissipate negative attitudes but not necessarily create a positive attitude. To achieve a positive attitude, it will be necessary to implement positive outcomes and ensure that potential users’ beliefs reflect these.
Hypothesis 5: Normative beliefs predict subjective norms. Both family influence and family behaviour predicted the subjective norm. Previous research also suggests that family [66] or close family and wider family [67] can be major contributors to variation in subjective norms.
Hypothesis 6: Control beliefs predict perceived behavioural control. Consistent with the TPB [10], various control beliefs predicted behavioural control. Positive predictors were the government support, accessibility, and affordability of LCTs; negative predictors were having insufficient space to live in the home after LCT installation and difficulty in arranging possibly necessary repair after installation.
Hypothesis 7.1/7.2/7.3/7.4/7.5/7.6: Demographic factors predict adoption intention, WTP, WTA, attitude, subjective norm, and perceived behavioural control. Age was the most consistent negative predictor of several outcomes: intention to adopt, WTA/tenant, WTA/owner/retrofit, subjective norm, and perceived behavioural control. These results are consistent with the findings of our previous interview study [53,68], where older people living in social housing expressed concern over the financial and non-financial costs of adopting LCTs, and the older population was less likely to experience the benefits than younger people. Furthermore, the number of bedrooms was a positive predictor of perceived behavioural control and retrofit owners’ WTA. Owners who lived in (larger) properties with three or more bedrooms (than tenants) were more likely to experience more behavioural control and willing to pay more. Collectively, the results on occupier status and property size (bedrooms) suggest that those who were more affluent experienced perceived behavioural control to a larger extent. In the retrofit scenario, the existing installation of LCTs (solar) was a negative predictor of WTA in occupier-owners in the retrofit scenario. Given their experience with solar, their estimation may be more realistic than occupier-owners without this experience.

6.1.2. Recommendations and Implications for Policy

Intention towards the uptake of LCTs, including heat pumps, is contextualized by a complex mix of policy drivers, barriers, and behavioural dimensions. The UK government has introduced several financial incentives to encourage LCT adoption, and, under the previous Conservative administration, the Government’s Heat and Buildings Strategy set ambitious targets—aiming for at least 600,000 heat pump installations per year by 2028 [69]. This target is supported by policy initiatives under the Warm Homes Plan such as the Boiler Upgrade Scheme—a grant programme designed to cover the cost of installation for domestic users. Additionally, there are tax reliefs and export finance options available to support businesses in the development of domestic LCTs including the heat pump market. Regulatory support has also been strengthened, with recent changes making it easier to install LCTs by removing certain planning restrictions (e.g., removing requirements for heat pumps to be at least 1 m from a neighbour’s property). Efforts to raise awareness about the benefits of LCTs and their role in reducing carbon emissions are ongoing, with purported action by the UK government to draw up a public engagement strategy on low-carbon technologies for consumers [70]. However, there remains low overall public awareness of available financial support and challenges related to socioeconomic inequality. Consequently, affluent households are more likely to take advantage of existing financial subsidies and thus benefit from the early adoption of LCTs, whilst lower-income, disadvantaged households remain inadequately supported [71].
Under conditions of low awareness by consumers and hesitancy to adopt domestic LCTs, it is important, therefore, to increase social influence and perceived behavioural control. In our empirical findings, we note that intention was middling; social influence was middling/low, and perceived behavioural control was middling/high. Efforts to enhance social influence through family members’ expectations and behaviour may be challenging, as motivation to comply and identification were low or middling. Policy initiatives focusing upon user adoption emphasize injunctive norms or descriptive norms (LCT adoption by significant others who are not family members) may provide more scope to increase social influence. These could target trusted members of geographically local or social media community networks or national celebrities. This is relevant, therefore, to the design of government-backed public information campaigning designed to increase overall public awareness of LCT subsidy initiatives such as the Boiler Upgrade Scheme (which currently offers £7500 towards air or ground-source heat pump installation). Public-information campaigns will be specifically relevant to social-housing residents, lower-income householders, and renters who are eligible to receive funded energy efficiency upgrades—including insulation and low-carbon heating systems through the Warm Homes: Social Housing Fund and Warm Homes: Local Grant, respectively [72]. In addition, clean technologies can be made visible to convey a social norm by appropriate labelling or social media sharing [73].
Perceived behavioural control may be enhanced by emphasizing influential drivers on LCT acceptance, including government support for installing LCTs, the accessibility and affordability of LCTs, and solutions to combat influential barriers, such as insufficient space for installation, and ensuring a sufficient supply of LCT-related maintenance and repair skills, labour, and parts. As a matter of energy justice in policy actions towards the uptake of domestic LCTs [53], engaging less affluent people appropriately and emphasizing positive outcomes (such as reduced energy bills, improved health, and environmental benefit) can also enhance perceived behavioural control. Given the limitations of using attitude and subjective norm to increase adoption intention, enhancing perceived behavioural control may be especially useful to increase adoption intention of domestic LCTs.
Another way to boost acceptance by using perceived behavioural control will be to remove friction (hassle) in the decision to install LCTs [71]. For example, new builds that have LCTs installed by default will contribute to the acceptance. In 2025 and beyond, the UK’s Future Homes Standard (FHS) comes into effect. The FHS aims to ensure that new homes built from 2025 produce 75–80% fewer carbon emissions than current standards. This will be achieved through both the use of LCTs, including heating systems, such as heat pumps, and more energy-efficient building fabric, including improved insulation and triple glazing. The installation of LCTs, including heat pumps in new-build properties, is regulated by planning permission and building regulations. Generally, LCT installations are considered ‘permitted development’ under Class G of the General Permitted Development Order (GDPO) in England. This means that they can be installed without specific planning permission, provided that certain conditions are met. For example, heat pumps must comply with the Microgeneration Certification Scheme Planning Standards (MCS 020 or equivalent) [71]. These policy measures are therefore consonant with a strategy to remove friction for homeowners, landlords, and first-time buyers, though there are no equivalent requirements for older properties to meet the same standards. This is important because we find a lower WTA for the retrofit of existing properties than for new build properties. Stronger government effort, therefore, needs to be targeted towards increasing the acceptance of retrofit LCT installation in older buildings if national net-zero targets are to be achieved.
Adoption intention, WTA, subjective norm, and perceived behavioural control may be further enhanced through the demographic focus of communication, for example, by appropriately targeting older tenants who experience energy vulnerability. Notably, information could be directly targeted towards those who are eligible for the Winter Fuel Payment (i.e., those born on or before 22 September 1958 and who receive Pension Credit, Universal Credit, Income Support, income-based Jobseeker’s Allowance, or income-related Employment and Support Allowance). Alternatively, focus could also be towards younger people by providing information on LCT subsidy, as well as installation and adoption schemes integrated into existing home-buying schemes for first-time property owners including the First Homes scheme, the Mortgage Guarantee Scheme, the Lifetime ISA, Shared Ownership Scheme, or the Right to Buy. Younger people are shown in this study to be more receptive to LCT adoption and will also benefit from low-carbon energy technology use over most of their lifetime. Introducing targeted information to specific younger and older user groups (who are both more likely to experience energy-related poverty) would serve to simultaneously alleviate domestic energy insecurity and improve technology uptake. In addition to targeted information campaigns to specific user groups, the government can play a role in regulatory development—specifying the broader conditions for LCT implementation and thus facilitating favourable outcomes that further boost acceptance. For example, LCT design requirements may be specified to ensure that LCTs, when installed, contribute to health improvement by reducing risks associated with indoor air pollution from particulate matter, carbon-monoxide poisoning, and cold-related ill health [74].
Other contextual factors that are relevant to acceptance include material barriers to LCT acceptance. For example, in our research, an influential barrier was the need for LCT repair. Government must ensure that sufficient manufacturing capacity and appropriate product standards are in place to ensure good-quality LCT provision within the market, as well as ensuring sufficient availability of contractors for installation, advice, and repair [75]. This is particularly important for newer technologies with which there is a paucity of experienced labour (e.g., heat pumps). Part of the solution will be to ensure that enough trained workers are available to install LCTs correctly and, if necessary, repair installed LCTs and replace damaged or obsolete systems. Recent research [75] shows that plumbers are willing to take part in LCT training, but upskilling programmes need to be designed and communicated appropriately to ensure that appropriately trained workers can meet market demand. Skilled labour supply is a part of the current Labour Government’s twin missions to ‘Make Britain a Clean Energy Super Power’ and to ‘Break Down Barriers to Opportunity’ through an emphasis on skill development, education, and training access across the sector.

6.2. Evaluation of the Use of Machine Learning

Model fit: A major advance of the use of machine learning in this study was that in all analyses it exposed analysis techniques that produced a test model fit (in terms of R2 and MSE) that was substantially worse than the train model fit, in other words, marked overfitting; this occurred despite our very large train and test samples by the standard of behavioural research. Apart from the linear regression techniques, all the other techniques suffered from overfitting to various degrees, most notably RT and RFR, but also k-NN, SVR, and NN. A conclusion from this research is that linear regression techniques performed relatively well in terms of model fit without substantial overfitting.
LASSO performed the best among all nine regressors in terms of predictor selection, (near-)optimal model fit, and the difference between train and test R2 fit and MSE fit (overfitting). The technique is successful in shrinking irrelevant features to zero, thus performing feature selection. This way, less important and less relevant features are excluded from the analysis. Thus, LASSO supports parsimony and interpretability by substantially reducing the predictor set [48]. It also directly maps onto the TPB and our LCT adoption model in terms of linear relationships between predictors and outcomes. This direct mapping is a possible reason for the superiority of LASSO. The linear regression and ridge regression models also showed good performance, but they lacked the ability to ignore irrelevant features.
Tree-based models such as RT, RFR, and XGBoost consistently showed poorer results than the aforementioned three models. XGBoost performed better than the other two tree-based models, but its performance was still behind LASSO. The tree-based models may be less appropriate for modelling and explaining complex psychological and behavioural patterns.
SVR performed marginally better than the three linear-regression models in terms of model fit for two outcomes, but suffers from a lack of interpretability and predictor selection. Similar to k-NN, SVR does not perform feature selection, which can limit its interpretability.
k-NN was a poor fit for this dataset, commonly suffering from overfitting. In addition to this, k-NN usually treats all features equally and lacks the ability of LASSO to perform feature selection.
NN is a state-of-the-art technique for numerous real-world problems, but the NNs in this research did not capture the relationships in this dataset well, apart from relatively good performance on subjective norm. We attribute this poor performance to the smaller size of the current dataset (for NN) and NNs’ complex nature.
Parsimony and interpretability: LASSO regression was effective in reducing the predictors of each of the main TPB factors, thereby creating parsimonious model results [48]. In this study, a major finding was LASSO’s high performance in terms of R2 and MSE as well as its ability to offer an interpretability mechanism through feature selection. The feature selection capability of LASSO allows the demonstration of significant predictors/features across the five outcomes that were used (Figure 5, Figure 6, Figure 7, Figure 8 and Figure 9). More specifically, feature selection revealed that TPB concepts such as attitude, subjective norm, and perceived behavioural control were retained as strong predictors of adoption intention. In addition to this, LASSO highlighted the importance of additional factors such as age, installation approach, and occupier status, which were identified as meaningful extensions to the TPB. By identifying the major predictors for acceptance of LCTs, our work presents theoretical insights that enhance the understanding of the TPB in this specific context.
A novel aspect of our application of LASSO was the bootstrapping of LASSO regression coefficients; the initially reduced predictor set of the LASSO solution was further reduced by selecting predictors having a confidence interval that did not include zero. This was not only effective in the analysis of adoption intention, WTA, and subjective norm but also attitude and perceived behavioural control. As the tree-based techniques produced solutions with poorer fit than the regression techniques, the former’s results were not interpreted. However, tree-based algorithms are intrinsically interpretable [56] and can provide information to evaluate underlying psychological/behavioural models [49]; for example, meaningful results are provided in terms of how each feature/predictor contributes to explaining variance in the outcome measure. However, tree-based solutions take the form of a hierarchical series of decisions that do not necessarily map onto models such as the TPB. Rather, these solutions form a potential starting point for revising existing theories and developing new theories.

6.3. Strengths, Limitations, and Future Research

A strength of the current study was the use of alternative measures of acceptance rather than relying on a single measure to demonstrate the hypothesized effects. Specifically, the TPB measure was sensitive to the influence of attitude, subjective norm, and perceived behavioural control, as per TPB. The WTA measure provided evidence for the hypothesized effect of the approach to LCT installation. Future research should consider using multiple measures to capture different aspects of acceptance as well as its determinants and consequences.
Another strength of our research is the use of machine learning for validation and predictor selection. Based on the results of this study, the use of LASSO regression is recommended in future research to validate model estimates and reduce predictor sets. Although tree-based techniques were not superior to regression techniques in this study, the exploration of tree-based techniques in future research is also recommended to potentially identify new parsimonious models of LCT acceptance and technology acceptance more widely. In particular, XGBoost should be considered, as it was vastly less susceptible to overfitting than RT and RFR and has shown superiority in research [76] and machine learning competitions [77].
Specific information about barriers, facilitators, advantages, and disadvantages would have allowed participants to develop a better understanding of how the implementation of domestic LCTs would change their home and their lives. Instead, our participants were provided with information about the typical installation of domestic LCTs and typical benefits rather than installation details and benefits that would apply specifically to them. To derive the specific information for each participant’s household, further information would be needed, including each respondent’s household type and layout, energy consumption values, home energy efficiency, and energy use characteristics. This information could then be used to estimate the cost of LCTs such as solar panels, batteries, heat pumps, water tanks, and insulation as well as their lifespan. By including this specific information, future studies could allow participants to better understand the strengths and limitations of domestic LCT solutions that would specifically apply to their home. Therefore, these studies could make better estimates of model coefficients and better predict acceptance. Additionally, it will be important to measure the WTP and WTA of specific LCTs within an LCT solution and compare these with the actual costs. The results will provide insight into the extent to which the pricing of specific LCTs contributes to acceptance and whether (the extent of existing) subsidies could increase or decrease acceptance.
In terms of interpretation, our approach presents an advance over meta-analysis that mixes disparate models that exclude certain TPB variables [23]. Moreover, in our work (but not necessarily in meta-analysis with excluded TPB variables), the power of predictors is estimated in the context of other model predictors.
The current research studied adoption intention rather than the actual adoption of domestic LCTs, as we wanted to study intention in residents who had not yet committed to adoption. However, there is value in longitudinal research to establish how the adoption process develops. The adoption of technology, in general, and domestic LCT, in particular, is not necessarily a single decision but may proceed in stages, and interventions will be more effective if they are based on validated staged adoption models. We draw on health psychology [78] and the information systems literature [79] in our recommendation for research using staged models relevant to LCT adoption. A main characteristic of the behaviours that are typically studied in stage theory research is that they are recurrent. For example, good cybersecurity behaviours such as vigilance in response to phishing emails need to be performed repeatedly and may suffer from relapses. The adoption of domestic LCTs could be construed as either a one-off decision or a series of decisions about the adoption of different LCTs (for example, first solar PV panels and later an air-source heat pump powered by solar). Decision points about technology uptake will be influenced by cost, financial availability, and incentive structures such as subsidies or favourable loans. Nevertheless, the process up to the decision may be modelled as proceeding in stages. Moreover, even if technology purchase is a one-off event, the continuous monitoring of energy performance and/or changes to energy-related social practices (such as washing clothes at times when the sun is shining, in the case of solar generation, or changing furniture positioning or clothing to maximize thermal comfort with a new heat pump) require sustained and repeated behaviours and thus can be understood as stages.
Through quota sampling, we aimed for an equal distribution of participants by gender and age. Nevertheless, our sample was over 60% female, and ages over 54 were less frequent. Moreover, given our large sample, 1449 male participants and 381 participants over 54 were included. Therefore, the two major genders were substantially represented, the dominant age ranges 18–54 were relatively equally represented, and older ages were less, but still meaningfully, represented. Sampling was not stratified, and, therefore, the sample is not fully demographically representative of the UK, as explained above. Therefore, the results are more applicable to a predominantly female and younger population.

7. Conclusions

This research provides evidence for attitude, subjective norm, and perceived behavioural control as predictors in the context of domestic LCT acceptance by homeowners and tenants in new-build and retrofit scenarios. Further predictors were the approach to LCT installation (new build or retrofit) of WTA, occupier status (homeowner or tenant) of perceived behavioural control and the age of adoption intention, WTA, subjective norm, and perceived behavioural control. These results indicate that, in addition to established TPB constructs (attitude, subjective norm, and perceived behavioural control), installation approach, occupier status, and age also need to be considered in efforts to boost LCT acceptance.
Our research can inform UK government standards (the Future Homes Standard, building regulations, and installation regulations), targeted subsidy programmes (such as the Boiler Upgrade Scheme), and public information campaigns on the availability of LCTs, prices, installation challenges, and subsidies, targeted for specific demographic groups (those eligible, e.g., for winter fuel payments, or first-time home buyer schemes). Our results also provide support for stronger government efforts to be targeted towards increasing the acceptance of retrofit LCT installation in older buildings if national net zero targets are to be achieved.
Machine-learning techniques are important tools for improving and evaluating models of LCT acceptance. The use of these tools in behavioural energy transition research and other domains holds great promise to increase our understanding of technology acceptance. Overall, LASSO regression was the best technique in terms of predictor selection, (near-)optimal model fit, and difference in fit between train data model and test data model, and it should be considered for use in this area of research and other behavioural research with the aim of model parsimony.
However, the findings have wider relevance and significance to other stakeholders. Given the current economic climate and the challenges of cost, planning, community, and environment that are associated with new build, as well as new government priorities, it is likely that retrofitting will be deployed more in the coming years and particularly for social housing than may have been anticipated when we carried out this work. Therefore, the need for evidence-based insights on how to help residents adopt and adapt to green technology in the home is essential for sustainability.

Supplementary Materials

The following supporting information can be downloaded at https://www.mdpi.com/article/10.3390/su17156668/s1, Supplementary Materials S1: Online survey versions: New build and retrofit; Supplementary Materials S2: Hyperparameter constellations for nine statistical-learning techniques.

Author Contributions

Conceptualization, P.v.S.; methodology, P.v.S.; software, E.I.; validation, P.v.S.; formal analysis, P.v.S. and Y.K.; investigation, P.v.S.; resources, M.K. and E.I.; data curation, P.v.S.; writing—original draft preparation, P.v.S. and H.C.; writing—review and editing, P.v.S., H.C., Y.K., E.I., M.K., M.C. and N.V.; visualization, P.v.S. and E.I.; supervision, N.V., P.v.S. and M.C.; project administration, N.V., P.v.S. and M.C.; funding acquisition, N.V., P.v.S. and M.C. All authors have read and agreed to the published version of the manuscript.

Funding

Towards a Greener Tees Valley—A Community Renewal Fund learning project supported by UK Government and Tees Valley Combined Authority. The APC was waived.

Institutional Review Board Statement

This study was conducted in accordance with the Declaration of Helsinki and approved by the Institutional Ethics Committee of Teesside University. Protocol code 7635 Cotton, dated January 2022.

Informed Consent Statement

Informed consent was obtained from all subjects involved in this study.

Data Availability Statement

Dataset and variable-coding are both available as Supplementary Information.

Acknowledgments

The authors are grateful to Wes McGeeney for technical advice on LCTs.

Conflicts of Interest

The authors declare no conflicts of interest.

Abbreviations

The following abbreviations are used in this manuscript:
LCTLow-carbon technology
TPBTheory of Planned Behaviour
WTAWillingness to accept
WTPWillingness to pay

References

  1. International Energy Agency (IEA). 2019 Global Status Report for Buildings and Construction: Towards a Zero-Emissions, Efficient and Resilient Buildings and Construction Sector; International Energy Agency (IEA): Paris, France, 2019; Available online: https://iea.blob.core.windows.net/assets/3da9daf9-ef75-4a37-b3da-a09224e299dc/2019_Global_Status_Report_for_Buildings_and_Construction.pdf (accessed on 15 July 2025).
  2. Belussi, L.; Barozzi, B.; Bellazzi, A.; Danza, L.; Devitofrancesco, A.; Fanciulli, C.; Ghellere, M.; Guazzi, G.; Meroni, I.; Salamone, F.; et al. A review of performance of zero energy buildings and energy efficiency solutions. J. Build. Eng. 2019, 25, 100772. [Google Scholar] [CrossRef]
  3. Gaur, A.S.; Fitiwi, D.Z.; Curtis, J. Heat pumps and our low-carbon future: A comprehensive review. Energy Res. Soc. Sci. 2021, 71, 101764. [Google Scholar] [CrossRef]
  4. Zhong, X.; Hu, M.; Deetman, S.; Steubing, B.; Lin, H.X.; Hernandez, G.A.; Harpprecht, C.; Zhang, C.; Tukker, A.; Behrens, P. Global greenhouse gas emissions from residential and commercial building materials and mitigation strategies to 2060. Nat. Commun. 2021, 12, 6126. [Google Scholar] [CrossRef] [PubMed]
  5. Metta, J.; An, Y.; Zheng, H.; Zhang, L. Potentials and opportunities towards the low carbon technologies—From literature review to new classification. Crit. Rev. Environ. Sci. Technol. 2020, 50, 1013–1042. [Google Scholar] [CrossRef]
  6. Lobus, N.V.; Knyazeva, M.A.; Popova, A.F.; Kulikovskiy, M.S. Carbon footprint reduction and climate change mitigation: A review of the approaches, technologies, and implementation challenges. C 2023, 9, 120. [Google Scholar] [CrossRef]
  7. Gouldson, A.; Sudmant, A.; Khreis, H.; Papargyropoulou, E. The Economic and Social Benefits of Low-Carbon Cities: A Systematic Review of the Evidence. Coalition for Urban Transitions. London and Washington, DC. 2018. Available online: http://newclimateeconomy.net/content/cities-working-papers (accessed on 15 July 2025).
  8. Kennedy, M.; Basu, B. Overcoming barriers to low carbon technology transfer and deployment: An exploration of the impact of projects in developing and emerging economies. Renew. Sustain. Energy Rev. 2013, 26, 685–693. [Google Scholar] [CrossRef]
  9. Technical Summary. In Climate Change 2022—Mitigation of Climate Change: Working Group III Contribution to the Sixth Assessment Report of the Intergovernmental Panel on Climate Change; Intergovernmental Panel on Climate Change (IPCC), Ed.; Cambridge University Press: Cambridge, UK, 2023; pp. 51–148. ISBN 978-1-00-915792-6. Available online: https://www.cambridge.org/core/product/5B255A3E29E6976F492038261E811206 (accessed on 15 July 2025).
  10. Ajzen, I. The Theory of planned behavior. Organ. Behav. Hum. Decis. Process. 1991, 50, 179–211. [Google Scholar] [CrossRef]
  11. Stuhm, P.; Baumann, M.J.; Weil, M. Approaching social acceptance of energy technologies: Ten European papers showcasing statistical analyses–a targeted review. Energy Sustain. Soc. 2025, 15, 17. [Google Scholar] [CrossRef]
  12. Ding, Z.; Jiang, X.; Liu, Z.; Long, R.; Xu, Z.; Cao, Q. Factors affecting low-carbon consumption behavior of urban residents: A comprehensive review. Resour. Conserv. Recycl. 2018, 132, 3–15. [Google Scholar] [CrossRef]
  13. Wang, T.; Shen, B.; Han Springer, C.; Hou, J. What prevents us from taking low-carbon actions? A comprehensive review of influencing factors affecting low-carbon behaviors. Energy Res. Soc. Sci. 2021, 71, 101844. [Google Scholar] [CrossRef]
  14. Vicente, P.; Marques, C.; Reis, E. Willingness to pay for environmental quality: The effects of pro-environmental behavior, perceived behavior control, environmental activism, and educational level. Sage Open 2021, 11, 21582440211025256. [Google Scholar] [CrossRef]
  15. Schwartz, S.H. Normative Influences on Altruism1. Adv. Exp. Soc. Psychol. 1977, 10, 221–279. [Google Scholar] [CrossRef]
  16. Stern, P.C.; Dietz, T.; Abel, T.; Guagnano, G.A.; Kalof, L. A Value-Belief-Norm Theory of Support for Social Movements: The Case of Environmentalism. Hum. Ecol. Rev. 1999, 6, 81–97. [Google Scholar]
  17. Guagnano, G.A.; Stern, P.C.; Dietz, T. Influences on Attitude-Behavior Relationships: A Natural Experiment with Curbside Recycling. Environ. Behav. 1995, 27, 699–718. [Google Scholar] [CrossRef]
  18. Sarkis, A.M. A comparative study of theoretical behaviour change models predicting empirical evidence for residential energy conservation behaviours. J. Clean. Prod. 2017, 141, 526–537. [Google Scholar] [CrossRef]
  19. Adan, H.; Fuerst, F. Modelling energy retrofit investments in the UK housing market: A microeconomic approach. Smart Sustain. Built Environ. 2015, 4, 251–267. [Google Scholar] [CrossRef]
  20. Yuriev, A.; Dahmen, M.; Paillé, P.; Boiral, O.; Guillaumie, L. Pro-environmental behaviors through the lens of the theory of planned behavior: A scoping review. Resour. Conserv. Recycl. 2020, 155, 104660. [Google Scholar] [CrossRef]
  21. Schultz, P.W.; Nolan, J.M.; Cialdini, R.B.; Goldstein, N.J.; Griskevicius, V. The constructive, destructive, and reconstructive power of social norms. Psychol. Sci. 2007, 18, 429–434. [Google Scholar] [CrossRef] [PubMed]
  22. Cialdini, R.B.; Reno, R.R.; Kallgren, C.A. A focus theory of normative conduct: Recycling the concept of norms to reduce littering in public places. J. Pers. Soc. Psychol. 1990, 58, 1015–1026. [Google Scholar] [CrossRef]
  23. Milani, A.; Dessi, F.; Bonaiuto, M. A meta-analysis on the drivers and barriers to the social acceptance of renewable and sustainable energy technologies. Energy Res. Soc. Sci. 2024, 114, 103624. [Google Scholar] [CrossRef]
  24. Webb, T.L.; Benn, Y.; Chang, B.P.I. Antecedents and consequences of monitoring domestic electricity consumption. J. Environ. Psychol. 2014, 40, 228–238. [Google Scholar] [CrossRef]
  25. Yew, M.; Molla, A.; Cooper, V. Behavioural and environmental sustainability determinants of residential energy management information systems use. J. Clean. Prod. 2022, 356, 131778. [Google Scholar] [CrossRef]
  26. Alam, S.S.; Ahmad, M.; Othman, A.S.; Shaari, Z.B.H.; Masukujjaman, M. Factors affecting photovoltaic solar technology usage intention among households in Malaysia: Model integration and empirical validation. Sustainability 2021, 13, 1773. [Google Scholar] [CrossRef]
  27. Almrafee, M.; Akaileh, M. Customers’ purchase intention of renewable energy in Jordan: The case of solar panel systems using an extended theory of planned behavior (TPB). Int. J. Energy Sect. Manag. 2023, 18, 457–473. [Google Scholar] [CrossRef]
  28. Vu, T.D.; Nguyen, H.V.; Nguyen, T.M.N. Extend theory of planned behaviour model to explain rooftop solar energy adoption in emerging market. Moderating mechanism of personal innovativeness. J. Open Innov. Technol. Mark. Complex. 2023, 9, 100078. [Google Scholar] [CrossRef]
  29. Kaur, A.; Kaur, P. Predicting customers’ intentions to adopt the solar net metering system in India. Int. J. Energy Sect. Manag. 2023, 17, 1252–1270. [Google Scholar] [CrossRef]
  30. Lundheim, S.H.; Vesely, S.; Nayum, A.; Klöckner, C.A. From vague interest to strong intentions to install solar panels on private homes in the North—An analysis of psychological drivers. Renew. Energy 2021, 165, 455–463. [Google Scholar] [CrossRef]
  31. Liobikienė, G.; Dagiliūtė, R.; Juknys, R. The determinants of renewable energy usage intentions using theory of planned behaviour approach. Renew. Energy 2021, 170, 587–594. [Google Scholar] [CrossRef]
  32. Bull, J. Loads of green washing—Can behavioural economics increase willingness-to-pay for efficient washing machines in the UK? Energy Policy 2012, 50, 242–252. [Google Scholar] [CrossRef]
  33. Gosnell, G.; McCoy, D. Market failures and willingness to accept smart meters: Experimental evidence from the UK. J. Environ. Econ. Manag. 2023, 118, 102756. [Google Scholar] [CrossRef]
  34. Collins, M.; Curtis, J. Willingness-to-pay and free-riding in a national energy efficiency retrofit grant scheme. Energy Policy 2018, 118, 211–220. [Google Scholar] [CrossRef]
  35. García-Salirrosas, E.E.; Escobar-Farfán, M.; Gómez-Bayona, L.; Moreno-López, G.; Valencia-Arias, A.; Gallardo-Canales, R. Influence of environmental awareness on the willingness to pay for green products: An analysis under the application of the theory of planned behavior in the Peruvian market. Front. Psychol. 2024, 14, 1282383. [Google Scholar] [CrossRef] [PubMed]
  36. Kim, S.; Kim, S. Willingness to pay for what? Testing the impact of four factors on willingness to pay for facilitating and sanctioning energy policy instruments. Energy Rep. 2023, 10, 285–299. [Google Scholar] [CrossRef]
  37. Hipwood, T. Adapting owner-occupied dwellings in the UK: Lessons for the future. Build. Cities 2022, 3, 297. [Google Scholar] [CrossRef]
  38. Martiskainen, M.; Kivimaa, P. Role of knowledge and policies as drivers for low-energy housing: Case studies from the United Kingdom. J. Clean. Prod. 2019, 215, 1402–1414. [Google Scholar] [CrossRef]
  39. Pan, W.; Garmston, H. Building regulations in energy efficiency: Compliance in England and Wales. Energy Policy 2012, 45, 594–605. [Google Scholar] [CrossRef]
  40. Morgan, D.J.; Maddock, C.A.; Musselwhite, C.B.A. These are tenants not guinea pigs: Barriers and facilitators of retrofit in Wales, United Kingdom. Energy Res. Soc. Sci. 2024, 111, 103462. [Google Scholar] [CrossRef]
  41. Devine-Wright, P.; Wrapson, W.; Henshaw, V.; Guy, S. Low carbon heating and older adults: Comfort, cosiness and glow. Build. Res. Inf. 2014, 42, 288–299. [Google Scholar] [CrossRef]
  42. Broderick, Á.; Byrne, M.; Armstrong, S.; Sheahan, J.; Coggins, A.M. A pre and post evaluation of indoor air quality, ventilation, and thermal comfort in retrofitted co-operative social housing. Build. Environ. 2017, 122, 126–133. [Google Scholar] [CrossRef]
  43. Kahneman, D. Thinking, Fast and Slow; Penguin: London, UK, 2011. [Google Scholar]
  44. Meijer, F.; Straub, A.; Mlecnik, E. Consultancy Centres and Pop-Ups as Local Authority Policy Instruments to Stimulate Adoption of Energy Efficiency by Homeowners. Sustainability 2018, 10, 2734. [Google Scholar] [CrossRef]
  45. Department for Levelling Up, Housing and Communities. English Housing Survey 2022 to 2023: Headline Report; DLUHC: London, UK, 2023. Available online: https://www.gov.uk/government/collections/english-housing-survey-2022-to-2023-headline-report (accessed on 15 July 2025).
  46. McKee, K.; Soaita, A.M.; Hoolachan, J. ‘Generation rent’ and the emotions of private renting: Self-worth, status and insecurity amongst low-income renters. Hous. Stud. 2020, 35, 1468–1487. [Google Scholar] [CrossRef]
  47. Abdel-Wahab, M.; Moore, D.; MacDonald, S. Exploring the adoption of low carbon technologies by Scottish housing associations. Int. J. Low-Carbon Technol. 2011, 6, 318–323. [Google Scholar] [CrossRef]
  48. Hindman, M. Building better models: Prediction, replication, and machine learning in the social sciences. Ann. Am. Acad. Pol. Soc. Sci. 2015, 659, 48–62. [Google Scholar] [CrossRef]
  49. Kovač, N.; Ratković, K.; Farahani, H.; Watson, P. A practical applications guide to machine learning regression models in psychology with Python. Methods Psychol. 2024, 11, 100156. [Google Scholar] [CrossRef]
  50. Verhagen, M.D. Incorporating machine learning into sociological model-building. Sociol. Methodol. 2024, 54, 217–268. [Google Scholar] [CrossRef]
  51. Rajput, V.K.; Kaltoft, M.K.; Dowie, J. Inferring Causality Is Preference-Sensitive: We Need a Book of Who as Well as Why. Stud. Health Technol. Inform. 2023, 309, 38–42. [Google Scholar] [CrossRef] [PubMed]
  52. Ajzen, I. Constructing a Theory of Planned Behaviour Questionnaire. 2019. Available online: https://people.umass.edu/aizen/pdf/tpb.measurement.pdf (accessed on 15 July 2025).
  53. Cotton, M.; Van Schaik, P.; Vall, N.; Lorrimer, S.; Mountain, A.; Stubbs, R.; Leighton, C.; Leon, E.S.; Imani, E. Just transitions and sociotechnical innovation in the social housing sector: An assemblage analysis of residents’ perspectives. Technol. Soc. 2024, 77, 102513. [Google Scholar] [CrossRef]
  54. Tabachnick, B.G.; Fidell, L.S.; Ullman, J.B. Using Multivariate Statistics; Pearson: Boston, MA, USA, 2013; Volume 6. [Google Scholar]
  55. James, G.; Witten, D.; Hastie, T.; Tibshirani, R.; James, G.; Witten, D.; Hastie, T.; Tibshirani, R. An Introduction to Statistical Learning: With Applications in R; Springer: New York, NY, USA, 2021; pp. 225–288. [Google Scholar]
  56. Molnar, C. Interpretable Machine Learning; Lulu.com: Morrisville, NC, USA, 2022. [Google Scholar]
  57. Wang, J.; Shen, M.; Chu, M. Why is green consumption easier said than done? Exploring the green consumption attitude-intention gap in China with behavioral reasoning theory. Clean. Responsible Consum. 2021, 2, 100015. [Google Scholar] [CrossRef]
  58. Martens, E.; Naeyaert, S.; Van Hove, S.; Pelka, S.; Preuß, S.; Gabriel, M.; Conradie, P.; Ponnet, K. Transitioning towards sustainable heating: A mixed-methods study of heat pump acceptance among Flemish homeowners. Energy Res. Soc. Sci. 2025, 126, 104137. [Google Scholar] [CrossRef]
  59. Waris, I.; Hameed, I.; Ali, R. Predicting household sign up for solar energy: An empirical study based on the extended theory of planned behavior. Int. J. Energy Sect. Manag. 2023, 17, 455–473. [Google Scholar] [CrossRef]
  60. Chen, C.-F.; Xu, X.; Frey, S. Who wants solar water heaters and alternative fuel vehicles? Assessing social-psychological predictors of adoption intention and policy support in China. Energy Res. Soc. Sci. 2016, 15, 1–11. [Google Scholar] [CrossRef]
  61. Tan, Y.; Ying, X.; Gao, W.; Wang, S.; Liu, Z. Applying an extended theory of planned behavior to predict willingness to pay for green and low-carbon energy transition. J. Clean. Prod. 2023, 387, 135893. [Google Scholar] [CrossRef]
  62. Nketiah, E.; Song, H.; Gu, T.; Adjei, M.; Adu-Gyamfi, G.; Obuobi, B. How willing are residents to accept sustainable energy from food waste generated by anaerobic digestion projects? Energy 2024, 298, 131387. [Google Scholar] [CrossRef]
  63. Wang, Y.; He, K.; Zhang, J.; Chang, H. Environmental knowledge, risk attitude, and households’ willingness to accept compensation for the application of degradable agricultural mulch film: Evidence from rural China. Sci. Total Environ. 2020, 744, 140616. [Google Scholar] [CrossRef] [PubMed]
  64. Tuch, A.N.; Van Schaik, P.; Hornbæk, K. Leisure and work, good and bad: The role of activity domain and valence in modeling user experience. ACM Trans. Comput.-Hum. Interact. 2016, 23, 1–32. [Google Scholar] [CrossRef]
  65. Hassenzahl, M. The thing and I (summer of’17 remix). In Funology 2 Usability Enjoyment; Springer: New York, NY, USA, 2018; pp. 17–31. [Google Scholar]
  66. Winter, K.; Pummerer, L.; Hornsey, M.J.; Sassenberg, K. Pro-vaccination subjective norms moderate the relationship between conspiracy mentality and vaccination intentions. Br. J. Health Psychol. 2022, 27, 390–405. [Google Scholar] [CrossRef] [PubMed]
  67. Godbersen, H.; Hofmann, L.A.; Ruiz-Fernández, S. How people evaluate anti-corona measures for their social spheres: Attitude, subjective norm, and perceived behavioral control. Front. Psychol. 2020, 11, 567405. [Google Scholar] [CrossRef] [PubMed]
  68. Jansma, S.R.; Gosselt, J.F.; de Jong, M.D. Kissing natural gas goodbye? Homeowner versus tenant perceptions of the transition towards sustainable heat in the Netherlands. Energy Res. Soc. Sci. 2020, 69, 101694. [Google Scholar] [CrossRef]
  69. Energy Act 2023 [c. 52]. Stationary Office: London, UK, 2023. Available online: https://www.legislation.gov.uk/ukpga/2023/52 (accessed on 15 July 2025).
  70. Stefanini, S. UK Drawing Up a Net Zero Public Participation Strategy to Bring People on Board, Carbon Pulse. April 2025. Available online: https://carbon-pulse.com/384517/ (accessed on 15 July 2025).
  71. Cotton, M. Policy, Market, and Skills Barriers to Heat Pump Deployment in the United Kingdom. In Global Energy Transition and Sustainable Development Challenges, Models and Regions; Springer: New York, NY, USA, 2024; Volume 1, pp. 173–190. [Google Scholar]
  72. Department for Energy Security and Net Zero. Press Release: Help to Save Households Money and Deliver Cleaner Heat to Homes; Department for Energy Security and Net Zero: London, UK, 2024. Available online: https://www.gov.uk/government/news/help-to-save-households-money-and-deliver-cleaner-heat-to-homes (accessed on 15 July 2025).
  73. Günther, A.; Engel, L.; Hornsey, M.J.; Nielsen, K.S.; Roy, J.; Steg, L.; Tam, K.-P.; van Valkengoed, A.M.; Wolske, K.S.; Wong-Parodi, G.; et al. Psychological and contextual determinants of clean energy technology adoption. Nat. Rev. Clean Technol. 2025. [Google Scholar] [CrossRef]
  74. Tham, R.; Morgan, G.; Dharmage, S.; Marks, G.; Cowie, C. Scoping review to understand the potential for public health impacts of transitioning to lower carbon emission technologies and policies. Environ. Res. Commun. 2020, 2, 065003. [Google Scholar] [CrossRef]
  75. Sandri, O.; Holdsworth, S.; Wong, P.S.; Hayes, J. Upskilling plumber gasfitters for hydrogen: An empirical study using the Theory of Planned Behavior. Renew. Energy 2024, 221, 119800. [Google Scholar] [CrossRef]
  76. Yadav, J.; Nair, A.M.; George, J.; Alapatt, B.P. Predictive Modelling of Heart Disease: Exploring Machine Learning Classification Algorithms. In Proceedings of the 2024 International Conference on Distributed Computing and Optimization Techniques (ICDCOT), Bengaluru, India, 15–16 March 2024; IEEE: New York, NY, USA, 2024; pp. 1–7. [Google Scholar]
  77. Torres, L.F. Xgboost: The King of Machine Learning Algorithms. 2023. Available online: https://medium.com/latinxinai/xgboost-the-king-of-machine-learning-algorithms-6b5c0d4acd87 (accessed on 10 May 2024).
  78. Weinstein, N.D.; Rothman, A.J.; Sutton, S.R. Stage theories of health behavior: Conceptual and methodological issues. Health Psychol. 1998, 17, 290. [Google Scholar] [CrossRef] [PubMed]
  79. Johnston, A.C.; Goel, S.; Williams, K. From cyber benign to cyber malicious: Unveiling the evolution of insider cyber maliciousness from a stage theory perspective. Eur. J. Inf. Syst. 2024. [Google Scholar] [CrossRef]
Figure 1. Theory of Planned Behaviour.
Sustainability 17 06668 g001
Figure 2. Model of low-carbon technology adoption.
Sustainability 17 06668 g002
Figure 3. Intention, attitude, subjective norm, and control—mean and 95%-confidence interval.
Sustainability 17 06668 g003
Figure 4. Willingness to pay and willingness to accept—mean and 95%-confidence interval.
Sustainability 17 06668 g004
Figure 5. LASSO regression coefficients (beta) with 95%-confidence intervals—outcome: intention. Regression coefficients of numeric predictors are standardized.
Sustainability 17 06668 g005
Figure 6. LASSO regression coefficients (beta) with 95%-confidence intervals—outcome: WTA, tenant. Regression coefficients of numeric predictors are standardized.
Sustainability 17 06668 g006
Figure 7. LASSO regression coefficients (beta) with 95%-confidence intervals—outcome: attitude. Regression coefficients of numeric predictors are standardized.
Sustainability 17 06668 g007
Figure 8. LASSO regression coefficients (beta) with 95%-confidence intervals—outcome: subjective norm. Regression coefficients of numeric predictors are standardized.
Sustainability 17 06668 g008
Figure 9. LASSO regression coefficients (beta) with 95%-confidence intervals—outcome: perceived behavioural control. Regression coefficients of numeric predictors are standardized.
Sustainability 17 06668 g009
Table 1. Exploratory factor analysis with oblimin rotation (structure matrix) and reliability analysis.
Structure Matrix, All Core-Construct ItemsStructure Matrix, Final Set of Core-Construct Items
ItemFactor 1Factor 2Factor 3Factor 4ItemFactor 1Factor 2Factor 3Factor 4
Intention10.58−0.380.700.51Intention10.540.64−0.410.51
Intention20.73−0.170.540.30Intention40.340.80−0.400.40
Intention30.75−0.180.570.35Intention50.380.89−0.380.48
Intention40.34−0.390.780.40Intention60.420.93−0.410.47
Intention50.38−0.370.850.48Attitude10.830.43−0.210.24
Intention60.43−0.400.890.47Attitude20.840.36−0.210.24
Attitude10.83−0.200.430.24Attitude30.830.35−0.200.18
Attitude20.83−0.210.360.24Attitude40.790.33−0.230.28
Attitude30.83−0.200.350.17Attitude50.850.42−0.230.27
Attitude40.77−0.230.310.28Attitude60.810.37−0.260.37
Attitude50.85−0.220.430.26Attitude70.880.35−0.200.24
Attitude60.79−0.270.340.37Attitude80.850.39−0.250.38
Attitude70.87−0.200.340.25Norm30.380.54−0.380.71
Attitude80.84−0.260.370.38Norm40.230.46−0.340.59
Norm10.71−0.280.460.50Norm50.300.45−0.360.89
Norm20.77−0.260.430.41Norm60.270.46−0.380.91
Norm30.40−0.380.540.72PBC2−0.16−0.260.75−0.23
Norm40.24−0.340.450.59PBC3−0.16−0.340.87−0.34
Norm50.31−0.360.440.88PBC4−0.30−0.500.73−0.53
Norm60.28−0.380.440.90PBC6−0.46−0.520.68−0.44
PBC1−0.510.60−0.65−0.60PBC7−0.47−0.600.72−0.52
PBC2−0.150.75−0.23−0.23PBC8−0.06−0.180.50−0.05
PBC3−0.160.86−0.31−0.34Eigenvalue5.942.912.992.67
PBC4−0.300.73−0.49−0.53% variance0.270.130.140.12
PBC5−0.170.32−0.22−0.29Omega (reliability)0.700.970.880.92
PBC6−0.470.69−0.53−0.45
PBC7−0.480.72−0.61−0.52
PBC8−0.060.49−0.18−0.05
Table 2. Criteria for statistical learning techniques.
Intrinsic Interpretability Variable Selection
Linear regression (LR)-
LASSO regression (LASSO)
Ridge regression (RR)½
Support vector regression (SVR)-
Decision tree regression (RT)
Random forest regression (RFR)-
Extreme gradient boosting (XGBoost)
K-nearest neighbours (k-NNs)-NA
Neural network (NN)--
Table 3. Pearson’s correlations between core theory-of-planned-behaviour variables and other variables.
VariableIntentionAttitudeSubjective NormPerceived Beh. Control
Intention1.000.480.600.54
Attitude0.481.000.360.34
Subjective norm0.600.361.000.50
Perceived beh. control0.540.340.501.00
log WTP0.130.200.070.24
log WTA0.060.080.010.14
Installation approach0.010.010.010.05
Bedrooms0.050.010.020.14
Solar0.160.060.190.17
Insulation0.050.070.040.11
Smart meter0.120.150.110.11
Homeowner−0.05−0.04−0.060.12
Gender Woman0.040.06−0.01−0.06
Education Degree Plus0.110.080.100.10
Work Employed0.170.060.150.14
Home Type Detached or Semi0.020.010.000.13
Bills Reduced0.330.670.180.28
Health0.430.660.360.32
Wellbeing0.460.710.370.36
Environment0.360.720.210.28
Encourage Others0.510.660.490.41
Reliable Energy0.410.690.300.31
Sustainable Virtuous0.470.690.380.34
Reliable Secure0.420.720.300.31
Bills Increased0.13−0.020.310.12
Energy Reduced0.12−0.010.300.09
Indoor Space Reduced0.110.000.240.08
Rent Increased0.090.040.200.12
Family Influence0.420.350.570.33
Landlord Influence0.360.340.450.30
Family Behaviour0.390.190.600.33
Residents’ Behaviour0.310.090.520.35
Government0.350.390.340.36
Accessible0.370.540.220.37
LCT affordable0.400.560.280.40
Space Insufficient−0.13−0.15−0.10−0.18
Disruption−0.27−0.37−0.19−0.26
Repair−0.26−0.34−0.23−0.26
Knowledge Insufficient−0.11−0.19−0.05−0.15
Heat Pump unappealing−0.23−0.37−0.15−0.17
Table 4. Performance of machine-learning techniques.
MethodOutcomeR2_trainR2_testR2_train − R2_testMSE_trainMSE_testMSE_train − MSE_test
LRIntention0.510.56−0.050.490.440.05
LASSO-LRIntention0.510.56−0.050.490.440.05
ridge-LRIntention0.510.56−0.050.490.440.05
XGBoostIntention0.390.40−0.010.610.600.01
k-NNIntention1.000.480.520.000.52−0.52
SVRIntention0.510.56−0.050.490.440.05
RTIntention0.750.280.470.250.72−0.47
RFRIntention0.930.550.380.070.45−0.38
NNIntention0.810.420.390.190.58−0.39
LRWTA, tenant0.150.110.030.850.89−0.03
LASSO-LRWTA, tenant0.110.110.000.890.890.00
ridge-LRWTA, tenant0.150.110.030.850.89−0.03
XGBoostWTA, tenant0.110.070.040.890.93−0.04
k-NNWTA, tenant1.000.040.960.000.96−0.96
SVRWTA, tenant0.120.130.000.880.870.00
RTWTA, tenant0.63−0.491.120.371.49−1.12
RFRWTA, tenant0.880.140.740.120.86−0.74
NNWTA, tenant0.73−0.120.850.271.12−0.85
LRAttitude0.660.610.050.340.39−0.05
LASSO-LRAttitude0.660.610.050.340.39−0.05
ridge-LRAttitude0.660.610.050.340.39−0.05
XGBoostAttitude0.740.640.100.260.36−0.10
k-NNAttitude1.000.640.360.000.36−0.36
SVRAttitude0.680.630.060.320.37−0.06
RTAttitude0.820.510.310.180.49−0.31
RFRAttitude0.960.640.310.040.36−0.31
NNAttitude0.660.520.140.340.48−0.14
LRSubjective norm0.460.47−0.010.540.530.01
LASSO-LRSubjective norm0.450.47−0.020.550.530.02
ridge-LRSubjective norm0.460.47−0.010.540.530.01
XGBoostSubjective norm0.570.510.060.430.49−0.06
k-NNSubjective norm0.520.480.050.480.52−0.05
SVRSubjective norm0.490.480.010.510.52−0.01
RTSubjective norm0.680.310.370.320.69−0.37
RFRSubjective norm0.930.490.440.070.51−0.44
NNSubjective norm0.490.490.000.510.510.00
LRPerceived behavioural control0.310.300.010.690.70−0.01
LASSO-LRPerceived behavioural control0.270.270.000.730.730.00
ridge-LRPerceived behavioural control0.310.300.010.690.70−0.01
XGBoostPerceived behavioural control0.440.340.100.560.66−0.10
k-NNPerceived behavioural control0.320.260.060.680.74−0.06
SVRPerceived behavioural control0.300.300.000.700.700.00
RTPerceived behavioural control0.590.060.530.410.94−0.53
RFRPerceived behavioural control0.910.340.570.090.66−0.57
NNPerceived behavioural control0.220.220.000.780.780.00
Table 5. LASSO model results.
Outcome/Test R2Intention0.56Outcome/Test R2Attitude0.61
Hypotheses H1/3a/H7.1Hypotheses H4/H7.4
PredictorsAttitude0.12PredictorsBills reduced0.01
Subjective norm0.29Health improved0.01
Perceived beh. control0.23Wellbeing improved0.01
Age−0.12Environment improved0.01
Encourage others0.01
Outcome/test R2WTA, tenant0.11Reliable energy0.01
Hypotheses H3c/H7.2Sustainable virtuous0.01
PredictorsAge−0.15Reliable secure0.01
Installation approach (RF/NB)0.12
Outcome/test R2Subjective norm0.47
Hypotheses H5/H7.5
PredictorsFamily Influence0.03
Outcome/test R2WTA, owner, retrofit0.02Family Behaviour0.04
Hypotheses H3b/H7.1Age−0.01
PredictorAge−0.07
Bedrooms0.10Outcome/test R2Perceived behavioural control0.27
Solar−0.23Hypotheses H6/H7.6
PredictorsGovernment0.01
Outcome/test R2WTA, owner, new build0.02LCT accessible0.01
Hypotheses H3b/H7.1LCT affordable0.01
Predictor--Space insufficient−0.01
Repair−0.01
Age−0.01
Bedrooms0.08
Homeowner0.14
Disclaimer/Publisher’s Note: The statements, opinions and data contained in all publications are solely those of the individual author(s) and contributor(s) and not of MDPI and/or the editor(s). MDPI and/or the editor(s) disclaim responsibility for any injury to people or property resulting from any ideas, methods, instructions or products referred to in the content.

