Abstract
Olive tree branches (OB) and leaves (OL) from the Viseu region (Portugal) were studied for their chemical composition and liquefaction behavior using polyalcohols. Chemical analysis revealed that OL contained higher ash content (4.08%) and extractives, indicating more bioactive compounds, while OB had greater α-cellulose (30.47%) and hemicellulose (27.88%). Lignin content was higher in OL (21.64%) than OB (16.40%). Liquefaction experiments showed that increasing the temperature from 140 °C to 180 °C improved conversion, with OB showing a larger increase (52.5% to 80.9%) compared to OL (66% to 72%). OB reached peak conversion faster, and the optimal particle size for OB was 40–60 mesh, while OL performed better at finer sizes. OL benefited more from higher solvent ratios, whereas OB achieved high conversion with less solvent. FTIR analysis confirmed that acid-catalyzed liquefaction breaks down lignocellulosic structures, depolymerizes cellulose and hemicellulose, and modifies lignin, forming hydroxyl, aliphatic, and carbonyl groups. These changes reflect progressive biomass degradation and the incorporation of polyalcohol components, converting solid biomass into a reactive, polyol-rich liquid. The study highlights the distinct chemical and processing characteristics of olive branches and leaves, informing their potential industrial applications.
1. Introduction
Olive trees, the most ancient cultivated trees globally, are currently cultivated on a large scale, involving approximately 9 million hectares worldwide [1]. According to data from the International Olive Council (IOC) [2], during the 2023–2024 agricultural campaign, global olive oil production remained heavily concentrated in Mediterranean regions, which collectively accounted for the vast majority of the global output, with Spain maintaining its position as the leading producer, with an estimated 766,400 tons, despite ongoing climatic pressures that have affected yields (Table 1). The second most important producer was Italy, with approximately 288,900 tons, reflecting the country’s sustained production capacity, driven by a combination of traditional practices and high-value cultivars (Table 1). Turkey, Greece, and Tunisia also contributed significantly, with outputs of 210,000 tons, 195,000 tons, and 200,000 tons, respectively. Portugal was the sixth main producer, with a reported production volume of 150,000 tons, higher than the 126,000 tons of the 2022–2023 campaign [2]. This figure reinforces Portugal’s growing significance in the global olive oil sector, attributed to substantial investments in super-intensive cultivation systems, the modernization of milling infrastructure, and adherence to high-quality production standards. These factors have not only increased the volume but have also elevated the international profile of Portuguese olive oils, especially in export markets.

Table 1.
Top 10 producers of olive oil according to IOC [2].
The expansion of the olive oil industry has led to an increase in its environmental footprint, including aspects such as energy and water usage, greenhouse gas emissions, and waste generation. Among the various waste products, olive leaves emerge as the primary contributor, being a plentiful byproduct resulting from the pruning of olive trees during oil production [1]. The production yield of olive leaves from pruning amounts to approximately 25 kg per olive tree, with an additional 5% of the weight of the harvested olives gathered at the oil mill [3]. Additionally, olive tree crowns have to be pruned annually or at least every two years [4], which produces significant amounts of olive waste, which include both olive leaves and olive branches. Velázquez-Martí et al. [5] reported no significant differences in residual biomass between annual and biennial pruning, with an average of 33 kg of leftover biomass per tree. Their study was performed in Mediterranean regions with an emphasis on Spain, Italy, and Greece, and they found that olive pruning typically produces an average of 1.31 t/ha with annual pruning and 3.02 t/ha with biennial pruning. Avraamides and Fatta [6] reported that, for every liter of olive oil produced, approximately 6.23 kg of pruning residues, consisting of branches and leaves, is generated.
The chemical composition of olive leaves exhibits variability due to various factors, such as the origin, the ratio of branches present on the sample, storage conditions, climatic elements, moisture levels, and the extent of contamination with soil and oils [7]. On the other hand, the chemical composition of olive branches depends mainly on the bark to wood ratio.
The extractive content of olive leaves varies significantly among cultivars, as evidenced by the differences in both aqueous and ethanolic extractive yields reported previously for Mediterranean cultivars Arbequina, Royal, and Picual, where Picual exhibited the highest total extractive content (45.07 ± 1.49%). This was significantly greater than that of Arbequina (40.76 ± 0.79%) and Royal (40.56 ± 0.27%), indicating a richer chemical profile in this variety [8]. These results suggest cultivar-dependent variations in metabolite composition and polarity, which may have implications for their bioactivity and potential applications in phytochemical or pharmacological research [8]. According to Espeso et al. [1], olive leaves are a rich source of bioactive compounds, many of which are unique to the Olea europaea species. Among these, polyphenolic compounds such as oleuropeosides (oleuropein and verbascoside), various flavones (including luteolin-7-glucoside, apigenin-7-glucoside, and diosmetin-7-glucoside), flavonols (e.g., rutin), flavan-3-ols, and catechin-substituted phenolics (such as tyrosol, hydroxytyrosol, vanillin, vanillic acid, and caffeic acid) are of particular interest [1]. Oleuropein is the major secoiridoid glycoside found in olive leaves, reaching up to 24.5% of the leaf dry weight, compared to 14% in unripe olive fruits [1,9]. Secoiridoids are molecules that belong to the class of secondary metabolites, with both terpenoid and hydroxy-aromatic characteristics, and their structures are defined by elenolic acid and its related derivatives [10]. Similar results were presented by Khelouf et al. [11], who studied eight different Tunisian and Algerian cultivars, where oleuropein was the most significant compound found in extracts. Oleuropein possesses strong antioxidant activity, which is partly attributable to its metal-chelating properties, particularly with copper (Cu) and iron (Fe) ions, which are known to catalyze free-radical-generating reactions [1,12]. The prominent presence of oleuropein highlights its significance as a marker compound in olive leaf extracts and as a potential therapeutic agent due to its antioxidative, antimicrobial, and antiviral properties [1,9]. Other phenolic compounds, such as hydroxytyrosol and verbascoside, are also present in high amounts [11], while smaller amounts of other compounds, like epigallocatechin, epicatechin-3-O-gallate, tyrosol, myricetin, catechol, and chlorogenic, sinapic, ferulic, and ellagic acids, are also found [11]. The composition and concentration of polyphenols in olive leaves are influenced by several variables. Technological factors associated with the extraction process, such as the type and composition of the solvent, the solid-to-solvent ratio, the particle size of the plant material, the extraction temperature and pH, and the extraction duration, can significantly affect the yield and profile of the extracted compounds. Agronomic variables, including the leaf age, degree of ripeness, geographic origin, cultivation methods, and phenological stage at sampling, also play a crucial role in determining the final polyphenolic content [1,10]. Changes in polyphenolic composition during leaf maturation have also been reported. Specifically, the concentration of oleuropein decreases with leaf aging, while the levels of hydroxytyrosol increase due to ongoing chemical and enzymatic transformations [1,13]. This dynamic shift in compound abundance is essential to consider when selecting raw materials as it can influence both the extract’s potency and its intended use. These compounds are not only important for plant defense against abiotic stressors such as UV radiation and biotic threats like insect herbivory, but they also hold significant potential for human health applications due to their pharmacological properties. Olive leaves (OL) contain moderate levels of structural carbohydrates, with cellulose at 12.0% and hemicellulose at 10.5% [14]. OL also have relatively high protein content of 6.9%, supporting their role in the plant’s metabolic and nutritional processes [14]. The lignin content is also significant, with 15.1% insoluble lignin and around 2% soluble lignin, indicating some degree of structural rigidity [14].
There is not much information about the chemical composition of small branches alone, since most studies include pruning (a mixture of leaves and small branches), wood, or bark. Gullón et al. [14] presented a chemical analysis of olive tree pruning (OTP) and olive leaves (OL) and reported differences in their composition, reflecting their distinct structural and functional roles in the tree. OTP exhibited a higher proportion of structural carbohydrates, with notably greater cellulose (21.6%) and hemicellulose (14.5%) content compared to OL (12.0% and 10.5%, respectively). In contrast, OL showed much higher content of total extractives (41.9%) than OTP (28.6%), particularly ethanol-soluble extractives (14.8% in OL vs. 5.1% in OTP), which suggests a richer presence of secondary metabolites like waxes, oils, and other lipophilic compounds typically associated with leaf tissue [14]. Both materials contain similar levels of phenolics, indicating potential antioxidant activity in both fractions. Moreover, OL are characterized by higher ash content (6.9% vs. 3.9%). The protein content is also significantly greater in OL (6.9%) than in OTP (3.1%), further supporting the nutritional and metabolic functions of leaves. The insoluble lignin content is comparable between OTP (15.4%) and OL (15.1%), but slightly higher in OTP, aligning with its woody nature.
Polyalcohol liquefaction has proven to be an efficient method to convert solid lignocellulosic materials into a usable liquid, particularly for the production of polymer precursors. One of the first attempts to liquefy wood at moderate temperatures was made by Seth et al. [15], who tested several simple and polyhydric alcohols, such as methanol, ethanol, propanol, ethylene glycol, glycerol, phenol, and catechol, with temperatures of 170 °C and 250 °C and concluded that catechol, phenol, and ethylene glycol were the most efficient in solubilizing wood under acidic conditions. Acid catalysis has been shown to be more efficient in liquefaction, except in barks with high suberin content, where basic catalysis is preferred [16]. In subsequent studies, other polyalcohols, such as polyethylene glycol (PEG), were tested [17], but this PEG-based liquefaction system yielded 10–30% solid residues, even under optimal reaction parameters, attributed to insufficient hydroxyl group content, which facilitated recondensation reactions of liquefied wood (LW) intermediates. However, the incorporation of 10 wt% glycerol into the PEG matrix effectively minimized the formation of unconverted residues. Therefore, cosolvent mixtures with glycerol have been proven to be the best option for the liquefaction of most lignocellulosic materials, like wood [18], kenaf [19], cork [16], bagasse and cotton stalks [20], orange peel waste [21], and walnut shells [22].
The objective of this study is to compare the chemical composition and liquefaction behavior of olive leaves (OL) and olive branches (OB) in order to evaluate their potential for valorization. By examining differences in ash, extractives, structural carbohydrates, lignin content, and liquefaction performance under varying operational parameters (temperature, reaction time, particle size, and material/solvent ratio), the study aims to identify the optimal processing conditions and highlight the distinct advantages of each byproduct for bio-based applications such as biofuels, biocomposites, or nutrient recovery. Recent publications provide specific insights into the potential uses of liquefied lignocellulosic biomass. For instance, liquefied biomass can serve as a precursor for biopolyols in polyurethane foams, adhesives, or coatings [23,24]. Although there are several studies on the hydrothermal liquefaction of olive wastes for the production of fuels [25], there are no studies on the polyalcohol liquefaction of these wastes. Moreover, optimizing the liquefaction conditions, particularly the solvent composition and catalyst dosage, is crucial in maximizing the yield, as these factors collectively influence the reaction kinetics, suppress unwanted recondensation, and enhance the efficiency of biomass conversion [26,27].
2. Materials and Methods
2.1. Materials
The olive tree prunings used in this study, consisting of leaves and thin branches (commonly < 2 cm diameter), were collected in the central region of Portugal on a farm located in Viseu, after the fruit harvesting season.
After separating branches and leaves, the samples were milled in a Retsch SMI mill (Retsch, Haan, Germany) and sieved in a Retsch AS200 device (Retsch, Haan, Germany) for 20 min at a speed of 50 rpm. Four fractions, which were >40 mesh (>0.420 mm), 40–60 mesh (0.420–0.250 mm), 60–80 mesh (0.250–0.177 mm), and <80 mesh (<0.177 mm), were obtained and dried at 105 °C for at least 24 h.
2.2. Chemical Composition Determination
The chemical characterization of olive branches and leaves was carried out using standard procedures to measure the ash content, extractives (in dichloromethane, ethanol, and hot water), cellulose, lignin, and hemicelluloses. This chemical composition analysis was performed to evaluate their potential applications.
The 40–60-mesh fraction was used for chemical analyses following TAPPI T 264 om-97 [28]. The average chemical composition of each sample was determined in triplicate. The ash content of the olive branches and leaves was determined using the TAPPI T 211 om-22 [29] standard procedure, involving the calcination of the material at 525 °C. The extractives in all solvents were determined by Soxhlet extraction according to TAPPI T 204 cm-07 [30]. The extractive content was determined by Soxhlet extraction using about 5 g of each sample, with 150 mL of dichloromethane (DCM), ethanol, and water as solvents; the extraction time was 6 h for DCM and 16 h for ethanol and water. The extractive content was determined in relation to the dry mass.
The lignin content in olive branches and leaves, free of extractives, was quantified using the Klason method, with two hydrolysis steps: the first with 72% H2SO4 at 30 °C for 1 h, followed by 1 h with 3% H2SO4 in an autoclave at 1.2 bar, according to a modified version of the TAPPI T 222 om-02 standard [31]. Soluble lignin was determined by following ISO 21436-2020 [32]. The insoluble residue that resulted was obtained through filtration using a G4 glass crucible and dried until it reached a constant weight. Following this, the soluble lignin content was quantified spectrophotometrically by measuring its absorbance at 205 nm.
Holocellulose was determined by the acid chlorite method. This process can last for 8 h, serving to remove almost all lignin. The holocellulose and α-cellulose content was determined for extractive-free samples via TAPPI 429 cm-23 [33], as described in Domingos et al., 2020 [34]. The hemicellulose content was determined by the difference between holocellulose and α-cellulose.
2.3. Polyalcohol Liquefaction
Liquefaction was performed in a double shirt reactor (600 mL, Parr 5100 Low-Pressure Reactor, Equilabo, Caluire et Cuire, France) heated with an oil jacket (Parr Instruments Co., Moline, IL, USA). For each condition, liquefaction runs were carried out in duplicate. The reactor charge was 10 g of dried olive branch and leaf powder (0.420–0.250 mm) introduced into the reactor. The samples (fractions >40, 40–60, 60–80, and <80 mesh) were also liquefied to study the effect of the particle size on the liquefaction yield. The mixture was homogenized before starting, and the reactor’s stirrer was set at 70 rpm. A mixture of glycerol and ethylene glycol 1:1 was used as a solvent, and sulfuric acid (3% based on solvent mass) was used as a catalyzer. These polyalcohols were chosen because of their low costs and relatively small environmental impacts. The liquefaction temperature was measured in the oil present in the reactor jacket, and the liquefaction time started when the oil reached the working temperatures of 140 °C, 160 °C, and 180 °C. The reaction time ranged between 15 and 60 min. The reactor was cooled down on ice to stop the reaction. Liquefied samples were dissolved in 100 mL of methanol and filtered in a Buchner funnel over a paper filter. To remove excess solvent, the residue was washed with approximately 200 mL of water. The insoluble residue was determined gravimetrically.
2.4. Infrared Spectroscopy Analysis
The initial dried material, the liquefied material, and the resulting solid residue were analyzed by FTIR-ATR, in a Perkin-Elmer UATR Spectrum Two spectrometer with 72 scans min−1, with a resolution of 4.0 cm−1, over the 4000 to 400 cm−1 range (PerkinElmer, Bridgeport, CT, USA). The samples were dried for 1 week in an oven at 103 ± 2 °C to ensure that water was completely removed. After measuring the absorbance without any sample or FTIR arm over the 2 mm2 crystal, the samples were placed over the crystal so that the entire surface was covered. Solid samples were pressed against the crystal, while a droplet was placed over the crystal for liquid samples. The average of three spectra was used. During the preparation of this manuscript, OpenAI (2024), ChatGPT (May, 13 version; https://chat.openai.com/) was used for the purposes of describing the results.
3. Results
3.1. Chemical Composition
The chemical compositions of olive branches (OB) and olive leaves (OL), presented in Table 2, reveal distinct differences that reflect their functional roles within the plant. The ash content is higher in the leaves (4.08%) compared to the branches (2.79%), suggesting that the leaves accumulate a greater proportion of inorganic minerals. Similar results were presented previously for several energy crops, such as four perennial crops (Miscanthus sinensis × Giganteus Greef & Deuter, Arundo donax L., Cynara cardunculus L., and Panicum virgatum L.) and two annual crops (sweet and fiber sorghum, Sorghum bicolor Moench) [35], where the ash content was, in some cases, such as in Arundo donax, almost four times higher (113 g/kg in leaves against 32 g/kg in stems). The extractive fractions obtained with dichloromethane, ethanol, and hot water were also considerably higher in the leaves (5.80%, 20.11%, and 15.82%, respectively) than in the branches (1.22%, 11.24%, and 10.00%) (Table 2). These elevated values in the leaves indicate a richer presence of non-structural, potentially bioactive compounds, which are often associated with secondary metabolism and defense mechanisms. Similar results regarding total extractives (43.73%) were presented previously for olive leaves from different cultivars, with Picual exhibiting the highest total extractive content (45.07 ± 1.49%)—greater than that of Arbequina (40.76 ± 0.79%) and Royal (40.56 ± 0.27%) [8]. Picual’s aqueous extractives (29.46%) and ethanolic extractives (15.61%) were significantly greater than those of Arbequina and Royal, indicating cultivar-specific differences in the distribution and composition of bioactive compounds in olive leaves. The different values in ethanol and water extractives obtained here (Table 2) could be due to the previous extraction with dichloromethane followed by ethanol, while, in the study by Lama-Muñoz et al. [8], it was performed with water followed by ethanol. Similar results were presented for Tunisian and Algerian varieties, where ethanol extractives ranged from 12.02 to 26.61 [11]. Smaller amounts of extractives (25.5%) have been reported for olive leaves (from the Chemlali variety) collected in the region of Sfax (center of Tunisia) [36].
Table 2.
Chemical compositions of olive branches and olive leaves.
The structural carbohydrate analysis shows the contrasting compositions. Olive branches exhibit substantially higher α-cellulose content (30.47%) and hemicellulose fraction content (27.88%) compared to the leaves (18.56% and 14.00%, respectively) (Table 2). The α-cellulose and hemicellulose content obtained is higher than that reported before, with 5.7% for cellulose and 3.8% for hemicelluloses [37]. Nevertheless, these values were estimations obtained using the anhydro correction of sugars determined by GC. Another study [14] reported, for olive tree prunings composed largely of woody branches, 21.6% cellulose and 14.5% hemicellulose, while, for the leaves, they were 12.0% and 10.5%, respectively. Mabrouk et al. [36] reported higher values for polysaccharides, with 37% hemicelluloses and 12.4% cellulose for olive leaves harvested in Tunisia. While the absolute values differ between studies, likely due to variations in sampling and analytical methods, the trend remains consistent: branch-derived biomass contains more structural polysaccharides than that from leaves (Table 2). A similar work was presented previously on different olive tree residues, such as olive leaves, small branches (as in this study), and large branches [38]. Olive leaves contained slightly lower amounts of cellulose (11%) compared to the 18% obtained here but very similar hemicellulose content (14.73% vs. 14.00%), while OB showed slightly higher cellulose content (39% vs. 31%) and slightly lower hemicellulose levels (24% vs. 28% obtained here).
Klason lignin was higher in the leaves (21.64%) than in the branches (16.40%) (Table 2), implying that the leaves may require additional rigidity or protection against biotic and abiotic stress factors. Similarly, in the work by Alshammari et al. [38], OL had higher lignin content (16.33%) than OB (13.26%). Gullón et al. [14] reported lignin content (acid-insoluble plus acid-soluble) that was relatively similar between olive tree prunings (17.7%) and leaves (17.1%), which was slightly lower than the values obtained here. Similar results were presented by Mabrouk et al. [36], with 17% lignin for olive leaves of the Chemlali variety. However, Mateo et al. [39] reported a lignin value of 25.9% for olive leaves, which is higher than that obtained here. These differences have important implications for valorization pathways: branch-based materials are better suited for applications requiring high structural carbohydrate content (e.g., biofuels, biocomposites), while leaf biomass may offer advantages for the extraction of bioactive compounds and nutrients.
The ash content, which reflects the inorganic mineral composition of biomass, consistently appears higher in olive leaves compared to woody fractions. In the present study, olive leaves (OL) show significantly higher ash content (4.08%) than olive branches at 2.79% (Table 2), supporting the idea that the leaves accumulate more inorganic nutrients. This trend was also evident in earlier data, where olive leaves had ash content of 6.9%, compared to just 3.9% in olive prunings [14]. Even higher values were presented for the Chemlali variety, with 7% ash content [36]. Although the absolute values differ, the relative relationship remains consistent across both studies. This elevated mineral content in the leaves further supports their roles in nutrient transport and storage and suggests their potential utility in applications where mineral-rich biomass is desirable, such as soil amendments or as feedstock for nutrient recovery processes. On the other hand, the large amount of ash in the leaves makes them inappropriate for pellet production.
3.2. Effects of Temperature on Liquefaction
The results presented in Figure 1 indicate the effects of the temperature on the liquefaction percentages of the two olive tree byproducts, olive leaves (OL) and olive branches (OB). The data reveal a clear trend whereby increasing the temperature from 140 °C to 180 °C leads to higher liquefaction percentages for both materials. Similar results were presented before for different lignocellulosic materials, such as corncob [40], wheat straw [23], cork [16,41], or wood [42]. Nevertheless, in some cases, the liquefaction percentage decreases at higher temperatures due to condensation reactions, as, for example, in the liquefaction of Eucalyptus pellita [43] or cork [44].
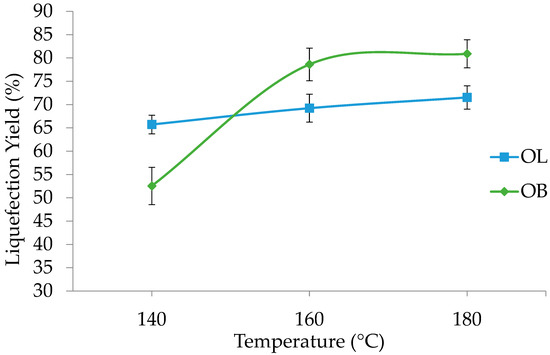
Figure 1.
Liquefaction yield variation with temperature for olive leaves (OL) and branches (OB). Standard deviation in error bars.
At 140 °C, olive leaves exhibit a liquefaction percentage of 66%, while olive branches have a noticeably lower value at 52.5%. As the temperature increases to 160 °C, that of olive tree leaves rises to 69%, whereas olive branches show a marked increase to 78.6%. At 180 °C, olive leaves reach 72%, while the value for olive branches further increases to 80.9%.
These results suggest that the temperature exerts a critical influence on liquefaction, likely by decreasing the viscosity, which is very important since glycerol and ethylene glycol are very viscous, and, by facilitating molecular mobility, the breakdown of the complex structure of biomass is enabled. Olive branches undergo a more pronounced change between 140 °C and 160 °C, where their liquefaction percentage increases by approximately 26%. Beyond 160 °C, the rate of increase diminishes, implying the existence of a threshold temperature at which the most significant structural breakdown occurs. By contrast, the liquefaction of olive leaves follows a more gradual trend, indicating a comparatively stable response to thermal processing.
The distinct behaviors of olive leaves and olive branches can be attributed to differences in their compositional and structural properties. Olive branches contain a higher percentage of structural components (74.7%, against 54.2%), which could explain the steeper rise in liquefaction under higher temperatures. From a practical standpoint, these findings suggest that temperatures above 160 °C deliver weakening yields and liquefaction efficiency for olive branches, highlighting a potential temperature range where the energy input can be optimized relative to the liquefaction output.
Comparing the liquefaction percentage with those of other lignocellulosic materials under similar conditions, there are only slight differences. For instance, that of corncob liquefied at 160 °C for 60 min with a similar 3% catalyst reached 80%, similar to OB [40]. The liquefaction of wheat straw at a similar liquefaction time and temperature but with a 2% catalyst and different polyalcohols ratios reached a higher percentage of around 90% [23]. On the other hand, the liquefaction of strawberry tree bark under similar conditions obtained a much higher percentage of residues, reaching only a 60% liquefaction percentage [45]. These differences are most likely due to the different chemical compositions of the materials. For example, strawberry tree bark has much higher lignin content and possibly some suberin, which are more difficult to liquefy than carbohydrates. A recent study on the prediction of biopolyol yields determined that the most important factors influencing the yield were the reaction time (15.1%), lignin content (13.1%), and glycerol mass (12%) [26].
3.3. Effects of Liquefaction Time
Figure 2 shows the impact of varying reaction times on the liquefaction percentages of olive leaves (OL) and olive branches (OB). At 15 min, OL exhibit a liquefaction percentage of 57%, while that of OB is higher at 68.8%. As the reaction proceeds to 30 min, the value for OL increases to 62%, whereas OB shows a more pronounced rise to 77.1%. Extending the reaction time to 60 min leads to a further increase for both materials, with OL reaching 72% and OB reaching 80.9%.
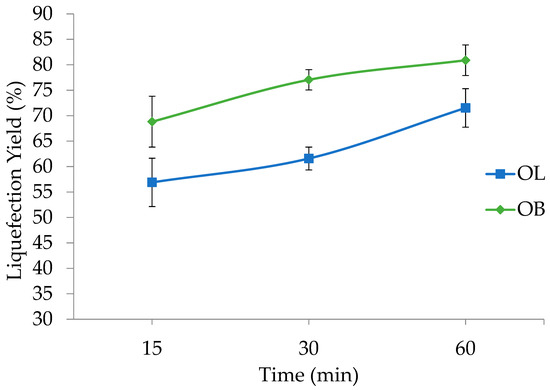
Figure 2.
Liquefaction yield variation with time for olive leaves (OL) and branches (OB). Standard deviation in error bars.
These findings indicate that prolonging the reaction time enhances liquefaction for both olive leaves and olive branches. Although OL demonstrate a steady upward trend, OB consistently maintain higher liquefaction values, indicating faster or more complete breakdown under the same reaction times. These results underscore the importance of optimizing the reaction time to balance energy inputs against the degree of liquefaction desired, particularly when working with different olive byproducts.
3.4. Effects of Particle Size on Liquefaction
Figure 3 presents the liquefaction percentages for olive leaves (OL) and olive branches (OB) as a function of the particle size range, with categories defined as >40, 40–60, 60–80, and <80. In general, olive branches exhibit higher liquefaction values compared to olive leaves across all granulometries. For OB, the highest liquefaction is observed in the 40–60 fraction, reaching 84.3%, while the lowest is in the 60–80 range at 78.1%. Conversely, olive leaves show a more gradual increase in liquefaction with finer particle sizes, rising from 68% in the >40 category to 70% in the 40–60 range and reaching a plateau of 72% for both the 60–80 and <80 fractions.
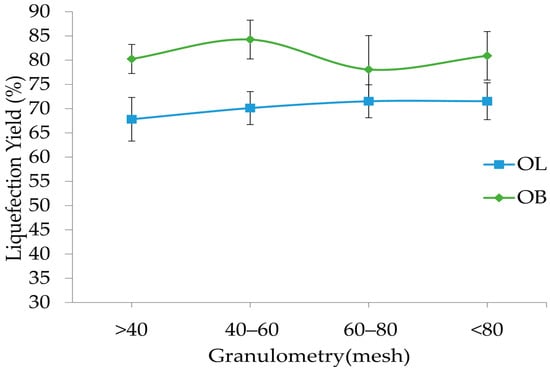
Figure 3.
Liquefaction yield variation with particle granulometry for olive leaves (OL) and branches (OB). Standard deviation in error bars.
These results suggest that the particle size plays a significant role in the liquefaction process and that, generally, greater liquefaction can be achieved with smaller particles. The superior performance of olive branches in the 40–60 particle size fraction, compared to smaller particles, may be attributed to differences in chemical composition between the fractions, possibly due to varying bark content. Such composition variation across particle sizes has been previously reported in other biomass materials [46,47,48]. This difference could be due to variations in lignocellulosic content or other compositional factors between the two materials. Overall, the data emphasize that controlling the granulometry is crucial in optimizing liquefaction, especially when processing olive branches, where the particle size distribution markedly influences the efficiency of the conversion process.
3.5. Effects of Material/Solvent Ratio on Liquefaction
Figure 4 shows the effects of the material/solvent ratio on the liquefaction percentages of olive leaves (OL) and olive branches (OB). For olive leaves, the liquefaction percentage starts at a relatively low value of 36% at a 1:3 ratio and increases progressively to 61% at 1:5 and 68% at 1:7, finally reaching 72% at a 1:10 ratio. This steady improvement suggests that an increased amount of solvent relative to the material significantly enhances the breakdown of olive leaves, possibly by facilitating better heat transfer and the more efficient solvation of the compounds responsible for the liquefaction process.
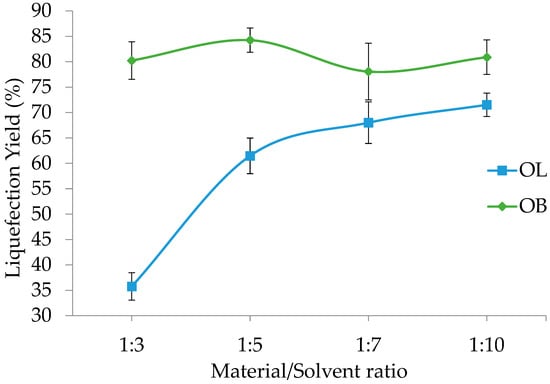
Figure 4.
Liquefaction yield variation with material/solvent ratio for olive leaves (OL) and branches (OB). Standard deviation in error bars.
In contrast, olive branches show a different trend. At a 1:3 ratio, the liquefaction percentage is already high at 80.2%, and it reaches its maximum of 84.3% at a 1:5 ratio. However, there is a slight decrease to 78.1% at a 1:7 ratio, followed by recovery to 80.9% at a 1:10 ratio. This pattern indicates that olive branches are less sensitive to changes in the material/solvent ratio than olive leaves, likely due to differences in their chemical composition and structural properties. The optimal solvent ratio for olive branches appears to be around 1:5, where liquefaction is maximized, suggesting that, beyond this point, additional solvent does not significantly improve—and may even slightly hinder—the conversion process.
These results emphasize the importance of tailoring the material/solvent ratio to the specific characteristics of the feedstock. For olive leaves, increasing the solvent proportion leads to a marked enhancement in liquefaction, which may be attributed to the improved penetration of the solvent into the leaf matrix and more effective reaction kinetics. For olive branches, the process seems to reach an optimum more quickly, and further increases in solvent do not yield a proportional improvement in liquefaction efficiency. Understanding these differences is critical in optimizing the processing conditions and achieving the most efficient conversion of these olive byproducts.
The results obtained from varying the operational parameters, temperature, reaction time, granulometry, and material/solvent ratio offer a comprehensive view of the liquefaction behavior of these two olive byproducts: olive leaves (OL) and olive branches (OB).
An increase in temperature from 140 °C to 180 °C positively affects the liquefaction process for both materials. Olive leaves display a gradual improvement, with liquefaction rising from 66% at 140 °C to 72% at 180 °C. In contrast, olive branches respond more markedly to temperature changes; starting at 52.5% at 140 °C, their liquefaction significantly increases to 80.9% at 180 °C. This suggests that olive branches may be more susceptible to thermally induced structural breakdown, potentially due to differences in their lignocellulosic composition. Although the difference is slight, olive leaves have been shown to exhibit crystallinity of 64.1%, lower than the 65.4% observed in olive stems [38]. The slightly more crystalline structure in OB make them generally more resistant to chemical and enzymatic degradation under mild conditions. However, under elevated temperatures, these crystalline regions break down rapidly once a critical threshold is reached. This behavior aligns with the observed sharp increase in liquefaction for OB at higher temperatures, suggesting that, once sufficient thermal energy disrupts the crystalline domains, structural degradation accelerates significantly.
The reaction time is another critical factor influencing the conversion process. For olive leaves, extending the reaction from 15 to 60 min results in an increase in liquefaction from 57% to 72%. Olive branches also show improvements with longer reaction times, achieving liquefaction levels of 68.8% at 15 min and reaching 80.9% at 60 min. Notably, olive branches tend to reach high conversion levels faster, which may be attributed to their inherent material properties that favor quicker degradation under thermal conditions.
The effect of the particle size, as assessed by granulometry, further highlights the distinct responses of the two materials. Olive leaves exhibit a modest increase in liquefaction with finer particles, rising from 68% for particles larger than 40 mesh to 72% for both the 60–80 and finer fractions. Olive branches, however, show an optimal response in the 40–60 mesh range, achieving a maximum liquefaction rate of 84.3%, while a slight decrease is observed with further reductions in particle size. This behavior indicates that an intermediate particle size may provide the best balance between the available surface area and structural integrity for the efficient liquefaction of olive branches.
The material/solvent ratio also plays a pivotal role in the liquefaction process. For olive leaves, an increase in the solvent proportion from a 1:3 to a 1:10 ratio enhances liquefaction dramatically from 36% to 72%. This improvement likely results from better solvent penetration and more efficient interaction with the reactive components of the leaves. Conversely, olive branches achieve relatively high liquefaction even at a lower solvent ratio, starting at 80.2% for a 1:3 ratio and peaking at 84.3% for a 1:5 ratio. Further increases in the solvent ratio do not significantly improve the performance for olive branches, suggesting that their optimal liquefaction can be attained under less solvent-intensive conditions.
Overall, these integrated results demonstrate that the optimal liquefaction conditions are highly dependent on the specific characteristics of the feedstock. Olive branches, with their more rapid response to temperature changes and lower solvent requirements, contrast with olive leaves, which benefit from longer reaction times and higher solvent ratios. The interplay between the temperature, time, particle size, and solvent availability underscores the need for tailored process optimization to maximize the conversion efficiency in the liquefaction of diverse olive byproducts.
3.6. FTIR Spectra of Liquefied Olive Branches and Solid Residues
The FTIR spectra of the solid residues obtained after the liquefaction of OB for 60 min at increasing temperatures (140 °C, 160 °C, and 180 °C) and liquefied at 180 °C with different times (15, 30, and 60 min), respectively, are presented in Figure 5.
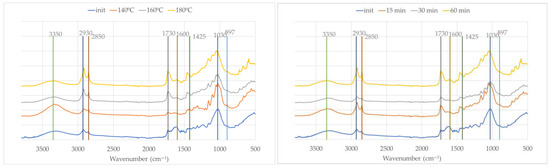
Figure 5.
FTIR spectra of initial material (OB) and solid residue after liquefaction at different temperatures (left) and times (right).
These spectra reveal significant chemical changes indicating progressive biomass degradation. The original sample shows the typical absorption bands of lignocellulosic materials: broad O–H stretching near 3350 cm−1, C–H stretching at 2930 cm−1 and 2850 cm−1, and distinct bands at 1730 cm−1, 1600 cm−1, and 1425 cm−1 linked to carbonyl and aromatic vibrations, mainly from lignin and hemicellulose. In relation to the O–H stretching band, there are no consistent changes with temperature, with an increase for 140 °C and a decrease afterwards, which could be due to some unreacted solvents (glycerol and ethylene glycol) present in the solid residue.
As the temperature and reaction time increase, the intensities of the bands at 2930 cm−1 and 2850 cm−1 become progressively stronger, indicating the incorporation or generation of aliphatic chains, likely due to the presence of polyalcohols and the fragmentation of the biomass into more reduced, saturated compounds [49]. This is consistent with the known behavior of glycerol and ethylene glycol under acidic or thermal conditions, where they can participate in transesterification or esterification reactions and contribute to the formation of new C–H bonds [50].
The carbonyl band at 1730 cm−1 becomes more prominent with both temperature and time, suggesting the formation of esters and other oxygenated degradation products, possibly through the oxidative cleavage of hemicellulose or lignin side chains. This increase has been reported before—for example, regarding the residues in the polyalcohol liquefaction of Lodgepole Pine bark [51]. In contrast, the band at 1600 cm−1, attributed to aromatic C=C stretching in lignin, diminishes steadily, pointing to the degradation or transformation of the aromatic backbone of lignin.
In the fingerprint region (1300–1030 cm−1), a general increase in absorbance is observed, particularly with longer reaction times and higher temperatures. This region is mostly associated with C–O stretching vibrations in glycosidic linkages in cellulose and hemicellulose or aliphatic alcohols such as ethylene glycol and glycerol [52]. It therefore supports the increasing presence of alcohols, ethers, and esters. These signals are consistent with the contributions of glycerol and ethylene glycol as reactants and carriers of hydroxyl functionalities. In accordance with Kobayashi et al. [53], the bands at 1100–1200 cm−1 originate from the liquefaction solvent, indicating that it is incorporated into the residue.
Overall, the spectral evolution indicates that the solid residue is not unreacted material but rather undergoes extensive chemical modification during liquefaction.
Figure 6 presents the initial olive branches and the liquefied materials at different temperatures and liquefaction times. It is important to consider that the initial material is in solid form, while the liquefied samples are primarily liquid. As a result, the initial spectrum displays lower absorption intensities, which is a known characteristic of FTIR-ATR when comparing solids to liquids due to differences in contact efficiency and penetration depth at the ATR crystal interface, as stated before [45].
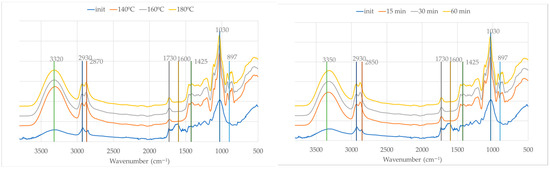
Figure 6.
FTIR spectra of initial material (OB) and liquid fraction after liquefaction at different temperatures (left) and times (right).
In Figure 6 (left), which illustrates the influence of the temperature after 60 min of reaction time, a progressive change in spectral features is observed with increasing temperatures (140 °C, 160 °C, and 180 °C). The broad O–H stretching band is centered around 3320 cm−1 for the liquefied material and 3350 cm−1 for the initial material and becomes significantly more intense in the liquefied material. This enhancement is attributed not only to the improved signal due to the liquid state but also to the cleavage of ether and ester bonds in the biomass matrix, leading to the release or formation of additional hydroxyl-containing species such as alcohols and polyols from glycerol and partially degraded lignocellulosic fragments.
The aliphatic C–H stretching bands near 2930 cm−1 and 2870 cm−1 (2850 in initial material) show slight shifts and an increased intensity, indicating the accumulation of alkyl fragments resulting from the breakdown of lignin and other aliphatic components of the biomass. This effect becomes more pronounced at 180 °C, suggesting more extensive degradation.
At around 1730 cm−1, the sharpening of the carbonyl band is evident with increasing temperatures, pointing to the formation of esters, aldehydes, or carboxylic acids. These compounds are likely products of cellulose and hemicellulose oxidation and esterification reactions. According to Kobayashi et al. [53], this increase can be attributed to levulinic acid produced from the degradation of cellulose, which has a strong absorption band around 1724 cm−1.
Near 1600 cm−1, the spectra display changes indicative of aromatic ring vibrations. These changes suggest the partial degradation or chemical transformation of lignin structures. The band around 1030 cm−1 becomes more intense in the liquefied material, consistent with the generation of C–O stretching vibrations from alcohols, ethers, and esters formed during the liquefaction process.
Meanwhile, the band near 897 cm−1, commonly associated with β-glycosidic linkages in cellulose, seems to be reduced significantly as the temperature increases. This reduction is a clear indication of cellulose depolymerization, which is a central aspect of the liquefaction process.
The appearance of new bands at 861 cm−1, 883 cm−1, and 923 cm−1 in the FTIR spectra of liquefied olive branches suggests the formation of new chemical structures during the liquefaction process. These bands fall within the 900–850 cm−1 region, which is commonly associated with C–H out-of-plane bending vibrations in substituted alkenes, aromatic compounds, and carbohydrate-derived structures. In particular, the band at around 923 cm−1 is often associated with C–O stretching and C–C stretching in aliphatic ethers or sugar ring breathing modes in structures derived from cellulose degradation products like levoglucosan or oligomeric carbohydrates.
Strong absorption at 923 cm−1 was found in the FTIR spectrum of water-insoluble pyrolytic cellulose from cellulose pyrolysis oil [54]. On the other hand, this band at 923 cm−1 has also been attributed to the C–H in-plane bending of aromatic compounds [55]. The band at 860.4 cm−1 has been attributed previously to hydroxyacetaldehyde from cellulose thermal degradation [56].
Figure 6 (right) focuses on the effects of the reaction time at a constant temperature of 180 °C. Over time (15, 30, and 60 min), similar trends are observed. The O–H stretching band near 3350 cm−1 intensifies, reflecting the ongoing breakdown of biomass and the formation of hydroxylated species. Likewise, the C–H stretching bands around 2930 cm−1 and 2850 cm−1 become more defined, supporting the increasing aliphatic content from degradation products.
The carbonyl band at 1730 cm−1 also strengthens with the liquefaction time, similarly to the temperature. The 1030 cm−1 band continues to grow in intensity with prolonged reaction times, reinforcing the accumulation of oxygenated functionalities. As in the temperature experiment, the 897 cm−1 cellulose band decreases and several bands appear in this region, confirming the time-dependent cellulose degradation.
Overall, the spectral evolution in both sets of experiments demonstrates the effectiveness of acid-catalyzed liquefaction in transforming solid biomass into a more reactive, oxygenated liquid phase.
In the FTIR-ATR spectra of liquefied lignocellulosic materials, several bands are shifted, such as the O–H stretching band shifting from 3350 cm−1 to 3320 cm−1 and the C–H stretching band shifting from 2850 cm−1 to 2870 cm−1, which are indicative of changes in the chemical environment and molecular interactions resulting from the liquefaction process.
The shift in the O–H stretching band from 3350 to 3320 cm−1 suggests an increase in hydrogen bonding. In the initial solid material, O–H groups may be engaged in relatively weak hydrogen bonds or remain partially free. After liquefaction, due to depolymerization, the exposure of internal hydroxyl groups, or the formation of polyol-rich structures, the number and strength of hydrogen bonds often increase. Stronger hydrogen bonding leads to a red shift (lower wavenumber) in the O–H stretching vibration, as the bond becomes longer and weaker due to greater interaction with adjacent electronegative atoms [57].
The shift in the C–H stretching band from 2850 to 2870 cm−1, in contrast, is a blue shift (to a higher wavenumber). This can result from a change in the chemical environment of aliphatic –CH2– or –CH3 groups. During liquefaction, the decomposition of biopolymers and the formation of new, shorter-chain aliphatic compounds or branched structures can reduce steric hindrance or electron-withdrawing effects, making the C–H bonds vibrate at slightly higher frequencies. In some cases, this may also reflect phase changes (e.g., from crystalline to amorphous) or interactions with newly formed polar groups, which alter the electron density around the C–H bonds.
3.7. FTIR Spectra of Liquefied Olive Leaves and Solid Residues
The FTIR-ATR spectra of olive leaves and the solid residues after acid-catalyzed liquefaction at varying temperatures (140 °C, 160 °C, and 180 °C for 60 min) and times (15 min, 30 min, and 60 min at 180 °C) (Figure 7) reveal significant structural and compositional changes, many of which resemble those observed for olive branches, yet with notable differences reflective of the distinct biochemical makeup of the leaves. The FTIR spectrum of the initial olive leaves is similar to that of olive branches but with higher absorption at 2930 cm−1 in relation to 2850 cm−1, possibly due to the large amount of extractives and weaker absorption at 1030 cm−1, which is likely due to the smaller amount of polysaccharides, as seen before (Table 2).
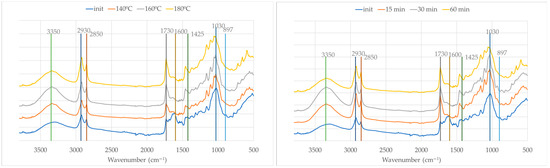
Figure 7.
FTIR spectra of initial material (OL) and solid residues after liquefaction at different temperatures (left) and times (right).
The FTIR spectra of the solid residues after liquefaction reveal significant chemical changes for olive leaves during liquefaction at increasing temperatures and times, similarly to olive branches. The broad O–H stretch at around 3350 cm−1 intensifies. Enhanced C–H stretching bands at 2930 cm−1 and 2850 cm−1 suggest increased aliphatic content. A sharp C=O band at 1730 cm−1 appears in the solid residue, especially at 160 °C and 180 °C, reflecting the degradation of polysaccharides and formation of carbonyl-rich compounds. The aromatic ring vibration at 1600 cm−1 weakens, pointing to lignin modification, while the weakening of the bands at 1030 cm−1 and 897 cm−1 confirms the extensive breakdown of cellulose and hemicellulose.
The FTIR-ATR spectra presented in Figure 8 provide insights into the structural and chemical transformations occurring during the liquefaction of olive leaf biomass using polyalcohols.
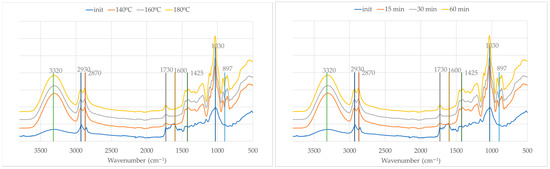
Figure 8.
FTIR spectra of initial material (OL) and liquid fraction after liquefaction at different temperatures (left) and times (right).
As with the branch samples, the initial (solid) olive leaf spectrum displays relatively lower absorption intensities due to the inherent limitations of ATR in solid materials. Upon liquefaction, the increase in absorbance across all regions is not only a result of improved contact with the ATR crystal in the liquid state but also indicative of chemical transformations occurring in the biomass.
Similarly to olive branches, the broad and intense band at around 3320 cm−1, attributed to O–H stretching vibrations, increases in intensity after liquefaction. Likewise, the bands at 2930 cm−1 and 2870 cm−1, corresponding to C–H stretching vibrations in aliphatic chains, become more pronounced, indicating an increase in alkyl group content as a result of thermal cleavage and the reorganization of biomass components.
The distinct band at 1730 cm−1, characteristic of C=O stretching vibrations from esters, aldehydes, or carboxylic acids, intensifies with increasing temperatures and times. This suggests oxidative degradation and the cleavage of ester linkages within hemicellulose and lignin structures, leading to the formation of carbonyl-containing compounds. The band at 1600 cm−1, typically associated with aromatic skeletal vibrations from lignin, also decreases, implying the partial preservation and transformation of aromatic moieties during liquefaction.
The band around 1030 cm−1, attributed to C–O stretching vibrations in alcohols and ethers, shows substantial growth in intensity, especially at higher temperatures and longer reaction times. This observation highlights the extensive breakdown of polysaccharides such as cellulose and hemicellulose into smaller polyol- and ether-containing compounds. Simultaneously, there is a decrease in the intensity of the band at 897 cm−1 and the appearance of new bands in this region, as seen for olive branches.
The results demonstrate that both the temperature and time play critical roles in driving the chemical transformation, with 180 °C for 60 min representing the most efficient conditions to achieve the extensive breakdown of the biomass and the generation of polyol-rich liquefied products.
The FTIR spectra indicate that, although olive branches and olive leaves follow similar degradation pathways during liquefaction, there are differences reflecting their distinct chemical compositions. Olive leaves show stronger absorption at 2930 and 2850 cm−1, suggesting higher aliphatic content likely due to their greater amounts of extractives, while branches exhibit more pronounced signals at 1030 and 897 cm−1, indicating higher polysaccharide content.
The O–H stretching band around 3350–3320 cm−1 increases in both materials after liquefaction, reflecting the formation of hydroxyl-rich compounds, but it is more intense in the leaves due to better solvent interaction. The carbonyl peak at 1730 cm−1 appears and intensifies in both, although it emerges more sharply in the leaves, especially at moderate temperatures, implying faster degradation, which is consistent with the data in Figure 1.
The aromatic C=C stretching at 1600 cm−1 decreases in both cases, but more markedly in the branches, suggesting more extensive lignin breakdown. The C–O stretching region (1300–1030 cm−1) grows in both but more gradually in the leaves. Additionally, the cellulose-associated band at 897 cm−1 weakens more clearly in the branches, while new peaks in the 923–860 cm−1 range emerge in both, indicating the formation of degradation products like levoglucosan or aliphatic ethers.
These spectral differences may also reflect underlying liquefaction kinetics, as lower lignin content predominantly enters the slow phase, while higher lignin content advances the rapid phase, possibly explaining the increased yield [26].
4. Conclusions
The comparative analysis of olive branches (OB) and olive leaves (OL) reveals distinct chemical and functional differences. OL have higher ash and extractive content, while OB contain more structural carbohydrates like cellulose and hemicellulose, indicating their support function. Lignin is higher in OL, contributing to rigidity, whereas OB’s composition favors applications such as biofuels and biocomposites due to their higher polysaccharide content. OL’s high ash content limits certain uses (e.g., pelletization) but suggests potential for soil amendment.
Liquefaction studies show that OB respond more to temperature increases, achieving higher yields due to their structural carbohydrates. OL benefit more from solvent-rich conditions and longer reaction times. The particle size also influences the efficiency, with OB favoring intermediate sizes and lower solvent ratios, indicating cost-effective processing.
The FTIR analysis confirms the extensive chemical transformations during liquefaction, including the breakdown of lignocellulosic structures and formation of reactive polyol-rich products.
These findings support tailored valorization strategies for olive residues in sustainable bioenergy and bioproduct applications.
Author Contributions
Conceptualization, I.D. and J.F.; methodology, I.D. and B.E.; software, M.F.; validation, B.E.; formal analysis, I.D., M.F. and B.E.; investigation, I.D. and B.E.; resources, I.D. and J.F.; data curation, I.D. and B.E.; writing—original draft preparation, I.D. and B.E.; writing—review and editing, I.D., M.F., J.F. and B.E.; supervision, B.E.; funding acquisition, I.D. and J.F. All authors have read and agreed to the published version of the manuscript.
Funding
This work was funded by National Funds through the FCT—Foundation for Science and Technology, I.P.—within the scope of the project Refª UIDB/00681. We would also like to thank the CERNAS Research Centre and Polytechnic University of Viseu for their support.
Institutional Review Board Statement
Not applicable.
Informed Consent Statement
Not applicable.
Data Availability Statement
Data are contained within the article.
Acknowledgments
During the preparation of this manuscript, the authors used OpenAI (2024), ChatGPT (May 13 version; https://chat.openai.com/) for the purposes of describing the results. The authors have reviewed and edited the output and take full responsibility for the content of this publication.
Conflicts of Interest
The authors declare no conflicts of interest.
References
- Espeso, J.; Isaza, A.; Lee, J.Y.; Sörensen, P.M.; Jurado, P.; Avena-Bustillos, R.D.J.; Olaizola, M.; Arboleya, J.C. Olive Leaf Waste Management. Front. Sustain. Food Syst. 2021, 5, 660582. [Google Scholar] [CrossRef]
- International Olive Council. Available online: https://www.internationaloliveoil.org/wp-content/uploads/2023/12/HO-CE901-13-12-2023-P.pdf (accessed on 22 April 2025).
- Ramírez, E.M.; Brenes, M.; Romero, C.; Medina, E. Chemical and Enzymatic Characterization of Leaves from Spanish Table Olive Cultivars. Foods 2022, 11, 3879. [Google Scholar] [CrossRef] [PubMed]
- Bruno, M.R. Variability and Chemical Composition of the Extractive Content of Woody Residues from Three European Orchard Species: Apricot (Prunus armeniaca L.), Olive (Olea europea L.), and Orange Trees (Citrus sinensis L.). JSFA Rep. 2023, 3, 82–97. [Google Scholar] [CrossRef]
- Velázquez-Martí, B.; Fernández-González, E.; López-Cortés, I.; Salazar-Hernández, D.M. Quantification of the Residual Biomass Obtained from Pruning of Trees in Mediterranean Olive Groves. Biomass Bioenergy 2011, 35, 3208–3217. [Google Scholar] [CrossRef]
- Avraamides, M.; Fatta, D. Resource Consumption and Emissions from Olive Oil Production: A Life Cycle Inventory Case Study in Cyprus. J. Clean. Prod. 2008, 16, 809–821. [Google Scholar] [CrossRef]
- Molina-Alcaide, E.; Yáñez-Ruiz, D.R. Potential Use of Olive By-Products in Ruminant Feeding: A Review. Anim. Feed Sci. Technol. 2008, 147, 247–264. [Google Scholar] [CrossRef]
- Lama-Muñoz, A.; del Mar Contreras, M.; Espínola, F.; Moya, M.; Romero, I.; Castro, E. Characterization of the Lignocellulosic and Sugars Composition of Different Olive Leaves Cultivars. Food Chem. 2020, 329, 127153. [Google Scholar] [CrossRef] [PubMed]
- Benavente-García, O.; Castillo, J.; Lorente, J.; Ortuño, A.; Del Rio, J.A. Antioxidant Activity of Phenolics Extracted from Olea europaea L. Leaves. Food Chem. 2000, 68, 457–462. [Google Scholar] [CrossRef]
- Şahin, S.; Bilgin, M. Olive tree (L.) Leaf as a Waste by-Product of Table Olive and Olive Oil Industry: A Review. J. Sci. Food Agric. 2018, 98, 1271–1279. [Google Scholar] [CrossRef] [PubMed]
- Khelouf, I.; Karoui, I.J.; Lakoud, A.; Hammami, M.; Abderrabba, M. Comparative Chemical Composition and Antioxidant Activity of Olive Leaves Olea europaea L. of Tunisian and Algerian Varieties. Heliyon 2023, 9, e22217. [Google Scholar] [CrossRef] [PubMed]
- Andrikopoulos, N.K.; Kaliora, A.C.; Assimopoulou, A.N.; Papageorgiou, V.P. Inhibitory Activity of Minor Polyphenolic and Nonpolyphenolic Constituents of Olive Oil Against In Vitro Low-Density Lipoprotein Oxidation. J. Med. Food 2002, 5, 1–7. [Google Scholar] [CrossRef] [PubMed]
- Tan, H.-W.; Tuck, K.L.; Stupans, I.; Hayball, P.J. Simultaneous Determination of Oleuropein and Hydroxytyrosol in Rat Plasma Using Liquid Chromatography with Fluorescence Detection. J. Chromatogr. B 2003, 785, 187–191. [Google Scholar] [CrossRef] [PubMed]
- Gullón, B.; Gullón, P.; Eibes, G.; Cara, C.; De Torres, A.; López-Linares, J.C.; Ruiz, E.; Castro, E. Valorisation of Olive Agro-Industrial by-Products as a Source of Bioactive Compounds. Sci. Total Environ. 2018, 645, 533–542. [Google Scholar] [CrossRef] [PubMed]
- Seth, M.; Djafar, R.; Yu, G.; Ergun, S. Catalytic Liquefaction of Biomass. In Proceedings of the Thermochemical Conversion Contractor’s Meeting, Rolla, MO, USA, 7 November 1979. [Google Scholar]
- Yona, A.M.C.; Budija, F.; Kričej, B.; Kutnar, A.; Pavlič, M.; Pori, P.; Tavzes, Č.; Petrič, M. Production of Biomaterials from Cork: Liquefaction in Polyhydric Alcohols at Moderate Temperatures. Ind. Crops Prod. 2014, 54, 296–301. [Google Scholar] [CrossRef]
- Kurimoto, Y.; Doi, S.; Tamura, Y. Species Effects on Wood-Liquefaction in Polyhydric Alcohols. Holzforschung 1999, 53, 617–622. [Google Scholar] [CrossRef]
- Kunaver, M.; Jasiukaityte, E.; Čuk, N.; Guthrie, J.T. Liquefaction of Wood, Synthesis and Characterization of Liquefied Wood Polyester Derivatives. J. Appl. Polym. Sci. 2010, 115, 1265–1271. [Google Scholar] [CrossRef]
- Juhaida, M.F.; Paridah, M.T.; Hilmi, M.M.; Sarani, Z.; Jalaluddin, H.; Mohamad Zaki, A.R. Liquefaction of Kenaf (Hibiscus cannabinus L.) Core for Wood Laminating Adhesive. Bioresour. Technol. 2010, 101, 1355–1360. [Google Scholar] [CrossRef] [PubMed]
- El-barbary, M.H.; Shukry, N. Polyhydric Alcohol Liquefaction of Some Lignocellulosic Agricultural Residues. Ind. Crops Prod. 2008, 27, 33–38. [Google Scholar] [CrossRef]
- Domingos, I.; Ferreira, J.; Cruz-Lopes, L.; Esteves, B. Polyurethane Foams from Liquefied Orange Peel Wastes. Food Bioprod. Process. 2019, 115, 223–229. [Google Scholar] [CrossRef]
- Domingos, I.; Ferreira, J.; Cruz-Lopes, L.P.; Esteves, B. Liquefaction and Chemical Composition of Walnut Shells. Open Agric. 2022, 7, 249–256. [Google Scholar] [CrossRef]
- Chen, F.; Lu, Z. Liquefaction of Wheat Straw and Preparation of Rigid Polyurethane Foam from the Liquefaction Products. J. Appl. Polym. Sci. 2009, 111, 508–516. [Google Scholar] [CrossRef]
- Jiang, W.; Kumar, A.; Adamopoulos, S. Liquefaction of Lignocellulosic Materials and Its Applications in Wood Adhesives—A Review. Ind. Crops Prod. 2018, 124, 325–342. [Google Scholar] [CrossRef]
- Evcil, T.; Tekin, K.; Ucar, S.; Karagoz, S. Hydrothermal Liquefaction of Olive Oil Residues. Sustain. Chem. Pharm. 2021, 22, 100476. [Google Scholar] [CrossRef]
- Wu, S.; Zhao, J.; Li, C.; Li, X.; Xu, Z.; Wang, H. Machine Learning Prediction of Bio-Polyol Yields and Hydroxyl Values from Acid-Catalyzed Liquefaction of Lignocellulosic Biomass. Ind. Crops Prod. 2024, 218, 119022. [Google Scholar] [CrossRef]
- Wu, K.; Lu, Q.; Cao, Q.; Dhmees, A.S.; Yang, K.; Wang, S.; Yu, J.; Hu, L.; Zhang, H. Hydrolytic and Pyrolytic Technologies of Pretreatment Lignocellulose for Production of Ethanol Fuels–A Comparative Review. Ind. Crops Prod. 2024, 218, 118840. [Google Scholar] [CrossRef]
- TAPPI. Preparation of Wood for Chemical Analysis. Test Method T 264 Cm-97; TAPPI Press: Atlanta, GA, USA, 1997. [Google Scholar]
- TAPPI. Ash in Wood, Pulp, Paper and Paperboard: Combustion at 525 Degrees C. Test Method T 211 Om-22; TAPPI Press: Atlanta, GA, USA, 2022. [Google Scholar]
- TAPPI. Solvent Extractives of Wood and Pulp. Test Method T204 Cm-07; TAPPI Press: Atlanta, GA, USA, 2007. [Google Scholar]
- TAPPI. Acid-Insoluble Lignin in Wood and Pulp. Test Method T 222 Om-02; TAPPI Press: Atlanta, GA, USA, 2002. [Google Scholar]
- ISO 21436:2020; Pulps—Determination of Acid-Soluble Lignin. International Organization for Standardization: Geneva, Switzerland, 2020.
- TAPPI. Alpha-Cellulose in Paper, Test Method T 429 Cm-23; TAPPI Press: Atlanta, GA, USA, 2023. [Google Scholar]
- Domingos, I.; Ayata, U.; Ferreira, J.; Cruz-Lopes, L.; Sen, A.; Sahin, S.; Esteves, B. Calorific Power Improvement of Wood by Heat Treatment and Its Relation to Chemical Composition. Energies 2020, 13, 5322. [Google Scholar] [CrossRef]
- Monti, A.; Di Virgilio, N.; Venturi, G. Mineral Composition and Ash Content of Six Major Energy Crops. Biomass Bioenergy 2008, 32, 216–223. [Google Scholar] [CrossRef]
- Mabrouk, A.B.; Putaux, J.-L.; Boufi, S. Valorization of Olive Leaf Waste as a New Source of Fractions Containing Cellulose Nanomaterials. Ind. Crops Prod. 2023, 202, 116996. [Google Scholar] [CrossRef]
- Garcia-Maraver, A.; Salvachúa, D.; Martínez, M.J.; Diaz, L.F.; Zamorano, M. Analysis of the Relation between the Cellulose, Hemicellulose and Lignin Content and the Thermal Behavior of Residual Biomass from Olive trees. Waste Manag. 2013, 33, 2245–2249. [Google Scholar] [CrossRef] [PubMed]
- Alshammari, B.A.; Alotaibi, M.D.; Alothman, O.Y.; Sanjay, M.R.; Kian, L.K.; Almutairi, Z.; Jawaid, M. A New Study on Characterization and Properties of Natural Fibers Obtained from Olive tree (Olea europaea L.) Residues. J. Polym. Environ. 2019, 27, 2334–2340. [Google Scholar] [CrossRef]
- Mateo, S.; Mateo, P.; Barbanera, M.; Buratti, C.; Moya, A.J. Acid Hydrolysis of Olive tree Leaves: Preliminary Study towards Biochemical Conversion. Processes 2020, 8, 886. [Google Scholar] [CrossRef]
- Zhang, H.; Ding, F.; Luo, C.; Xiong, L.; Chen, X. Liquefaction and Characterization of Acid Hydrolysis Residue of Corncob in Polyhydric Alcohols. Ind. Crops Prod. 2012, 39, 47–51. [Google Scholar] [CrossRef]
- Esteves, B.; Dulyanska, Y.; Costa, C.; Ferreira, J.V.; Domingos, I.; Pereira, H.; de Lemos, L.T.; Cruz-Lopes, L.V. Cork Liquefaction for Polyurethane Foam Production. BioResources 2017, 12, 2339–2353. [Google Scholar] [CrossRef]
- Zhai, Q.; Li, F.; Wang, F.; Xu, J.; Jiang, J.; Cai, Z. Liquefaction of Poplar Biomass for Value-Added Platform Chemicals. Cellulose 2018, 25, 4663–4675. [Google Scholar] [CrossRef]
- Abd Hilmi, N.H.; Lodin, V.; Gilbert Jesuet, M.S.; Salim, S.; Lee, S.H.; Hori, N.; Takemura, A.; Palle, I. Producing Eucalyptus pellita Wood Polyol through Liquefaction for Polyurethane Film Production. Ind. Crops Prod. 2023, 205, 117431. [Google Scholar] [CrossRef]
- Soares, B.; Gama, N.; Freire, C.; Barros-Timmons, A.; Brandão, I.; Silva, R.; Pascoal Neto, C.; Ferreira, A. Ecopolyol Production from Industrial Cork Powder via Acid Liquefaction Using Polyhydric Alcohols. ACS Sustain. Chem. Eng. 2014, 2, 846–854. [Google Scholar] [CrossRef]
- Cruz-Lopes, L.; Dulyanska, Y.; Lopes, R.; Domingos, I.; Ferreira, J.; Esteves, B. Valorization of Arbutus Unedo L. Bark Through Chemical Composition Analysis, Liquefaction, and Bio-Based Foam Production. Agronomy 2024, 14, 2893. [Google Scholar] [CrossRef]
- Miranda, I.; Gominho, J.; Mirra, I.; Pereira, H. Fractioning and Chemical Characterization of Barks of Betula Pendula and Eucalyptus Globulus. Ind. Crops Prod. 2013, 41, 299–305. [Google Scholar] [CrossRef]
- Miranda, I.; Gominho, J.; Mirra, I.; Pereira, H. Chemical Characterization of Barks from Picea Abies and Pinus Sylvestris after Fractioning into Different Particle Sizes. Ind. Crops Prod. 2012, 36, 395–400. [Google Scholar] [CrossRef]
- Ferreira, J.P.A.; Miranda, I.; Gominho, J.; Pereira, H. Selective Fractioning of Pseudotsuga Menziesii Bark and Chemical Characterization in View of an Integrated Valorization. Ind. Crops Prod. 2015, 74, 998–1007. [Google Scholar] [CrossRef]
- Jin, Y.; Ruan, X.; Cheng, X.; Lü, Q. Liquefaction of Lignin by Polyethyleneglycol and Glycerol. Bioresour. Technol. 2011, 102, 3581–3583. [Google Scholar] [CrossRef] [PubMed]
- Perez, F.M.; Gatti, M.N.; Santori, G.F.; Pompeo, F. Transformations of Glycerol into High-Value-Added Chemical Products: Ketalization and Esterification Reactions. Reactions 2023, 4, 569–634. [Google Scholar] [CrossRef]
- D’Souza, J.; Yan, N. Producing Bark-Based Polyols through Liquefaction: Effect of Liquefaction Temperature. ACS Sustain. Chem. Eng. 2013, 1, 534–540. [Google Scholar] [CrossRef]
- Habuka, A.; Yamada, T.; Nakashima, S. Interactions of Glycerol, Diglycerol, and Water Studied Using Attenuated Total Reflection Infrared Spectroscopy. Appl. Spectrosc. 2020, 74, 767–779. [Google Scholar] [CrossRef] [PubMed]
- Kobayashi, M.; Asano, T.; Kajiyama, M.; Tomita, B. Analysis on Residue Formation during Wood Liquefaction with Polyhydric Alcohol. J. Wood Sci. 2004, 50, 407–414. [Google Scholar] [CrossRef]
- Wei, X.; Lu, Q.; Sui, X.; Wang, Z.; Zhang, Y. Characterization of the Water-Insoluble Pyrolytic Cellulose from Cellulose Pyrolysis Oil. J. Anal. Appl. Pyrolysis 2012, 97, 49–54. [Google Scholar] [CrossRef]
- Yang, X.; Lyu, H.; Chen, K.; Zhu, X.; Zhang, S.; Chen, J. Selective Extraction of Bio-Oil from Hydrothermal Liquefaction of Salix Psammophila by Organic Solvents with Different Polarities through Multistep Extraction Separation. BioResources 2014, 9, 5219–5233. [Google Scholar] [CrossRef]
- Li, S.; Lyons-Hart, J.; Banyasz, J.; Shafer, K. Real-Time Evolved Gas Analysis by FTIR Method: An Experimental Study of Cellulose Pyrolysis. Fuel 2001, 80, 1809–1817. [Google Scholar] [CrossRef]
- Joseph, J.; Jemmis, E.D. Red-, Blue-, or No-Shift in Hydrogen Bonds: A Unified Explanation. J. Am. Chem. Soc. 2007, 129, 4620–4632. [Google Scholar] [CrossRef] [PubMed]
Disclaimer/Publisher’s Note: The statements, opinions and data contained in all publications are solely those of the individual author(s) and contributor(s) and not of MDPI and/or the editor(s). MDPI and/or the editor(s) disclaim responsibility for any injury to people or property resulting from any ideas, methods, instructions or products referred to in the content. |
© 2025 by the authors. Licensee MDPI, Basel, Switzerland. This article is an open access article distributed under the terms and conditions of the Creative Commons Attribution (CC BY) license (https://creativecommons.org/licenses/by/4.0/).