Article

The Impact of Green Finance on Agricultural Pollution: Analysis of the Roles of Farmer Behavior, Digital Infrastructure, and Innovation Capability

College of Economics and Management, Fujian Agriculture and Forestry University, Fuzhou 350002, China
*
Author to whom correspondence should be addressed.
Sustainability 2025, 17(15), 6736; https://doi.org/10.3390/su17156736
Submission received: 22 June 2025 / Revised: 14 July 2025 / Accepted: 15 July 2025 / Published: 24 July 2025

Abstract

This study investigates the mechanisms by which green finance mitigates non-point source pollution. Based on provincial panel data from China spanning 2005 to 2023, this study conducts an empirical analysis that yields several key findings: (1) The development of green finance significantly reduces the intensity of agricultural non-point source pollution. (2) Green finance indirectly contributes to pollution reduction by incentivizing farmers to adopt environmentally sustainable production practices. (3) The pollution control effects of green finance are amplified in regions with advanced digital infrastructure. (4) The impact of green finance on agricultural pollution demonstrates a threshold effect associated with regional innovation capacity—only when innovation capability exceeds a certain threshold does the emission reduction effect of green finance become evident. Theoretically, this study broadens the research dimensions of green finance by integrating farmer behavioral factors and revealing boundary conditions related to technology and innovation. Policy implications include the need to tailor green financial products for agriculture, accelerate the development of rural digital infrastructure, and implement innovation-driven differentiated policies to enhance precision.

1. Introduction

In light of the evolving landscape of global climate governance and the progressive implementation of the United Nations Sustainable Development Goals (SDGs), environmental sustainability has emerged as a pivotal strategic concern in shaping global economic transformation and societal progress. Agriculture, as the foundation of global food security and social stability, has experienced significant growth in output value, driven by technological innovation and productivity improvements. However, the environmental costs associated with agricultural production activities are increasingly evident and have become one of the key drivers of global ecological degradation [1]. Existing data indicate that 80 percent of water bodies and 50 percent of the global land area are affected by agricultural non-point source pollution (ANPS), with approximately 75 percent of the area suffering from nitrogen (N) and phosphorus (P) pollution [2]. Agricultural surface pollution has surpassed industrial and domestic pollution as the primary cause of global water quality deterioration and has even been recognized by the US Environmental Protection Agency as the primary source of the degradation of rivers, lakes and wetlands [3].
Agricultural non-point source pollution (ANPS) primarily arises from the runoff of nutrients such as nitrogen and phosphorus during agricultural production, as well as from the inadequate management of livestock waste, rural solid waste, and domestic wastewater. This pollution ultimately leads to significant degradation of aquatic environments. It predominantly results from the overuse of chemical inputs, including fertilizers, pesticides, and agricultural films, alongside the improper disposal of livestock and poultry waste. These practices are characterized by hidden emission pathways, wide spatial distribution, and substantial treatment challenges [4,5], leading to a series of ecological problems, such as the eutrophication of water bodies, soil degradation, and a loss of biodiversity. In recent years, global agricultural non-point source pollution has garnered continuous attention. Without the implementation of effective technological interventions and reform measures, the negative environmental impact of agriculture could increase by 50% to 90% by 2050, compared to 2010 levels, thereby surpassing the planet’s safe carrying capacity [6].
As a major agricultural development country, China faces significant pollution challenges [7]. Statistics indicate that agricultural sources account for 34.2% of the nation’s total ammonia and nitrogen emissions [8]. Furthermore, the application rates of fertilizers and pesticides per unit of arable land significantly exceed international safety thresholds [9,10]. In response to these challenges, the Chinese government has prioritized agricultural green development as a national strategy, establishing policy frameworks such as the National Agricultural Sustainable Development Plan (2015–2030) and the Soil Pollution Prevention and Control Action Plan [11]. Additionally, a series of agricultural pollution control standards and emission reduction targets have been implemented. These policies particularly underscore the vital role of green financial instruments in facilitating the green transformation and upgrading of the agricultural sector.
In recent years, green finance has become an increasingly important policy tool for managing the agri-environment. The core function of these funds is to channel capital flows towards sustainable agriculture through market-based mechanisms, thereby achieving the dual objectives of economic growth and ecological protection [12]. Green finance is considered a form of institutional innovation, encompassing a variety of specific financial instruments, including low-interest loans, risk compensation, and green certification. A central tenet of green finance is the prioritization of environmental externalities in the process of resource allocation. Unlike conventional financial practices, its main role is to prevent and regulate environmental hazards, while facilitating a transition from ‘end-of-pipe management’ to ‘prevention at the source’ in the agricultural sector [13].
Extensive research has demonstrated that green finance can influence various aspects of agricultural production through multiple approaches, thereby helping to reduce agricultural non-point source pollution (ANSP). For instance, the provision of incentives, such as preferential credit and insurance subsidies, has been shown to encourage farmers to decrease their reliance on highly polluting inputs, such as chemical fertilizers and pesticides, while promoting the adoption of environmentally friendly production technologies, including water-saving irrigation and ecological planting [14,15]. Furthermore, the development of green finance holds the potential to support the expansion of agricultural operations and the realignment of industrial structures [16], improve resource utilization efficiency, and establish an environmentally sustainable trajectory for agricultural development. Preliminary empirical research on the relationship between green finance and ANSP has shown promising results. A study based on Chinese provincial panel data indicates that for every 1 percentage point increase in the level of green finance development, the intensity of agricultural surface pollution decreases by an average of approximately 0.432% [17]. This negative correlation is primarily achieved through mechanisms such as strengthening environmental regulation, land transfer, and the adoption of green technologies [17]. However, critical gaps persist, including an insufficient understanding of micro-level behavioral mechanisms (e.g., farmers’ production practices as mediators), limited exploration of moderating variables (e.g., the influence of digital infrastructure), and inadequate analysis of potential nonlinear effects in the pollution reduction function of green finance.
This study significantly contributes to the existing literature in three key areas: (1) It pioneers the introduction of a micro-behavioral perspective. While most current research concentrates on the macro-environmental impacts of green finance policies and has established that their negative correlation is primarily achieved through mechanisms such as the strengthening of environmental regulations and the promotion of land transfer [17], these studies often overlook the micro-level mechanisms by which these policies affect emission reduction through individual behavioral pathways. This paper constructs, for the first time, a theoretical framework of “green finance–green behavior–pollution reduction,” incorporating farmers’ green production behaviors as a mediating pathway and empirically validating it, thereby revealing the core micro-level logic of how green finance policies take effect. (2) It identifies the critical moderating role of digital infrastructure. Although existing studies have acknowledged the role of digitalization in agricultural pollution control [18], they generally overlook the systematic impact of digital infrastructure as a key enabling factor on the governance efficacy of green finance. This paper systematically evaluates, for the first time, its amplifying effect on the efficiency of green finance in promoting agricultural green transformation, uncovering the technology-enabled logic of the “digital–green” synergy mechanism and providing a new perspective for understanding the pathways through which digitalization empowers green development. (3) It reveals nonlinear relationships and threshold effects. While most existing studies are based on linear assumptions [19], this paper employs a threshold regression model to identify, for the first time, the nonlinear characteristics of green finance’s environmental effects triggered by regional innovation capacity. It verifies the dynamic relationship that exhibits significant variations with changes in regional innovation levels, providing robust empirical evidence for formulating differentiated policies tailored to local development levels.

2. Theoretical Analysis and Research Hypotheses

The governance of agricultural non-point source pollution through green finance operates within a multi-dimensional theoretical framework that integrates environmental economics, behavioral science, and technological innovation systems. Building upon Pigou’s foundational externality theory, contemporary research indicates that green finance serves as an institutional corrective mechanism, functioning through both direct market interventions and indirect behavioral modifications. This theoretical exploration unfolds across four interconnected dimensions: (1) the fundamental inhibitory effect of green financial instruments on pollution externalities, (2) the behavioral transformation mechanisms informed by planned behavior theory, (3) the technological empowerment facilitated by digital infrastructure, and (4) the threshold-dependent innovation capacity that determines policy effectiveness. Collectively, these theoretical perspectives (see Figure 1) establish a comprehensive framework for understanding how financial mechanisms can facilitate the transition of agricultural systems toward sustainable practices, while considering regional heterogeneities in technological readiness and innovation capacity. The research design of this paper is shown in Figure 1.

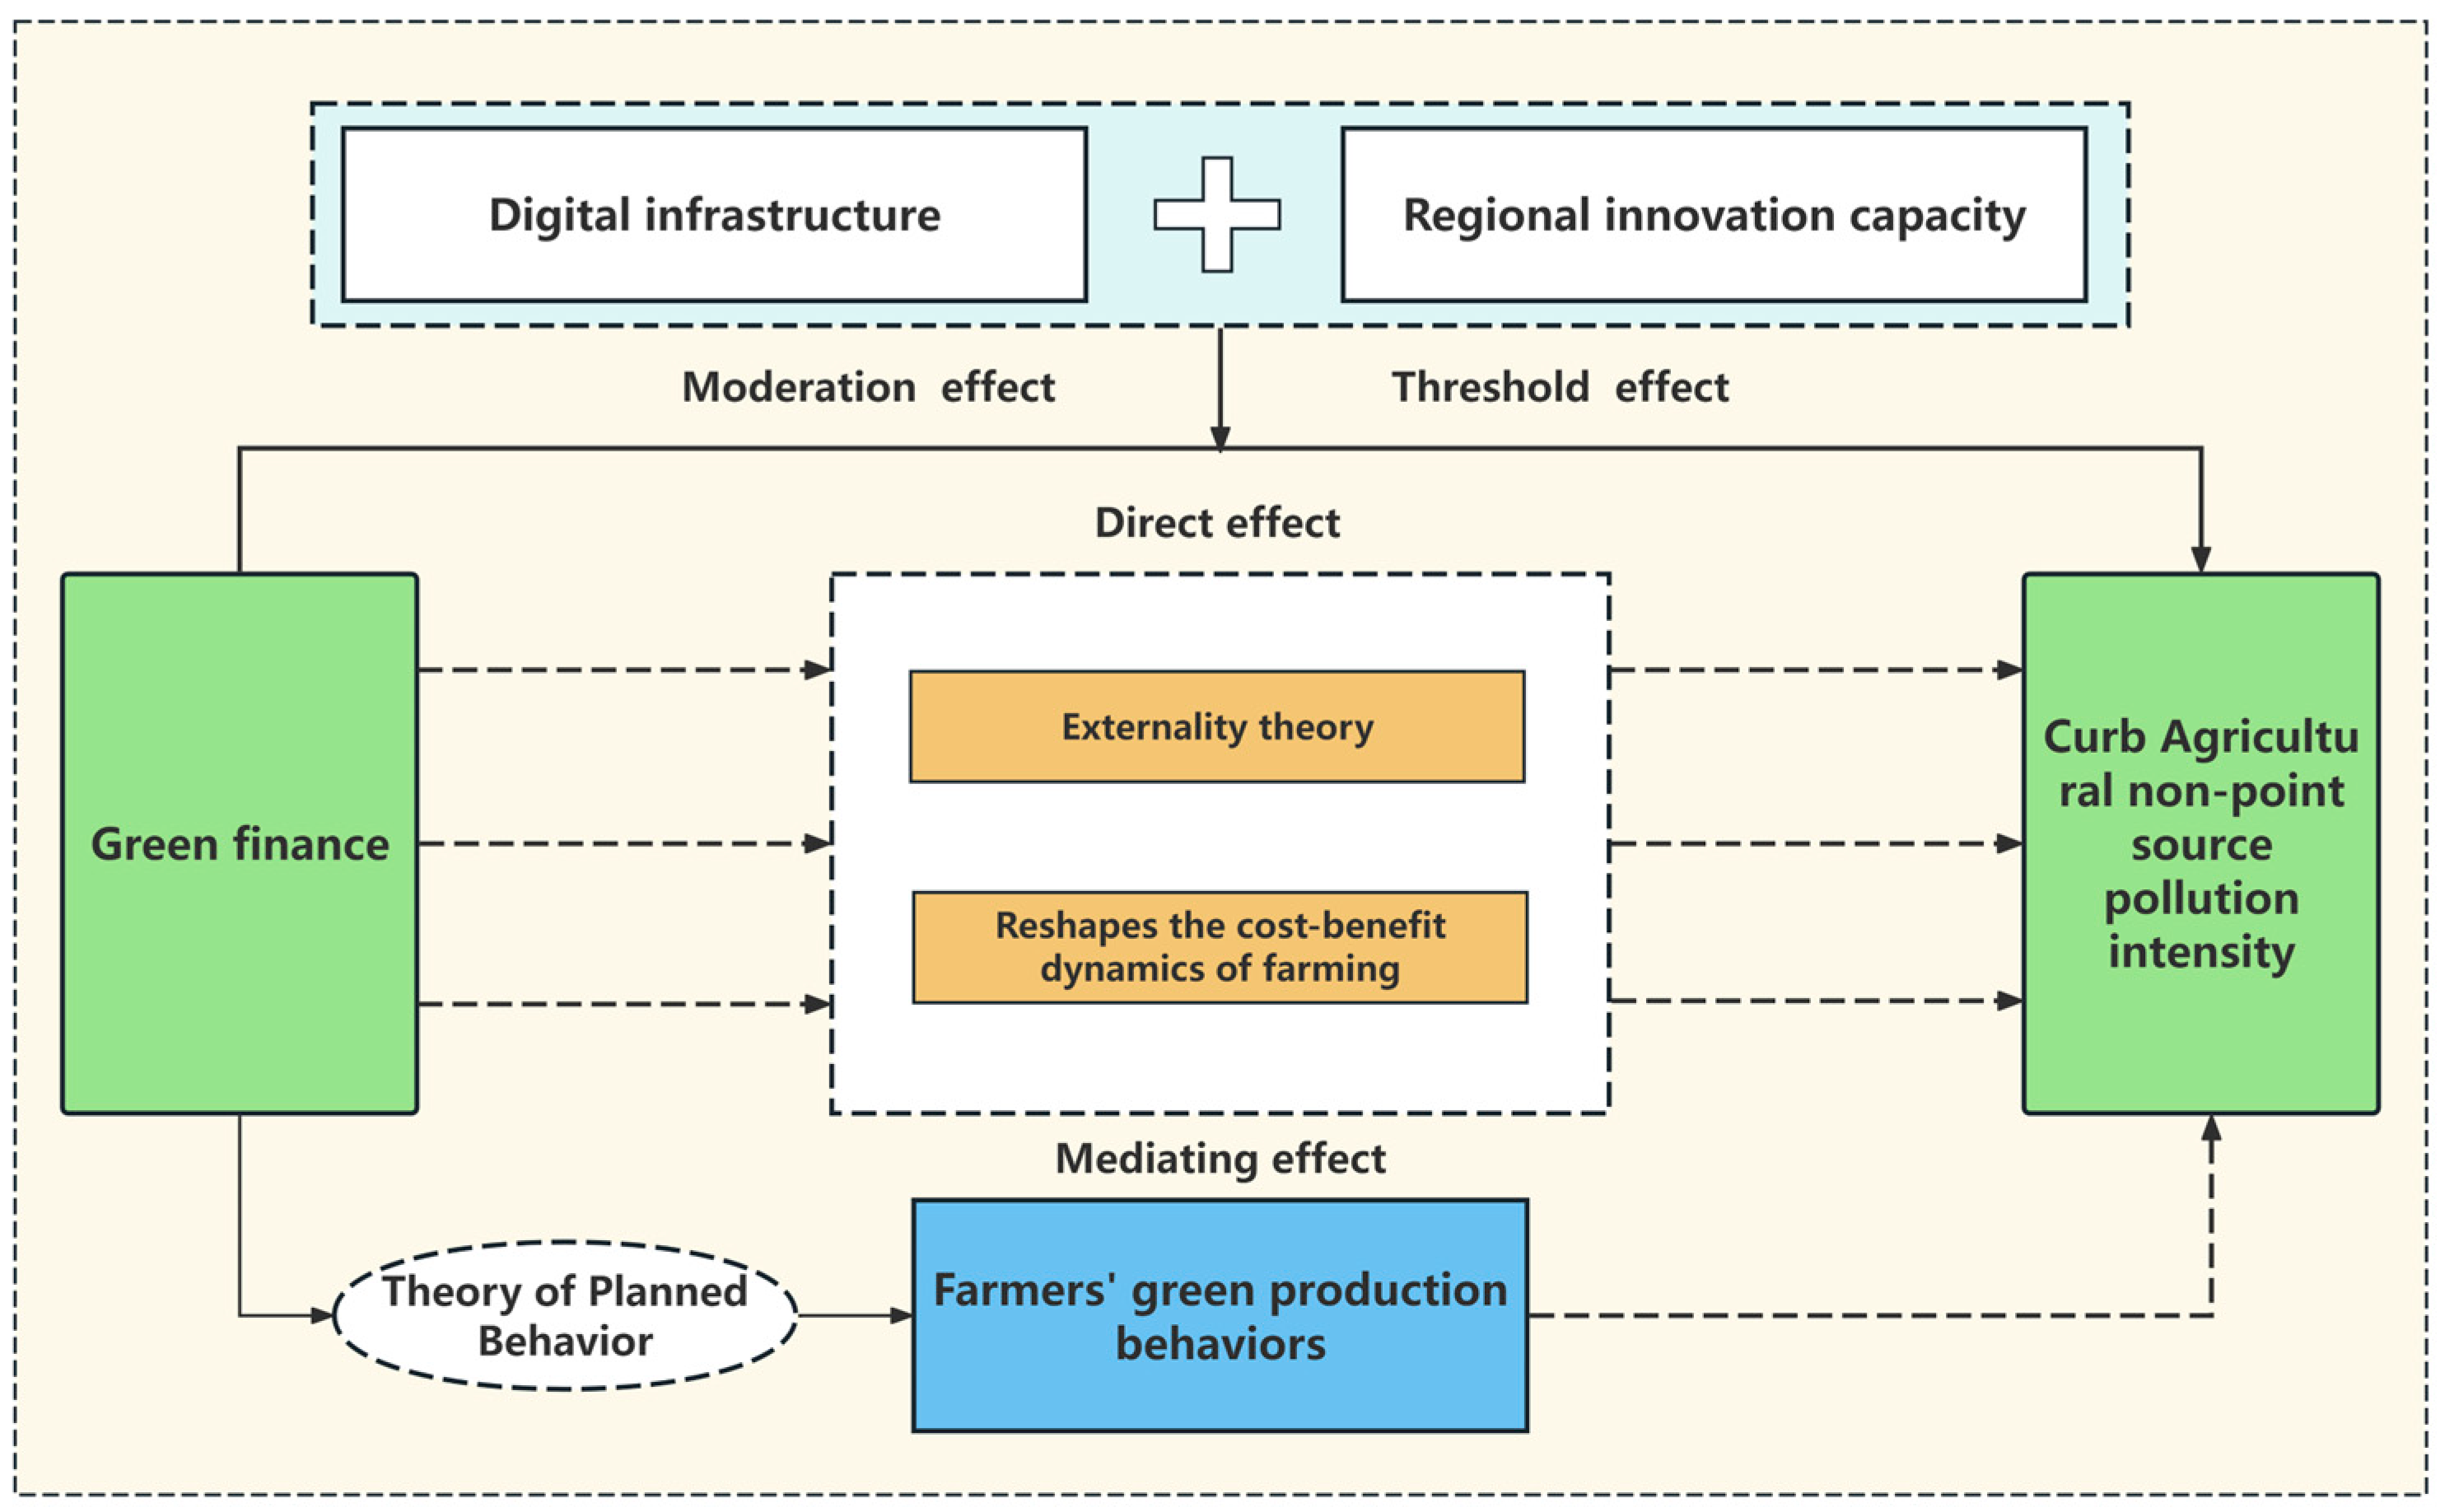
2.1. Impact of Green Financing on Environmental Pollution

Pigou’s externality theory [20] illustrates that agricultural non-point pollution presents significant negative externalities; specifically, environmental costs such as nitrogen and phosphorus runoff resulting from the excessive use of fertilizers and pesticides are not reflected in market prices, leading to welfare losses. This market failure necessitates institutional intervention. Green finance addresses these externalities through dual mechanisms. On the positive side, it provides affordable funding for ecological projects. Wang (2024) found that green finance enhances funding for eco-projects, thereby improving urban carbon welfare [21]. Conversely, it also imposes restrictions on financing for polluting industries [22]. Banks enforce stringent credit limits on these sectors, which reduces both investments and emissions [23]. Zhang (2022) demonstrated that while green credit encourages incremental innovation, it simultaneously stifles radical innovation among polluters, with government intervention mitigating this effect [24].
Studies confirm that green finance significantly aids in agricultural pollution control [25]. It reshapes the cost–benefit dynamics of farming through two primary mechanisms: (1) It reduces financing costs for green projects. In other industrial sectors, green credit policies have significantly lowered the financing threshold for environmentally friendly projects [26]. The development of the green bond market has also provided a low-cost source of funding for green projects, particularly in reducing carbon emissions and enhancing energy efficiency [27]. Moreover, government-led green funds have effectively alleviated the long-term financing challenges faced by areas such as renewable energy by offering low-interest loans and financial subsidies. Although these studies primarily focus on the industrial or energy sectors, the logic of the mechanism is equally applicable to agriculture: green finance can help reduce the financing costs faced by farmers and agribusinesses when adopting green technologies by tilting financial resources in their favor. (2) It encourages the adoption of green technologies. Financial incentives, such as support for water-saving irrigation, are instrumental in increasing the uptake of eco-friendly practices. Debbarma et al. (2021) established a correlation between access to credit and improved environmental efficiency in India, which facilitates the adoption of energy-saving technologies [28]. Additionally, Zhang et al. (2025) demonstrated that green subsidies, credit, and insurance significantly enhance farmers’ adoption of climate-smart technologies by lowering the costs associated with sustainable practices [29].
Based on the above analysis, this paper proposes the core hypothesis:
H1: 
The development of green finance can curb the intensification of agricultural non-point source pollution.

2.2. The Mediating Effect of Green Production Behavior

Based on the Theory of Planned Behavior [30], farmers’ decisions regarding green production are influenced by three core elements: behavioral attitudes (the evaluation of green production), subjective norms (perceived social pressure), and perceived behavioral control (the assessment of implementation feasibility). Green finance reshapes these key elements through systematic intervention mechanisms, thereby facilitating the transformation of agricultural production practices.
First, in terms of behavioral attitudes, green insurance mitigates the risks that farmers face when adopting new methods, thereby boosting their confidence and willingness to act. Through education and awareness campaigns, green finance programs enhance farmers’ understanding of the importance of environmental protection, thereby adjusting their behavioral attitudes [31]. Second, reinforcing subjective norms, primarily through policy guidance and social norms, Zhang (2018) found that both corporate environmental ethics and government environmental regulations positively influence the willingness to adopt green technology innovations, with government regulations playing a more significant role [32]. Furthermore, Zhou (2021) demonstrated that government environmental regulatory measures significantly increase farmers’ willingness to participate in environmental governance [33]. Third, regarding perceived behavioral control, green finance enhances access to capital for the adoption of environmentally sustainable technologies by providing favorable financing options, such as subsidized loans or interest rate discounts. This alleviates financial constraints and reinforces individuals’ sense of control over pro-environmental actions [34].
Existing empirical studies demonstrate that green finance not only directly reduces agricultural pollution but also indirectly influences farmers’ behaviors. A study conducted in Northwest China found that the implementation of green finance policies affects farmers’ agricultural investments [35], leading them to be more inclined to invest in precision farming technologies and organic fertilizers compared to non-participants. Another study, through in-depth comprehensive analysis of regional data, indicates that farmers’ perceived behavioral control, behavioral attitudes, and subjective norms collectively determine their green production financing behaviors. Through scientific guidance and effective shaping, more farmers can be motivated to actively participate in green production initiatives [36].
Based on the analysis presented, this paper proposes the following:
H2: 
Green finance reduces the intensity of agricultural non-point source pollution by reinforcing the mechanisms that encourage farmers’ green production behaviors.

2.3. The Moderating Effect of Digital Infrastructure

Based on the theoretical framework of digital finance and information economics, digital infrastructure plays a crucial role in enhancing the effectiveness of green finance in pollution control. This theoretical logic is primarily reflected in three dimensions:
First, it addresses the issue of information asymmetry. In traditional agricultural credit, the difficulty in quantifying and identifying farmers’ green behaviors often leads financial institutions to face high information friction and risk assessment costs. When finance operates through mobile terminal credit systems, it significantly improves the efficiency of information collection, processing, and credit granting, enabling the precise identification and classification management of farmers’ green production behaviors, thereby effectively reducing information asymmetry between transaction parties [37]. Second, it constructs channels for the diffusion of green technologies. Digital platforms provide efficient dissemination pathways for promoting green agricultural technologies [38]. Online training systems and remote expert consultations significantly accelerate the penetration of green technologies in rural areas. Third, it optimizes financial resource allocation. Digital finance breaks through the “last mile” bottleneck of traditional rural financial services, allowing green financial products and services to reach target groups more widely and accurately [39]. Blockchain applications further optimize this process through the implementation of smart contracts and decentralized mechanisms, which reduce transaction costs while enhancing the transparency of funds and precision in targeting [40].
This digital empowerment fosters a synergistic cycle: improved financial access leads to lowered technological barriers and enhanced pollution control. Empirical studies substantiate these effects: a 1% increase in digital development correlates with a 0.142% rise in green transformation within energy firms [41]; a 1% improvement in digital financial inclusion results in a 5.3% reduction in agricultural pollution [18]; and digital transformation positively moderates the impact of green finance on manufacturing quality [42].
Building on these findings, the following hypothesis is proposed:
H3: 
Greater digital infrastructure development strengthens green finance’s governance effect on agricultural non-point source pollution intensity.

2.4. The Threshold Effect of Regional Innovation Capacity

Endogenous growth theory posits that technological innovation is central to sustainable development [43]. The positive externalities associated with innovation render the effectiveness of policies sensitive to external environment [44]. The threshold effect model indicates that policy impacts are nonlinear, necessitating specific critical thresholds for full realization [45]. This phenomenon reveals the differentiated impact of green finance on pollution control, specifically demonstrating significant variations in pollution abatement effects under the influence of regional innovation capabilities across different areas.
Integrating these theories, we conducted an in-depth analysis of the threshold effect of regional innovation capability on the mechanism of green finance. Constructing a research and development–finance synergy network helps fully leverage the resource allocation effect. In regions with strong innovation capabilities, the scientific research system is well-established, technological application capacity is outstanding, and industrial chain synergy effects are significant, enabling green finance funds to be more precisely and efficiently invested in areas such as green technology R&D, the promotion of clean production methods, and ecological agriculture construction. These regions not only possess stronger project identification and screening capabilities but also have robust fund supervision mechanisms and technology transfer platforms, thereby ensuring the targeted allocation and efficient utilization of green finance resources. In contrast, in regions with weak innovation foundations, due to the lack of corresponding technical support and talent pools, green funds often struggle to achieve the expected environmental governance goals. Therefore, regional innovation capability serves as a critical moderating factor for the effectiveness of green finance policies. Only when a region possesses sufficient technological transformation capacity can green finance truly unleash its environmental governance potential.
The study by Zhang et al. (2024) demonstrates that the green finance reform pilot policies effectively incentivize financial institutions to increase support for green technology projects [46]. Consequently, research institutions have gained more funding and development opportunities, leading to a significant enhancement in urban green innovation capabilities. This virtuous cycle of capital flow and project alignment preliminarily reveals the formation of an “R&D–finance collaborative network,” which helps unleash the resource potential required for green technology innovation and maximizes the policy effectiveness of green finance. Additional research has found that in the process of green finance influencing high-quality agricultural development, technological innovation exhibits a significant threshold effect [47]; R&D investment, which indirectly reflects innovation capacity, also plays a threshold role in the impact of green finance on green development [48]. This synergistic effect results in a progressive enhancement of the pollution control efficacy of green finance, characterized by the following: when innovation capabilities are below a certain threshold ν 1 , the policy effects are negligible and they significantly improve once the threshold ν 1 is exceeded. This nonlinear relationship underscores the vital moderating role of regional innovation capacity in the implementation of green finance policies.
Therefore, we propose the following hypothesis:
H4: 
The pollution reduction effect of green finance on agricultural non-point source pollution is subject to a threshold constraint of regional innovation capacity, and its environmental governance effect becomes significantly stronger when regional innovation capacity exceeds a critical level.
To validate the hypotheses proposed in this section, we conducted a series of empirical analyses, which will be presented and discussed in Section 3 and Section 4.

3. Materials and Methods

3.1. Data Source

This study concentrates on the period spanning from 2005 to 2023, utilizing panel data from 31 provinces in China over this time frame. Due to challenges related to data availability and inconsistent statistical standards, the sample does not include Macao, Hong Kong, or Taiwan. Given China’s leading position in the global green finance market and its pivotal role as a major agricultural nation worldwide, this dataset holds significant representativeness and research value for understanding the application and impact of green finance in the agricultural sector. The primary data sources encompass the China Environment Yearbook, China Statistical Yearbook, China Rural Operation and Management Statistical Annual Report, China Rural Statistical Yearbook, China Research Data Service Platform (CNRDS), and the China Financial Yearbook. To address minor instances of missing information, the linear interpolation method was utilized.

3.2. Variables

3.2.1. Dependent Variable

Agricultural non-point source pollution represents a significant environmental challenge in crop production, with its emission intensity (EI) serving as an effective measure of the pollution load per unit of cultivated land area. In terms of pollution estimation methodologies, current research primarily utilizes three approaches: empirical models (e.g., unit analysis method and output coefficient method) [4,49], mechanistic models (e.g., SWAT and AGNPS) [50,51], and field survey methods [52]. This study employs the inventory analysis method [17] to estimate the emissions of chemical oxygen demand (COD), total nitrogen (TN), and total phosphorus (TP) across 31 provinces in China from 2005 to 2023. For pollution source identification, the study focuses on two primary sources: agricultural fertilizer application and solid waste (see Table 1), ensuring the accuracy and representativeness of the estimates. The calculation process for these variables is as follows.
First, calculate the non-point source pollution emissions from farmland fertilizer application and solid waste. The calculation, Formula (1), for agricultural non-point source pollution from chemical fertilizers is as follows.
E P P i t ( m ) = Σ f = 1 2 ( F U S f i t × L C F f i ( m ) × P C F 1 f ( m ) )
where E P P i t ( m ) represents the amount of the m-th pollutant from agricultural non-point source pollution in province i during year t ; F U S f i t denotes the application amount (in pure form) of the f -th chemical fertilizer in province i during year t , measured in 10,000 tons; L C F f i ( m ) indicates the loss coefficient of the m -th pollutant for the f -th chemical fertilizer in province i , with data sourced from the “Handbook of Pollution Source Emission Coefficients for Agricultural Pollution Sources” in the Second National Census of Pollution Sources; and P C F 1 f ( m ) represents the pollution generation coefficient of the f -th chemical fertilizer for the m -th pollutant [53]. Here, f = 1, 2 corresponds to nitrogen fertilizer and phosphorus fertilizer, respectively, and m = 1, 2, 3 represents COD, TN, and TP, respectively.
The calculation, Formula (2), for non-point source pollution from agricultural solid waste is as follows.
S W P i t ( m ) = Σ k = 1 7 ( C Y P k i t × S U S k i × N L R k ( m ) × P C F 2 k ( m ) )
where S W P i t ( m ) represents the non-point source pollution load of the m -th pollutant from agricultural solid waste in province i during year t ; C Y P k i t represents the total output of the k -th crop in province i during year t , in units of “10,000 tons”; S U S k i represents the straw utilization structure of the k -th crop in province i [54]; N L R k ( m ) represents the straw nutrient loss rate of the k -th crop for the m -th pollutant; and P C F 2 k ( m ) represents the pollution generation coefficient of the k -th crop for the m -th pollutant. Here, k = 1, 2, 3, …, 7, representing rice, wheat, corn, legumes, tubers, oil crops, and vegetables, respectively, and m = 1, 2, 3, representing COD, TN, and TP, respectively.
Second, to enhance data comparability, following the approach of Cheng et al. (2022) [55], the emissions of total phosphorus (TP), total nitrogen (TN), and chemical oxygen demand (COD) were converted into equivalent standard pollutant emissions. These were then summed to obtain the total agricultural non-point source pollution, calculated as shown in Equation (3) below.
A N S P i t = F P P i t ( 1 ) + S W P i t ( 1 ) 20 + F P P i t ( 2 ) + S W P i t ( 2 ) 1 + F P P i t ( 3 ) + S W P i t ( 3 ) 0.2
A N S P i t represents the total non-point source pollution from the planting industry in province i during year t , in units of “10 billion m3”; F P P i t ( 1 ) , F P P i t ( 2 ) , and F P P i t ( 3 ) , respectively, represent the COD, TN, and TP generated by agricultural non-point source pollution from fertilizers in province i during year t ; S W P i t ( 1 ) , S W P i t ( 2 ) , and S W P i t ( 3 ) , respectively, represent the COD, TN, and TP generated by agricultural non-point source pollution from solid waste in province i during year t ; and 20, 1, and 0.2 are the conversion coefficients for COD, TN, and TP, respectively, with units of mg/L.
Finally, the study adopts EI (total pollution amount/cultivated land area) as the core indicator; the calculation process is as follows.
E I i t = A N S P i t / G A i t × 100
Here, E I i t represents the agricultural non-point source pollution emission intensity of province i in year t ; G A i t indicates the cultivated land area of province i in year t , measured in “thousand hectares”. For ease of analysis, the data were scaled up by a factor of 100.
The relevant data are primarily sourced from the “China Rural Statistical Yearbook” (2006–2024) and the statistical yearbooks of various provinces (autonomous regions, and municipalities). The cultivated land area data also originates from the aforementioned statistical yearbooks, ensuring the consistency and accuracy of the data.

3.2.2. Core Explanatory Variable

Green Finance Index (GF). While prior studies have largely relied on green credit as a proxy for green finance development, this approach overlooks its multidimensional nature. Green finance encompasses a range of instruments, including credit, investment, funds, and carbon finance. Drawing on existing literature, this study constructs a comprehensive Green Finance Index based on five key indicators: green credit, green investment, green funds, green support, and carbon finance [56,57,58]. The calculation methods for these indicators are detailed in Table 2. Before computing the Green Finance Index, the original data were standardized to eliminate the impact of discrepancies in units and scales on the results. The entropy method, an objective weighting approach, was employed. This method, based on the principle of information entropy, thoroughly considers the feedback information from the data itself, thereby avoiding interference from subjective factors in weight determination and ensuring a more objective allocation of weights across indicators [59]. Following the calculation of indicator weights using the entropy method, the five core indicators were aggregated into a comprehensive Green Finance Index (GF), providing a systematic and objective measure of the overall development level of green finance. Detailed information on the data sources and attributes of these indicators is presented in Table 2.

3.2.3. Other Core Variables

Mediating Variable
The selection of the mediating variable has been detailed in the theoretical mechanism section and will not be reiterated here. Green production among farmers involves the implementation of techniques that decrease reliance on agricultural chemicals and pursue sustainable development throughout the agricultural production process. The goal is to minimize environmental impact, enhance resource allocation efficiency, and improve the quality of agricultural products [60]. The reduction of chemical inputs is not only directly manifested in the decreased application intensity of fertilizers, pesticides, and plastic films, but also reflects the substitution with environmentally friendly inputs and the adoption of green technologies. Therefore, it provides a comprehensive reflection of the actual level of farmers’ green production behavior. This indicator has gained broad consensus in policies related to agricultural green development; for example, China’s “14th Five-Year” National Plan for Agricultural Green Development explicitly identifies the reduction of chemical input usage as a key objective for promoting agricultural green transformation. Compared with subjective evaluations of specific green technology adoptions, the intensity of chemical input use is more objective and quantifiable, making it more suitable for empirical analysis. Following relevant literature [61], this study focuses on the reduction behavior of traditional agricultural inputs. Given that fertilizer usage is already incorporated into the construction of the dependent variable, using both fertilizer and pesticide usage could lead to multicollinearity. Therefore, this study employs the logarithm-transformed amount of pesticide application as a proxy measure for green production behavior (FGP). A lower level of pesticide use indicates reduced reliance on traditional agricultural inputs and a higher degree of green technology adoption, reflecting the implementation of green production practices by farmers.
Moderator Variable
Based on a comprehensive theoretical analysis, this study selects the digital infrastructure level (DI) as a moderating variable to assess the development of regional digital infrastructure. The indicator is calculated by dividing the length of long-distance optical cable lines (in kilometers) by land area (in 10,000 m2) [62], followed by a logarithmic transformation. This metric reflects the density of digital network coverage in a region, with higher values indicating a more advanced digital infrastructure.
Threshold Variable
This paper posits that there is a threshold effect of regional innovation capabilities in the process GF alleviating EI. Accordingly, regional innovation capability (TI) is introduced as a threshold variable, measured by the total number of patent applications filed in the region during the reference year [63]. The volume of patent applications is widely regarded as a key objective measure of regional technological innovation vitality and potential. It reflects the region’s R&D capacity and knowledge accumulation in emerging technologies and processes, thereby capturing the technical capabilities essential for facilitating green transformation [64]. Particularly, during the implementation of green finance policies, regions with stronger innovation capabilities tend to have greater technology absorption and transformation capacities. This facilitates a more effective allocation of green financial resources towards environmentally friendly technology applications, thus enhancing their actual effectiveness in controlling agricultural pollution.
Control Variables
The agricultural non-point source pollution emission intensity (EI) is influenced by multiple determinants. Macroeconomic conditions, including the level of economic development, industrial structure, population size, traditional financial supply, and local green finance development, may significantly impact green agricultural growth [65]. Concurrently, fundamental rural conditions such as urban–rural disparity, urbanization level, road accessibility, and the degree of agricultural mechanization also relate to this study’s core variables [15].
To address potential omitted variable bias, we incorporate control variables based on prior research [3,18]: (1) Economic level (GDP): Gross domestic product (in 100 million yuan), log-transformed. (2) Industrial structure (Structure): The share of GDP from the secondary sector. (3) Population size (Population): Total population (in 10,000 people), log-transformed. (4) Urban–rural income gap (Gap): The ratio of urban to rural disposable income. (5) Road accessibility (RA): Expressway mileage (in km) per land area (in 10,000 km2). (6) Traditional financial supply (TFS): The deposit–loan balance of financial institutions relative to GDP. (7) Agricultural mechanization (DAM): Total machinery power (in 10,000 kW) relative to cultivated area (in 10,000 km2). The definitions and measurement methods of all variables are shown in Table 3.

3.3. Model Design

3.3.1. Baseline Model

Based on the results of the Hausman test, which reject the null hypothesis of the random effects model at the 5% significance level, and considering the heterogeneous characteristics of individual samples as well as the significant time trend effects [66], this study adopts a two-way fixed effects model that controls for both individual and time dimensions to examine the impact of GF on EI. The baseline specification is formulated as shown in Equation (5).
E I i t = β 0 + β 1 G F it + β 2 c o n t r o l i t + φ i + γ t + ε i t
where i indexes provinces, t denotes years, φ i captures province-fixed effects, γ t represents time-fixed effects, and ε i t is the error term. E I i t quantifies the agricultural non-point source pollution intensity of province i in year t, while G F i t measures green finance. c o n t r o l i t denotes control variables.

3.3.2. Mediating Effect Model

To assess the role of equity green production behavior (FGP) in GF-EI linkages, the mediation model follows [67]. If β 1 , α 1 , and θ 2 are all significant, and the signs of α 1 and θ 2 are consistent with β 1 , it proves the existence of this mediation path. If θ 1 is significant, it indicates a partial mediation effect; otherwise, it signifies a complete mediation effect.
F G P i t = α 0 + α 1 G F it + α 2 c o n t r o l i t + φ i + γ t + ε i t
E I i t = θ 0 + θ 1 G F it + θ 2 F G P i t + θ 3 c o n t r o l i t + φ i + γ t + ε i t
where F G P i t denotes the green production behavior of province i in year t .

3.3.3. Moderation Effect Model

To investigate the moderating mechanism of digital infrastructure level (DI) in the model, this study constructs an interaction term model based on the interaction effect testing framework proposed by McClelland and Judd (1993) [68]. First, the mean centering method is applied to preprocess the original variables, obtaining the variables c _ G F i t and c _ D I i t ; subsequently, the interaction term is constructed c _ G F i t × c _ D I i t . If the coefficient of the interaction term δ 3 passes the statistical test at the 5% significance level and its sign direction is consistent with the main effect coefficient β 1 , it can be concluded that the moderating variable has a significant positive moderating effect on the core explanatory variable. The models are as follows.
E I i t = δ 0 + δ 1 G F i t + δ 2 D I i t + δ 3 c _ G F i t × c _ D I i t + δ 4 c o n t r o l i t + φ i + γ t + ε i t
where D I i t denotes the digital infrastructure level of province i in year t .

3.3.4. Threshold Effect Model

To examine the nonlinear characteristics of the impact of GF on EI under different levels of innovation, this paper establishes a threshold effect model of technological innovation [69] to investigate whether the influence of explanatory variables on the explained variable undergoes structural changes across different threshold intervals, as shown in Equation (9) below.
E I i t = ρ 0 + ρ 1 G F it I ( T I i t ν 1 ) + ρ 2 G F it I ( T I i t > ν 1 ) + ρ 3 c o n t r o l i t + φ i + γ t + ε i t
where I ( ) is the indicator function; it takes the value 1 when the condition in parentheses is satisfied, and 0 otherwise. T I i t represents the level of technological innovation, ν 1 is the estimated threshold value, and ρ is the significance level.

4. Results

4.1. Descriptive Statistics

Descriptive statistics for the variables are presented in Table 4.

4.2. Spatiotemporal Distribution of EI

To reveal the spatiotemporal evolution characteristics of non-point source pollution intensity in the planting industry, this study utilized the ArcGIS platform (Version Number 10.8) to map the spatial distribution of pollution intensity. The map data were obtained from China’s national database, with the approval number GS (2019)-1822. Based on the natural breaks method, the 31 provinces across the country were classified into five categories (Figure 2).
In terms of temporal trends, the national average pollution intensity index (EI) decreased from 0.55 in 2005 to 0.45 in 2014 and further to 0.34 in 2023, indicating certain achievements in the management of agricultural non-point source pollution. In 2005, high-pollution regions (>0.7835) were mainly concentrated in the economically developed areas of East and South China, while low-pollution regions were predominantly distributed in the northwest and northeast. By 2014, the number of high-pollution provinces had decreased to six, showing a clear geographical clustering effect. By 2023, only three high-pollution provinces remained, with pollution intensity significantly reduced in most regions.
Spatially, pollution intensity exhibited significant regional heterogeneity. Areas southeast of the Hu Line were generally classified as medium-high-pollution zones (0.4418–0.7834), while those northwest of the line were primarily low-pollution zones (0.1920–0.3548). This disparity is closely related to regional arable land carrying capacity and agricultural activity intensity. In the southeast, due to high population density and intensive agricultural practices, pollution load per unit of arable land increased significantly. For instance, Fujian Province’s arable land area in 2023 decreased by 18% compared to 2005, leading to higher pollution intensity. Additionally, fertilizer application rates in southern paddy fields far exceeded the national average. For example, Guangdong’s fertilizer application per thousand hectares reached 530 tons in 2012, twice the national average, which may explain why its pollution intensity remained consistently higher than that of northern regions.
The impact of policies and green finance pilot programs was also evident in certain regions. Jiangxi Province, for example, saw its pollution intensity index drop from 0.2009 in 2014 to 0.1444 in 2023—a 28.0% reduction—after the establishment of a green finance reform pilot zone in 2017, which supported the low-carbon transformation of traditional agriculture through green credit. This demonstrates the positive role of policy interventions in improving agricultural environmental performance.

4.3. Baseline Regression

The baseline regression results show that GF exerts a statistically significant negative effect on EI at the 5% significance level, indicating that the development of green finance can effectively mitigate the worsening of agricultural non-point source pollution.The empirical results are presented in Table 5, in column (1), which does not include control variables, the coefficient of GF is −0.245. After introducing a series of control variables, the coefficient in column (2) remains robust, slightly adjusted to −0.204, demonstrating the strong robustness of this effect. Overall, the goodness-of-fit (R2 = 0.475) of Equation (2) is significantly better than that of Equation (1), indicating that the inclusion of control variables helps better explain the variation mechanism of EI.
Hypothesis 1 is therefore supported, aligning with existing literature that also identifies the mitigating effect of green finance on agricultural non-point source pollution [17]. This may be because green finance restructures the “cost–benefit” framework in agricultural production, gradually internalizing environmental costs previously borne by society. This effectively curbs farmers’ non-environmentally friendly behavior, which often results from market mechanism failures, consequently reducing the emission intensity of agricultural non-point source pollution, providing a solid empirical foundation for the application of green finance policies in the field of agricultural production.

4.4. Mediating Effect

This study further investigates the mediating role of green production behavior (FGP) by performing regression analyses on Equations (6) and (7). The regression outcomes are presented in Table 6: column (1) indicates that GF has a significant negative impact (−0.653, significant at the 1% level) on traditional agricultural input, suggesting encouragement for farmers’ green production behavior; column (2) reveals that after accounting for FGP, the effect of GF on EI is insignificant, whereas the regression coefficient for green production behavior (FGP) is positive and highly significant (0.227, significant at the 1% level). These findings confirm the complete mediating effect of green production behavior in the transmission pathway, providing empirical validation for Hypothesis 2.
Green finance not only directly suppresses agricultural pollution but also effectively improves farmers’ “perceived behavioral control,” “behavioral attitudes,” and “subjective norms” through credit support, risk mitigation, and policy guidance. This encourages farmers to reduce reliance on traditional agricultural inputs and adopt green production methods, thereby further strengthening the effectiveness of agricultural non-point source pollution control through behavioral pathways. This finding is consistent with the conclusions of existing research, indicating that the implementation of green finance policies has altered farmers’ agricultural investment orientation, making them more inclined to adopt environmentally friendly technologies and inputs [35], thereby indirectly alleviating environmental pressure.

4.5. Moderating Effect

To examine whether the extent of digital infrastructure exerts a moderating influence on the mitigating impact of GF on agricultural EI, this study conducts an additional regression analysis based on Equation (9). As shown in column (3) of Table 6, the estimated coefficient of the interaction term is statistically significant and negative (−0.293, significant at the 1% level). This discovery proves Hypothesis 3. The research results indicate that under conditions of well-developed digital infrastructure, green finance exerts a stronger mitigating effect on agricultural non-point source pollution intensity, with its alleviation effect significantly surpassing the levels observed in regions with underdeveloped digital infrastructure. As digital infrastructure gradually improves, diffusion costs decrease [70] and the accessibility, information transparency, and service efficiency of green financial resources significantly improve. This makes it easier to translate financial support into tangible environmental improvement outcomes, and easier for farmers to access green financial product information, complete credit applications, and adopt green technologies, thereby amplifying the environmental governance effect of green finance.

4.6. Threshold Effect

This study examines the threshold effect of regional innovation capability on the pollution reduction effect of green finance by constructing a panel threshold model. Based on 300 repeated experiments using a bootstrap method, the results indicate that a single threshold is significant at the 1% level (see Table 7), whereas the effect of multiple thresholds is not significant. To visually examine the threshold value results and their significance, Figure 3 presents the likelihood ratio statistics for the first threshold estimate [71]. The dashed line in the figure represents the 95% confidence interval of the threshold value in LR. As can be seen from the figure, the model exhibits a significant first threshold value, which once again verifies the threshold test results. This indicates that the role of green finance exhibits phased transition characteristics. According to the threshold test results, the estimated threshold value is 3111, meaning that the mitigating effect of green finance on environmental impact will vary depending on whether the sample’s innovation capability falls within different threshold intervals.
The regression results presented in Table 8 suggest that when the level of innovation falls below the threshold of 3111, the effect of GF on EI is insignificant. This may be because, at this stage, green finance is primarily directed towards technological innovation and upgrading, thereby crowding out funds for agricultural production and operation. When the innovation capability surpasses the threshold (3111), the coefficient of green finance is −0.571 (p < 0.01), indicating that as regional innovation capabilities improve, the pollution control effect of green finance becomes significantly prominent, enhancing its role in reducing green non-point source pollution. These findings reveal a “nonlinear” mechanism, indicating that the effectiveness of green finance policies depends on regional innovation capacity, which supports Hypothesis 4. This aligns with Yuan’s (2024) findings [47]. In regions with abundant innovation resources and strong technology transfer capabilities, the collaborative network between research and finance can more efficiently allocate resources. Green finance not only promotes the research and development of green technologies, indirectly enhancing their application effects and thereby significantly improving environmental governance outcomes, but technological advancements also further strengthen the policy influence of green finance, achieving an efficient utilization of financial resources. This indicates that the effectiveness of green finance policies is not universally applicable but requires a foundation of technological innovation capability, while also highlighting the necessity of coordinated regional development.

4.7. Robustness Test

To address potential endogeneity arising from reverse causality between GF and EI, this study adopts a dynamic panel data framework using the system GMM estimator [72]. Given the possible persistence in pollution emissions, the lagged value of emission intensity (L.EI) is incorporated as an instrument in the GMM estimation. Regression results are reported in column (1) of Table 9, where the coefficient of GF is statistically significant at the 5% level, suggesting a robust negative association with EI. Diagnostic tests further support the reliability of the estimation: the AR(1) test yields a p-value below 0.1, indicating first-order serial correlation, whereas the AR(2) p-value exceeds 0.1, ruling out second-order autocorrelation. Additionally, the Hansen over-identification test reports a p-value greater than 0.1, confirming the overall validity of the instruments. These findings not only validate the effectiveness of the GMM approach in mitigating endogeneity but also serve as a robustness check on the main empirical results.
To mitigate potential endogeneity stemming from omitted variable bias, this study introduces instrumental variables and applies the two-stage least squares (2SLS) estimator to enhance model identification and improve the reliability of empirical findings. Specifically, for each province i, we select its two geographically adjacent provinces with the most similar GDP levels and compute the average of their green finance indices in year t as an instrumental variable for province i’s Green Finance Index in the same year [73]. This approach ensures a strong correlation between the instrument and the endogenous regressor, as the selected provinces exhibit comparable economic structures and policy environments. Moreover, the green finance development of neighboring provinces mainly reflects regional spillover effects rather than directly affecting the agricultural green development outcomes of the focal province, thereby satisfying the exogeneity requirement of the instrument. Column (2) of Table 9 presents the first-stage regression results, where the estimated coefficient of the instrumental variable (IV) is significantly positive at the 1% significance level. The p-value of the LM statistic strongly rejects the null hypothesis of under-identification (p < 0.01), and the F-statistic surpasses the conventional threshold for ruling out weak instruments, confirming the validity of the chosen IV. The second-stage regression results, reported in column (3), indicate that even after controlling for endogeneity through the instrumental variable approach, the effect of green finance (GF) on emission intensity (EI) remains statistically significant and negative at the 1% level. These findings reinforce the robustness of the primary empirical conclusions regarding the environmental benefits of green finance in mitigating non-point source pollution in the planting sector.
To systematically evaluate the robustness and reliability of the empirical findings, this study conducts a series of robustness checks, including alternative specifications of the dependent variable, the exclusion of extreme observations, and adjustments to the sample window. All results consistently support the validity of the core conclusions. Due to space constraints, detailed procedures and full estimation outcomes are documented in Appendix A.

5. Discussions and Conclusions

5.1. Discussions

Based on the theoretical framework of green finance and agricultural sustainability, this study systematically examines the impact of green finance on the intensity of agricultural non-point source pollution. Utilizing provincial panel data from China from 2005 to 2023, we construct mediation models, moderation models, and a single threshold effect model to comprehensively identify the environmental governance mechanisms associated with green finance. Empirical findings indicate that, after accounting for various economic, social, and environmental factors, an increase in the Green Finance Index has a statistically significant and enduring negative impact on agricultural pollution intensity (supporting H1), suggesting its positive environmental externality in resource allocation. This key finding regarding the direct negative impact aligns with existing research conclusions [3,17], which similarly identify the inhibitory effect of green finance on agricultural pollution sources. This study further confirms that this stems from green finance reconstructing the “cost–benefit” framework in agricultural production based on market failures, gradually internalizing social environmental costs.
Moreover, green finance demonstrates not only a direct emission reduction effect but also an indirect pathway through which it encourages farmers to adopt environmentally friendly production practices (supporting H2). Regarding the central role of this intermediary pathway, existing research has also observed that green finance policies alter farmers’ investment behaviors [36]. This study further elucidates its core mechanism: through credit support, risk mitigation, and policy guidance, green finance effectively enhances farmers’ “perceived behavioral control” (e.g., reducing the difficulty of accessing green technologies), “behavioral attitudes” (e.g., recognizing the long-term benefits of green practices), and “subjective norms” (e.g., fostering social expectations for green production), thereby systematically incentivizing behavioral change.
Further analysis uncovers significant moderating and nonlinear threshold roles played by regional digital infrastructure development and innovation capacity (supporting H3 and H4), offering theoretical support for the regionally differentiated implementation of green finance policies in the agricultural sector. Regarding the pivotal moderating role of digital infrastructure (H3), the findings of this study align with those of Li (2024) [41], indicating that digitalization drives green transformation and that the enhancement of digital infrastructure significantly improves the efficacy of green finance in environmental governance. The underlying mechanism lies in the fact that well-developed digital infrastructure effectively reduces barriers to information dissemination and acquisition, markedly increasing the accessibility, transparency, and service efficiency of green financial resources. This facilitates the precise allocation of green financial resources and promotes their conversion into tangible environmental benefits. Concerning the threshold effect of regional innovation capacity (H4), consistent with Yuan’s (2024) research emphasizing the importance of R&D–finance synergy networks [47], this study further clarifies its critical point characteristics: only when regional innovation capacity surpasses a specific threshold can its abundant innovation resources and efficient technology conversion capabilities support the R&D–finance synergy network. This enables green finance not only to promote the development of green technologies but also to enhance the utilization efficiency of financial resources through the spillover effects of technology application, ultimately unleashing the full potential of policies. This highlights that the foundational capacity building of regions is a necessary prerequisite for realizing the effectiveness of green finance.

5.2. Conclusions

This study systematically examines the impact of green finance on agricultural non-point source pollution intensity and its underlying mechanisms based on provincial panel data from China (2005–2023). The findings reveal the following: (1) The development of green finance can significantly reduce agricultural pollution intensity, demonstrating clear positive environmental externalities and effectively correcting market failures. (2) Green finance achieves emission reduction not only through direct regulatory pathways but also via the mediating effect of promoting farmers’ green production behaviors, fundamentally driven by multi-dimensionally altering farmers’ perceptions and behavioral incentives to promote control at the source. (3) The construction of digital infrastructure significantly enhances the governance effectiveness of green finance by enhancing the transparency, accessibility, and service efficiency of resources to accelerate the transformation into environmental benefits. (4) Regional innovation capability serves as a critical threshold condition for the full realization of policy effects, underscoring the critical importance of building regional foundational capacities. These findings uncover the multiple mechanisms and boundary conditions through which green finance contributes to agricultural sustainable development, providing a solid theoretical foundation for targeted policy implementation. This research further deepens the empirical understanding of the relationship between green finance and agricultural environmental governance, while offering practical policy recommendations to facilitate agricultural green transformation.

5.3. Theoretical and Policy Contributions

From a theoretical perspective, this study extends the understanding of the mechanisms through which green finance operates in agricultural environmental governance. It makes new contributions by identifying mediating pathways, moderating factors, and threshold effects. Specifically, the research not only confirms the direct environmental benefits of green finance but also uncovers its multi-level impact pathways, thereby offering a more comprehensive theoretical framework for the application of green finance theory in the context of agricultural production.
From a policy perspective, this study proposes the following recommendations: First, to innovate the system of agricultural green financial products by encouraging the development of green credit, insurance, and bond instruments tailored to the characteristics of agricultural production. Second, to accelerate the construction of digital infrastructure in rural areas and establish green financial service platforms, so as to bridge the “last mile” in policy implementation. Third, to implement differentiated regional support strategies by establishing a mechanism of “category-based measures combined with dynamic adjustment.” Priority should be given to cultivating green finance demand in less-developed regions, promoting pilot programs that integrate green finance with technological innovation, and building demonstration zones for green transformation in agriculture.

5.4. Limitations and Future Research Directions

Although this study has made advances in methodological design and theoretical exploration, several limitations persist. First, due to constraints on data availability, the current analysis primarily relies on provincial-level macro panel data, which restricts our capacity to explore behavioral response mechanisms at the micro level. Second, measurement errors may exist in some variables; for example, the indicators used to measure the development level of green finance require further refinement.
Future research can progress in several promising directions. First, by incorporating micro-level survey data, future studies can examine the specific mechanisms through which green finance influences farmers’ decisions on green production from an individual behavioral perspective. Second, research could be expanded to encompass broader issues of agricultural green development, such as agricultural carbon emissions and soil restoration, to assess the multidimensional environmental impacts of green finance. Third, it is crucial to investigate the synergistic mechanisms between green finance and other policy instruments—such as environmental regulations and fiscal subsidies—to offer theoretical support for establishing a systematic policy framework for agricultural green development. Lastly, as the influence of digital transformation on sustainable agricultural development becomes increasingly pronounced, future research should prioritize exploring this critical dimension.

Author Contributions

Conceptualization, L.Y. and S.C.; methodology, L.Y., S.C. and S.W.; formal analysis, L.Y. and S.W.; writing—original draft preparation, S.C.; writing—review and editing, L.Y.; supervision, L.Y. and S.W. All authors have read and agreed to the published version of the manuscript.

Funding

This research was funded by the National Natural Science Foundation of China (Grant Number 72003032), Fujian Inclusive Finance Research Institute Project (Grant Number KXZK1808A), and Fujian Agriculture and Forestry University Innovation Fund Project (Grant Number KSBCX2531 and Grant Number KSBCX2406).

Institutional Review Board Statement

Not applicable.

Informed Consent Statement

Not applicable.

Data Availability Statement

Data from the Ministry of Ecology and Environment, PRC: https://www.mee.gov.cn/home/ztbd/rdzl/wrypc/zlxz/202006/t20200616_784745.html, accessed on 29 April 2025.

Conflicts of Interest

The authors declare no conflicts of interest.

Abbreviations

The following abbreviations are used in this manuscript:
EIAgricultural non-point source pollution emission intensity
GFGreen Finance Index
GDPEconomic level
StructureIndustrial structure
PopulationPopulation size
GapUrban–rural disparity
RARoad accessibility
TFSTraditional financial supply
DAMDegree of agricultural mechanization
FGPGreen production behavior
DIDigital Infrastructure level
TIInnovation capability

Appendix A

In addition to the instrumental variables approach, this paper employs multiple robustness checks, with the test results as follows:
(1) Replace dependent variable. Replace the measurement methods and evaluation system of the explained variable. Agricultural non-point source pollution primarily stems from residual contamination caused by chemical fertilizers, pesticides, and agricultural films. This study draws on the calculation method proposed by Wang (2016) [74], using nitrogen and phosphorus runoff from fertilizers, ineffective pesticide usage, and residual agricultural film quantities to characterize non-point source pollution levels. Building on existing research [75], the entropy method is employed to integrate fertilizer pollution, pesticide pollution, and plastic film pollution into a single indicator representing agricultural non-point source pollution (Pollution), where higher values indicate more severe pollution. The regression results are presented in column (1) of the table, showing that the coefficient of GF is significantly negative at the 1% level, confirming the robustness of the regression findings.
(2) Remove outliers. To eliminate the impact of data outside the reasonable range on regression results and ensure the reliability of empirical findings, this study conducts robustness tests by excluding outliers [3] to determine whether the empirical results are affected by extreme values. The task defines N_GF as the variable obtained by removing the top and bottom 5% extreme values from the original independent variable. This adjusted variable is then selected again as the independent variable in the regression. The results, presented in column (2) of Table A1, show that the coefficient of GF is significantly negative at the 1% level, confirming the robustness of the regression findings.
(3) Adjusting the sample period. Since the COVID-19 pandemic in 2020 had a significant impact on various economic activities [76], it also led to restrictions on agricultural input purchases and sales difficulties in agricultural production. Therefore, this study excludes the 2020 data and conducts the test again. The regression results are shown in column (3) of Table A1. The coefficient of the independent variable remains significantly negative, indicating that the effect of green finance in mitigating the intensity of non-point source pollution in crop farming remains robust after excluding the interference of the pandemic.
Table A1. Other robustness test results.
VariablesReplace Dependent VariableRemove OutliersAdjusting the Sample Period
(1)
Pollution
(2)
EI
(3)
EI
GF−0.089 *** −0.201 **
(−3.17) (−2.42)
N_GF −0.249 **
(−2.54)
Constant−0.3400.4010.454
(−1.61)(0.66)(0.71)
ControlYesYesYes
IDYesYesYes
YearYesYesYes
N589589558
R20.4740.4750.478
F22.52422.61522.617
Notes: t or z statistics in parentheses. ** p < 0.05, and *** p < 0.01.

References

  1. Hou, C.; Chu, M.L.; Botero-Acosta, A.; Guzman, J.A. Modeling field scale nitrogen non-point source pollution (NPS) fate and transport: Influences from land management practices and climate. Sci. Total Environ. 2021, 759, 143502. [Google Scholar] [CrossRef]
  2. Wang, M.M.; Jiang, T.H.; Mao, Y.B.; Wang, F.J.; Yu, J.; Zhu, C. Current Situation of Agricultural Non-Point Source Pollution and Its Control. Water Air Soil Pollut. 2023, 234, 21. [Google Scholar] [CrossRef]
  3. Lv, W.; Zhang, Z.; Zhang, X. The role of green finance in reducing agricultural non-point source pollution—An empirical analysis from China. Front. Sustain. Food Syst. 2023, 7, 1199417. [Google Scholar] [CrossRef]
  4. Sun, B.; Zhang, L.; Yang, L.; Zhang, F.; Norse, D.; Zhu, Z. Agricultural non-point source pollution in China: Causes and mitigation measures. Ambio 2012, 41, 370–379. [Google Scholar] [CrossRef] [PubMed]
  5. Rehman, A.; Rehman, A.; Ma, H.; Ulucak, R. Sustainable development and pollution: The effects of CO2 emission on population growth, food production, economic development, and energy consumption in Pakistan. Environ. Sci. Pollut. Res. 2022, 1, 1–12. [Google Scholar] [CrossRef] [PubMed]
  6. Wang, H.; Fang, L.; Mao, H.; Chen, S.J. Can e-commerce alleviate agricultural non-point source pollution?—A quasi-natural experiment based on a China’s E-Commerce Demonstration City. Sci. Total Environ. 2022, 846, 13. [Google Scholar] [CrossRef] [PubMed]
  7. Wu, Z.J.; Zhou, Z.; Liang, H.; Wu, H.Q.; Liu, Z.; Xie, Z.Y.; Zhu, J.Q.; Zheng, B.F.; Wan, W. Application of a comprehensive framework to estimate the risk of agricultural non-point source pollution in China since 2000. J. Clean. Prod. 2025, 509, 19. [Google Scholar] [CrossRef]
  8. Tian, Y.; Xia, R.; Zhang, X. Measurement of Agricultural Non-Point Source Pollution Intensity in China: Spatiotemporal Differentiation, Dynamic Evolution, and Spatial Agglomeration. Environ. Sci. Policy 2024, 1, 1–19. [Google Scholar]
  9. Wang, X. Management of agricultural nonpoint source pollution in China: Current status and challenges. Water Sci. Technol. 2006, 53, 1–9. [Google Scholar] [CrossRef] [PubMed]
  10. You, H. Impact of urbanization on pollution-related agricultural input intensity in Hubei, China. Ecol. Indic. 2016, 62, 249–258. [Google Scholar] [CrossRef]
  11. Zhao, C.; Cui, C.; Wang, M. Research on the Spatiotemporal Evolution and Influencing Factors of Agricultural Pollution Reduction, Carbon Mitigation, and Efficiency Enhancement Synergies in the Beijing-Tianjin-Hebei Region. China Agric. Resour. Reg. Plan. 2024, 1, 1–20. [Google Scholar]
  12. Yu, C.-H.; Wu, X.; Zhang, D.; Chen, S.; Zhao, J. Demand for green finance: Resolving financing constraints on green innovation in China. Energy Policy 2021, 153, 112255. [Google Scholar] [CrossRef]
  13. Tang, D.Y.; Zhang, Y. Do shareholders benefit from green bonds? J. Corp. Financ. 2020, 61, 101427. [Google Scholar] [CrossRef]
  14. Guo, L.; Zhao, S.; Song, Y.T.; Tang, M.Q.; Li, H.J. Green Finance, Chemical Fertilizer Use and Carbon Emissions from Agricultural Production. Agriculture 2022, 12, 18. [Google Scholar] [CrossRef]
  15. Ma, J.; Yue, Z. The Environmental Effects and Impact Mechanisms of Agricultural Insurance: An Examination from the Perspective of China’s Agricultural Non-Point Source Pollution from Fertilizers. Insur. Res. 2021, 9, 46–61. [Google Scholar]
  16. Li, G.J.; Jia, X.M.; Khan, A.A.; Khan, S.U.; Ali, M.A.; Luo, J.C. Does green finance promote agricultural green total factor productivity? Considering green credit, green investment, green securities, and carbon finance in China. Environ. Sci. Pollut. Res. 2023, 30, 36663–36679. [Google Scholar] [CrossRef] [PubMed]
  17. Geng, G.; Shen, Y.; Dong, C. The Impact of Green Finance on Agricultural Non-Point Source Pollution: Analysis of the Role of Environmental Regulation and Rural Land Transfer. Land 2024, 13, 1516. [Google Scholar] [CrossRef]
  18. Lin, Q.; Cheng, Q.; Zhong, J.; Lin, W. Can digital financial inclusion help reduce agricultural non-point source pollution?—An empirical analysis from China. Front. Environ. Sci. 2022, 10, 1074992. [Google Scholar] [CrossRef]
  19. Zhang, J.H.; Yu, J.Q.; Ma, S.X.; Li, J.; Zhu, Z. Green finance and agricultural climate resilience: Evidence from China. Res. Int. Bus. Financ. 2025, 78, 17. [Google Scholar] [CrossRef]
  20. Pigou, A.C. Some aspects of welfare economics. Am. Econ. Rev. 1951, 41, 287–302. [Google Scholar]
  21. Wang, X.Y.; Gao, C.Y. Does green finance policy help to improve carbon reduction welfare performance? Evidence from China. Energy Econ. 2024, 132, 21. [Google Scholar] [CrossRef]
  22. Xu, X.K.; Li, J.S. Asymmetric impacts of the policy and development of green credit on the debt financing cost and maturity of different types of enterprises in China. J. Clean. Prod. 2020, 264, 13. [Google Scholar] [CrossRef]
  23. Zhang, S.L.; Wu, Z.H.; Wang, Y.; Hao, Y. Fostering green development with green finance: An empirical study on the environmental effect of green credit policy in China. J. Environ. Manag. 2021, 296, 12. [Google Scholar] [CrossRef] [PubMed]
  24. Zhang, Y.M.; Li, X.L.; Xing, C. How does China’s green credit policy affect the green innovation of high polluting enterprises? The perspective of radical and incremental innovations. J. Clean. Prod. 2022, 336, 14. [Google Scholar] [CrossRef]
  25. Xu, J.Q.; She, S.X.; Gao, P.P.; Sun, Y.P. Role of green finance in resource efficiency and green economic growth. Resour. Policy 2023, 81, 7. [Google Scholar] [CrossRef]
  26. Peng, B.H.; Yan, W.M.; Elahi, E.; Wan, A.X. Does the green credit policy affect the scale of corporate debt financing? Evidence from listed companies in heavy pollution industries in China. Environ. Sci. Pollut. Res. 2022, 29, 755–767. [Google Scholar] [CrossRef] [PubMed]
  27. Zhao, L.H.; Chau, K.Y.; Tran, T.K.; Sadiq, M.; Xuyen, N.T.M.; Phan, T.T.H. Enhancing green economic recovery through green bonds financing and energy efficiency investments. Econ. Anal. Policy 2022, 76, 488–501. [Google Scholar] [CrossRef]
  28. Debbarma, J.; Lee, H.; Choi, Y. Sustainable Feasibility of the Environmental-Friendly Policies on Agriculture and Its Related Sectors in India. Sustainability 2021, 13, 14. [Google Scholar] [CrossRef]
  29. Zhang, B.; Xu, W.; Zhang, L. Research on the Impact of Green Finance on Farmers’ Willingness to Adopt Climate-Smart Agricultural Technologies. J. Arid Land Resour. Environ. 2025, 39, 25–36. [Google Scholar] [CrossRef]
  30. Ajzen, I. The theory of planned behavior. Organ. Behav. Hum. Decis. Process. 1991, 50, 179–211. [Google Scholar] [CrossRef]
  31. Liu, M.; Liu, H. Farmers’ adoption of agriculture green production technologies: Perceived value or policy-driven? Heliyon 2024, 10, e23925. [Google Scholar] [CrossRef] [PubMed]
  32. Zhang, Y.; Wang, J. Research on the Influence of Subjective Norms on Green Technology Innovation Behavior. Soft Sci. 2018, 32, 93–95. [Google Scholar] [CrossRef]
  33. Zhou, H.; Wen, G.; Hu, X. The Impact of Psychological Cognition Based on the TPB Framework on Farmers’ Willingness to Participate in Agricultural Non-Point Source Pollution Control—Also Discussing the Moderating Effect of Environmental Regulation. World Agric. 2021, 3, 59–69. [Google Scholar] [CrossRef]
  34. Lee, S.; Nguyen, T.T.; Poppenborg, P.; Shin, H.J.; Koellner, T. Conventional, Partially Converted and Environmentally Friendly Farming in South Korea: Profitability and Factors Affecting Farmers’ Choice. Sustainability 2016, 8, 18. [Google Scholar] [CrossRef]
  35. Li, J.Y.; Khan, A.A.; Ali, M.A.; Luo, J.C. Does farmers’ agricultural investment is impacted by green finance policies and financial constraint? From the perspective of farmers’ heterogeneity in Northwest China. Environ. Sci. Pollut. Res. 2022, 29, 67242–67257. [Google Scholar] [CrossRef] [PubMed]
  36. Zhong, S.; Xu, X.T.; Li, J.W.; Wu, N.L. Factors influencing the financing behavior of large professional households engaged in green agricultural production in China. Front. Psychol. 2023, 13, 13. [Google Scholar] [CrossRef] [PubMed]
  37. Zhao, P.P.; Zhang, W.; Cai, W.C.; Liu, T.J. The impact of digital finance use on sustainable agricultural practices adoption among smallholder farmers: An evidence from rural China. Environ. Sci. Pollut. Res. 2022, 29, 39281–39294. [Google Scholar] [CrossRef] [PubMed]
  38. Zscheischler, J.; Brunsch, R.; Rogga, S.; Scholz, R.W. Perceived risks and vulnerabilities of employing digitalization and digital data in agriculture-Socially robust orientations from a transdisciplinary process. J. Clean. Prod. 2022, 358, 14. [Google Scholar] [CrossRef]
  39. Niu, G.; Jin, X.S.; Wang, Q.; Zhou, Y. Broadband infrastructure and digital financial inclusion in rural China. China Econ. Rev. 2022, 76, 18. [Google Scholar] [CrossRef]
  40. Chung, K.H.Y.; Adriaens, P. Blockchain technology for pay-for-outcome sustainable agriculture financing: Implications for governance and transaction costs. Environ. Res. Commun. 2024, 6, 11. [Google Scholar] [CrossRef]
  41. Li, Y.Q.; Liu, H.W.; Kim, Y.; Lee, H.Y. Focus on the impact and predictive analysis of digitalization and green finance on the transformation of mineral and energy companies. Financ. Res. Lett. 2024, 59, 11. [Google Scholar] [CrossRef]
  42. Yang, C.; Zou, J.; Zhang, C. Research on the Impact Effect of Green Finance Policies on the High-Quality Development of Manufacturing Enterprises. Wuhan Financ. 2025, 2, 61–69. [Google Scholar]
  43. Izushi, H. What does endogenous growth theory tell about regional economies? Empirics of R&D worker-based productivity growth. Reg. Stud. 2008, 42, 947–960. [Google Scholar] [CrossRef]
  44. Chandra, R. Endogenous Growth in Historical Perspective: From Adam Smith to Paul Romer; Springer International Publishing: Cham, Switzerland, 2022; pp. 251–281. [Google Scholar]
  45. Li, Z.B.; Lu, X.; Wang, S.W.; Li, X.; Li, H. The threshold effect of environmental regulation in the nexus between green finance and total factor carbon productivity: Evidence from a dynamic panel threshold model. Environ. Sci. Pollut. Res. 2023, 30, 42223–42245. [Google Scholar] [CrossRef] [PubMed]
  46. Zhang, G.; Wang, Y.; Zhang, Z.; Su, B. Can green finance policy promote green innovation in cities? Evidence from pilot zones for green finance reform and innovation in China. J. Environ. Manag. 2024, 370, 122816. [Google Scholar] [CrossRef] [PubMed]
  47. Yuan, X.; Zhang, J.; Shi, J.; Wang, J. What can green finance do for high-quality agricultural development? Fresh insights from China. Socio-Econ. Plan. Sci. 2024, 94, 101920. [Google Scholar] [CrossRef]
  48. Zhang, J.; Li, F.; Ding, X. Will green finance promote green development: Based on the threshold effect of R&D investment. Environ. Sci. Pollut. Res. 2022, 29, 60232–60243. [Google Scholar] [CrossRef] [PubMed]
  49. Zhang, Y.; Tang, J.; Li, J.Y.; Bai, Y.; Pan, Y.; Wang, X.J. Study on the Characteristics of Agricultural Non-point Source Pollution in the Zhaosutai River Basin, Jilin Province. Environ. Pollut. Control 2015, 37, 29–34+40. [Google Scholar]
  50. De Roo, A.; Jetten, V. Calibrating and validating the LISEM model for two data sets from the Netherlands and South Africa. Catena 1999, 37, 477–493. [Google Scholar] [CrossRef]
  51. Abbaspour, K.C.; Yang, J.; Maximov, I.; Siber, R.; Bogner, K.; Mieleitner, J.; Zobrist, J.; Srinivasan, R. Modelling hydrology and water quality in the pre-alpine/alpine Thur watershed using SWAT. J. Hydrol. 2007, 333, 413–430. [Google Scholar] [CrossRef]
  52. Shen, W.; Zhang, L.; Li, S.; Zhuang, Y.; Liu, H.; Pan, J. A framework for evaluating county-level non-point source pollution: Joint use of monitoring and model assessment. Sci. Total Environ. 2020, 722, 137956. [Google Scholar] [CrossRef] [PubMed]
  53. Lai, S.Y.; Du, P.F.; Chen, J. Jining Chen Unit-based analysis method for non-point source pollution investigation and assessment. J. Tsinghua Univ. Sci. Technol. 2004, 9, 1184–1187. [Google Scholar]
  54. Liang, L.; Feng, S.; Qu, F. Formation Mechanism of Agricultural Non-Point Source Pollution: Theoretical and Empirical Studies. China Popul. Resour. Environ. 2010, 20, 74–80. [Google Scholar]
  55. Cheng, Y.; Zhang, D.; Wang, X. The Green Development Effect of Agricultural Socialized Services: From the Perspective of Farmers. Resour. Sci. 2022, 44, 1848–1864. [Google Scholar]
  56. Su, X.; Qiao, R.; Xu, S. Impact of green finance on carbon emissions and spatial spillover effects: Empirical evidence from China. J. Clean. Prod. 2024, 457, 142362. [Google Scholar] [CrossRef]
  57. Zhou, Y.; Chen, F. Green Finance and Green Total Factor Productivity: The Effect of Carbon Emission Reduction under Environmental Regulation. Ecol. Econ. 2023, 39, 43–51. [Google Scholar]
  58. Li, C.; Li, J.X.; You, Y.; Li, J. Carbon emission prediction and its interaction with green finance index. Stat. Theory Pract. 2023, 12, 18–26. [Google Scholar] [CrossRef]
  59. Golan, A.; Maasoumi, E. Information theoretic and entropy methods: An overview. Econom. Rev. 2008, 27, 317–328. [Google Scholar] [CrossRef]
  60. Elahi, E.; Khalid, Z.; Zhang, Z.X. Understanding farmers’ intention and willingness to install renewable energy technology: A solution to reduce the environmental emissions of agriculture. Appl. Energy 2022, 309, 15. [Google Scholar] [CrossRef]
  61. Liang, Q.; Ma, K. Can new agricultural business entities promote farmers’ green production?—A case study of chemical input reduction. J. Zhejiang Univ. Humanit. Soc. Sci. 2025, 55, 5–26. [Google Scholar]
  62. Liu, M.; Li, X.; Zhou, C. Spatio-temporal Evolution Analysis of the “Carbon Reduction-Efficiency Enhancement” Effect of China’s Digital Infrastructure. Econ. Geogr. 2025, 1, 1–15. [Google Scholar]
  63. Wang, L.P.; Long, Y.; Li, C. Research on the impact mechanism of heterogeneous environmental regulation on enterprise green technology innovation. J. Environ. Manag. 2022, 322, 16. [Google Scholar] [CrossRef] [PubMed]
  64. Lu, H.Y.; Zhang, Y.D.; Jiang, J.J.; Cao, G.L. Do market-based environmental regulations always promote enterprise green innovation commercialization? J. Environ. Manag. 2025, 375, 11. [Google Scholar] [CrossRef] [PubMed]
  65. Conroy, S.J.; Emerson, T.L. A tale of trade-offs: The impact of macroeconomic factors on environmental concern. J. Environ. Manag. 2014, 145, 88–93. [Google Scholar] [CrossRef] [PubMed]
  66. Ehrlich, P.R.; Holdren, J.P. Impact of Population Growth: Complacency concerning this component of man’s predicament is unjustified and counterproductive. Science 1971, 171, 1212–1217. [Google Scholar] [CrossRef] [PubMed]
  67. Wen, Z.; Zhang, L.; Hou, J.; Liu, H. Procedures for the mediating effect test and its application. Acta Psychol. Sin. 2004, 36, 614–620. [Google Scholar]
  68. McClelland, G.H.; Judd, C.M. Statistical difficulties of detecting interactions and moderator effects. Psychol. Bull. 1993, 114, 376. [Google Scholar] [CrossRef] [PubMed]
  69. Wang, Q. Fixed-effect panel threshold model using Stata. Stata J. 2015, 15, 121–134. [Google Scholar] [CrossRef]
  70. Hao, X.L.; Li, Y.H.; Ren, S.Y.; Wu, H.T.; Hao, Y. The role of digitalization on green economic growth: Does industrial structure optimization and green innovation matter? J. Environ. Manag. 2023, 325, 11. [Google Scholar] [CrossRef] [PubMed]
  71. Lin, C.; Wang, M.; Lan, X.; Wen, C. Research on the Impact of Environmental Protection Tax on Regional Green Competitiveness: Based on the Context of Market Integration. Resour. Environ. Yangtze Basin 2024, 33, 728–741. [Google Scholar]
  72. Wang, Q.W.; Fan, Z.N. Green finance and investment behavior of renewable energy enterprises: A case study of China. Int. Rev. Financ. Anal. 2023, 87, 11. [Google Scholar] [CrossRef]
  73. Zhang, J.; Zheng, W.; New, F. China’s banking deregulation, structural competition, and corporate innovation. China’s Ind. Econ. 2017, 10, 118–136. [Google Scholar] [CrossRef]
  74. Wang, B.; Zhang, W. Measurement and Spatiotemporal Differences of Agricultural Eco-Efficiency in China. China Popul. Resour. Environ. 2016, 26, 11–19. [Google Scholar]
  75. Fang, L.; Wu, F.; Wang, X.; Yu, Y. Measurement and Improvement Potential of Agricultural Water Use Efficiency Based on the Common Frontier SBM Model. Resour. Environ. Yangtze Basin 2018, 27, 2293–2304. [Google Scholar]
  76. Yang, J.; Ding, J. Green investment, ESG performance and new quality productivity of enterprises. J. Nanjing Univ. Technol. (Soc. Sci.) 2024, 23, 99–118+120. [Google Scholar]
Figure 1. Research design framework diagram.
Sustainability 17 06736 g001
Figure 2. EI distribution map.
Sustainability 17 06736 g002
Figure 3. Likelihood ratio statistics for first threshold value.
Sustainability 17 06736 g003
Table 1. Classification of pollution-producing units for farmland fertilizers and solid waste.
CategoryPolluting UnitIndicatorStatistical Unit
Farmland fertilizerNitrogen fertilizerApplication rate (in pure form)10,000 tons
Phosphate fertilizer
Agricultural solid wasteRice, wheat, corn, legumes, tubers, oil crops, and vegetablesTotal output10,000 tons
Table 2. Green Finance Index indicator system.
VariableIndicatorComputational MethodData SourceAttribute
GFGreen creditTotal credit for environmental projects/Total creditChina Financial Statistical Yearbook+
Green investmentInvestment completed in industrial pollution control/Gross industrial production valueChina Social Statistical Yearbook+
Green fundTotal market value of green funds/Total market value of all fundsChina Financial Statistical Yearbook+
Green supportFiscal environmental protection expenditure/Fiscal general budget expenditureStatistical Yearbooks of Provinces+
Carbon financecarbon emissions/GDPChina Energy Statistical Yearbook-
Table 3. Definitions and measurement methods of all variables.
VariableAbbreviationMeasurement Method
Agricultural non-point source pollution emission intensityEITotal agricultural non-point source pollution emissions/Cultivated land area
Green Finance IndexGFCalculated using the entropy method
Economic levelGDPGross regional product (logarithmic value)
Industrial structureStructureOutput value of the secondary industry/Regional gross domestic product
Population sizePopulationTotal population (logarithmic value)
Urban–rural disparityGapPer capita disposable income of urban residents/Per capita disposable income of rural residents
Road accessibilityRAExpressway mileage/Land area
Traditional financial supplyTFSYear-end balance of deposits and loans in financial institutions/GDP
Degree of agricultural mechanizationDAMTotal agricultural machinery power/Cultivated land area
Green production behaviorFGPPesticide usage (logarithmic value)
Digital infrastructure levelDILength of long-distance optical cable lines/Land area (logarithm taken)
Innovation capabilityTINumber of invention patent applications
Table 4. Descriptive statistics.
VariableObsMeanStd. Dev.MinMax
EI5890.4560.3400.0281.483
GF5890.2580.0770.0670.687
GDP5899.5111.1265.51711.818
Structure58943.5928.93914.90061.500
Population5898.1110.8495.6359.450
Gap5892.6750.4871.7184.601
RA589280.954266.2400.3081398.413
TFS5893.2601.1481.4548.164
DAM5890.8610.3960.1901.999
FGP5891.0081.411−3.2192.853
DI5891766.6871294.54477.9558833.016
TI5893178.2279234.471092681
Table 5. Baseline regression results.
(1)(2)
EIEI
GF−0.245 ***−0.204 **
(−2.59)(−2.50)
Constant0.603 ***0.362
(23.16)(0.59)
ControlYesYes
IDYesYes
YearYesYes
N589589
R20.2520.475
F13.00922.599
Notes: t statistics in parentheses. ** p < 0.05, and *** p < 0.01.
Table 6. Regression results of mechanism testing and moderating effects.
(1)(2)(3)
VariablesFGPEIEI
GF−0.653 ***−0.056−0.293 ***
(−4.59)(−0.73)(−3.53)
FGP 0.227 ***
(9.93)
DI 0.003
(0.13)
c_DI × c_GF −0.293 ***
(−4.13)
Constant6.715 ***−1.161 **0.524
(6.29)(−1.99)(0.86)
ControlYesYesYes
IDYesYesYes
YearYesYesYes
N589589589
R20.5830.5560.490
F33.79829.40322.249
Notes: t statistics in parentheses. ** p < 0.05, and *** p < 0.01.
Table 7. Significance test of threshold effect.
Threshold VariableThreshold CategoryF-Statisticp-ValueCritical Values at Different Significance Levels
10%5%1%
TI185.310.00034.73538.04654.006
219.800.20724.99831.82348.480
320.580.33735.12840.53752.943
Table 8. Threshold regression results.
EI
GFTI ≤ 3111−0.040
(−0.52)
TI > 3111−0.571 ***
(−6.60)
_cons0.277
(−0.48)
ControlYes
IDYes
YearYes
N589
R20.587
F27.92
Notes: t statistics in parentheses. *** p < 0.01.
Table 9. Robustness tests.
(1)(2)(3)
VariablesGMM
EI
First Stage
GF
Second Stage
EI
IV 0.791 ***
(16.64)
GF−0.134 *** −3.372 ***
(−2.79) (−11.76)
L.EI0.891 ***
(46.26)
Constant4.966 ***0.162 **0.100 ***
(3.80)(2.43)(3.34)
ControlYes Yes Yes
IDYes Yes Yes
YearYes Yes Yes
N558589589
AR(1)0.010
AR(2)0.676
Hansen test0.999
Kleibergen–Paap rk LM statistic 132.608 ***
Kleibergen–Paap rk Wald F-statistic 276.849 (16.38)
Notes: t or z statistics in parentheses. ** p < 0.05 and *** p < 0.01. The value in parentheses () in column (2), the Kleibergen–Paap Wald F-statistic, is the critical value of the Stock–Yogo test at the 10% level.
Disclaimer/Publisher’s Note: The statements, opinions and data contained in all publications are solely those of the individual author(s) and contributor(s) and not of MDPI and/or the editor(s). MDPI and/or the editor(s) disclaim responsibility for any injury to people or property resulting from any ideas, methods, instructions or products referred to in the content.

