Article

Balanced Fertilization of Winter Wheat with Potassium and Magnesium—An Effective Way to Manage Fertilizer Nitrogen Sustainably

by
Agnieszka Andrzejewska
,
Katarzyna Przygocka-Cyna
and
Witold Grzebisz
*
Department of Agricultural Chemistry and Environmental Biogeochemistry, Poznan University of Life Science, Wojska Polskiego 28, 60-637 Poznan, Poland
*
Author to whom correspondence should be addressed.
Sustainability 2025, 17(15), 6705; https://doi.org/10.3390/su17156705
Submission received: 12 June 2025 / Revised: 16 July 2025 / Accepted: 21 July 2025 / Published: 23 July 2025
(This article belongs to the Special Issue Soil Fertility and Plant Nutrition for Sustainable Cropping Systems)

Abstract

In agricultural practice, in addition to determining the nitrogen (Nf) dose, it is necessary to effectively control its effect on currently grown crops. Meeting these conditions requires not only the use of phosphorus (P) and potassium (K), but also nutrients such as magnesium (Mg) and sulfur (S). This hypothesis was verified in a single-factor field experiment with winter wheat (WW) carried out in the 2015/2016, 2016/2017, and 2017/2018 growing seasons. The experiment consisted of seven variants: absolute control (AC), NP, NPK-MOP (K as Muriate of Potash), NPK-MOP+Ki (Kieserite), NPK-KK (K as Korn–Kali), NPK-KK+Ki, and NPK-KK+Ki+ES (Epsom Salt). The use of K as MOP increased grain yield (GY) by 6.3% compared to NP. In the NPK-KK variant, GY was 13% (+0.84 t ha−1) higher compared to NP. Moreover, GYs in this fertilization variant (FV) were stable over the years (coefficient of variation, CV = 9.4%). In NPK-KK+Ki+ES, the yield increase was the highest and mounted to 17.2% compared to NP, but the variability over the years was also the highest (CV ≈ 20%). The amount of N in grain N (GN) increased progressively from 4% for NPK-MOP to 15% for NPK-KK and 25% for NPK-KK+Ki+ES in comparison to NP. The nitrogen harvest index was highly stable, achieving 72.6 ± 3.1%. All analyzed NUE indices showed a significant response to FVs. The PFP-Nf (partial factor productivity of Nf) indices increased on NPK-MOP by 5.8%, NPK-KK by 12.9%, and NPK-KK+Ki+ES by 17.9% compared to NP. The corresponding Nf recovery of Nf in wheat grain was 47.2%, 55.9%, and 64.4%, but its total recovery by wheat (grain + straw) was 67%, 74.5%, and 87.2%, respectively. In terms of the theoretical and practical value of the tested indexes, two indices, namely, NUP (nitrogen unit productivity) and NUA (nitrogen unit accumulation), proved to be the most useful. From the farmer’s production strategy, FV with K applied in the form of Korn–Kali proved to be the most stable option due to high and stable yield, regardless of weather conditions. The increase in the number of nutritional factors optimizing the action of nitrogen in winter wheat caused the phenomenon known as the “scissors effect”. This phenomenon manifested itself in a progressive increase in nitrogen unit productivity (NUP) combined with a regressive trend in unit nitrogen accumulation (NUA) in the grain versus the balance of soil available Mg (Mgb). The studies clearly showed that obtaining grain that met the milling requirements was recorded only for NUA above 22 kg N t−1 grain. This was possible only with the most intensive Mg treatment (NPK-KK+Ki and NPK-KK+Ki+ES). The study clearly showed that three of the six FVs fully met the three basic conditions for sustainable crop production: (i) stabilization and even an increase in grain yield; (ii) a decrease in the mass of inorganic N in the soil at harvest, potentially susceptible to leaching; and (iii) stabilization of the soil fertility of P, K, and Mg.

1. Introduction

Nitrogen, provided that there is sufficient water availability, is a decisive factor for crop plant growth and the formation of yield components [1,2]. Moreover, the nitrate nitrogen ion (N-NO3) is considered as crucial for plant morphogenesis. This inorganic N form, acting as a plant morphogen, affects both roots and shoots growth. Its deficiency in the growth medium changes the morphology of the root system, which forces it to grow in areas rich in nitrates [3,4]. This specificity of crop plants; response to soil nitrate availability is considered a key factor in breeding new varieties. The steep, cheap, and deep breeding concept focuses on exploring nitrate resources in the soil [5]. The critical stages of wheat yield formation and demand for N are well defined [6]. Despite this knowledge, the nitrogen use efficiency of nitrogen fertilizers (NUE) is low. As thousands of field experiments have shown, the recovery of applied Nf is in the range of 30–50% [7]. The remaining Nf is dispersed in the environment, thus posing a threat to the stability of natural ecosystems [8].
The consequence of inefficient Nf use by crops is the yield gap, or more precisely, the nitrogen gap (N gap) [9]. In the case of wheat, it is significant and results not only from the impact of environmental factors [10]. The N gap amelioration strategy requires a holistic view of the plant’s demand for nutrients during the formation of the yield structure [11]. The key reason of the N gap is not only, as it is generally believed, an inappropriate N dose, N form, or Nf application date (N term) [12]. The key reason for low NUE in the second stage/level of growth factor validation is the imbalance between the amount of inorganic N in the soil/plant system during the growing season and the availability of nutrients that condition N uptake and its use by the plant [13]. Nutritional factors must, therefore, be an important factor determining sustainable N management in the agroecosystem [9,13].
The first nutrient in the above approach is P [14,15]. However, in intensive agricultural practice, P is excessively applied, and, therefore, its recovery is low [2,16]. For example, in nutritionally well-nourished winter oilseed rape, P remobilization from vegetative parts during the seed filling period has remained unchanged for over 50 years, but yields have doubled [17,18,19]. The nutrient taken up by high-yielding crop plants in the largest amount is potassium (K). This rule does not apply only to root and tuber crops, which is documented and widely recognized. In the case of potatoes, it has been recently documented that the narrower the K:N ratio, the higher the NUE obtained, and, thus, the higher the tuber yield [20,21]. There are only a few examples of higher K uptake by cereals compared to N during the pre-flowering growth [22,23]. Projections of global K consumption for the future (2050) do not take into account these relationships [24]. Finally, it should be clearly emphasized that even in some academic textbooks, the recommended K:N ratio used in fertilizers is below 1.0 [25]. As a result, the use of K fertilizers by farmers in crop production, despite this well-documented knowledge, is far below the realistic needs of high-yielding seed crops [26]. A consequence of current practice is an imbalance of N and K, resulting in Nf inefficiency, leading to the formation of the N gap [2,9,20,21].
K has many functions in the plant, starting from photosynthesis, through ions transport in the xylem, plant growth, and finally, yield [27]. The role of K in the uptake and transport of inorganic N ions is well known. This cation dominates, among others, in the process of NO3 uptake, according to the rule (2K+ × NO3) [14,28]. In the case of crop plants, the role of K concerns the physiological and molecular processes responsible for the daily cycle of stomata [29,30], hence the important role of K in alleviating, at least partly, water stress in crop plants [31,32]. No less important is K for the quantity and quality of the yield. K ions are involved in the transport of assimilates from leaves to storage organs (root and tuberous plants) or to generative organs (seeds and grains). N management during the vegetation of seed plants is confirmed by the dynamics of K uptake, as well as the dynamics of plant growth during this period [22,33]. On this basis, it is justified to state that K is a key nutrient determining N use efficiency (NUE), regardless of its source (i.e., soil, atmospheric N2 fixation, N dose in the applied fertilizer).
The sustainable strategy of high-yielding crops fertilization with N cannot be limited to P and K. A good Nf management strategy requires the use of nutrients, referred to in agricultural practice as secondary nutrients [34]. In fields with regulated soil pH, these requirements are met by magnesium (Mg) and sulfur (S). Both nutrients play a very important role in the metabolism of crop plants and in the yield formation [35,36]. Both nutrients are present in magnesium sulfate, which is easily soluble in water (i.e., Kieserite, MgSO4 × H2O and Epsom Salt (ES), MgSO4 × 7H2O). Kieserite is usually applied to the soil, and ES as an aqueous solution on plant leaves in the form of a spray [37]. The key function of Mg in the plant is its presence as a component of chlorophyll. Its necessity for all energy conversion processes, including N uptake and transport in the plant, has been well documented [38]. In turn, S, being in a stable relationship with N, is necessary for the synthesis of sulfur amino acids. In this way, it determines the quality of plant proteins [39,40].
The above presented considerations on the role of nutrients controlling yield-forming effect of Nf are consistent with the assumptions of the sustainable intensification of agriculture (SIA) concept. Its key assumption is the effective use of critical means of production, such as fertilizer nitrogen (Nf) [9,41]. Achieving this goal is only possible if Nf is used efficiently and its utilization rate does not lead to yield reduction. Furthermore, the Nmin content after harvest of the currently cultivated crop should be at a level that does not pose a threat to the environment [2,8,12]. The second assumption of rational nutrient management is to maintain a stable level of soil fertility, in accordance with the Law of Return [13,42]. The degree of crop plants’ response to nutritional growth factors can best be assessed by analyzing the sensitivity of N productivity indices to the effects of other nutrients. Classic N efficiency indices can be generated using field experiments with so-called absolute control. Operational indices, however, do not require this database because they are based on the direct measurement of the yield and N accumulation [1,2,43,44].
It was assumed that in naturally fertile K soil, a moderate dose of K fertilizer, but supported by an appropriate amount of Mg and S, guarantees a significant increase in the GY of winter wheat. The expected increase in winter wheat yields results from increased Nf productivity, which is the effect of the active exploration of nutrients from both applied fertilizers and soil resources. Based on this hypothesis, the following set of objectives was established. The primary objective was to assess the effect of balanced K–MgS fertilization on grain yield, its components, and N accumulation in winter wheat at harvest. The second objective was to determine the best set of K and MgS fertilization regimes to maximize winter wheat grain yield. The third objective was to assess the effect of K and Mg application in different fertilizer variants on the nutrient balance in wheat and soil. The fourth objective was to assess the usefulness of differently developed NUE indices for a reliable and practical assessment of N economics in winter wheat.

2. Materials and Methods

2.1. Experimental Site

Studies on the effect of balanced fertilization of winter wheat were carried out in the growing seasons 2015/2016, 2016/2017, and 2017/2018 at the Brody Experimental Far, Poznan University of Life Sciences (52°26′ N, 16°18′ E, 92 m a.s.l.), Poznań, Poland. The field experiment was conducted on Albic Luvisol formed from loamy sand underlined by light loam. The soil pH was slightly acidic, being the lowest in the growing season 2017/2018. The organic carbon (Corg) content was low (<20 g kg−1). The content of available nutrients, measured before applying fertilizers, was very high in all growing season and stable for phosphorus (P). The content of potassium (K) was on the border of the low and medium availability classes. The content of available Mg was in the high class in the first growing season and in the medium class in the other two growing seasons. The content of calcium (Ca), despite the year-to-year variability was in the low class. Of the four micronutrients examined, the most stable content in the years of the study was found for iron (Fe) and manganese (Mn), which were in the medium class. The content of available copper (Cu) was in the low class in the first and the third growing season, and in the medium class in the second growing season. The content of zinc (Zn) showed the same trend as for Cu but was a class higher. The amount of mineral N (Nmin), measured just before the spring regrowth of winter wheat in the 0.0–0.6 m layer, was generally moderate, ranging from 48 to 66 kg ha−1 (Table 1).

2.2. Weather Conditions

The local climate in the geographical area of the field experiment is classified as a moderate climatic zone (transitional between Atlantic and Continental). In the summer months, continental conditions dominate, with high temperatures, thunderstorms, and locally distributed rains. The climate of the study area in the period 1964–2015 was characterized by an average annual temperature of 8.1 °C (in the range from 6.6 to 10 °C) and total precipitation of about 580 mm per year (in the range from 310 to 840 mm). Weather conditions were very variable in subsequent growing seasons (Table 2).
In the 2015/2016 growing season, the most unfavorable conditions were revealed in early January, when temperatures were below −10 °C for several consecutive days. From early February, temperatures remained in the range of 0–5 °C, which was high enough to break the winter dormancy of wheat plants. As a result, the crop reached the full tillering phase at the end of winter. Suitable temperatures for growth of wheat dominated throughout the spring part of the wheat growing season. Extreme temperatures occurred in June.
In general, the meteorological conditions in the 2016/2017 growing season were very favorable for winter wheat growth. Sufficiently high temperature and high precipitation in October resulted in an accelerated rate of plant growth. Temperatures in February and especially in March were high enough to break plant dormancy and initiate intensive regrowth of plants. The total amount of precipitation was favorable for plant growth in the critical stages of yield formation (i.e., stem elongation, germination and flowering, grain filling).
In general, meteorological conditions in the 2017/2018 growing season were unfavorable for winter wheat. Extremely high temperatures, which significantly exceeded long-term averages, were first recorded at the end of March. This trend was observed throughout most of the spring part of the growing season. In the third decade of July, the difference reached almost 3 °C, which accelerated the rate of plant ripening. The amount and distribution of rainfall was unfavorable for wheat. There was a deficit of precipitation throughout the whole spring vegetation. Total rainfall from February to the end of June was 140 mm, but the long-term average is 207 mm. In May, the amount of rainfall was 19.2 mm against the long-term average of 37.4 mm.

2.3. Experimental Design

The data used in this study were based on a one-factor field experiment replicated four times. Details of the experimental design (fertilization variants, and FVs) are shown in Table 3. The total area of a single plot was 30 m2 (2 × 15 m). The winter wheat was sown annually after winter oilseed rape in the first week of October at 300 grains m−2. The crop was harvested the following year at the end of July from an area of 19.5 m−2 (1.5 × 13 m). Nitrogen fertilizer was applied to the top using a fertilizer spreader. It was applied in the form of ammonia nitrate (34:0:0; producer Grupa Azoty Puławy, Puławy, Poland) in line with the following experimental schedule:
(1)
The first N dose of 80 kg N ha−1 was applied at the end of winter, just before the start (regrowth) of winter wheat vegetation.
(2)
The second N dose of 70 kg N ha−1 was applied at the beginning of the shoot elongation phase (BBCH 31/32).
Phosphorus was applied in the form of triple superphosphate (46% P2O5; producer: Grupa Azoty Fosfory, Gdańsk, Poland). Potassium was applied in accordance with experimental schedule in two forms: (i) muriate of potash (MOP, 60% K2O; producer: K+S, Kassel, Germany) and (ii) Korn–Kali (K-MgO-Na2O-SO3 → 40-6-3-12.5; producer: K+S, Kassel, Germany). Magnesium was applied as ESTA Kieserite (25% MgO, 50% SO3 producer: K+S, Kassel, Germany). All these fertilizers were applied to the soil two weeks before wheat sowing. EPSO Top (16% MgO, 32% SO3) was applied to the wheat foliage in accordance with the schedule presented in Table 4. Plant protection was conducted in accordance with the principles of the Code of Good Practice.

2.4. Plant Material Sampling and Analysis

The plant material used to determine dry matter and the N content in grain and straw of winter wheat was collected at the full ripening stage (BBCH 90). The N content was determined in plant material using the standard macro Kjeldahl method [49]. The results were expressed on a dry matter basis. The mass of N in winter wheat parts was calculated based on the grain and straw biomass and the N content. For mineral nutrients, the collected plant sample was dried at 65 °C and then mineralized at 550 °C. The obtained ash was dissolved in 33% HNO3. The P concentration was measured using the vanadium–molybdenum method with a Specord 2XX/40 (Analytik Jena, Jena, Germany) at a wavelength of 436 nm. The concentrations of K and Mg were determined using flame-type atomic absorption spectrometry. The results were expressed on a dry matter basis. The mass of the nutrients in winter wheat at harvest was calculated based on the grain and crop residues biomass and the content of a given nutrient.

2.5. Calculated Parameters

Equations for calculating the amount of N in grain or total biomass of winter wheat, as well as algorithms for N management indicators and N use efficiency (NUE) indicators, are presented below [50].
  • Grain density, GD
G D = N E × G E ,   n u m b e r   g r a i n s   m 2 × 1000
2.
Harvest index
H I = G Y T B × 100 %
3.
Nitrogen accumulation in grain, GN
G N = G Y × N ,     k g   N   h a 1
4.
Nitrogen accumulation in straw, SN
S N = S Y × N ,     k g   N   h a 1
5.
Total accumulation of nitrogen in wheat biomass, TN
T N = G N + S N ,     k g   h a 1
6.
Nitrogen harvest index, NHI
N H I = G N T N × 100 %
7.
Nitrogen unit accumulation in grain, NUA-GN
N U A - G N = G N G Y     k g   N × t 1
8.
Nitrogen unit accumulation in total wheat biomass, NUA-TN
N U A - T N = T N G Y     k g   N × t 1
9.
Nitrogen unit productivity—grain, NUP-GN
N U P - G N = G Y × 1000 G N       k g   g r a i n × k g 1   N
10.
Nitrogen unit productivity—total N, NUP-TN
N U P - T N = G Y × 1000 T N     k g   g r a i n × k g 1   N
11.
Partial factor productivity of fertilizer N, PFP-Nf
P F P - N f = G Y × 1000 N f     k g   g r a i n   k g 1   N f
12.
Agronomic nitrogen efficiency, ANE
A N E = G Y N × 1000 G Y A C × 1000 N f     k g   g r a i n × k g 1   N f
13.
Nitrogen recovery, R-GN
R - G N = G N G N A C N f × 100 %
14.
Nitrogen recovery, R-TN
R - G N = T N T N A C N f × 100 %
15.
Physiological nitrogen efficiency, PhNE-GN
P h N E - G N = G Y N × 1000 G Y A C × 1000 G N A C G N A C     k g   g r a i n   k g 1   N
16.
Physiological nitrogen efficiency, PhNE-TN
P h N E - T N = G Y N × 1000 G Y A C × 1000 T N A C T N A C     k g   g r a i n   k g 1   N
where
  • GY—grain yield, t ha−1;
  • NN content in grain or crop residues;
  • g kg−1 DW, NAC—nitrogen control;
  • Nf—treatments fertilized with nitrogen.
The crop nutrient balance (CNB) is the difference between the amount of nutrients introduced in fertilizers and accumulated in the biomass of winter wheat during harvest. The crop residue replacement ratio (CRRR) was calculated as the ratio of a given nutrient in harvest residues and CNB. Both indices were calculated using algorithms:
C N B = N u i n   N u o u t ,       k g   h a 1
C R R R = N u C N B
where
  • Nu—nutrients: N, P, K, Mg, kg ha−1;
  • in—nutrient input in applied fertilizers, kg ha−1;
  • out—nutrient output in winter wheat biomass, kg ha−1.
The net nitrogen balance (NNb) during the winter wheat growing season was calculated using the formula
N N b = N m i n s + N f T N h + N m i n h ,       k g   N   h a 1  
where
  • Nmin—the amount of mineral N in soil, kg N ha−1;
  • s, h—sampling time, spring, harvest;
  • TN—the amount of N in winter wheat biomass at harvest, kg N ha−1.
The nitrogen mass balance during the spring vegetation of winter wheat and the balance of available P, K, and Mg forms were calculated using algorithms:
N b =   N s   N h ,       k g   h a 1  
M g b =   M g b f M g h ,       m g   k g 1
where
  • N—mass of Nmin, kg ha−1;
  • Mg (P, K)—content of available Mg, mg kg−1;
  • b—nutrient balance, kg ha−1 or mg kg−1;
  • s, h, bf—soil sampling dates: spring, harvest, and before winter wheat sowing.

2.6. Statistical Analysis

The effects of the experimental factor (fertilization variants, FVs) in subsequent years of the study were assessed for primary or aggregate winter wheat characteristics and developed N management and NUE indicators. The examined variables were evaluated based on the coefficient of variation (CV) using ranges proposed by Wilding and Drees [51]. According to the proposed ranges, CV <15%, 15% < CV < 35%, and >35% indicate low, moderate, and high variability in the obtained data, respectively. Means were separated by honest significant difference (HSD) using Tukey’s method when the F-test indicated significant factorial effects at the level of p < 0.05. In the second step of the diagnostic procedure, stepwise regression was applied to discriminate the set of plant traits determining the grain yield. In the computational procedure, a consecutive variable was removed from the multiple linear regressions in a step-by-step manner. The best regression model was chosen based on the highest F-value [52]. Pearson correlation and linear regression STATISTICA 12 software was used for all statistical analyses (StatSoft Inc., Tulsa, OK, USA, 2013).

3. Results

3.1. Grain Yield and Yield Components

The grain yield (GY) of winter wheat significantly depended on fertilization variants (FVs), but it was variable in subsequent years of the study (Table 5). The average GY was 6.6 ± 1.5 t ha−1, showing moderate variability in response to the Y × FVs interaction (CV = 22.9%). The key reason of the observed year-to-year variability was weather in 2018. In this particular year, GY was 22% lower compared to 2017, which was the highest. GY at the absolute control (AC) was twice as low compared to the most intensive FVs, i.e., NPK-KK+Ki+ES. At the same time, no significant differences were found between GYs in the AC variant in subsequent years (Figure 1). The same level of GY stability, as indicated by CV <10%, was achieved for NP and NPK-KK (Table S1). However, GY for the latter FV was 13.1% greater compared to NP. The highest GY combined with the highest year-to-year variability (CV = 19.8%) was the NPK-KK+Ki+ES attribute. It was 18% (+1.14 t ha−1) higher compared to NP. GY was significantly, except for thousand grain weight (TGW), correlated with primary yield components (Table A1). The strongest direct effect was exerted by the number of grain per ear (GE). The relationship obtained was best described by a quadratic regression model (Figure S1):
G Y =   0.011 G E 2 + 0.65 G E 6.31   f o r   n = 21 ,   R 2 = 0.57 ,   p   0.01  
The maximum GY of 6.82 t ha−1 was found for GE of 35.4 grains ear−1. Such values and ones higher were recorded only once in 2016, three times in 2017, and four times in 2018. The highest GE obtained in 2018 was associated with the lowest number of ears per m2 (NE, Table 5). At the same time, the highest NE in 2016 was associated with the lowest GE. In 2018, NE was lower by 22.3% compared to 2016, whereas GE was higher by 24.3%. The variability in NE, resulting from the effect of FVs and years, expressed by coefficient of variation (CV) was in the low class (<14.3%), while that of GE was in the medium class (21.3) (Table 5). Both wheat traits did not show any response the Y × FVs interaction. The third primary GY component, i.e., thousand grain weight (TGW), responded significantly to the examined interaction (Table 5). The average TGW was 46.1 ± 3.1 g and resulted from a significant decrease in 2018 compared to 2016 down to (−10 and −9 g, respectively) (Figure A1). The TGW variability assessed by CV was the highest, exceeding 10%, for NPK-MOP and NPK-KK+Ki+ES. The most stable FV was NPK-KK+Ki, for which TGW reached 47 g, but CV was only 0.9% (Table S1). Although TGW did not show any significant relationship with GY, together with GD, it explained 99.9% of the variability in GY:
G Y =   6.58 + 0.48 G D + 0.14 T G W     f o r   n = 21 ,   R 2 = 99.6 ,   p   0.001
Straw yield (SY), averaged across the tested factors, was 7.7 ± 1.6 t ha−1, being at the same level of variability as found for GY (Table 5). It was significantly correlated with GY and especially with the total wheat biomass (TB) at maturity. At the same time, SY was significantly associated with NE and GD, but not with GE (Table A1). The yield structural index, which is the harvest index (HI), reached, on average, 46 ± 3%, being significantly driven by the Y × FVs interaction (Table 5). Both, SY and HI explained the 99.3% variability in GY:
G Y =   10.8 + 0.86 S Y + 23.4 H I   f o r   n = 21 ,   R 2 = 99.3 ,   p   0.001

3.2. Nitrogen Accumulation−N Management Indicators

Nitrogen accumulation in wheat grain (grain nitrogen, GN) was affected by FVs, but the values were significantly variable between years. The average GN was 125.2 ± 34.4 kg ha−1 (CV = 27.5%). However, no interaction between these two factors was found (Table 6). Significantly higher GN compared to both other years was recorded in 2017. The effect of the tested FVs was very specific. The application of NP doubled GN (+123%) compared to AC. A significant increase of 18.2%, compared to NP, was recorded the first time for NPK-KK+Ki. This upward trend continued up to NPK-KK+Ki+ES and amounted to 6.3% compared to the previous FV. To sum up, the increase in GN in this particular FV compared to NP was 25.5%. The highest GN stability over the study years was found for NPK-KK (CV = 6.3%) and the highest variability for NP (CV = 17.4%) (Table S1).
The average amount of N in straw (SN) was 46.7 ± 12.6 kg ha−1 (CV of 26.9%). Similarly to GN, the highest SN was recorded in 2017. The amount of N in the NP plot was almost 1.5 times higher compared to AC. However, no significant differences were found between FVs. The total N (TN) accumulated by winter wheat at maturity was 171.9 ± 46.1 kg ha−1 (CV of 26.8%). This wheat trait was almost completely dependent on GN (r = 0.99 ***), and only slightly weaker on SN (r = 0.95 ***) (Table A2). All these wheat traits showed a strong effect on GY, being slightly weaker for SN (r = 0.82 ***). No significant relationship was found between the studied N traits and yield components such as NE and TGW. At the same time, a strong response of GE was noted, which was the highest for GN (r = 0.82 ***). A significant HI response to discussed N traits was revealed only for GN and TN. The nitrogen harvest index (NHI) was the only winter wheat trait that did not show any significant response to the tested factors and their interaction. The average NHI was 72.6 ± 3.1%, and CV was only 4.3% (Table 6). This wheat trait did not correlate significantly with all the characteristics studied, except HI (r = 0.82 ***; Table A2).
The first of the discussed N management indices, i.e., PFP-Nf, showed the same trend as GY (Table 6). This state results directly from the method of calculation. However, CV of this index was slightly smaller compared to that of GY, reaching 22%. The basic operational indicators of N management by a crop plant are N unit productivity (NUP) and N unit accumulation (NUA). Both were calculated based on GN or TN. All responded to experimental factors, but not to the interaction between them. This method of calculating presupposes lower values for NUP-TN, which was noted. The average NUP-GN was 55.5 ± 8.9, and CV of 16%. The average NUP-TN was lower by 1/3 compared to NUP-GN and amounted to 39.8 ± 5.8 with CV of 14.5%. The highest NUP was recorded in 2016. The highest values of this index, regardless of the tested FVs, were found for AC. For NUP-GN, it was higher by about 25% compared to NPK-MOP and NP. The lowest, amounting to 50 kg grain kg−1 GN, was recorded for the FVs with Mg. In the case of NUP-TN, its values compared to AC decreased by 22%, which was found for NPK-MOP and NPK-KK. The greatest decrease in NUP-TN relative to NUP-GN was noted just for AC and NP variants. The most stable in this respect were FVs intensively fertilized with Mg. The effect of the year factor on NUA indices was much more pronounced for NUA-TN than for NUA-GN. In the latter case, its value in 2017 was intermediate to the other years. In contrast, NUA-TN followed the order 2016 < 2017 < 2018. The largest difference between both indices revealed in 2018. The highest values of both indices were recorded for FVs with KK and Mg and the lowest for AC. This difference was about 37.5% for both indices. At the same time, the increase in NUA-TN compared to NUA-GN was 37% for AC and 42% for NP, which was the highest.
For NUP-type indices, which also include AC, higher R2 values, expressing stronger correlation between both wheat traits, were obtained for TN as an independent variable. The obtained relationships are presented in the following set of equations:
(1)
Grain nitrogen, GN:
G Y = 0.01 N U P 2 + 1.13 N U P 23.7   f o r   n = 21 ,   R 2 = 0.49 ,   p 0.05
(2)
Total nitrogen, TN:
G Y = 0.03 N U P 2 + 2.63 N U P 44.7   f o r   n = 21 ,   R 2 = 0.71 ,   p 0.01
The cardinal values, i.e., the maximum grain yield (GYmax) and the optimal NUP (NUPop) value, were 8.01 t ha−1 and 56.3 kg grain kg−1 accumulated N in grain and 7.63 t ha−1 and 40 kg grain kg−1 N in the total biomass of winter wheat during harvest. The FV that met both of these conditions turned out to be NPK-MOP.

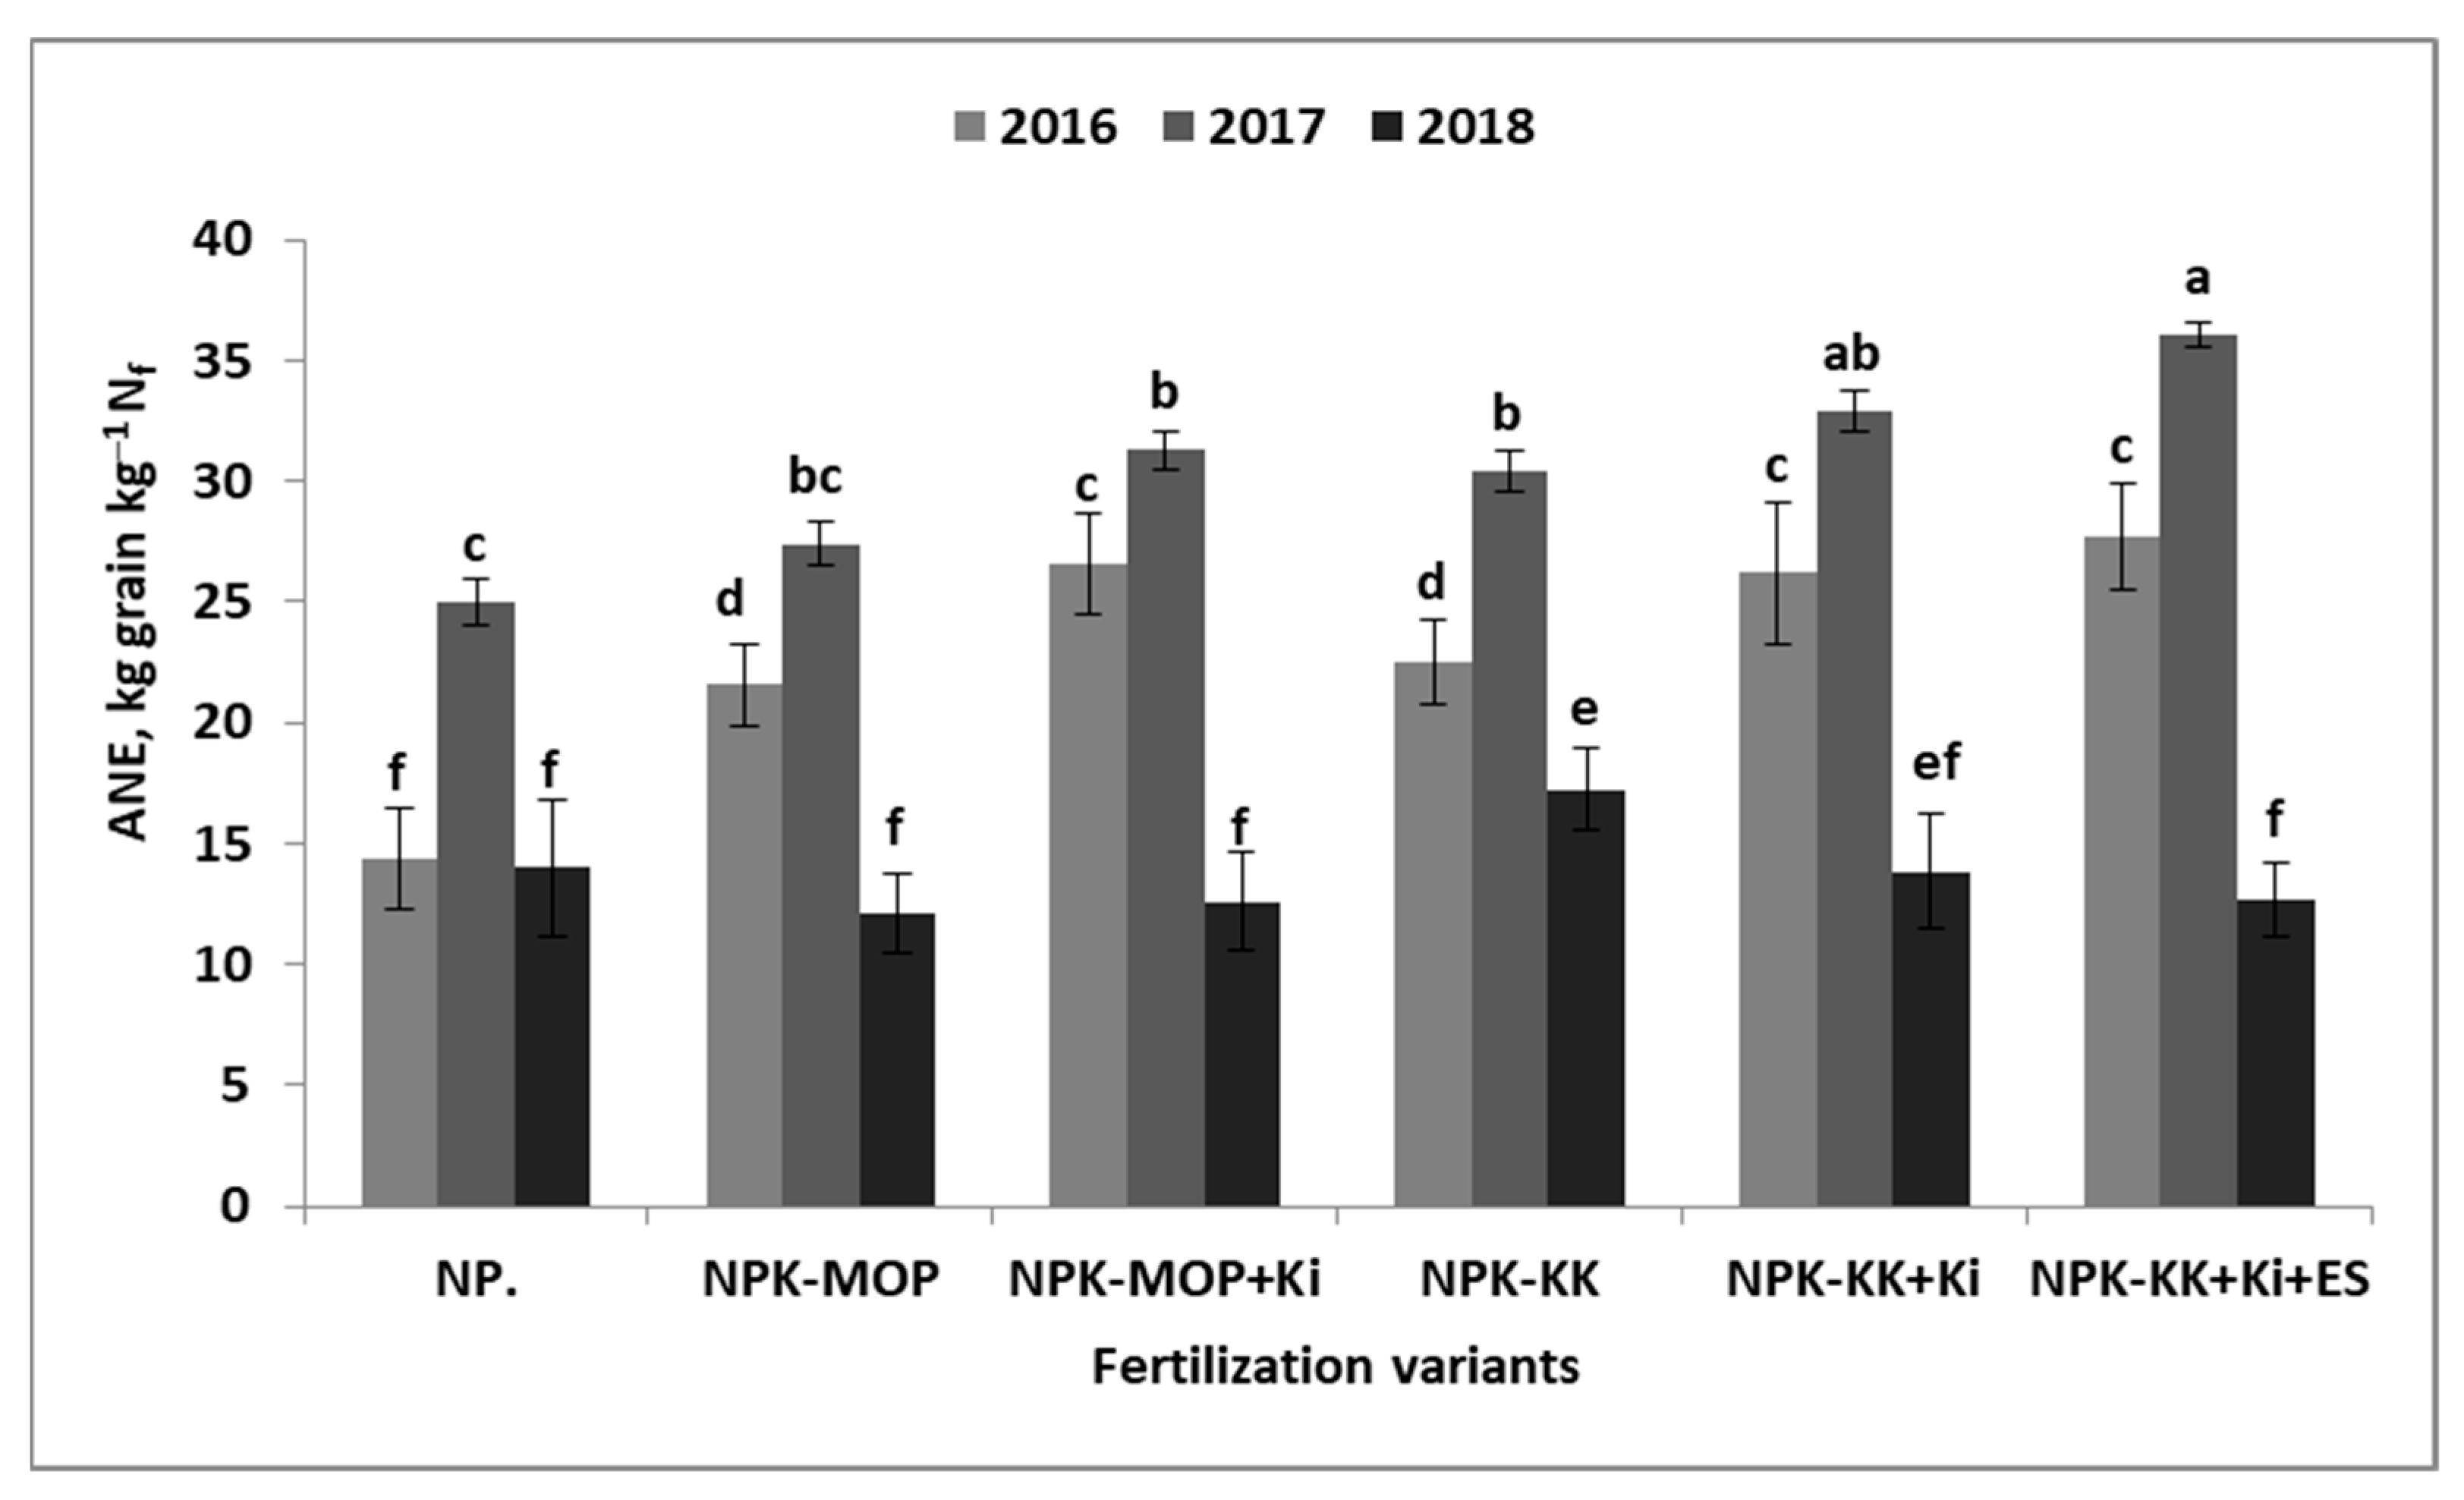
3.3. Nitrogen Use Efficiency Indicators

Five classic nitrogen use efficiency (NUE) indices were calculated (Table 7). The agronomic nitrogen efficiency (ANE) indicator was the only one among those tested that showed a significant response to the Y × FVs interaction (Figure A2). It reached, averaged across the studied factors, the value of 22.5 ± 7.9 kg grain kg−1 Nf. However, at the same time, it showed a high variability, as indicated by the coefficient of variation (35.2%). The key driver of ANE was the course of the weather during the growing season (Table 2). In the first growing season, this index was the largest, slightly exceeding 30 kg grain kg−1 Nf. In this particular growing season, its values extended from 25 kg grain kg−1 Nf in the NP plot, and 27 kg grain kg−1 Nf in NPK-MOP, to 36 kg grain kg−1 Nf in NPK-KK+Ki+ES. The ANE index in 2017/2018 was 2.2 times smaller compared to the previous season. The variability of ANE was high. In four out of six FVs, CV exceeded 35% (the high CV class) (Table S1). The lowest CV of 28% was recorded in NPK-KK and was significantly higher, but still in the medium variability class (15–35%). The highest CV, approaching 50%, was recorded for the most intensive FV, i.e., NPK-KK+Ki+ES. ANE was significantly but weakly correlated with NE and with TGW (moderately) but not with GE. At the same time, it showed strong correlation with SY (r = 0.80 **) (Table A3).
Two Nf recovery (R) indices were calculated. The first was based on N accumulated only in grain (GN) and the second was based to the total N in wheat biomass at harvest (TN). Logically, R-GN values were generally lower compared to R-TN (Table 7). The effect of the year factor on the R indices was high, but not as great as in the case of ANE. The highest Nf recovery, regardless of the type of R index, was recorded in the 2016/2017 growing season. In the case of R-TN, it approached 100%. In relation to the FVs studied, the highest R indicators, regardless of its type, were found for the NPK-KK+Ki+ES variant. For this plot, R-GN was higher than NP by 17.2 p.p. and higher than NPK-MOP by 6 p.p. In the case of R-TN, these differences were 20.2 and 8.7 p.ps., respectively. Both indices did not correlate with primary yield components. However, a strong correlation coefficient, especially for R-GN with GY, was found (Table A3).
Indices of physiological N use efficiency (PhNE) were calculated in the same way as R indices. The growing season (year) was revealed as the only factor differentiating the PhNE values. Therefore, almost the same seasonal trends were observed. The highest PhNE values were recorded in the 2015/2016 growing season. Only for TN did significant differences between the first two seasons occur. The lowest values, significantly, were recorded in the 2017/2018 growing season. Both indices correlated significantly and strongly with NE and TGW. At the same time, a negative correlation with GE was noted, and it was significant for PhNE-GN (Table A3). The obtained relationships with GY are presented in the following set of equations:
(1)
Grain nitrogen, GN:
G Y = 0.005 P h P N 2 + 0.45 P h P N 3.02   f o r   n = 18 ,   R 2 = 0.77 ,   p 0.01
(2)
Total nitrogen, TN:
G Y = 0.008 N P h P N 2 + 0.58 P h P N 2.15   f o r   n = 18 ,   R 2 = 0.79 ,   p 0.01
The cardinal values of the obtained equations were 7.80 t ha−1 and 48 kg grain kg−1 accumulated N in grain and 7.88 t ha−1 and 34.8 kg grain kg−1 N in the total biomass of wheat during harvest. The FV that met this condition for GN turned out to be NPK-KK in the first two growing seasons. With respect to TN as the predicator of PhPN, the closest to this condition was also NPK-KK, but only in 2016/2017 growing seasons.

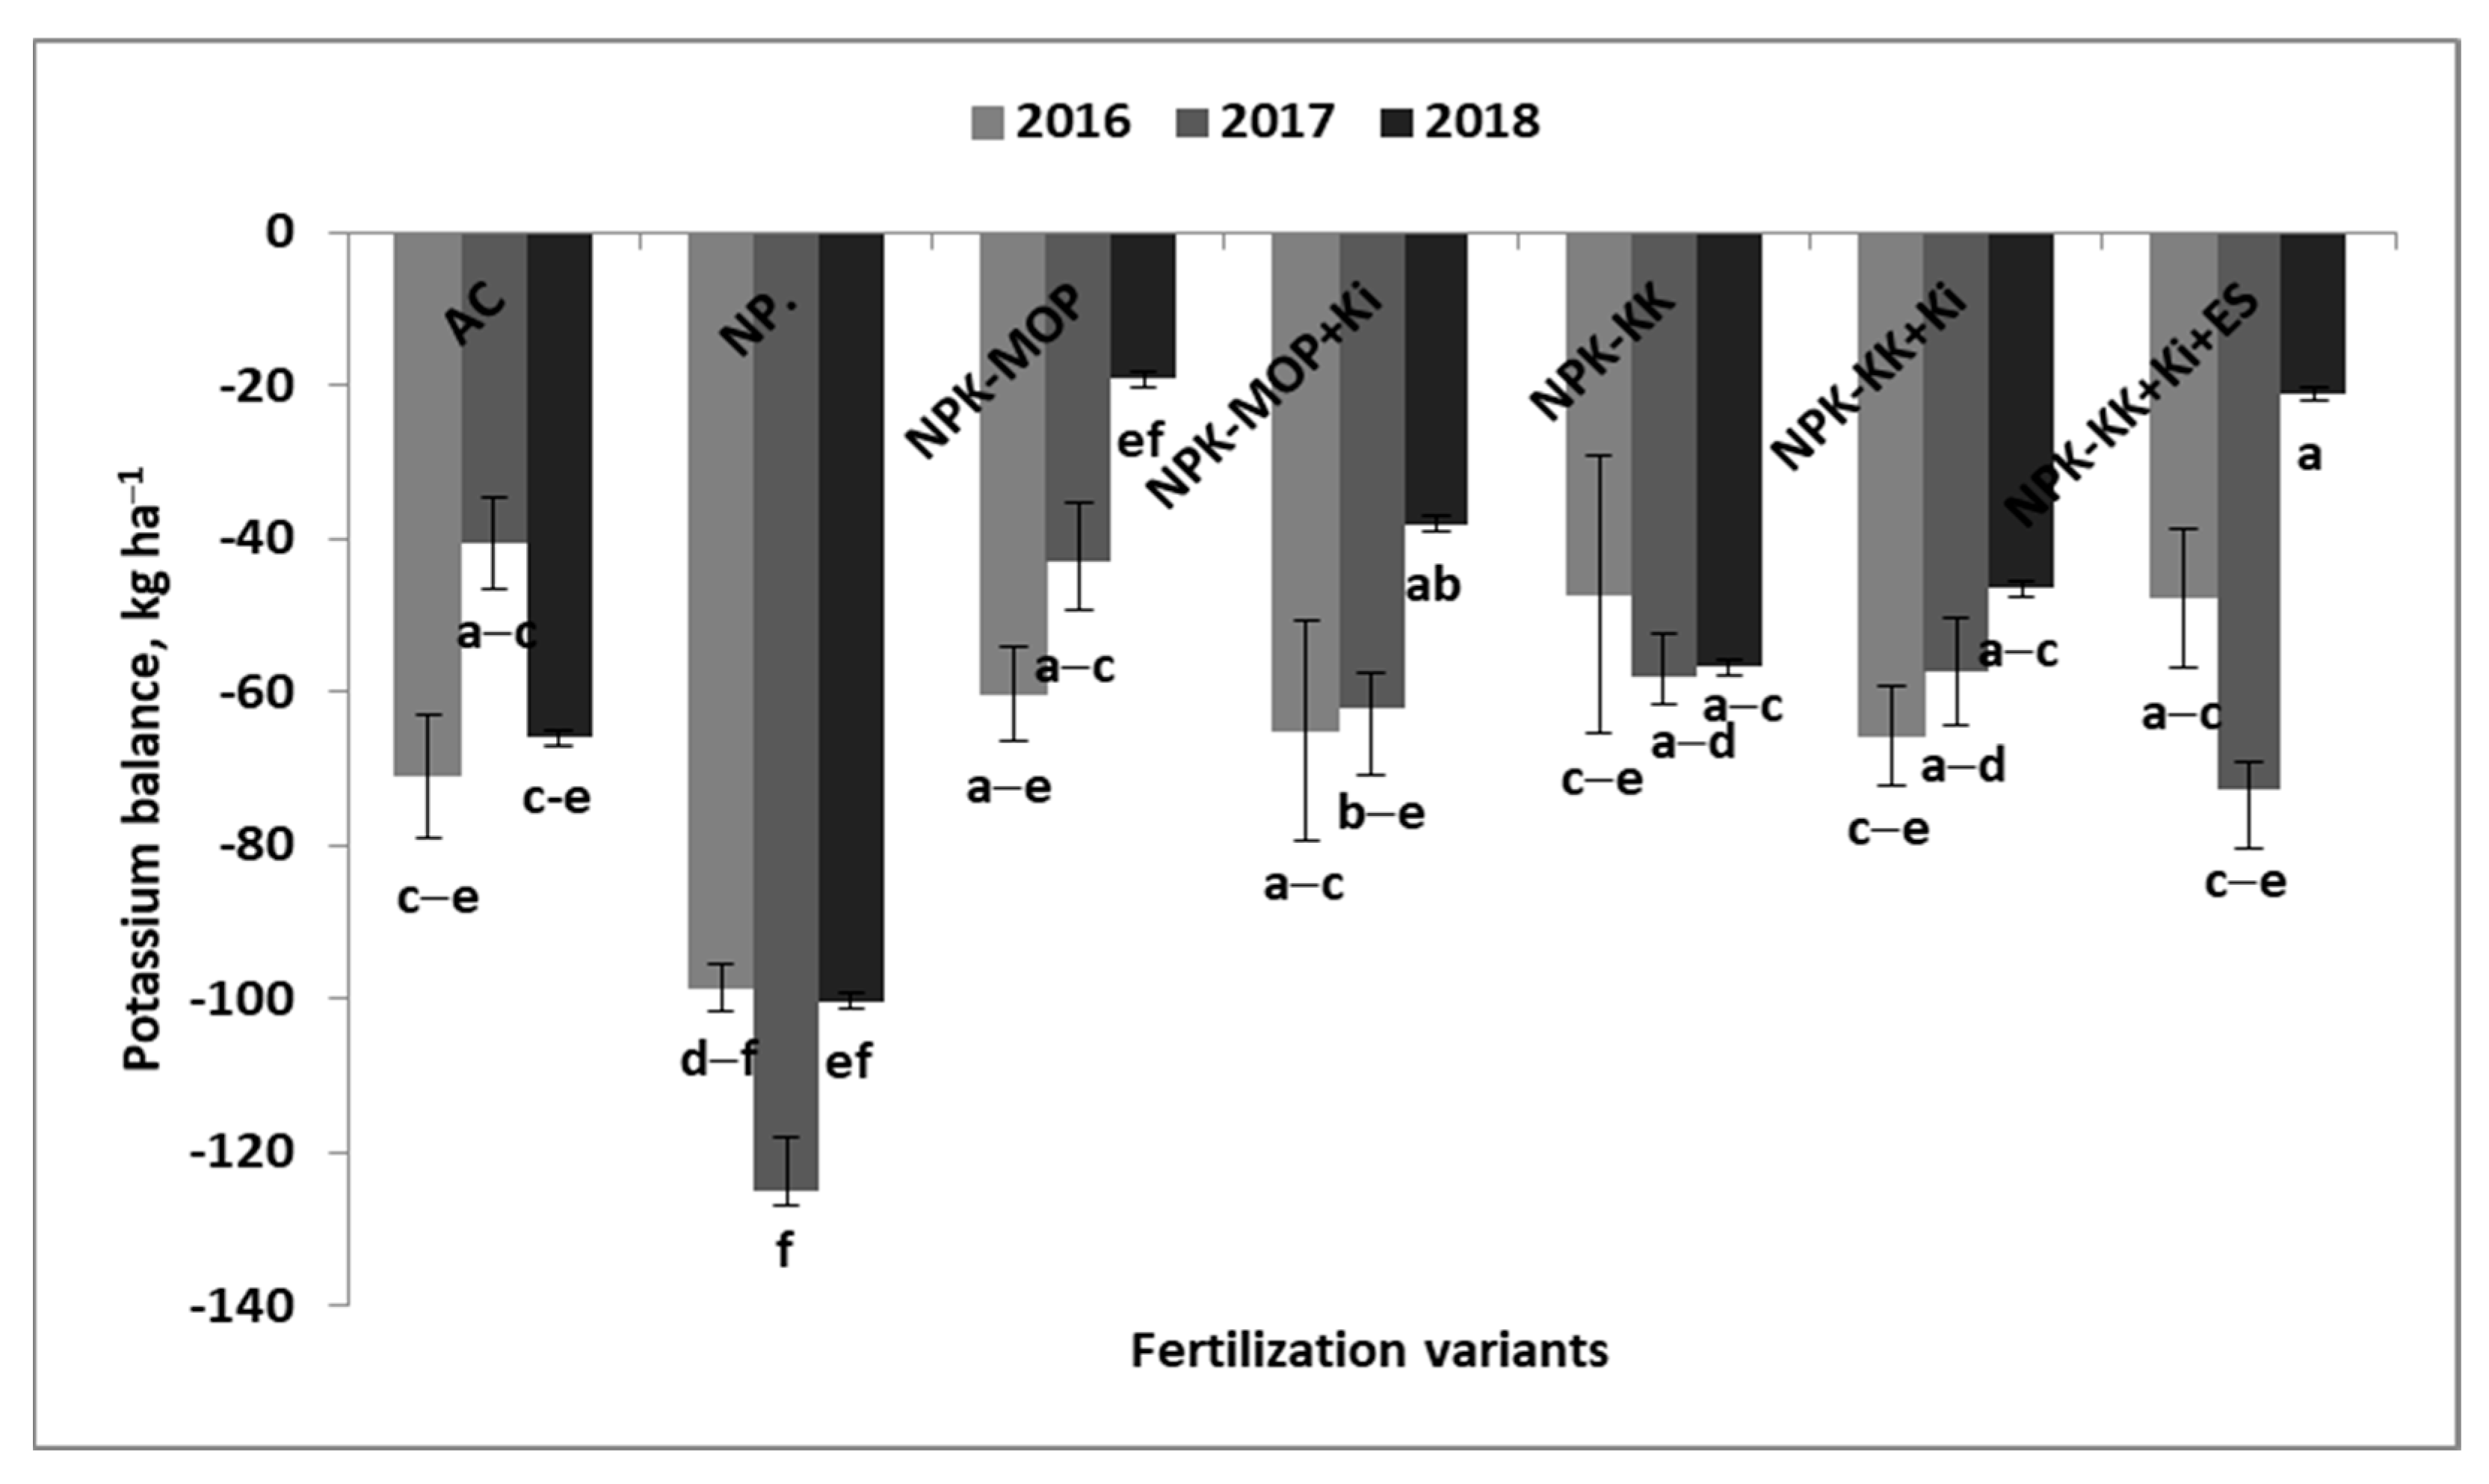
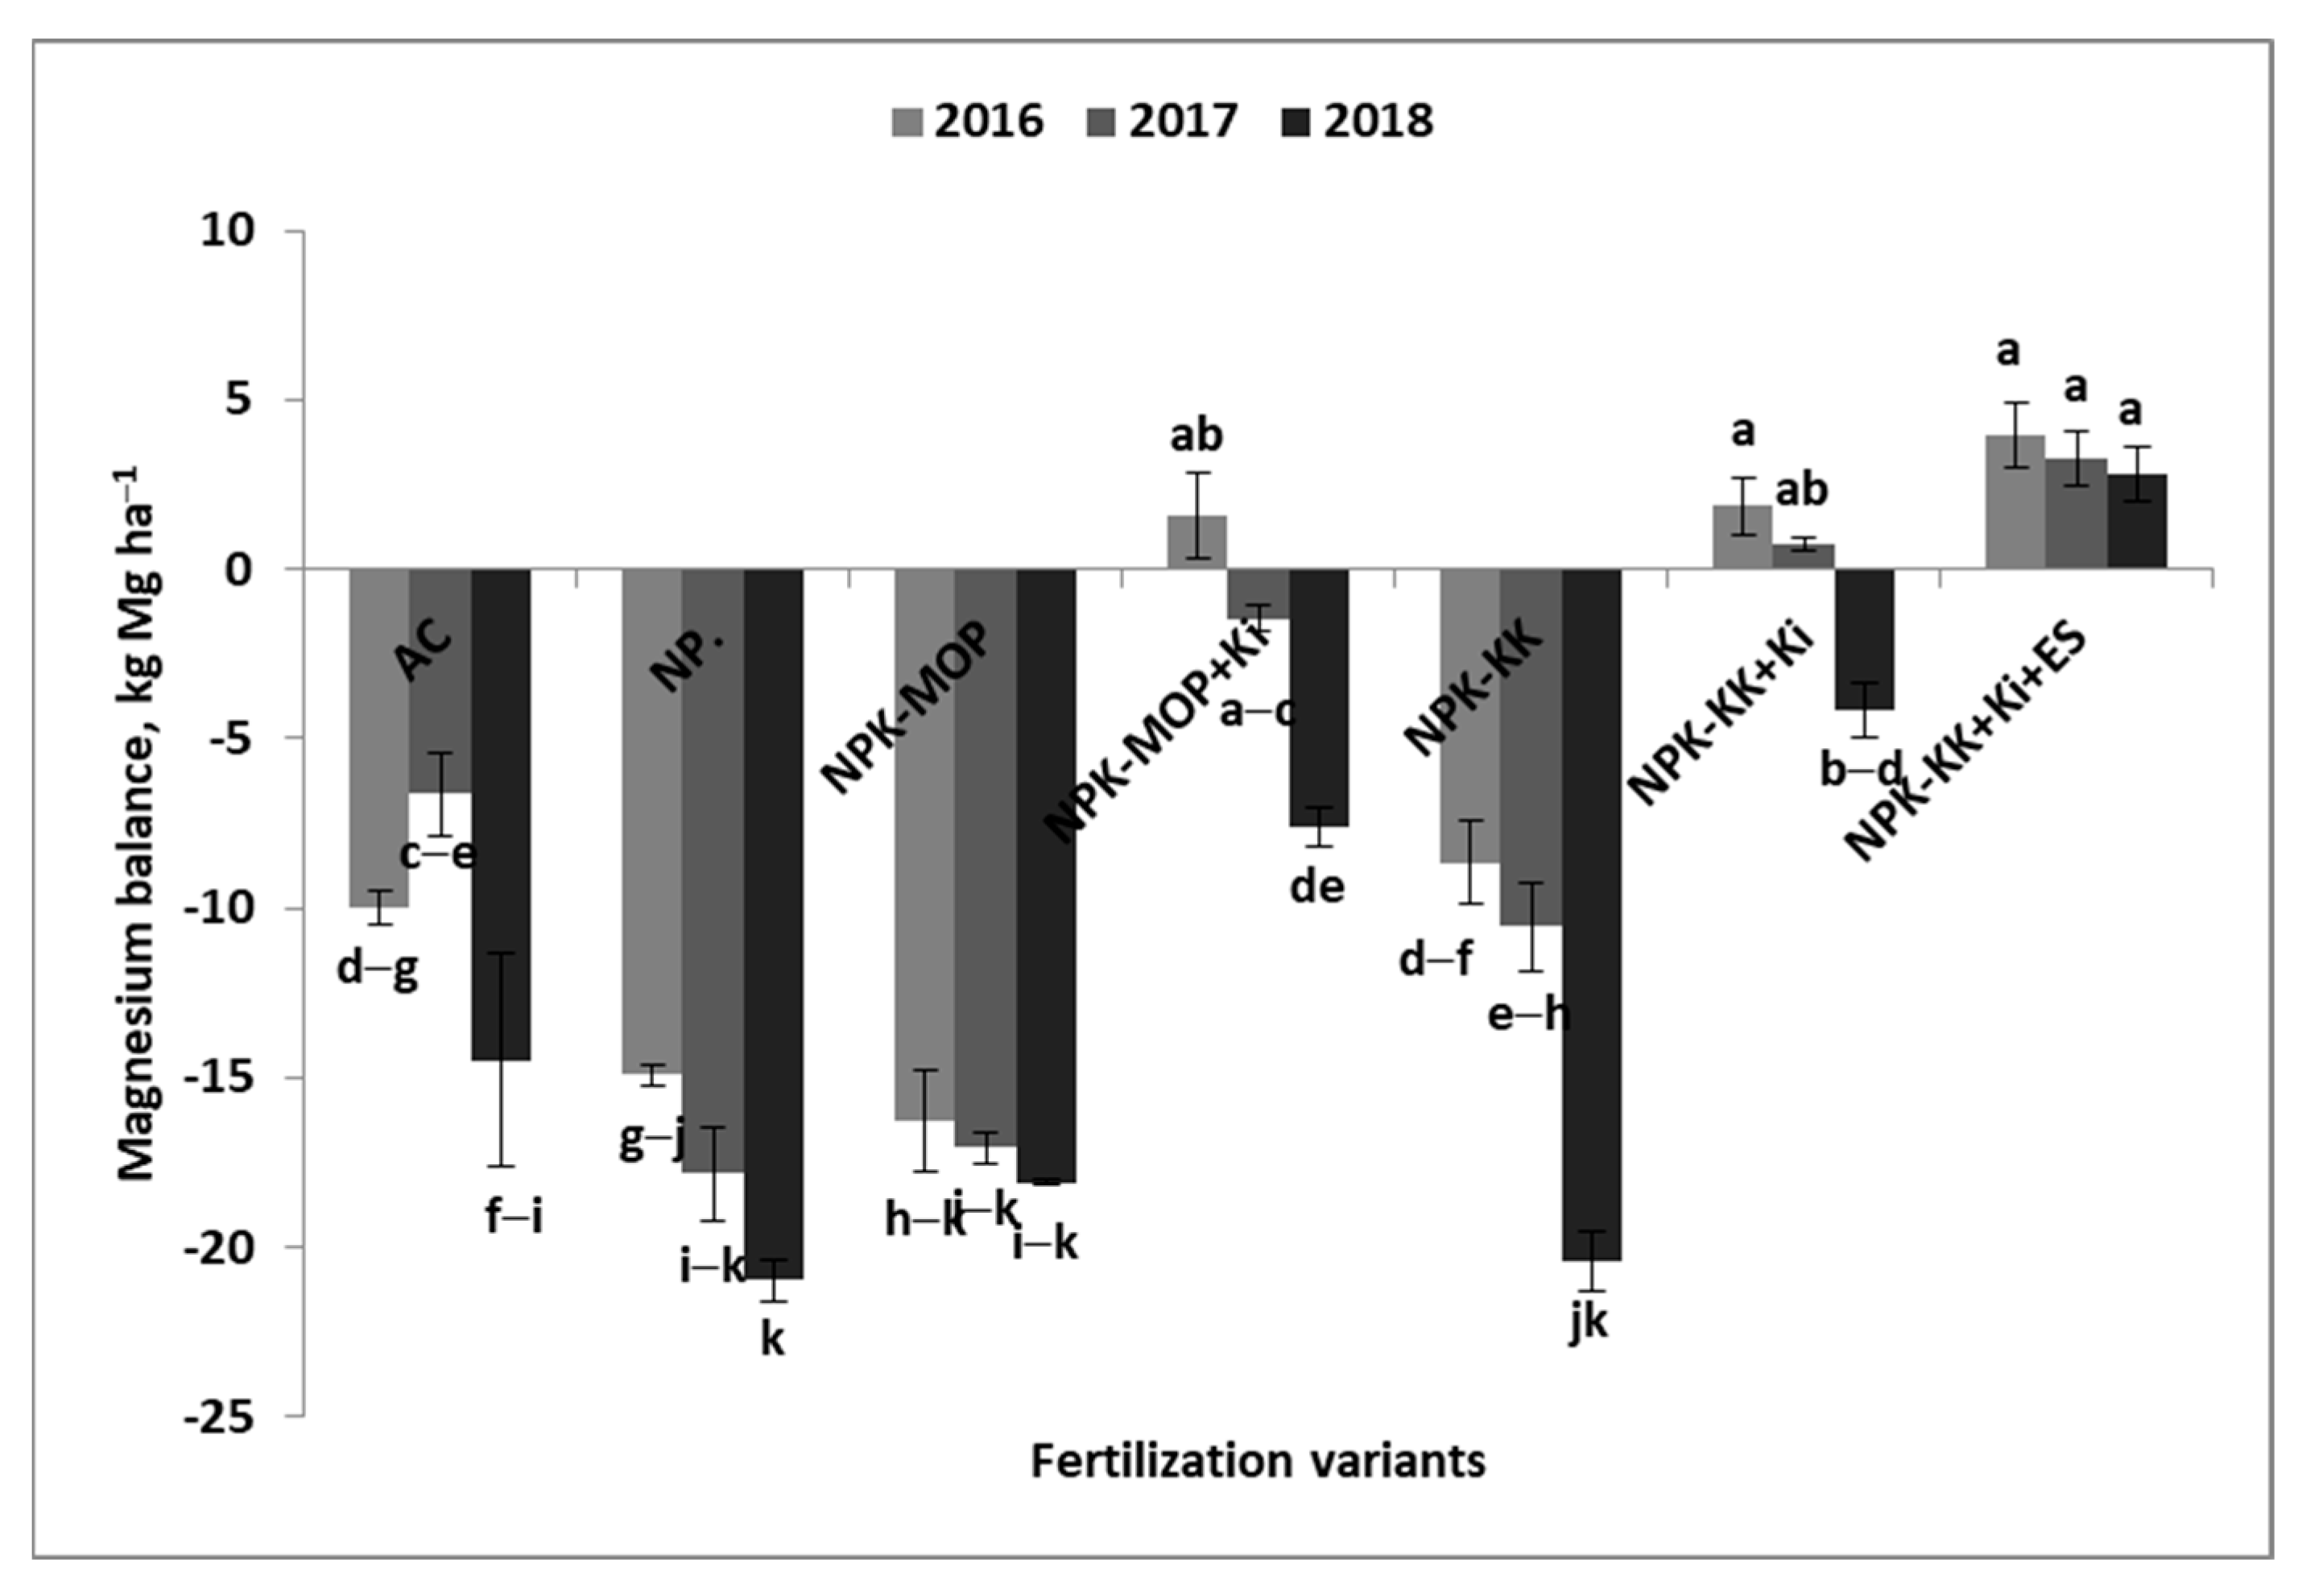
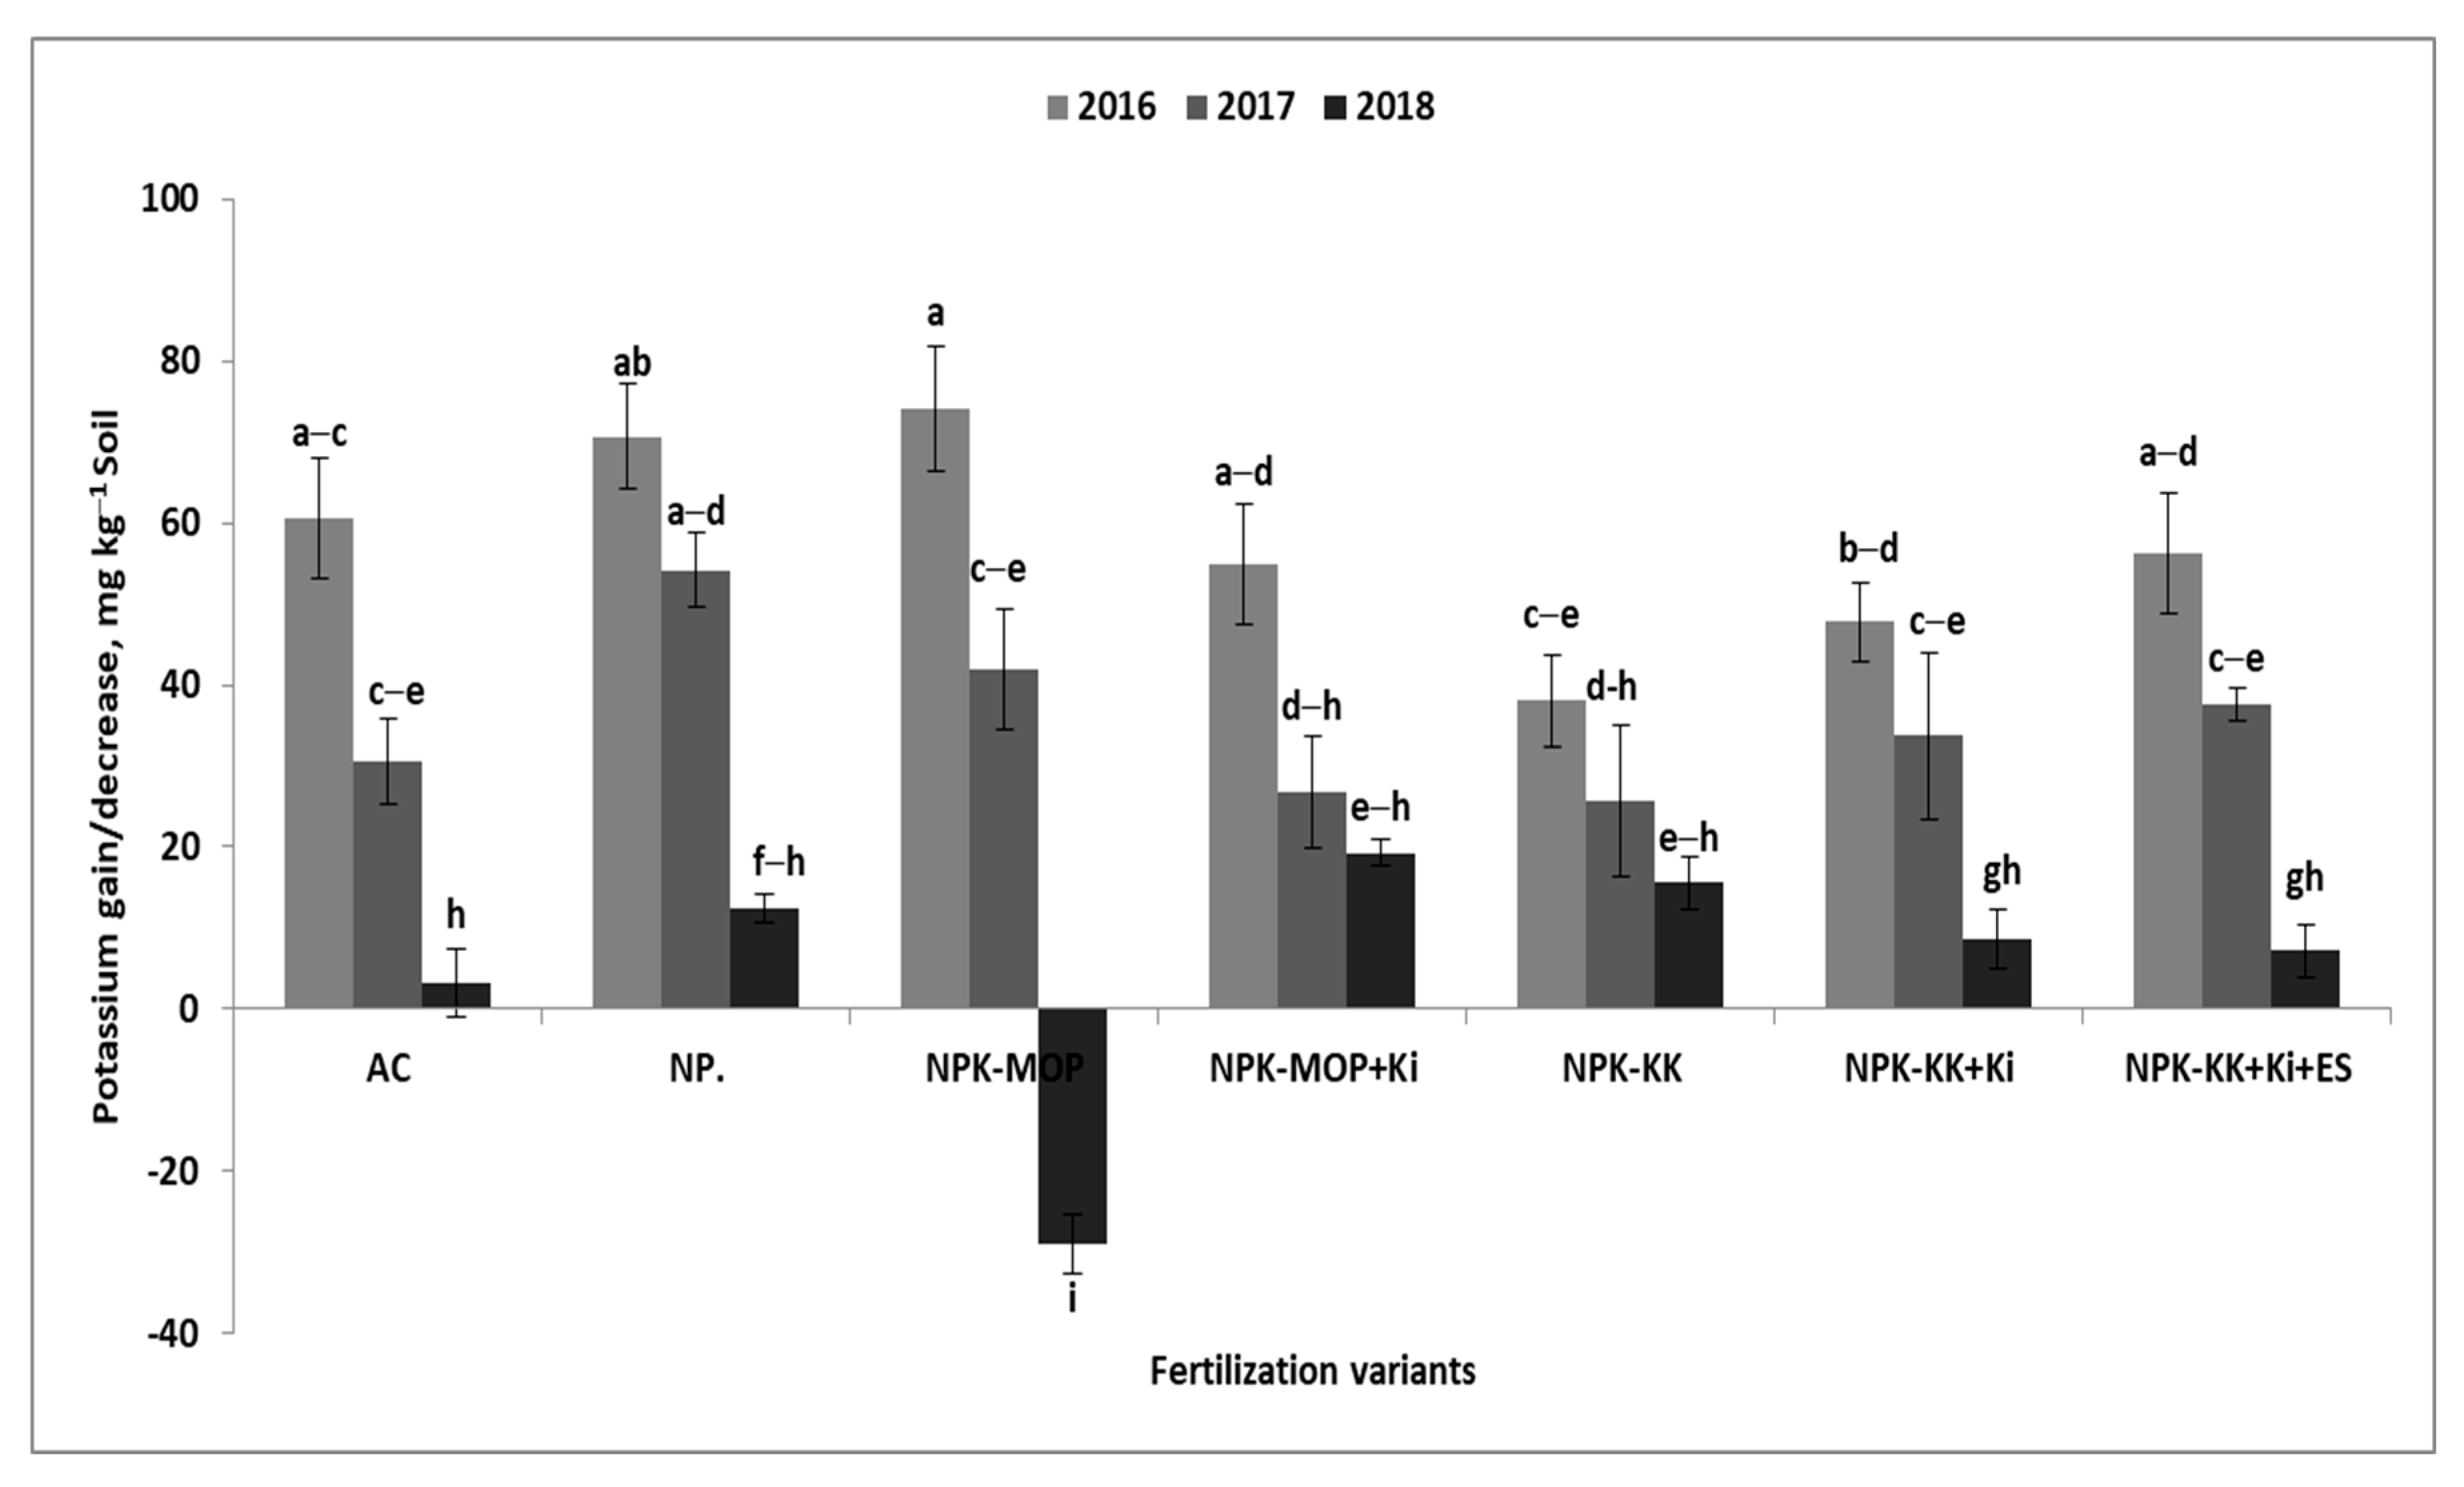
3.4. Crop Nutrient Balance

The nutrient balance in winter wheat clearly showed the dependence of this trait for a given nutrient on the Y × FV interaction (Table 8). Negative balance values indicate an increase in nutrient mass in crop biomass at winter wheat harvest in response to its input, i.e., fertilizer rate. The N balance clearly indicates the dominance of the year factor. The average for 2017 was almost twice as high as those recorded in the other growing seasons. Nevertheless, the FV effect was highly specific (Figure 2). The most negative Ncb values, with little variation between years, were recorded for AC (CV = 8.4%). The lowest value of this trait, also showing the greatest variation between years, was recorded for NP (CV = 232%). Ncb doubled for NPK-MOP compared to NP. The presence of Mg in each FV increased the index value compared to NPK-MOP, which was twice as high for NPK-KK-KI+ES. At the same time, a decrease in the variability of this trait between years was noted (CV: 45% vs. 59%). The most stable Nbc in the growing seasons, but lower by 20 kg N ha−1, was observed for NPK+KK (CV = 21%). The N replacement ratio (Nr) coefficient showed a dominance of the year factor. In the 2017/2018 season, it was twice as high as in 2016/2017 and three times higher than in 2015/2016 (Table 8). The imbalance in Nr was mainly revealed in AC, for which it was only 0.3. This coefficient for the remaining FVs, except for the highly unbalanced NP (CV = 341%), was above 1.0. The most stable FV turned out to be NPK-KK (Figure S2).
Phosphorus balance (Pcb) showed an inverse annual trend compared to Ncb. In the second growing season, it was more than twice as low as in the other years (Table 8). The effect of the year factor on the variability of Pcb (CV) between fertilizers ranged from 31% for NPK-KK to 48% for NPK-MOP (Figure S3). The P replacement ratio (Pr) clearly indicated that only in the second growing season, excluding AC, were winter wheat crop residues able to cover the Pcb (Figure S4).
Potassium balance (Kcb) was at the same level in the first two growing seasons, but significantly lower in the 2017/2018 (Table 8). The impact of FVs was variable in subsequent growing seasons (Figure A3). The largest, negative balance, exceeding 100 kg K ha−1, was observed for NP, which also showed the greatest variability between growing seasons (CV = 51%). The impact of the remaining FVs was almost twice lower, ranging from −41 to −57 kg K ha−1 for NPK-MOP and NPK-KK+Ki, respectively. Again, NPK-KK proved to be the most stable FV (CV = 11%). The K replacement ratio (Kr), despite variability in subsequent growing seasons, was lower than 1.0 only for AC and NP. For the remaining FVs, its value significantly exceeded the threshold, showing the lowest variability for NPK-KK (CV = 7%) (Figure A4).
Magnesium balance (Mgcb) showed an inverse trend compared to Kcb. In the 2017/2018 growing season, it was significantly higher compared to the first growing seasons (Table 8). The effect of FVs was variable in subsequent growing seasons (Figure 3). The deepest negative balance was recorded for NP and NPK-MOP, amounting to −17.5 kg M ha−1. At the same time, it was very stable for these two FVs (CV, 16.9% and 6.2%, respectively). Negative Mgcb values were also recorded for NPK-KK in all three seasons. In the 2017/2018 growing season, Mcb was at the same level as recorded for non-magnesium FVs. A completely opposite situation was observed for NPK-KK+Ki+ES, where net positive Mgcb was detected. MOP and KK variants with Kieserite were characterized by low Mgcb values, but at the same time, showed a high year-to-year variability (CV). The values of the Mg replacement ratio (Mgr) were strongly dependent on a given FV (Figure S5). For magnesium-free FVs, it was at the level of 0.6. For NPK-KK, it increased to 0.8. However, for the magnesium-FVs, it was positive, i.e., the applied Mg was not fully utilized by winter wheat.

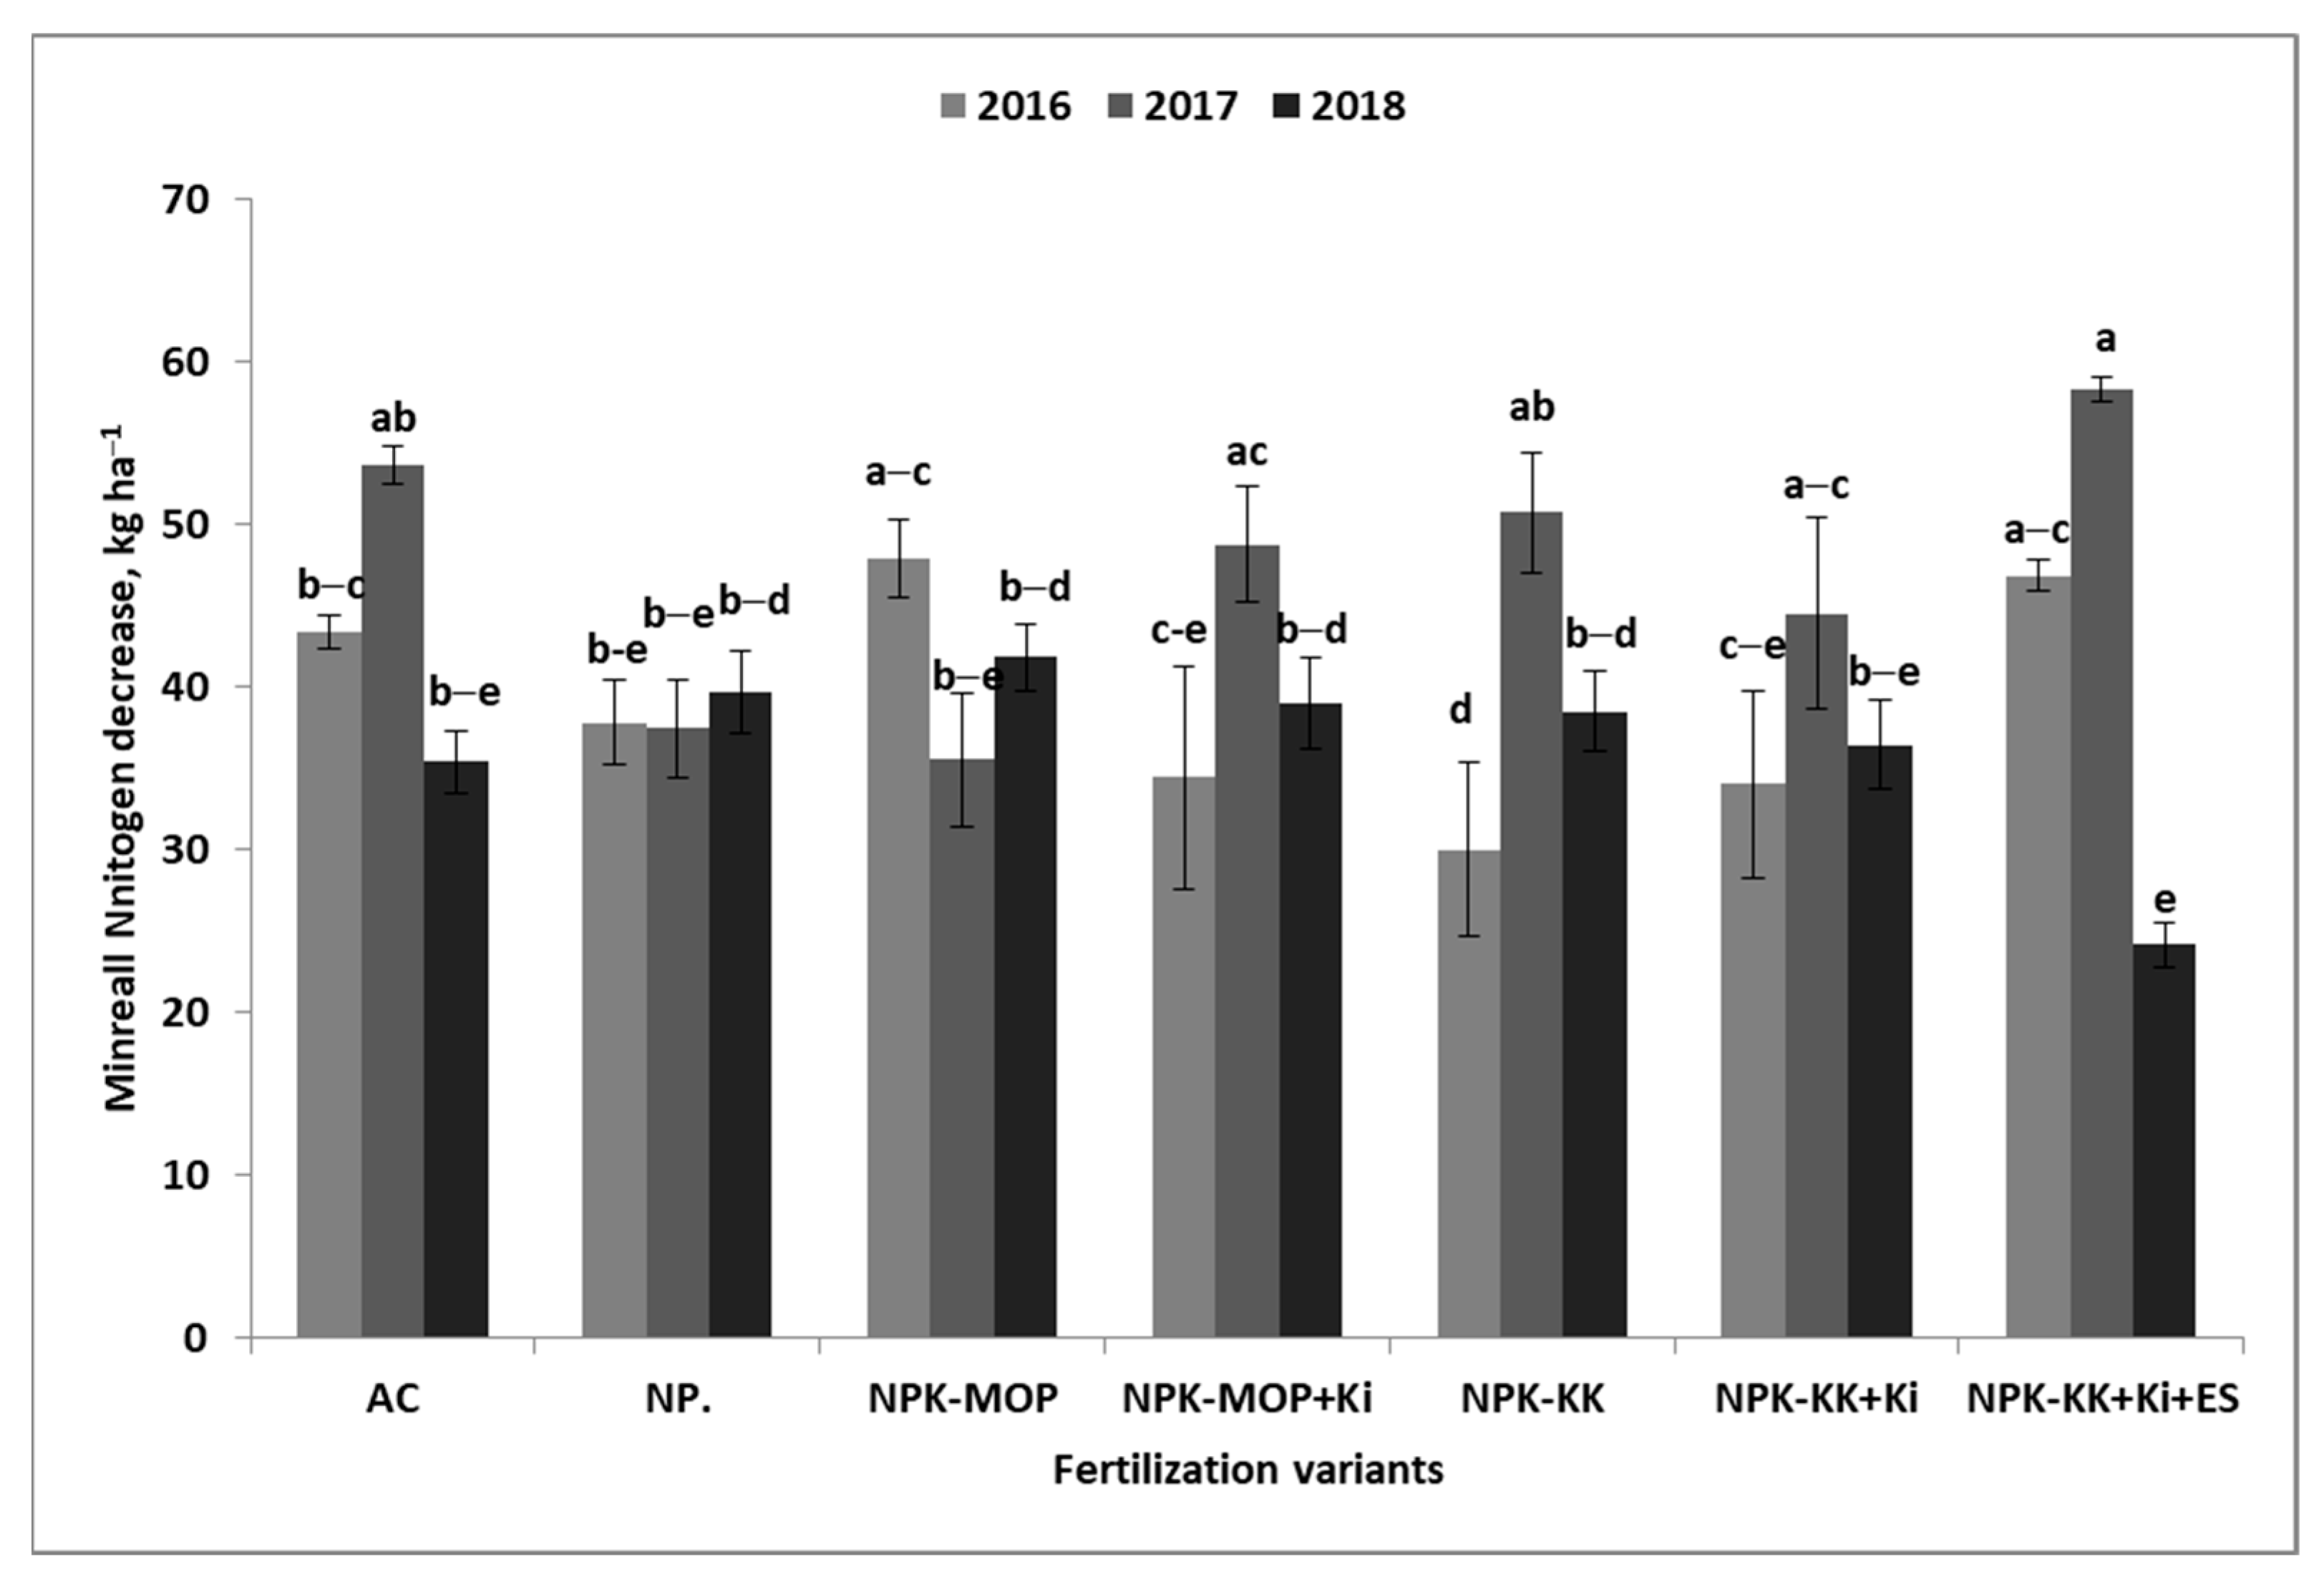
3.5. Soil Nutrient Balance

The analysis of soil nutrient content, carried out at the harvest of winter wheat, included both the Nmin mass and the content of available P, K, and M and their balance during the growing season. The key factor influencing the studied soil properties was the weather in the subsequent growing seasons (Table 9). The only exception was Mg balance (Mgb). Among the studied nutrients, only for P indices was no response to FVs and to the interaction of Y x FV found. The most important factor was the growing season. In the first two consecutive years, the P content was in the high class, and in the third year, it was in the very high class. The P balance (Pb) was at the same level in the first and third years, and more than twice lower in the second year.
The amount of Nmin at harvest depended on the Y × FV interaction. However, the dominant factor was weather in subsequent growing seasons (Table 9). The amount of Nmin mass at harvest decreased in subsequent years of the study. In 2018, it was 2.5 times lower than in 2016. The average Nmin balance—in fact, its decrease compared to the beginning of the spring vegetation of winter wheat—averaged for the experimental factors was approximately 41 kg N ha−1 and showed very low variation (CV < 10%) (Figure 4). Among the FVs studied, the most stable Nmin balance was the attribute of the NP plot (<4%). Compared to NP, CV increased more than 4-fold on NPK-MOP and 10-fold on NPK-KK+Ki+ES (Table S1).
Net nitrogen balance (NNb) showed significant variability between years and in response to the experimental factor, but not to the interaction between both factors (Table 9). The values of the studied indicator were negative only in the second growing season. In the first one, they were positive and in the third, they approached zero. Fertilization treatments revealed the presence of four FVs groups, consisting of the following:
  • AC; NNb was negative, meaning that the relative N increase was 50%.
  • NPK-KK+Ki and NPK-KK+Ki+ES; NNb was negative, and the N increase was at least twice as low as AC.
  • NPK-MOP+Ki and NPK-KK; NNb fluctuated around zero.
  • NP+NPK-MOP; NNb was positive, which means that inorganic resources were not fully utilized by wheat.
The relationship between Nout and NNb was negative, as shown by the following equation:
N N b =   0.83 N o u t + 173.5   f o r   n = 21 ,   R 2 = 0.87 ,   p   0.001
This means that an increase in Nout resulted in a linear decrease in NNb. The equilibrium value between the two traits was reached for Nout, which was 209.8 kg Nout ha−1. Only above this critical value did NNb become negative. Among the N characteristics and indices of winter wheat, the strongest correlation with NNb was observed for GN and TN, as well as for R-GN and R-TN. The following set of equations is presented for GN and RGN:
  • GN:
G N = 0.84 N N b + 138.9 ,   f o r   n = 18 ,   R 2 = 0.88 ,   p 0.001
2.
R-GN:
R - G N = 0.57 N N b + 56.8   f o r   n = 18 ,   R 2 = 0.83 ,   p 0.001
According to the obtained equations, the values of both wheat traits increased with decreasing NNb values.
The content of available K, unlike N and P, showed significant variability in response to FVs (Table 9). Despite the dominance of the year factor, confirmed by the variability of K availability classes, the effect of FVs was noticeable (Figure S6). The content of K in the NP plot, in each growing season, especially in the second and third, showed a clear decrease in relation to AC. The largest K gap was noted in 2017 (−20%) and the gap was much lower in the remaining two seasons. The most important characteristic obtained was the stable content of K in FV NPK+KK (CV = 13.1%). Firstly, in each season, it was in the medium content availability class. Secondly, in this FV, the CV value was in the low class. The greatest variability of K content was noted for FV NPK+KK (47%). The soil K balance (Kb) during the growing season showed a completely opposite trend to the K content at harvest (Table 9). Its greatest balance was recorded in the first season, on average, amounting to almost 58 mg kg−1 soil. In the third season, it was more than 10 times smaller (Figure 5). The highest inter-seasonal variability of the K balance K was noted for NPK+MPK (CV = 182%, Table S1). This resulted from the fact that only for this FV was a positive balance K noted (+29 mg kg−1 soil). On the other hand, the most stable was NPK-KK (CV = 43%) (Table S1).
The content of available Mg was in the high class and did not show any significant response to the year factor and FVs. The variability in response to the Y × FV interaction was dominated by the year factor. The average value of CV was extremely low (<2%), being two times higher in two FVs, i.e., NPK-KK and NPK-KK+Ki+ES (5%; Table 9). The Mg (Mgb) balance showed a completely different trend. The Mgb in 2016 was more than four times and 90 times higher than that recorded in 2017 and 2018, respectively. The CV, averaged over FVs, was 60%, ranging from 90% for AC to 159% for NPK+KK (Table S1). The net increase in the available Mg content was noted for three FVs, including AC, NP, and NPK+KK.
The content of N and K at harvest was negatively associated with its balance. The strongest correlation was found for K (r = −0.99 ***) and a slightly weaker one for N (r = −0.56 **) (Table A4). However, for P and Mg, these relationships were nonsignificant. The amount of residual N at harvest was negatively correlated with the content of available P and K, but not with Mg. The content of P was positively correlated with the content of K, but not with Mg. At the same time, it was negatively correlated with Kb and Mgb. The most important are, however, the relationship between K soil characteristics and Mgb balance, as shown below:
K content:
M g b = 0.34 K + 51.7   f o r   n = 21 ,   R 2 = 0.66 ,   p 0.001
K balance:
M g b = 0.38 K b 1.45   f o r   n = 21 ,   R 2 = 0.63 ,   p 0.001
The first equation clearly shows that the higher the content of available K in the soil at harvest, the lower the value of the Mg balance. The second equation clearly indicates the synergy in the decrease in the content of both nutrients in the soil during the winter wheat vegetation period.
Among the soil nutrient characteristics, the greatest influence on the basic characteristics of winter wheat was exerted by the content and balance of K (Table A5). The latter trait, although in opposite ways, affected GY, TGW, and SY. P content showed a negative effect on NE, TGW, and SY and P balance on HI. Mg balance had a positive effect on NE and TGW. N management indices showed a variable response to both the soil nutrient content at harvest and to their balance during the growing season (Table A5). The highest sensitivity was shown for both NUP indices (five characteristics). They were positively correlated with N mass at harvest and Kb and Mgb and, at the same time, were negatively correlated with P and K content. The same set of soil characteristics was noted for NUA-TN, but the correlation was reversed. PFP-Nf showed only a relationship with Nb (positive). However, for NHI, no significant relationship with the studied soil characteristics was noted. Nitrogen efficiency indices showed the greatest and a generally negative response to both P content and its balance (Table A6). The strongest relationship with soil properties was shown by both PhNE indices. Positive correlations occurred for the residual N mass and were especially strong for K and Mg balance. Negative correlations were found for the content of both of these nutrients in the soil.

4. Discussion

A sustainable crop production system is based on several pillars, assuming efficient use of production inputs [2,41]. This basic goal is achieved but only provided that first, Nf and secondly, inorganic N present in the soil or released from soil resources during the growing season are effectively used by the currently grown crop. Achieving these two main goals is only possible if Nf is used efficiently and its utilization rate does not lead to yield reduction [9]. The assumption of effective N management cannot ignore the sustainability of soil fertility [13,53].

4.1. Balanced Fertilization−Grain Yield–Yield Components−Stability

In food production systems, the most important indicator is the stability of staple crop production, which is decisive for the continuous global food supply [54]. The grain yield of winter wheat harvested in the NPK-KK variant was the most stable among the examined FVs, reaching, on average, 7.2 t ha−1 (CV = 9.4%). It was 13% (+0.84 t ha−1) higher compared to NP and almost two-fold higher (+95%) compared to AC. Such high stability for all these three FVs, as well as the difference in yield, indicates, first of all, high natural soil fertility and good fore-crop, which was winter oilseed rape [55] From the farmer’s production strategy view, the FV with K applied in the form of Korn–Kali seems to be the most stable production option. The moderate but, at the same, stable yields for NPK-KK were found with the fertilizer formula of Korn–Kali, which contains a certain amount of Mg and S [37]. However, the amount of N in grain was below the threshold value of 21.7 kg N t−1 grain (11.5% protein content) (Table S2). A too-low value of this winter bread wheat trait in this particular FV clearly indicates Nf as a critical factor in bread wheat production [56]. The response of winter wheat to fresh K clearly indicates that the soil K content at the border between the low and medium availability class for soil developed from sandy loam is high enough for this crop [57]. Moreover, the obtained relationships are consistent with observations made in other geographical areas [58,59].
A much higher yield increase was obtained in FVs with Kieserite, containing Mg and S, applied together with K. However, these FVs were moderately instable for GY. The effect of Kieserite was revealed only in years with favorable weather in the spring part of the winter wheat growing season. In these years (2016 and 2017), soil with Kieserite applied resulted in a GY (on average) of 0.72 t ha−1 (10%) and, supported by foliar spray with Epsom salt, of 1.11 t ha−1 (15%). The increase in GY did not limit nitrogen accumulation under optimal weather conditions, which, in the NPK-KK variants with Kiserit, exceeded the threshold value of 11.5%. However, in the dry year 2018, no increase in GY or in protein content in these FVs was observed. The obtained results confirm the complex response of winter wheat to the use of fertilizers containing Mg and S [37,60]. In regions where winter wheat is grown, with variable weather conditions, it is rational to use these nutrients together with K during the growing season, an example of which is Korn–Kali. Additional application of these nutrients, soil-applied (Kieserite) or foliar-applied (Epsom salt), is justified only in optimal weather conditions during the spring growing season of winter wheat [61,62,63].
Among the main yield components, the strongest impact on GY was found for the number of grains per ear (GE). This wheat trait is formed in the period extending from the booting phase to the watery stage of the grain growth [6,28]. The GE value emphasizes the key role of N in forming grain yield: first, because N supply defines the size of GE [64]; and secondly, GE feedback generates the sink for both the grain mass and simultaneously for the N mass [65]. In the studied case, the N use resulted in GE increase by 73% compared to the absolute control (19 vs. 33 grains per ear). The relationship between both traits was not linear but curvilinear and was best described by a quadratic regression model (Figure S1). The effect of applied K and Mg fertilizers on GE cannot be explained without taking into account the compensation mechanism between the number of ears per m2 (NE) and GE. This is the yield component that mainly determines wheat grain yield is NE [6,28]. It was observed that an increase in NE in the N fertilized plots resulted in a decrease in GE (Figure S7).
The in-season interaction of these two yield components (NE and GE) is responsible for the number of grains per m2 (grain density, GD). This yield component is considered as the crucial GY predicator, which was fully proved in the conducted study [66,67]. The significant increase of GD compared to NP, and even more to NPK-MOP, was recorded in treatments with Kieserite (NPK-MOP+Ki and NPK-KK+Ki+ES). The discussion cannot ignore the role of nutrients in the formation of TGW [6]. The size of this yield reflects the conditions of the kernel growth after flowering [63]. These conditions were the best and, therefore, the most stable, on NPK-KK+Ki, which is emphasized by the extremely low CV value (0.9%). The obtained effect of Kieserite application to winter wheat fully corroborates the conclusions by Potarzycki et al. [68]. These authors clearly stated that Kieserite application within the main period of yield formation extended from the beginning of shooting to the beginning of flowering results in GD increase, regardless of the status of primary yield components.

4.2. Balanced Fertilization−Control of Soil Fertility Sustainability

The second goal of sustainable N management in crop production is the efficient use of available N resources in the soil. Furthermore, the Nmin content after harvest of the currently cultivated crop should be at a level that does not pose a threat to the environment [2,8,12]. The content of residual Nmin in the soil at wheat harvest was significantly lower than the initial period (before the application of fertilizer) in spring. The efficiency of Nf in relation to N accumulation in grain was 83.4%, and it was 114.6% for the total N mass in wheat biomass. This difference indirectly indicates the significant contribution of inorganic soil N to wheat biomass and grain.
The first operational goal of sustainable N management is to increase the productivity of the applied Nf, which was achieved. It was even met applying N together with P fertilizer (114%). The further GY increase was due to the action of K and Mg fertilizers. The application of K in the form of MOP increased N utilization by winter wheat by 30 kg ha−1, which doubled when Korn–Kali was applied together with Kieserite and supported with Epsom Salt. The obtained N use efficiency clearly indicates the important role of inorganic nitrogen (Nmin) present in the soil at the beginning of the spring vegetation of winter wheat. The amount of Nin released from soil resources during the growing season of winter wheat cannot be ignored [44]. The Nmin efficiency in the soil/wheat system, averaged over FVs, was 101%. This system was most effective in the AC plot, but yields were low. Based on the net nitrogen balance, the tested FVs can be divided into two main groups. The first, the low-effect group, included two FVs, i.e., NP and NPK-MOP. In these two variants, wheat used the available N resources in 91%. In the second, the high-effect system, Nmin use efficiency reached 106%. This group included KK variants with Kieserite. The NPK-KK variant, despite its high stability for GY, showed only a moderate Nmin utilization, which was 98%.
The amount of depleted Nmin during the winter wheat growing season was significantly associated with the amounts of depleted K and Mg, but not with P. This relationship clearly indicates that the uptake of N by plants was conditioned by the available resources of K and Mg. This is consistent with the general mechanism of the uptake of nitrate N from the soil by plants [69,70]. Therefore, low values of residual Nmin at harvest indicate an optimal state and availability of K and Mg for its utilization by winter wheat. It is worth emphasizing one highly important fact, namely, that the uptake of both of these nutrients from the soil showed mutual synergism. Therefore, it can stated that both of these soil nutrients met the assumptions of sustainable N management in winter wheat, and the conditioning factor was the weather.
The role of K and Mg was evident in each growing season. In the wet season (2016/2017), plants absorbed almost twice as much N from the soil as in the dry season (2017/2018). The main reason for the increase in GY in response to K was the conditions of its uptake from soil resources. The highest K depletion was obtained in 2016 under optimal weather conditions, despite the lowest content of available K in the soil. The lowest K depletion was revealed in the dry 2018, despite the optimal content of K in the soil. K ions are taken up in significant amounts by plant roots from the soil solution by diffusion, the efficiency of which depends on soil moisture [71]. Hence, in drought conditions, this process was significantly inhibited, as shown by the obtained results. Despite strong K depletion, the K balance was not potentially disturbed. Wheat crop residues left in the field would have fully compensated for the negative its balance in the soil. The average value of K replacement ratio was 1.37, exceeding the threshold value of 1.0 in each growing season.
The GY increase compared to the NPK-MOP variant was significantly greater in the KK variants with Kieserite. The stimulating effect of Mg fertilizer was revealed regardless of the level of available Mg, but only under optimal weather conditions. Therefore, the key to effective N management, even in conditions of high soil Mg content, turned out to be Mg management. The significant factor determining N uptake in this particular season was not its soil resources, but the uptake conditions. Under water stress conditions, a series of processes occur that limit the efficient uptake of Mg ions from the soil solution. The first is a decrease in both transpiration and the soil diffusion coefficient. The second is a decrease in the rate of Mg ion uptake by roots from the soil, caused by the high water requirements of these ions and competition with Ca ions [14,37,72]. As a result, Mg uptake from soil was significantly inhibited in the dry 2017/2018 season. This is confirmed not only by the low balance of available Mg in the soil but also by the net increase in this nutrient in the variants with intensive Mg fertilizer application. In the non-Mg variants, maintaining a balanced level of soil fertility may be disturbed because crop residues are too poor a source of this nutrient.
The yield-forming effect of nutrients in the tested FVs results from their influence on the processes responsible for yield components formation [63]. The critical period for the formation of this wheat trait extends from the beginning of stem elongation to full heading [28]. The nutritional determinant of ear and grain formation in the ear is the availability of N, but supported by other nutrients, including in the lines K and Mg [11]. The role of Mg, or more precisely, its balance in the growing season, is presented by the equation
N E = 430 + 3.5 M g b   f o r   n = 21 ,   R 2 = 0.41 ,   p   0.01
This equation clearly shows that the positive Mg balance during the winter wheat growing season was important for the number of formed ears. This process was limited in 2018 due to drought. The discussion cannot ignore the role of nutrients in the formation of TGW [6]. The size of this yield component reflects the conditions of the kernel growth after flowering [63,66]. These conditions were the best, and, therefore, the most stable, on NPK-KK+Ki, which is emphasized by the extremely low CV value (0.9%). The role of nutrients, or more precisely, the balance, is presented by the equation
T G W = 48.6 0.15 P b + 0.21 M g b   f o r   n = 21 ,   R 2 = 0.64 ,   p 0.001
This equation clearly confirms the limiting effect of Mg balance on TGW, which was noticeable in the dry 2018. It is obvious that Mg plays an important role due to its role in the current photosynthesis and in the transport of assimilates to the growing grain [35,60,61].

4.3. Balanced Fertilization−Evaluation of NUE Indicators

The impact of balanced N fertilization on grain yield was assessed based on direct and aggregated N traits in winter wheat, management N indicators, and nitrogen use efficiency (NUE) indicators. Direct traits concern the mass of N in grain and straw. Aggregated traits include the total N amount in the wheat canopy at harvest and its division between grain and straw.
The first two groups of N traits at winter wheat maturity responded significantly to the studied FVs, but they were variable in subsequent growing seasons. However, no interaction between them was found. Th total N amount (TN) was significantly correlated with GN (r = 0.99 ***) and SN (r = 0.95 ***). As a consequence, the obtained value of N redistribution between grain and straw, known as the nitrogen harvest index, was 72.6 ± 3.1%. It is not so high, because in optimal conditions, it can even approach 85%, and it is an important GY predictor [66]. Moreover, the CV was only 4.3%, which means high NHI stability in response to the factors studied. The low variability of both HI and NHI confirms the conservative status of this wheat trait [67].
The most stable GN over years was recorded for AC and NPK-KK (6.2%). The latter FV was, therefore, the most stable FV considered for both, GY and GN, which confirmed the close relationship between both traits of winter wheat. However, the achieved GY stability did not guarantee protein content at the formal level of 11.5% as is required for flour production [73,74]. This condition was met, provided that Kieserite was included in fertilization system for winter bread wheat. On average, for the years studied, it concerned two FVs, namely, NPK-KK+Ki and NPK-KK+Ki+ES. It can be concluded that the N dose of 150 kg ha−1 was too low to obtain high quality grain. Therefore, a higher N dose is required to reach two goals of bread wheat production: yield and protein content [74].
The efficiency of N accumulated in winter wheat during the growing season was evaluated using 10 indicators. Three questions were formulated to assess the practical and methodological usefulness of the studied indicators. The key question is as follows: Does balanced Nf fertilization, supported by the use of K and Mg fertilizers, result in increased N productivity? The second question concerns the sensitivity of the N indicators to the current state and change of the resources of basic soil nutrients. The methodological question is as follows: Which NUE indicator best reflects the effect of both tested nutrients on N productivity?
Based on the strength of associations (R2) between the evaluated N indicators, they were divided into two groups. The first one includes four indicators, basically evaluating productivity of Nf: (i) the partial factor productivity of Nf (PFP-Nf); (ii) the agronomic nitrogen efficiency (ANE), and (iii) the nitrogen recovery (R) for GN and TN. ANE was found to be equivalent to PFP-Nf in assessing the effect of K and Mg on N productivity. These indicators clearly confirmed an increase in Nf productivity in response to the application of K and Mg. A greater increase was recorded for Mg. At the same time, they were positively and strongly correlated with GN and SN. For these three indices, the best FV was NPK-KK+Ki+ES.
The second group of N indicators characterizes the utilization efficiency of N accumulated in the plant during the growing season [44]. It comprises three double indices, calculated based on GN or TN. They were (i) the unit N productivity (NUP), (ii) the unit nitrogen accumulation (NUA), and (iii) the physiological N efficiency (PhNE). All discussed indices were strongly correlated each other (Table S4). The relationships between the obtained indexes and GY were, in fact, not linear, but best fitted a quadratic regression model (Figures S8 and S9). These relationships clearly indicate the sensitivity of these indexes to changes in the directions of physiological processes in wheat. The value of both PhNE indices showed a significant and very strong but negative relationship with the content of available P. The same relationship was obtained for both NUP indices. This trend clearly indicates that the P content at wheat harvest was not a factor limiting the physiological efficiency of N accumulated in the plant. However, the values of NUA increased progressively with the increase in the content of available P in the soil. However, this is only a superficial assessment of the observed phenomenon, which may lead to an erroneous evaluation. The criterion correcting the assessment of the reaction of the indicators turned out to be the soil nutrient balance. The stepwise analysis for PhNE-GN clearly showed that the increase in the P balance (actual loss from the soil during the growing season due plant uptake) led to a decrease in the index value, i.e., the physiological productivity of N accumulated in the grain. On the other hand, the component determining the increase was Mg. The developed dependency is as follows:
P h N E = 46.5   0.42 P b +   0.7 M g b   f o r   n = 18 ,   R 2 =   0.80 ,   p   0.01
Two indices, NUP and NUA, which are mutually mathematically reversible, deserve special attention (Figure S10). Both have practical significance, as they serve basic data to determine the productivity and nutritional N requirement for N of the cultivated plant [2]. The highest NUA increase compared to the NPK-MOP plot was recorded for NPK-KK+Ki, which was 10.2% for NUA-GN and 6.9% for NUA-TN. This difference clearly indicates the yield-forming role of Mg. All three indices showed a significant relationship with both the N mass in the grain and the Mg and K balance, which were strongly correlated with each other. This relationship fully confirms the yield-forming role of Mg during the crop formation period and grain filling [63]. In the assessment of NUP and NUA, it is necessary to indicate their specific feature resulting from the calculation methodology, i.e., reversibility in accordance with the exponential function (Figure S6). The relationship obtained by analyzing the effect of Mg on both indicators can be defined as the scissors effect. The unit productivity of nitrogen accumulated in grain increased linearly, while the value of the unit nitrogen accumulation decreased (Figure 6).

5. Conclusions

A sustainable model of crop production comes down to controlling the efficiency of nitrogen in the soil/plant system, but under the condition of maintaining soil fertility. This general assumption was fully realized for the tested project. The Nf efficiency in relation to N accumulation in grain was 83.4%, and for the total N in wheat biomass, it was 114.6%. This difference indirectly indicates the significant contribution of inorganic N to wheat biomass and grain. Meeting the second condition depends on the farmer’s actions, as there has been expected a decrease in the content of available forms of P, K, and Mg. The mass of nutrients in wheat crop residues is able to replenish K and Mg resources in the soil after winter wheat harvest.
The key nutritional factors for effective nitrogen management in the soil/winter wheat production system were the resources of available K and Mg in the soil. The mobilization of these resources determined the effective management of N, both introduced in the fertilizer and present in the soil during the wheat vegetation period. The grain yield obtained in the NPK variant with Korn–Kali as a K carrier guaranteed the most stable grain yield, regardless of the weather conditions during the growing season. However, this fertilization variant did not provide the required grain quality. The effect of K and Mg generally oriented on GY was less effective in increasing the accumulation of N in grain. Maximizing the amount of nutrients in applied fertilizers to winter wheat, focused on grain yield increase, may have a return effect, resulting in the dilution N effect, which has been termed the scissor effect. The amount of N in the grain, and, therefore, its potential milling value, can be increased, as studies have shown, by using a potash fertilizer manufactured with Mg (Korn–Kali) or by additionally using a Mg fertilizer, for example, Kieserite. The positive effect of K and Mg on grain yield was fully confirmed by all tested nitrogen use efficiency indicators. The conducted studies showed the presence of two groups of indices, which were separated on the basis of a high degree of mutual correlation. All the tested indicators meet the requirements for evaluating the results of field experiments. The nitrogen unit accumulation index has proven its usefulness in science and practice. The analysis of this indicator shows that the mass of N in grain exceeding 22 kg 1 t−1 grain also meets the minimum quality requirement. Two fertilizer variants met this requirement, i.e., NPK-KK+Ki and NPK-KK+Ki+ES. The study clearly showed that three of the six FVs fully met the three basic conditions for sustainable crop production: (i) stabilization and even an increase in grain yield; (ii) a decrease in the mass of inorganic N in the soil at harvest, potentially susceptible to leaching; and (iii) stabilization of soil fertility of P, K, and Mg.

Supplementary Materials

The following supporting information can be downloaded at: https://www.mdpi.com/article/10.3390/su17156705/s1, Table S1. Values of the coefficient of variation for selected characteristics for fertilization variants for the years of the study. Table S2. Descriptive statistics of grain nitrogen, GN, kg N ha−1; Table S3. Descriptive statistics of straw nitrogen, GN, kg N ha−1; Table S4. Correlation matrix for nitrogen indicators, n = 18; Figure S1. Grain yield as a function of the number of grains per ear; Figure S2. The effect of fertilization systems (FVs) on the crop residue nitrogen replacement ratio in subsequent years of the study; Figure S3. The effect of fertilization systems (FVs) on the phosphorus balance in winter wheat in subsequent years of the study; Figure S4. The effect of fertilization systems (FVs) on the crop residue phosphorus replacement ratio in subsequent years of the study; Figure S5. The effect of fertilization systems (FVs) on the crop residue magnesium replacement ratio in subsequent years of the study; Figure S6. The effect of fertilization systems (FVs) on the content of available K at harvest in subsequent years of the study; Figure S7. Compensation phenomenon: the relationship between the number of ears per m2 and the number of grains per ear; Figure S8. Grain yield as function of nitrogen unit productivity based on grain nitrogen (GN); Figure S9. Grain yield as function of nitrogen unit productivity based on total nitrogen (TN); Figure S10. Mathematical relationship between nitrogen unit productivity and nitrogen unit accumulation.

Author Contributions

Conceptualization, A.A. and W.G.; methodology, A.A. and W.G.; software, K.P.-C.; validation, A.A. and K.P.-C.; formal analysis, W.G.; investigation, A.A. and K.P.-C.; resources, K.P.-C.; data curation, A.A.; writing—original draft preparation, A.A.; writing—review and editing, W.G.; visualization, K.P.-C.; supervision, A.A.; project administration, K.P.-C. All authors have read and agreed to the published version of the manuscript.

Funding

The publication was financed by the Polish Minister of Science and Higher Education as part of the Strategy of the Poznan University of Life Sciences for 2024–2026 in the field of improving scientific research and development work in priority research areas.

Institutional Review Board Statement

Not applicable.

Informed Consent Statement

Not applicable.

Data Availability Statement

The original contributions presented in the study are included in the article/Supplementary Materials, and further inquiries can be directed to the corresponding author.

Conflicts of Interest

The authors declare no conflicts of interest.

Abbreviations

The following abbreviations are used in this manuscript:
AcronymsFull name
ANEAgronomic nitrogen efficiency
CRRRCrop residue replacement ratio
CNBCrop nutrient balance
GDGrain density, number of grains per m2
GENumber of grains per ear
GYGrain yield
GNGrain nitrogen, nitrogen accumulated in grain
HIHarvest index
KKKorn–Kali
MOPMuriate of potash
NENumber of ears per m2
NUA-GNNitrogen unit accumulation in grain
NUA-TNNitrogen unit accumulation in total wheat biomass
PFP-NfPartial factor productivity of fertilizer nitrogen
PhNE-GNPhysiological nitrogen efficiency of N in grain
PhNE-TNPhysiological nitrogen efficiency of N in winter wheat biomass
NNbNet nitrogen balance
NUP-GNNitrogen unit productivity in grain nitrogen
NUP-TNNitrogen unit productivity in total winter wheat biomass
NHINitrogen harvest index
R-GNNitrogen recovery in grain nitrogen
R-TNNitrogen recovery in total N in winter wheat biomass
SNStraw nitrogen—nitrogen accumulated in straw
SYStraw yield
TNTotal N mass in winter wheat at harvest

Appendix A

Table A1. Correlation matrix for the grain yield and yield components, n = 21.
TraitsNEGEGDTGWSYTBHI
GY0.47 *0.64 **0.96 ***0.150.84 ***0.96 ***0.44 *
NE1.000.300.360.410.74 ***0.63 **−0.32
GE 1.000.77 ***−0.46 *0.320.49 *0.62 **
GD 1.00−0.130.78 ***0.90 ***0.47 *
TGW 1.000.250.21−0.16
SY 1.000.96 ***−0.11
TB 1.000.17
***, **, * indicate significant differences between yield traits at p < 0.001, p < 0.01, and p < 0.05, respectively. Legend: GY—grain yield; NE—number of ears per m2; GE—number of grains per ear; GD—grain density, number of grains per m2;.TGW—thousand grain weight; SY—straw yield; TB—total biomass of winter wheat at harvest; HI—harvest index.
Table A2. Correlation matrix of the nitrogen indicators with grain yield and yield components, n = 21.
TraitsSNTNNHIPFP-NfNUP-GNNUP-TNNUA-GNNUA-TNGYNEGETGWSYHI
GN0.91 ***0.99 ***0.220.93 ***−0.73 ***−0.70 ***0.71 ***0.64 **0.93 ***0.220.82 ***−0.110.69 **0.55 *
SN1.000.95 ***−0.160.82 ***−0.70 ***−0.80 ***0.69 **0.73 ***0.82 ***0.260.75 ***−0.200.74 ***0.29
TN 1.000.120.92 ***−0.74 ***−0.74 ***0.71 ***0.68 **0.92 ***0.230.81 ***−0.130.72 ***0.49 *
NHI 1.000.17−0.290.080.21−0.070.17−0.340.290.05−0.290.82 ***
PFP-Nf 1.00−0.44 *−0.420.400.331.000.47 *0.64 **0.150.84 ***0.44 *
NUP-GN 1.000.93 ***−0.98 ***−0.92 ***−0.44 *0.35−0.85 ***0.56 **−0.12−0.61 **
NUP-TN 1.00−0.95 ***−0.99 ***−0.420.21−0.79 ***0.59 **−0.27−0.32
NUA-GN 1.000.96 ***0.40−0.340.83 ***−0.58 **0.120.53 *
NUA-TN 1.000.34−0.280.76 ***−0.63 **0.170.32
***, **, * indicate significant differences between nitrogen indicators and yield traits at p < 0.001, p < 0.01, and p < 0.05, respectively. Legend: GN—N mass in grain; SN—N mass in straw; TN—total N mass in winter wheat at harvest; NHI—nitrogen harvest index; PFP-Nf—partial factor productivity of fertilizer nitrogen; NUP-GN—nitrogen unit productivity in grain N; NUP-TN—nitrogen unit productivity in total N in winter wheat biomass; NUA-GN—nitrogen unit accumulation in grain N; NUA-TN—nitrogen unit accumulation in total N in winter wheat biomass at harvest; GY—grain yield; NE—number of ears per m2; GE—number of grains per ear; GD—grain density, number of grains per m2; TGW—thousand grain weight; SY—straw yield; HI—harvest index.
Table A3. Correlation matrix of the nitrogen use efficiency indicators with grain yield and yield components, n = 21.
TraitsR-GNR-TNPhNE-GNPhNE-TNGYNEGETGWSYHI
ANE0.86 ***0.77 ***0.63 **0.65 **0.99 ***0.51 *0.060.65 **0.80 **0.35
R-GN1.000.94 ***0.160.240.86 ***0.170.380.350.49 *0.62 **
R-TN 1.000.020.020.73 **0.040.470.200.400.54 *
PhNE-GN 1.000.96 ***0.63 ***0.75 ***−0.52 *0.79 ***0.81 ***−0.23
PhNE-TN 1.000.69 **0.72 **−0.460.82 ***0.76 ***−0.06
GY 1.000.52 *0.060.66 **0.79 ***0.38
NE 1.00−0.76 ***0.52 *0.77 ***−0.32
GE 1.00−0.41−0.330.56 *
TGW 1.000.63 **0.09
SY 1.00−0.26
***, **, * indicate significant differences between nitrogen use efficiency indicators and yield traits at p < 0.001, p < 0.01, and p < 0.05, respectively. Legend: ANE—agronomic nitrogen efficiency; R-GN—nitrogen recovery in grain; R-TN—nitrogen recovery for total N in winter wheat biomass at harvest; PhNE—physiological nitrogen efficiency of N in grain; PhTN—physiological nitrogen efficiency of N in TN in winter wheat biomass; GY—grain yield; NE—number of ears per m2; GE—number of grains per ear; GD—grain density, number of grains per m2; TGW—thousand grain weight; SY—straw yield; HI—harvest index.
Table A4. Correlation matrix of relationships between soil nutrient characteristics and basic winter wheat traits, n = 21.
TraitsNNbNNbPPbKKbMgMgb
GY0.220.140.09−0.28−0.38−0.250.250.250.11
NE0.44 *0.210.14−0.73 ***0.08−0.58 **0.55 *0.280.64
GE−0.15−0.140.110.40−0.290.31−0.280.14−0.49 *
TGW0.310.43−0.15−0.69 **−0.31−0.66 **0.65 **0.020.60 **
SY0.340.180.18−0.55 *−0.11−0.55 *0.54 *0.380.36
HI−0.14−0.05−0.030.37−0.54 *0.41−0.40−0.20−0.38
Nminh1.00−0.56 **0.04−0.64 **0.22−0.62 **0.600.020.71 ***
Nb 1.00−0.10−0.24−0.44 *−0.130.150.14−0.08
NNb 1.000.030.19−0.140.120.010.26
P 1.00−0.010.89 ***−0.87 ***−0.26−0.81 ***
Pb 1.00−0.170.130.310.36
K 1.00−0.99 ***−0.26−0.81 ***
Kb 1.000.250.77 ***
Mg 1.000.05
***, **, and * indicate significant differences at p < 0.001, p < 0.01, and p < 0.05, respectively; ns—non-significant. Legend: GY—grain yield; NE—number of ears per m2; GE—number of grains per ear; GD—grain density, number of grains per m2; TGW—thousand grain weight; SY—straw yield; TB—total biomass at harvest; HI—harvest index; N, P, K, Mg—nutrients; b—soil nutrient balance; NNb—net nitrogen balance.
Table A5. Correlation matrix of relationships between soil nutrient characteristics and indicators of nitrogen management in winter wheat, n = 21.
TraitsNNbNNbPPbKKbMgMgb
GN−0.110.40−0.94 ***−0.13−0.58 *0.06−0.040.17−0.28
SN−0.400.52 *−0.68 **0.11−0.69 **0.19−0.14−0.08−0.54 *
TN−0.200.46−0.94 ***−0.08−0.65 **0.10−0.070.12−0.374
NHI0.11−0.03−0.58 *−0.07−0.130.09−0.110.27−0.03
PFP-Nf0.180.55 *−0.62 **−0.65 **−0.50 *−0.440.440.250.24
NUP-GN0.50 *0.140.53 *−0.78 ***0.23−0.80 ***0.76 ***0.090.86 ***
NUP-TN0.54 *0.180.33−0.840.14−0.79 ***0.75 ***0.200.86 ***
NUA-GN−0.44−0.26−0.440.81 ***−0.090.79 ***−0.78 ***−0.13−0.77 ***
NUA-TN−0.52 *−0.25−0.290.87 ***−0.070.80 **−0.76 ***−0.20−0.83 ***
***, **, * indicate significant differences between nitrogen use efficiency indicators and yield traits at p < 0.001, p < 0.01, and p < 0.05, respectively. Legend: GN—amount of nitrogen in grain; SN—amount of nitrogen in straw; TN—total amount of nitrogen in winter wheat biomass; NHI—nitrogen harvest index; PFP-Nf—partial factor productivity of fertilizer nitrogen; NUP-GN—nitrogen unit productivity in grain N; NUP-TN—nitrogen unit productivity in total N in winter wheat biomass; NUA-GN—nitrogen unit accumulation for grain N; NUA-TN—nitrogen unit accumulation in total N in winter wheat biomass; TB—total winter wheat biomass; N, P, K, Mg—nutrients; b—soil nutrient balance; NNb—net nitrogen balance.
Table A6. Correlation matrix of relationships between soil nutrient characteristics and indicators of nitrogen use efficiency in winter wheat, n = 21.
TraitsNNbNNbPPbKKbMgMgb
ANE0.170.57 *−0.64 **−0.64 **−0.58 *−0.4300.430.190.19
R-GN−0.020.43−0.91 ***−0.27−0.58 *−0.070.080.18−0.16
R-TN−0.210.48 *−0.92 ***−0.07−0.71 **0.11−0.080.07−0.41
PhNE-GN0.49 *0.350.13−0.89 ***−0.16−0.82 ***0.80 ***0.090.74 ***
PhNE-TN0.54 *0.280.07−0.90 ***−0.08−0.81 ***0.77 ***0.190.79 ***
***, **, and * indicate significant differences at p < 0.001, p < 0.01, and p < 0.05, respectively; ns—non-significant. Legend: ANE—agronomic nitrogen efficiency; R-GN—nitrogen recovery in grain; R-TN—nitrogen recovery in total N in winter wheat biomass; PhNE—physiological efficiency of N in grain; PhTN—nitrogen efficiency of N in winter wheat biomass; N, P, K, Mg—nutrients; b—soil nutrient balance; NNb—net nitrogen balance.
Figure A1. Effect of fertilization variant in consecutive years of the study on thousand grain weight. a Similar letters in the column mean no significant differences in the Tukey test.
Sustainability 17 06705 g0a1
Figure A2. Effect of fertilization variant in consecutive years of the study on the agronomic nitrogen efficiency. a Similar letters in the column mean no significant differences in the Tukey test.
Sustainability 17 06705 g0a2
Figure A3. The effect of fertilization variants in consecutive years of the study on the potassium winter wheat balance. Means followed by the same letter within a column indicate the lack of a significant difference between the treatments. The vertical bar in the column is the standard error of the mean.
Sustainability 17 06705 g0a3
Figure A4. The effect of fertilization variants in consecutive years of the study on the potassium replacement ratio. Means followed by the same letter within a column indicate the lack of a significant difference between the treatments. The vertical bar in the column is the standard error of the mean.
Sustainability 17 06705 g0a4

References

  1. Sharma, L.K.; Bali, S.K. A review of methods to improve nitrogen use efficiency in agriculture. Sustainability 2018, 10, 51. [Google Scholar] [CrossRef]
  2. Barłóg, P.; Grzebisz, W.; Łukowiak, R. Fertilizers and fertilization strategies mitigating soil factors constraining efficiency of nitrogen in plant production. Plants 2022, 11, 1855. [Google Scholar] [CrossRef] [PubMed]
  3. Luo, L.; Zhang, Y.; Xu, G. How does nitrogen shape plant architecture. J. Exp. Bot. 2020, 71, 4415–4427. [Google Scholar] [CrossRef] [PubMed]
  4. Ötvös, K.; Marconi, M.; Vega, A.; O’brian, J.; Johnston, A.; Abualla, R.; Antonielli, L.; Montesinos, J.C.; Zhang, Y.; Yan, S.; et al. Modulation of plant root growth by nitrogen source-defined regulation of polar auxin transport. EMBO J. 2021, 40, e106862. [Google Scholar] [CrossRef] [PubMed]
  5. Lynch, J.L. Root phenotypes for improved capture: An underexploited opportunity for global agriculture. New Phytol. 2019, 223, 548–564. [Google Scholar] [CrossRef] [PubMed]
  6. Klepper, B.; Rickman, R.W.; Waldman, S.; Chevalier, P. The physiological life cycle of wheat: Its use in breeding and crop management. Euphytica 1998, 100, 341–347. [Google Scholar] [CrossRef]
  7. Anas, M.; Liao, F.; Verma, K.K.; Sarwar, M.A.; Mahmood, A.; Chen, Z.-L.; Li, Q.; Zeng, X.-P.; Liu, Y.; Li, Y.-R. Fate of nitrogen in agriculture and environment: Agronomic, eco-physiological and molecular approaches to improve nitrogen use efficiency. Biol. Res. 2020, 53, 47. [Google Scholar] [CrossRef] [PubMed]
  8. Rockström, J.; Williams, J.; Daily, G.; Noble, A.; Matthews, N.; Gordon, L.; Wetterstrand, H.; DeClerck, F.; Shah, M.; Steduto, P.; et al. Sustainable intensification of agriculture for human prosperity and global sustainability. Ambio 2017, 46, 4–17. [Google Scholar] [CrossRef] [PubMed]
  9. Grzebisz, W.; Łukowiak, R. Nitrogen gap amelioration is a core for sustainable intensification of agriculture—A concept. Agronomy 2021, 11, 419. [Google Scholar] [CrossRef]
  10. Asseng, S.; Guarin, J.R.; Raman, M.; Monje, O.; Kiss, G.; Despomnier, D.D.; Meggers, F.M.; Gaither, P.P.G. Wheat yield potential in controlled—Environment vertical farms. Proc. Natl. Acad. Sci. USA 2020, 117, 19131–19135. [Google Scholar] [CrossRef] [PubMed]
  11. Grzebisz, W.; Szczepaniak, W.; Przygocka-Cyna, K.; Biber, M.; Spiżewski, T. Sources of nutrients for the growing ear of winter wheat in the Critical Cereal Window. Agronomy 2024, 14, 3018. [Google Scholar] [CrossRef]
  12. Johnston, A.M.; Bruulsema, T.W. 4R nutrient stewarship for improved nutrient use efficiency. Procedia Engin. 2014, 83, 365–370. [Google Scholar] [CrossRef]
  13. Grzebisz, W.; Diatta, J.; Barłóg, P.; Biber, M.; Potarzycki, J.; Łukowiak, R.; Przygocka-Cyna, K.; Szczepaniak, W. Soil fertility clock─crop rotation as a paradigm in nitrogen fertilizer productivity control. Plants 2022, 11, 2841. [Google Scholar] [CrossRef] [PubMed]
  14. Marschner, H. Mineral Nutrition of Higher Plants, 2nd ed.; Academic Press: London, UK, 1995; 899p. [Google Scholar]
  15. Krouk, G.; Kiba, T. Nitrogen and phosphorus interactions in plants: From agronomic to physiological and molecular insights. Curr. Opin. Plant Biol. 2020, 57, 104–109. [Google Scholar] [CrossRef] [PubMed]
  16. MacDonald, G.K.; Bennett, E.M.; Potter, P.A.; Ramankutty, N. Agronomic phosphorus imbalances across the world’s croplands. Proc. Natl. Acad. Sci. USA 2011, 108, 3086–3091. [Google Scholar] [CrossRef] [PubMed]
  17. Holmes, M.R.J. Nutrition of the Oilseed Rape Crop; Applied Science Publishers Ltd.: London, UK, 1980; 158p. [Google Scholar]
  18. Grzebisz, W.; Szczepaniak, W.; Barłóg, P.; Przygocka-Cyna, K.; Potarzycki, J. Phosphorus sources for winter oilseed rape (Brassica napus L.) during reproductive growth—Magnesium sulfate management impact on P use efficiency. Arch. Agron. Soil Sci. 2018, 64, 1646–1662. [Google Scholar] [CrossRef]
  19. FAOSTAT. Food and Agriculture Organization of the United Nations. Available online: http://faostat.fao.org/site/567/default.aspx#ancor (accessed on 5 April 2025).
  20. Grzebisz, W.; Čermák, P.; Rroco, E.; Szczepaniak, W.; Potarzycki, J.; Füleky, G. Potassium impact on nitrogen use efficiency in potato—A case study from the Central-East Europe. Plant Soil Environ. 2017, 63, 422–427. [Google Scholar] [CrossRef]
  21. Grzebisz, W.; Potarzycki, J. The in-season nitrogen concentration in the potato tuber as the yield driver. Agron. J. 2020, 112, 1287–1308. [Google Scholar] [CrossRef]
  22. Barraclough, P.B. The growth and activity of winter wheat roots in the field: Nutrient uptakes of high-yielding crops. J. Agric. Sci. Camb. 1986, 106, 45–52. [Google Scholar] [CrossRef]
  23. Ciampitti, I.A.; Camberato, J.J.; Murrel, S.T.; Vyn, T.J. Maize nutrient accumulation and partitioning in response to plant density and nitrogen rate: I. Macronutrients. Agron. J. 2013, 10593, 7830. [Google Scholar] [CrossRef]
  24. Conijn, J.G.; Bindraban, P.S.; Schröder, J.J.; Jongschaap, R.E.E. Can our global food system meet food demand within planetary boundries? Agric. Ecosys. Environ. 2018, 251, 244–256. [Google Scholar] [CrossRef]
  25. Jones, J.B., Jr. Agronomic Handbook; CRC Press LLC: Boca Raton, FL, USA, 2003; 450p. [Google Scholar]
  26. Sardans, J.; Peñuelas, J. Potassium control of plant functions: Ecological and agricultural implications. Plants 2021, 10, 419. [Google Scholar] [CrossRef] [PubMed]
  27. Rawat, J.; Pandey, N.; Saxena, J. Role of Potassium in Plant Photosynthesis, Transport, Growth and Yield. In Role of Potassium in Abiotic Stress; Iqbal, N., Umar, S., Eds.; Springer: Singapore, 2022; pp. 1–14. [Google Scholar]
  28. Guo, Z.; Chen, D.; Schnurbusch, T. Plant and floret growth at distinct developmental stages during the stem elongation phase in wheat. Front. Plant Sci. 2018, 9, 330. [Google Scholar] [CrossRef] [PubMed]
  29. Hubbard, K.E.; Webb, A.A.R. Circadian Rhythms in Stomata: Physiological and Molecular Aspects. In Rhythms in Plants; Mancuso, S., Shabala, S., Eds.; Springer: Cham, Switzerland, 2015; pp. 231–255. [Google Scholar]
  30. Ragel, P.; Raddatz, N.; Leidi, E.O.; Quintero, F.J.; Pardo, J.M. Regulation of K+ nutrition in plants. Front. Plant Sci. 2019, 10, 281. [Google Scholar] [CrossRef] [PubMed]
  31. Wang, M.; Zheng, Q.S.; Shen, Q.R.; Guo, S.W. The critical role of potassium in plant stress response. Int. J. Mol. Sci. 2013, 14, 7370–7390. [Google Scholar] [CrossRef] [PubMed]
  32. Zörb, C.; Ludewig, U.; Hawkesford, M.J. Perspective on wheat yield and quality with reduced nitrogen supply. Trends Plant Sci. 2018, 23, 1019–1037. [Google Scholar] [CrossRef] [PubMed]
  33. Bindraban, P.S.; Dimkpa, C.; Nagarajan, L.; Roy, A.; Rabbinge, R. Revisiting fertilisers and fertilisation strategies for improved nutrient uptake by plants. Biol. Fertil. Soils 2015, 51, 897–911. [Google Scholar] [CrossRef]
  34. Grzebisz, W.; Zielewicz, W.; Przygocka-Cyna, K. Deficiencies of secondary nutrients in crop plants—A real challenge to improve nitrogen management. Agronomy 2023, 13, 66. [Google Scholar] [CrossRef]
  35. Gerendás, J.; Führs, H. The significance of magnesium for crop quality. Plant Soil 2013, 368, 101–128. [Google Scholar] [CrossRef]
  36. Klikocka, H.; Marks, M. Sulphur and nitrogen fertilization as a potential means of agronomic biofortification to improve the content and uptake of microelements in spring wheat grain DM. J. Chem. 2018, 2018, 9326820. [Google Scholar] [CrossRef]
  37. Härdter, R.; Rex, M.; Orlovius, K. Effects of different Mg fertilizer sources on the magnesium availability in soils. Nutr. Cycl. Agroecos. 2004, 70, 249–259. [Google Scholar] [CrossRef]
  38. Shaul, O. Magnesium transport and function in plants: The tip of the iceberg. Biometals 2002, 15, 309–323. [Google Scholar] [CrossRef] [PubMed]
  39. Jamal, A.; Moon, Y.-S.; Abdin, M.Z. Sulphur—A general overview and interaction with nitrogen. Aust. J. Crop Sci. 2010, 4, 523–529. [Google Scholar]
  40. Grant, C.; Hawkesford, M.J. Sulfur. In Handbook od Plant Nutrition, 2nd ed.; Barker, A.V., Pilbeam, D.J., Eds.; CRC Press, Taylor and Francis Group: Boca Raton, FL, USA, 2015; pp. 261–304. [Google Scholar]
  41. The Royal Society. Reaping the Benefits: Science and the Sustainable Intensification of Global Agriculture; RS Policy Document; The Royal Society: London, UK, 2009; p. 86. [Google Scholar]
  42. Wallace, A.; Wallace, G.A. Closing the Crop—Yield Gap through Better Soil and Better Management; Wallace Laboratories: Los Angeles, CA, USA, 2003; p. 162. [Google Scholar]
  43. Congreves, K.A.; Otchere, O.; Ferland, D.; Farzadfar, S.; Williams, S.; Arcand, M.M. Nitrogen use efficiency definitions of today and tomorrow. Front. Plant Sci. 2021, 12, 637108. [Google Scholar] [CrossRef] [PubMed]
  44. Grzebisz, W.; Potarzycki, J. A realistic approach to calculating the nitrogen use efficiency index in cereals with winter wheat (Triticum aestivum L.) as an example. Agronomy 2025, 15, 161. [Google Scholar] [CrossRef]
  45. Mehlich, A. Mehlich 3 soil test extractant: A modification of Mehlich 2 extractant. Com. Soil Sci. Plant Anal. 1984, 15, 1409–1416. [Google Scholar] [CrossRef]
  46. Kęsik, K. Application of the Mehlich 3 method in the fertilizer advisory system. Stud. I Rap. IUNG-PIB 2016, 48, 95–104. (In Polish) [Google Scholar]
  47. Trávník, K.; Zbíral, J.; Nemec, P. Agrochemical Soil Testing—Mehlich III; Central Institute for Supervising and Testing in Agriculture: Brno, Czech Republic, 1999. [Google Scholar]
  48. Zbíral, J. Determination of plant-available micronutrients by the Mehlich 3 soil extractant—A proposal of critical values. Plant Soil Environ. 2016, 62, 527–531. [Google Scholar] [CrossRef]
  49. PN-EN ISO 20483:2014-02; Cereal Grains and Pulses—Determination of Nitrogen Content and Conversion to Crude Protein—Kjeldahl Method. PKN: Warsaw, Poland, 2015; p. 24.
  50. Szczepaniak, W.; Nowicki, B.; Bełka, D.; Kazimierowicz, A.; Kulwicki, M.; Grzebisz, W. Effect of foliar application of micronutrients and fungicides on the nitrogen use efficiency in winter wheat. Agronomy 2022, 12, 257. [Google Scholar] [CrossRef]
  51. Wilding, L.P.; Dress, L.R. Spatial variability and pedology. In Pedogenesis and Soil Taxonomy; Wilding, L.P., Smeck, N., Hall, G.F., Eds.; Elsevier: Wageningen, The Netherlands, 1983; pp. 83–116. [Google Scholar]
  52. Smith, G. Step away from stepwise. J. Big Data 2018, 5, 32. [Google Scholar] [CrossRef]
  53. Schröder, J.J.; Schulte, R.P.O.; Cremer, R.E.; Delgado, A.; van Leeuwen, J.; Lehtinen, T.; Rutgers, M.; Spiegel, H.; Staes, J.; Tóth, G.; et al. The elusive role of soil quality in nutrient cycling: A review. Soil Use Manag. 2016, 32, 476–486. [Google Scholar] [CrossRef]
  54. Ahrends, H.E.; Siebert, S.; Rezaei, E.E.; Seidel, S.J.; Hüging, H.; Ewert, F.; Döring, T.; Rueda-Ayala, V.; Eugster, W.; Gaiser, T. Nutrient supply affects the yield stability of major European crops─A 50 year study. Environ. Res. Lett. 2020, 16, 014003. [Google Scholar] [CrossRef]
  55. Wójcik-Gront, E.; Iwańska, M.; Wnuk, A.; Oleksiak, T. The analysis of wheat yield variability based on experimental data from 2008–2018 to understand the yield gap. Agriculture 2022, 12, 32. [Google Scholar] [CrossRef]
  56. Shewry, P.R.; Hey, S.J. The contribution of wheat to human diet and health. Food Energy Sec. 2015, 493, 178–202. [Google Scholar] [CrossRef] [PubMed]
  57. Szczepaniak, W.; Barłóg, P.; Łukowiak, R.; Przygocka-Cyna, K. Effect of balanced nitrogen fertilization in four-year rotation on plant productivity. J. Cent. Eur. Agric. 2013, 14, 64–77. [Google Scholar] [CrossRef]
  58. Hlisnikovsky, L.; Menšik, L.; Kunzová, E. The development of winter wheat yield and quality under different fertilizer regimes and soil-climatic conditions in the Czech Republic. Agronomy 2020, 10, 1160. [Google Scholar] [CrossRef]
  59. Messaoudi, A.; Labdelli, F.; Rebouh, N.Y.; Djerbaoui, M.; Kucher, D.E.; Hadjout, S.; Ouaret, W.; Zakharova, O.A.; Latati, M. Investigating the potassium fertilization effect on morphological and agrophysical indicators of durum wheat under Mediterranean rain-fed conditions. Agriculture 2023, 13, 1142. [Google Scholar] [CrossRef]
  60. Wang, Z.; Hassan, M.U.; Nadeem, F.; Wu, L.; Zhang, F.; Li, X. Magnesium fertilization improves crop yield in most production systems: A meta–analysis. Front. Plant Sci. 2020, 10, 1727. [Google Scholar] [CrossRef] [PubMed]
  61. Potarzycki, J. Influence of nitrogen and magnesium fertilization at the flag leaf stage of winter wheat development on the yield and grain quality. Fertil. Fertil. 2008, 32, 100–121. [Google Scholar]
  62. EL-Metwally, A.E.; Abdalla, F.E.; Saady, A.M.; Safina, S.A.; EI-Sawy, S.S. Response of wheat to magnesium and copper foliar feeding under sandy soil conditions. J. Am. Sci. 2010, 6, 818–823. [Google Scholar]
  63. Grzebisz, W.; Potarzycki, J. Effect of magnesium fertilization systems on grain yield formation by winter wheat (Triticum aestivum L.) during the grain filling period. Agronomy 2022, 12, 12. [Google Scholar] [CrossRef]
  64. González, F.G.; Miralles, D.J.; Slafer, G.A. Wheat floret survival as related to pre-anthesis spike growth. J. Exp. Bot. 2011, 62, 4889–4901. [Google Scholar] [CrossRef] [PubMed]
  65. Duan, J.; Wu, Y.; Zhou, Y.; Ren, X.; Shao, Y.; Feng, W.; Zhu, Y.; Wang, Y.; Guo, T. Grain number response to pre-anthesis dry matter and nitrogen in improving wheat yield in the Huang-Huai Plain. Sci. Rep. 2018, 8, 7126. [Google Scholar] [CrossRef]
  66. Serrago, R.A.; Alzueta, I.; Savin, R.; Slafer, G.A. Understanding grain yield responses to source–sink ratios during grain filling in wheat and barley under constraining environments. Field Crops Res. 2013, 150, 42–51. [Google Scholar] [CrossRef]
  67. Slafer, G.A.; Garcia, G.A.; Serrago, R.A.; Miralles, D.J. Physiological drivers of responses of grains per m2 to environmental and genetic factors in wheat. Field Crops Res. 2022, 285, 108593. [Google Scholar]
  68. Potarzycki, J.; Grzebisz, W.; Szczepaniak, W. Magnesium fertilization increases nitrogen use efficiency in winter wheat (Triticum aestivum L.). Plants 2022, 11, 2600. [Google Scholar] [CrossRef] [PubMed]
  69. Grzebisz, W.; Szczepaniak, W.; Potarzycki, J.; Łukowiak, R. Sustainable management of soil potassium—A crop rotation oriented concept. In Soil Fertility; Issaka, R.N., Ed.; InTech: London, UK, 2012; 38p. [Google Scholar]
  70. Yawson, D.O.; Amoach, K.K.; Asare, P.A.; Techie-Menson, J.; Afutu, E.; Atiah, K.; Sanieri, A.K.; Sare-Larbi, S.; Adu, M.O. A meta-analysis of modifications of root system traits of crop plants to potassium (K) deprivation. In Plant Roots; Yildirim, E., Turan, M., Ekinci, M., Eds.; InTech: London, UK, 2021; 27p. [Google Scholar]
  71. Kuchenbuch, R.; Claassesn, N.; Jungk, A. Potassium availability in relation to soil moisture. II. Calculation by means of a mathemantical model simulation model. Plant Soil 1986, 95, 233–243. [Google Scholar] [CrossRef]
  72. Gransee, A.; Führs, H. Magnesium mobility in soils as a challenge for soil and plant analysis, magnesium fertilization and root uptake under adverse growth conditions. Plant Soil 2013, 368, 5–21. [Google Scholar] [CrossRef]
  73. Klikocka, H.; Szczepaniak, W. Energy crises—Alternative use of winter bread wheat grain depending on protein content. Agronomy 2023, 13, 861. [Google Scholar] [CrossRef]
  74. Burton, A.; Levy Haner, L.; Schaad, N.; Strebel, S.; Vuille-dit-Bille, N.; de Figueiredo Bongiovani, P.; Holzkamper, A.; Pellet, D.; Herrera, J.M. Evaluating nitrogen fertilization strategies to optimize yield and grain nitrogen in top winter wheat varieties across Switzerland. Field Crops Res. 2024, 307, 109251. [Google Scholar] [CrossRef]
Figure 1. The effect of fertilization systems on the grain yield of winter wheat in subsequent years of the study. Means followed by the same letter within a column indicate the lack of a significant difference between the treatments. The vertical bar in the column is the standard error of the mean.
Sustainability 17 06705 g001
Figure 2. Nitrogen balance in winter wheat during the growing season in subsequent years of the study. Means followed by the same letter within a column indicate the lack of a significant difference between the treatments. The vertical bar in the column is the standard error of the mean.
Sustainability 17 06705 g002
Figure 3. The effect of fertilization variants in consecutive years of the study on the magnesium winter wheat balance. Means followed by the same letter within a column indicate the lack of a significant difference between the treatments. The vertical bar in the column is the standard error of the mean.
Sustainability 17 06705 g003
Figure 4. The effect of fertilization systems on the mineral N balance in subsequent years of the study. Means followed by the same letter within a column indicate the lack of a significant difference between the treatments. The vertical bar in the column is the standard error of the mean.
Sustainability 17 06705 g004
Figure 5. The effect of fertilization systems (FVs) on the balance of available K in subsequent years of the study. Means followed by the same letter within a column indicate the lack of a significant difference between the treatments. The vertical bar in the column is the standard error of the mean.
Sustainability 17 06705 g005
Figure 6. Scissors effect of nitrogen productivity on the background of available Mg balance during the growing season of winter wheat.
Sustainability 17 06705 g006
Table 1. Soil agrochemical characteristics of the topsoil in consecutive growing seasons 3.
Soil CharacteristicsGrowing Seasons
2015/20152016/20172017/2018
pH 16.1 ± 0.26.1 ± 0.35.7 ± 0.2
Corg 2, g kg−115.8 ± 3.316.0 ± 2.615.9 ± 2.8
N mineral, kg ha−166 ± 1664 ± 1848 ± 14
P 5, mg kg−1210 ± 15VH 4 212 ± 20VH286 ± 32VH
K 5, mg kg−1145 ± 15L152 ± 12L155 ± 16M
Mg 5, mg kg−1120 ± 11H 97 ± 10M91 ± 12M
Ca 6, mg kg−1740 ± 125L1195 ± 130L840 ± 95L
Cu 7, mg kg−10.9 ± 0.4L2.2 ± 0.5M1.4 ± 0.6L
Zn 7, mg kg−12.4 ± 0.9M4.1 ± 1.2H4.8 ± 1.4M
Mn 7, mg kg−136 ± 12M57 ± 16M54 ± 14M
Fe 7, mg kg−1299 ± 66M285 ± 58M365 ± 84M
1 1.0 M KCl soil/solution ratio 1:2.5 m/v; 2 loss on ignition; 3 Mehlich 3 [45]; 4 availability classes: L—low; M—medium; H—high; VH—very high [46,47,48] 5–7.
Table 2. Main meteorological characteristics during the winter wheat growing season relative to long-term averages at Brody Experimental Farm during the study.
Months2015/20162016/20172017/2018Long-Term
1961–2015
T 1P 2TPTPTP
September17.957.917.49.913.860.713.367.3
October5.840.68.476.611.179.48.548.8
November8.121.73.331.85.451.73.740.7
December5.845.12.237.62.731.30.045.5
January5.938.0−2.412.52.157.6−1.647.7
February−1.728.51.230.4−2.53.7−0.640.2
March3.733.97.140.50.720.62.932.3
April4.131.27.925.712.965.38.139.2
May8.829.714.049.217.119.213.237.4
Juni15.376.117.6106.019.131.516.657.4
July18.094.818.4160.820.7134.918.363.8
1 Temperature, °C; 2 precipitation, mm.
Table 3. The experimental design and nutrient doses.
Treatment (Acronyms)Fertilization VariantsNP2O5K2OMgO
[kg ha−1]
ACAbsolute Control—AC0000
NPNP1504000
NPK-MOPNPK–MOP15040800
NPK-MOP+KiNPK–MOP+Kieserite150408030
NPK-KKNPK–Korn–Kali150408012
NPK-KK+KiNPK–Korn–Kali+Kieserite150408012 + 18
NPK-KK+Ki+ESNPK–Korn–Kali+Kieserite+EPSO Top150408012 + 18 + 6.4
Table 4. Schedule winter wheat foliar fertilization during the growing season using EPSO Top.
ApplicationMaximum ConcentrationRate [kg ha−1]BBCH CodeDescription
1st5%
(5 kg in 100 dm3 of
water)
1019Nine leaves unfolded (autumn)
2nd1530Beginning of stem elongation
3rd1555Early ear emergence
Table 5. Basic characteristics of winter wheat at harvest: grain yield, yield components, and biomass.
Factor Level of FactorGYNEGEGDTGWSYTBHI
t ha−1No. Ears m−2No. Grains Ears−1 No. Grains m−2 × 1000gt ha−1%
Year2015/20166.8 b524.8 a27.6 b14.2 b48.1 a8.4 a15.2 a44 b
(Y) 2016/20177.3 a475.9 a32.7 b15.4 a47.4 ab8.1 a15.4 a47 a
2017/20185.7 c405.9 b34.3 b13.5 b42.7 b6.4 b12.1 a48 a
Fc, p125 ***15.8 ***10.7 ***20.2 ***36.0 ***18.5 ***45.4 ***5.6 **
FertilizationAC3.7 d432.019.0 b7.8 a47.9 a5.2 b8.9 b43 b
variantsNP6.4 c459.732.8 a14.1 c45.1 b8.1 a14.4 a45 ab
(FVs)NPK-MOP6.8 bc513.029.4 a14.6 bc46.3 b7.8 a14.6 a47 ab
NPK-MOP+Ki7.2 ab465.535.6 a16.1 a44.9 b8.0 a15.2 a47 ab
NPK-KK7.2 ab454.135.3 a15.5 ab46.6 b8.1 a15.3 a47 ab
NPK-KK+Ki7.3 a453.434.9 a15.7 ab46.8 b7.9 a15.2 a48 a
NPK-KK+Ki+ES7.5 a504.433.8 a16.6 a45.0 b8.5 a16.0 a47 ab
Fc, p154 ***1.4 ns13.2 ***80.8 ***2.4 *8.5 ***34.9 ***2.6 *
Source variation for the studied interaction
Y × FV***nsns*********2.7 **
Average6.6468.931.514.446.17.714.20.46
Standard deviation1.566.86.93.13.11.63.00.03
Coefficient of variation, %22.914.321.821.96.820.620.87.4
Means followed by the same letter within a column indicate the lack of a significant difference between the treatments; ***, **, and * indicate significant differences at p < 0.001, p < 0.01, and p < 0.05, respectively; ns—non-significant. Legend: GY—grain yield; NE—number of ears per m2; GE—number of grains per ear; GD—grain density, number of grains per m2; TGW—thousand grain weight; SY—straw yield; TB—total biomass at harvest; HI—harvest index.
Table 6. Nitrogen accumulation by winter wheat–nitrogen characteristics and nitrogen use efficiency indices.
Factor Level of FactorGNSNTNNHIPFP-NfNUP-GNNUP-TNNUA-GNNUA-TN
kg ha−1%kg grain kg−1 Nfkkg grain kg−1 GNkg grain kg−1 TNkg N t−1 grainkg N t−1
TB
Year2015/2016117.3 b43.0 b160.3 b71.545.1 b63.0 a43.6 a17.1 b23.6 c
(Y) 2016/2017139.5 a51.6 a191.1 a73.648.5 a53.4 b39.4 b18.9 ab25.8 b
2017/2018118.7 b45.6 ab164.3 b72.738.2 c50.2 b36.5 b20.4 a28.3 a
Fc. p10.5 ***3.8 *16.8 ***0.7 ns125 ***9.4 ***12.1 ***10.1 ***17.3 ***
FertilizationAC53.7 a20.3 b74.0 a72.770.1 a50.2 a14.7 b20.2 b
variantsNP119.7 b50.4 a170.1 b70.042.5 b55.4 b37.9 b18.7 ab26.6 ab
(FV)NPK-MOP124.5 bc49.9 a174.4 b71.045.0 bc56.2 ab39.4 b18.5 ab26.0 ab
NPK-MOP+Ki141.5 a–c50.3 a191.8 ab73.648.1 ab52.3 b38.2 b19.8 a26.9 ab
NPK-KK137.5 a–c48.1 a185.7 ab74.048.0 a54.0 b39.4 b19.2 ab25.9 ab
NPK-KK+Ki149.0 ab53.6 a202.6 a73.549.0 a50.0 b36.6 b20.4 a27.8 a
NPK-KK+Ki+ES150.3 a54.4 a204.7 a73.550.1 a50.737.2 b20.3 a27.7 a
Fc. p32.7 ***11.9 ***52.1 ***0.6 ns154 ***4.3 **8.7 ***5.8 ***9.1 ***
Source variation for the studied interaction
Y × FVnsnsnsns***nsnsnsns
Average125.246.7171.972.647.155.539.818.825.9
Standard deviation34.412.646.13.16.58.95.82.53.4
Coefficient of variation, %27.526.926.84.313.716.014.513.113.2
Similar letters in the column mean no significant differences in the Tukey test; ***, **, * indicate significant differences at p < 0.001, p < 0.01, and p < 0.05, respectively; ns—non-significant. Legend: GN—amount of nitrogen in grain; SN—amount of nitrogen in straw; TN—total amount of nitrogen in winter wheat biomass; NHI—nitrogen harvest index; PFP-Nf—partial factor productivity of fertilizer nitrogen; NUP-GN—nitrogen unit productivity in grain N; NUP-TN—nitrogen unit productivity in total N in winter wheat biomass; NUA-GN—nitrogen unit accumulation for grain N; NUA-TN—nitrogen unit accumulation in total N in winter wheat biomass; TB—total winter wheat biomass.
Table 7. Nitrogen use efficiency indicators.
Factor Level of FactorANER-GNR-TNPhNE-GNPhNE-TN
kg grain
kg−1 Nf
%Nf in GN%Nf in TNkg grain
kg−1 GN
kg grain
kg−1 TN
Year2015/201623.2 b51.4 b63.3 b50.1 a38.2 a
(Y) 2016/201730.5 a67.8 a96.6 a45.4 a32.0 b
2017/201813.7 c47.6 b68.6 b29.3 b20.4 c
Fc, p131 ***14.5 ***30.8 ***25.0 ***44.8 ***
FertilizationNP17.8 c44.0 c64.1 c42.228.1
variantsNPK-MOP20.4 bc47.2 bc67.0 bc45.231.7
(FVs)NPK-MOP+Ki23.5 ab58.4 a–c78.5 a–c40.730.5
NPK-KK23.4 ab55.9 a–c74.5 a–c43.932.9
NPK-KK+Ki24.3 ab63.6 ab85.7 ab38.528.7
NPK-KK+Ki+ES25.5 a64.4 a87.2 a39.229.2
Fc, p7.6 ***4.4 **4.4 **0.7 ns1.0 ns
Source variation for the studied interaction
Y × FVs**nsnsnsns
Average22.555.676.241.630.2
Standard deviation7.912.818.09.98.0
Coefficient of variation, %35.223.023.623.826.7
Similar letters in the column mean no significant differences in the Tukey test; *** and ** indicate significant differences.at p < 0.001 and p < 0.01, respectively; ns—non-significant. Legend: ANE—agronomic nitrogen efficiency; R-GN—nitrogen recovery in grain; R-TN—nitrogen recovery in total N in winter wheat biomass; PhNE—physiological efficiency of N in grain; PhTN—nitrogen efficiency of N in winter wheat biomass.
Table 8. Crip nutrient balance and crop residue nutrient replacement ratio.
Factor Level of FactorNcbPcbKcbMgcbNrPrKrMgr
kg ha−1-
Year2015/2016−36.0 a−20.0 b−65.0 b−6.1 a0.69 b0.56 b1.21 b−1.68 b
(Y) 2016/2017−63.2 b−8.9 a−65.5 b−7.1 a0.90 b1.28 a1.12 b−0.65 ab
2017/2018−36.2 a−20.4 b−49.7 a−11.8 b1.91 a0.50 b1.79 a0.32 a
Fc, p42.3 ***96.4 ***9.1 ***53.9 ***53.9 ***72.3 ***52.4 ***9.5 ***
FertilizationAC−74.0 e−18.4 b−59.1 a−10.4 c0.27 c0.37 b0.65 c0.59 a
variantsNP−14.3 a−13.0 a−107.9 b−17.9 e0.77 bc1.02 a0.67 c0.57 a
(FVs)NPK-MOP−30.3 b−15.1 ab−40.8 b−17.2 e2.32 a0.96 a2.19 a0.55 a
NPK-MOP+Ki−43.4 b–d−16.2 ab−55.1 b−2.5 b1.34 ab0.80 a1.42 b1.50 a
NPK-KK−39.8 bc−16.5 ab−53.9 b−13.2 d1.33 ab0.82 a1.40 b0.84 a
NPK-KK+Ki−55.1 cd−16.7 ab−56.5 b−0.5 b1.07 ab0.76 a1.41 b−4.84 b
NPK-KK+Ki+ES−59.3 de−19.1 b−47.1 b3.4 a1.07 ab0.76 a1.87 a−3.91 b
Fc, p28.8 ***3.9 ***23.2 **173 ***21.1 ***7.1 ***54.4 ***26.8 ***
Source variation for the studied interaction
Y × FV*********************
Average−45.2−16.4−60.1−8.31.170.781.37−0.67
Standard deviation25.86.125.18.61.160.450.714.16
Coefficient of variation. %−57.1−37.3−41.7−103.499.2257.5151.83−619.86
Means followed by the same letter within a column indicate the lack of a significant difference between the treatments; ***, **, and * indicate significant differences at p < 0.001, p < 0.01, and p < 0.05, respectively; ns—non-significant. Legend: N, P, K, Mg—nutrients; Cb—nutrient balance; r—crop residue nutrient replacement ratio.
Table 9. Content of basic nutrients at winter wheat harvest and balance during the growing season mg kg−1 soil.
FactorLevel of FactorNNbNinNoutNNbPPbKKbMgMgb
Year2015/201626.8 a39.2 b194.6187.1 b7.49 a169.2 c H 140.8 a87.5 c L57.5 a92.9 H27.1 a
(Y)2016/201717.0 b47.0 a192.6208.1 a−15.5 b194.3 b H17.7 b116.2 b M35.8 b90.6 H6.4 b
2017/201811.6 c36.4 b176.6175.9 b0.69 a250.2 a VH35.8 a149.7 a H5.3 c90.7 H0.3 c
Fc. p35.0 ***17.6 ***17.6 ***15.4 ***8.0 ***348 ***29.9 ***186 ***132 ***2.0 ns232 ***
FertilizationAC15.244.159.389.2 c−29.8 c198.5 H37.5119.2 ab H31.4 a90.2 H12.4 a
variantsNP21.038.3209.3191.1 b18.2 a201.1 H34.9104.9 b H45.8 a91.1 H11.6 a
(FVs)NPK-MOP17.641.8209.3192.0 b17.3 a208.9 VH27.1121.7 a H29.0 b92.7 H10.0 a
NPK-MOP+Ki18.640.7209.3210.4 ab−1.1 ab205.6 H30.4117.0 ab H33.690.9 H11.7 a
NPK-KK19.639.7209.3205,3 ab4.0 ab207.6 VH28.4124.3 a H26.4 b90.3 H12.3 a
NPK-KK+Ki21.038.3209.3223.6 a−14.3 bc208.4 VH27.6120.6 ab H30.0 b90.2 H12.5 a
NPK-KK+Ki+ES16.243.1209.3221.0 a−11.6 bc202.0 H34.0117.0 H33.7 a94.2 H8.5 b
Sourece variation for the studied interaction
Fc. p1.3 ns1.2 ns1.3 ns53.0 ***7.5 ***1.4 ns1.5 ns3.2 **3.4 *1.2 ns1.4 *
Y × FV*********nsnsnsns********
Average18.540.9187.9190.4−2.5204.631.4117.832.991.411.3
Standard deviation4.13.254.447.522.419.86.615.513.41.46.7
Coefficient of variation.%22.17.829.024.99119.721.113.240.71.559.7
1 availability class: L—low; M—medium; H—high; VH—very high [43]; means followed by the same letter within a column indicate the lack of a significant difference between the treatments; ***, ** and * indicate significant differences at p < 0.001. p < 0.01. and p < 0.05 respectively; ns—non-significant. Legend: N, P, K, Mg—nutrient content in the soil at harvest; b—balance of nutrient during the growing season; Nin—the sum of Nf and the amount of Nmin in spring; Nout—the sum of n accumulated in winter wheat biomass at harvest and the amount of Nmin at harvest; NNb—net nitrogen balance.
Disclaimer/Publisher’s Note: The statements, opinions and data contained in all publications are solely those of the individual author(s) and contributor(s) and not of MDPI and/or the editor(s). MDPI and/or the editor(s) disclaim responsibility for any injury to people or property resulting from any ideas, methods, instructions or products referred to in the content.

