Article

Cultural Ecosystem Services of Grassland Communities: A Case Study of Lubelskie Province

by
Teresa Wyłupek
1,
Halina Lipińska
1,
Agnieszka Kępkowicz
1,
Kamila Adamczyk-Mucha
1,*,
Wojciech Lipiński
2,
Stanisław Franczak
3 and
Agnieszka Duniewicz
4
1
Department of Grassland Science and Landscaping, University of Life Sciences in Lublin, Akademicka Street 13, 20950 Lublin, Poland
2
Institute of Agriculture and Human Nutrition, University College of Applied Sciences in Chelm, Pocztowa Street 54, 22-100 Chelm, Poland
3
Proteon Pharmaceuticals SA, Tylna Street 3A, 90-364 Łódź, Poland
4
Department of Architectural Design and History of Architecture, Institute of Architecture and Urban Planning, Faculty of Architecture, Bialystok University of Technology, Wiejska Street 45A, 15-351 Bialystok, Poland
*
Author to whom correspondence should be addressed.
Sustainability 2025, 17(15), 6697; https://doi.org/10.3390/su17156697
Submission received: 6 June 2025 / Revised: 15 July 2025 / Accepted: 17 July 2025 / Published: 23 July 2025
(This article belongs to the Section Health, Well-Being and Sustainability)

Abstract

Grassland communities consist primarily of perennial herbaceous species, with grasses forming a dominant or significant component. These ecosystems have been utilised for economic purposes since the earliest periods of human history. In the natural environment, they fulfil numerous critical functions that, despite increasing awareness of climate change, often remain undervalued. Grasslands contribute directly to climate regulation, air purification, soil conservation, flood mitigation, and public health—all of which positively affect the well-being of nearby populations. Moreover, they satisfy higher-order human needs known as “cultural” services, providing aesthetic enjoyment and recreational opportunities. These services, in tangible terms, support the development of rural tourism. The objective of this study was to examine the perception of cultural ecosystem services provided by different types of grassland communities—meadows, pastures, and lawns. The study employed a structured questionnaire to evaluate the perceived significance and functions of these communities. Respondents assessed their aesthetic and recreational value based on land-use type. To quantify these dimensions, the study applies the Recreational and Leisure Attractiveness Index (RLAI), the Aesthetic Attractiveness Index (AAI), ranking methods, and contingent valuation techniques. Based on the respondents’ declared WTP (willingness to pay) and WTA (willingness to accept) values, statistically significant differences in the perceived value of land-use types were identified. Lawns were rated highest in terms of recreational attractiveness, meadows in terms of aesthetics, while pastures achieved the highest economic values. Significant differences were also observed depending on respondents’ place of residence and academic background. The results indicate that the valuation of cultural services encompasses both functional and psychological aspects and should be integrated into local land-use and landscape planning policies.

1. Introduction

Grassland communities are composed of numerous perennial herbaceous species, with grasses either dominating or comprising a substantial share. These ecosystems have long served human livelihoods and continue to do so. Beyond their economic utility, they provide a wide array of ecological functions that should be increasingly appreciated in the context of ongoing climate change [1,2]. Through climate regulation, air quality improvement, soil protection, flood mitigation, and health-enhancing properties, grasslands exert a direct influence on the well-being of those living nearby. They also fulfil intrinsic human needs for cultural experiences—intangible benefits that include aesthetic appreciation and recreational satisfaction [3,4], as well as opportunities for leisure and tourism development in rural areas [5].
Landscape plays a critical role in stimulating such development and represents a fundamental aspect of quality of life, particularly in rural areas [6]. However, these landscapes are predominantly agricultural and increasingly marked by uniformity due to the widespread adoption of monoculture farming—globally limited to a few dominant crop species [7]. In contrast, species-rich grassland communities, along with the presence of diverse animal populations, enrich and harmonise the visual landscape, offering significant ecological and aesthetic value. Their diversity and natural appeal help foster scenic beauty, support biodiversity, and exert calming psychological effects on humans [8,9].
Despite these benefits, the landscape and tourism potential of meadows and pastures remain underappreciated, particularly with regard to their ability to provide local recreational opportunities. This undervaluation contributes to the underestimation of rural tourism potential. Limited-service availability, constrained financial resources in rural households, and relatively low demand for these services suggest that tourism’s economic role in rural areas—except in established tourist destinations—remains modest [10].
Recognising the features that enhance the aesthetic and scenic value of meadows and pastures can support more informed land-use planning, aimed at increasing visual diversity and the overall attractiveness of these landscapes [5]. However, this relationship is still not widely recognised, as most ecosystem benefits are accessed by people unconsciously—a consequence of incomplete valuation and limited societal awareness [8,11,12]. Even at the classification stage, cultural ecosystem services are often difficult to define and are frequently described in vague or imprecise terms [6].
Cultural ecosystem services are defined as the intangible benefits people derive from ecosystems, which are essential for community well-being and directly affect quality of life [13]. These services are now the subject of growing interest among researchers and policymakers engaged in spatial planning (GP) at various levels—from European institutions to national and regional authorities [6,14]. Yet, the concept of ecosystem services remains relatively unfamiliar to decision-makers and public administrators, particularly at the local level—where many crucial land management decisions, including those concerning grasslands, are made [8,15].
Visualised data on the biophysical and economic value of grassland services not only illuminate the loss of valuable natural capital but also offer a rational basis for leveraging its ecological, aesthetic, and recreational potential [11,16,17,18]. Such data can be generated through the assessment and valuation of cultural ecosystem services [3,5,8,9].
Despite numerous studies on this topic, only a few address the identification, assessment, and valuation of cultural services of grasslands in Europe [8,15,19]. In Poland, this type of research is being undertaken for the first time.
The main objective of the study was to assess the perceived value of cultural ecosystem services, including the recreational and leisure attractiveness of various types of grassland communities (meadows, pastures, lawns), depending on the respondents’ professional background and place of residence. Additionally, the study aimed to estimate the monetary value of these services using the Contingent Valuation Method (CVM).
The research sought to answer the following research questions:
  • How are grassland communities perceived by respondents in terms of their capacity to provide cultural ecosystem services? Which types of services are most characteristic of these ecosystems?
  • Does the field of study (professional background) and place of residence influence respondents’ perception of ecosystem services provided by different types of grassland communities?
  • Which forms of grassland communities are perceived by respondents from different study fields as the most attractive for recreation and leisure, and which are associated with the aesthetics of the surroundings?
  • What natural and landscape features are considered most important in the context of recreation, leisure, and aesthetic value of the environment?
  • Are there significant differences in the declared monetary values (WTP—willingness to pay/WTA—willingness to accept) for different forms of grassland communities depending on the field of study and place of residence?
  • Which type of grassland community has the highest cultural ecosystem service valuation per area unit in the Lublin Voivodeship?
The following research hypotheses were formulated:
H1: Respondents perceive grassland communities as an important source of cultural ecosystem services, with the most frequently indicated being recreational and leisure benefits, aesthetic values, community engagement, serving as a background for other plants, and spiritual experiences.
H2: The perception of ecosystem services provided by different forms of grassland communities is significantly influenced by the respondent’s field of study and place of residence.
H3: According to respondents (regardless of field of study), lawns are perceived as the most attractive for recreation and leisure, while meadows are considered most beneficial in terms of improving the aesthetics of the surroundings.
H4: Air quality, tranquillity, and oxygen production are perceived as the most important natural features of selected grassland communities for recreation and leisure, while scenic landscapes and greenery of the surroundings are seen as key elements of aesthetic value.
H5: There are statistically significant differences in declared WTP and WTA amounts among students of different fields of study for the same grassland communities.
H6: Meadows have the highest total valuation of cultural ecosystem services (WTP + WTA) per unit area in the Lublin Voivodeship.

2. Materials and Methods

The study focuses on selected forms of grassland communities (GC), and the subject of quantification involves selected indicators of recreational and leisure services—understood as physical and intellectual interactions as defined under the cultural services section of the CICES classification [11]. The GC types were categorised by land-use form into the following: mowing (meadows), grazing (pastures), mixed mowing–grazing, short-term rotational use on arable land, and lawns.
To assess the cultural ecosystem services provided by these grasslands, a survey was conducted between 2020 and 2023 using a structured questionnaire [20]. The survey targeted a randomly selected group of students from the University of Life Sciences in Lublin. This group was chosen based on the assumption that they would have greater awareness of ecosystem services and the multifunctionality of GC compared to the general population. Only respondents residing in the Lubelskie Province were included in the final analysis (questionnaires from other regions were excluded).
Out of 350 questionnaires distributed, 275 were returned, and 250 met the eligibility criteria after filtering. These 250 respondents represented four fields of study related to rural and environmental space, in approximately equal numbers, i.e., spatial planning (SP)—30% (75 respondents), agriculture (A)—25% (63 respondents), landscaping (L)—25% (62 respondents), and animal science (AS)—20% (50 respondents).
The majority of respondents came from rural areas, while the share of students from urban environments varied by field as follows: L—45%, SP—30%, AS—15%, and A—10%.
The first section of the questionnaire explained the study’s objectives, its nature, and the identity of the researchers. It also defined cultural ecosystem services and described GC. The second section included multiple-choice questions addressing opinions on the environmental and economic importance of GC, their functions and ecosystem services, as well as the significance and attractiveness of natural and landscape values in the context of recreation, leisure, and visual aesthetics—all considered in relation to land-use form.
To estimate the monetary value of these services, respondents were asked about their willingness to pay (WTP) for the continued provision of green space services and the compensation (WTA) they would expect in the event of their limitation. The third section of the questionnaire collected demographic information on the following categories: gender, age, place of residence, and field of study.
The data collected (each land-use form was evaluated individually) were analysed further. Responses related to the following aspects were ranked as follows:
  • The ecological and economic importance of different GC land-use forms;
  • The functions and ecosystem services provided by GC;
  • The natural and scenic values of GC important for cultural services in recreation and leisure;
  • The aesthetic contribution of GC to the surrounding landscape;
Ranking analysis was used to assess these responses. The recreational and leisure attractiveness of grassland communities, as rated by respondents, was assessed using a four-point scale: very attractive, moderately attractive, slightly attractive, and unattractive. In turn, the perceived importance of natural features of grassland communities—considered by respondents as particularly valuable for recreation, leisure, or aesthetics—was evaluated on a three-point scale: neutral, valuable, and very valuable.
In contrast, responses concerning:
5.
Respondents’ willingness to pay for benefits provided by GC;
6.
The compensation they would expect for the reduction or loss of such benefits, were analysed using the contingent valuation method [21].
To evaluate the recreational and aesthetic attractiveness of GC, respondents rated natural and scenic features. Key natural attributes considered included as follows:
Air quality (cleanliness, scent);
High air humidity;
Temperature regulation of soil and air;
Oxygen production and CO2 absorption;
Air sterilisation properties;
Improvement of surface water quality and availability;
Silence and tranquillity;
Rich flora and fauna;
Terrain relief, openness, sunlight, and shaded areas.
On the other hand, landscape features assessed included as follows:
Scenic beauty;
Proximity to water bodies;
Green-dominant surroundings;
Varied terrain relief;
Expansive flatlands;
Mixed land-uses;
Presence of water reservoirs;
Traditional usage (grazing animals, haystacks);
Modern usage (baled hay);
Floral diversity (blooming plants);
Wetlands (river valleys, swamps, peat bogs).
Based on the percentage distribution of responses provided by respondents (Rs), who assigned a given grassland type a specific rank of recreational/leisure or aesthetic attractiveness (based on the mean score derived from the aforementioned evaluation criteria), corresponding indices were developed for different land-use forms: Recreational and Leisure Attractiveness Index (RLAI) and Aesthetic Attractiveness Index (AAI) values were calculated (Formula (1)).
Formula (1). Recreational and Leisure Attractiveness Index (RLAI) for recreation/leisure value (own study, [22]).
RLAI/AAI = Rsa + Rsb/2
where
RLAI/AAI is the attractiveness index for recreation/leisure or aesthetic value;
Rsa is the percentage of respondents assigning the highest rank;
Rsb is the percentage assigning the middle rank.
To ensure comparability across land-use types, RLAI and AAI values were normalised using the min–max method. The method involves a linear transformation of the original data, resulting in a 0–1 scale (0 is the minimum value and 1 is the maximum value (Formula (2)).
Formula (2). Normalised Recreational and Leisure Attractiveness Index (RLAI) for recreation/leisure value (own study, [22])
RLAI’!/AAI’! = RLAI/AAI – (RLAImin/RLAImax)/(AAImin/AAImax) − RLAImin/AAImin
where
RLAI!/AAI! is the normalised value of the recreational/aesthetic attractiveness index of grassland communities;
RLAI/AAI is the attractiveness index for recreation/leisure or aesthetic value of grassland communities expressed on a point scale;
RLAImin/RLAImin is the minimum value of RLAI/AAI in a study sample;
RLAImax/RLAImax is the maximum value of RLAI/AAI in a study sample.
To monetize cultural services of GC, the contingent valuation method (CVM) was used, which is the only one that estimates value based on respondents’ hypothetical preferences in a simulated market [21]. Respondents indicated the amount they would be willing to pay (WTP) to prevent the degradation of GC and preserve their recreational and aesthetic benefits (which constitute a group of cultural benefits), or the amount they are willing to accept (WTA) as compensation for losing access to these services. Please note that a WTP-type question helps estimate the value of ecological projects and environmental gains, while a WTA-type question is used to estimate the losses incurred in the ecosystem.
The survey questionnaire indicated different forms of use: grassland, pasture and lawns, and offered five monetary ranges of an annual amount that the respondent would be willing to pay (WTP) or accept as compensation (WTA):
These brackets corresponded to the following: under EUR 4.67·ha−1, EUR 4.91–EUR 11.68·ha−1, EUR 11.92–EUR 23.36·ha−1, EUR 23.60–EUR 35.05·ha−1, and over EUR 35.28 ha−1 per hectare, respectively (exchange rate: 1 Euro = 4.28 PLN, [23]). NBP Table 077/A/NBP/2025 dated 22 April 2025).
A total of 250 survey respondents in various fields of study selected their preferred range for each GC type. Based on the sum of the declared amounts assigned to each form of land cover, it was possible to determine the total value of cultural ecosystem services.
To compare the distribution of indications of the values, assigned to each indicator (WTP, WTA), the χ2 test was used.
The estimated values for WTP/WTA were calculated as follows:
WTP / WTA   =   k ¯ × n ,
where
k ¯ is the amount selected from the survey range that the respondent is willing to pay for ecosystem services and/or accept as compensation for the loss or hindrance of access to grassland community services (Table 1);
n is the number of respondents who selected a value from the range.
To calculate the average annual value per respondent, the total WTP and WTA for each grassland type were divided by the number of value selections (i.e., frequency of indications within each monetary range) for a given field of study (professional profile of the respondents) (Table 1).
WTP/m, WTA/m
where
m is the number of survey respondents.
To estimate the total value of cultural services, the sum of all individual WTP and WTA values across land-use forms was calculated. These aggregate values were then multiplied by the estimated surface area (see Table 1) of each grassland form and extrapolated to the entire Lubelskie Province [24,25]. Estimated surface area of analysed grassland forms in Lubelskie Province: meadows: 170,777 ha, pastures: 85,388 ha and lawns: 40,128 ha.
In order to assess differences in the perception of cultural ecosystem services provided by grassland communities (meadows, pastures, and lawns), the survey data were subjected to statistical analysis using a range of methods, including the chi-square test of independence, linear regression analysis, one-way analysis of variance (ANOVA), Student’s t-test, and Tukey’s post hoc test.
The chi-square test was used to examine whether there were statistically significant differences among students from different academic disciplines in assigning WTP and WTA values to particular types of land-use. It was also applied to determine whether respondents within each academic group differentiated the values attributed to various types of grassland.
Linear regression analysis was conducted to further explore the influence of socio-demographic factors—such as field of study and place of residence—on the perceived value of cultural ecosystem services. The regression models included these independent variables to identify their effect on the declared WTP and WTA values.
Additionally, one-way ANOVA was employed to test for statistically significant differences in mean WTP and WTA values across the three types of grassland ecosystems. Where significant differences were detected, pairwise comparisons were performed using Student’s t-test, and multiple group comparisons were carried out with Tukey’s post hoc test to determine which specific groups differed significantly.
All statistical analyses were conducted using Dell Statistica software, version 13.1.

3. Results

3.1. Evaluation of Recreational and Leisure Attractiveness

Survey results indicated that nearly all respondents were familiar with grassland communities used as meadows, pastures, or lawns. A smaller proportion reported familiarity with mixed mowing-grazing systems, ranging from 10% among students of landscaping (L) to 80% among students of agriculture (A). The least recognised were short-term rotational grasslands, with familiarity ranging from just 2% (L students) to 98% (A students), highlighting the influence of vocational education on the understanding of specialised terminology related to agriculturally managed grassland types [26,27].
Based on respondents’ knowledge, only the most widely recognised types—meadows, pastures, and lawns—were selected for further analysis in order to ensure a more objective assessment. Students in A and animal science (AS) unanimously indicated that meadows held the highest ecological and economic value. Meanwhile, students from spatial planning (SP) and L placed greater importance on lawns and pastures in this regard (Figure 1). A notable share of responses indicated moderate to low importance across all grassland types, with isolated cases where lawns and pastures were viewed as unimportant.
When asked about the ecosystem services provided by these communities, respondents identified provisioning, regulating and maintenance, and cultural services (Figure 2). Regardless of academic background, provisioning services were primarily attributed to meadows and pastures—over 70% and 60% of responses, respectively—based on their role in supplying forage for herbivores.
Respondents also emphasised regulating services, assigning the greatest value to lawns (over 60%), followed by meadows (~60%) and pastures (~50%). Specific services mentioned included stormwater purification, provision of habitats for flora and fauna, and protection against extreme weather events. Cultural services were most frequently associated with lawns (an average of 91% of responses), followed by meadows (~36%) and pastures (~32%). Analysing responses by academic field reveals that students in agricultural disciplines (A and AS) primarily attributed provisioning services to meadows and pastures. Interestingly, 50% of A students also assigned provisioning functions to lawns. The same group (~60%) recognised regulating and maintenance services across all grassland types at comparable levels.
By contrast, SP and L students showed different patterns. Among these respondents (60–70%), meadows were considered to provide all service categories equally. Pastures were only marginally more associated with provisioning services than with regulating or cultural ones. Notably, about 90% of students in SP and L associated lawns with cultural services. Moreover, 80% of L students and 60% of SP students also perceived lawns as providers of regulating services. Only 20–25% of these students linked lawns to provisioning services.
Focusing specifically on cultural ecosystem services, respondents overwhelmingly identified lawns as the primary providers (average > 90%), followed by meadows (average 36%) and pastures (approx. 32%) (Figure 3). Among the cultural services listed—regardless of grassland type—recreation and leisure, as well as the activation of socially excluded groups (e.g., unemployed or elderly individuals), were most frequently cited. This was followed by aesthetic experiences and spiritual enrichment. Other noted benefits included mental well-being, stress relief, and the creation of attractive visual backgrounds for showcasing other plant species. According to respondents, lawns encompassed all of these cultural services, while meadows and pastures were rated slightly lower—with the exception that meadows were not frequently associated with social activation, and pastures were less often considered ideal for highlighting ornamental flora.
Chi-square test results indicated that, within each academic discipline, the differences in assessments of the various types of grassland communities were statistically significant (p < 0.001), demonstrating a diverse perception of their recreational value. Students of Landscape Architecture (L) and Spatial Planning (SP) significantly more often rated lawns as “very attractive,” while meadows and pastures received comparatively lower ratings. Conversely, students of Agriculture (A) and Animal Science (AS) more frequently considered meadows and pastures to be attractive. However, the difference between these two groups was not statistically significant (p = 0.21). In contrast, statistically significant differences were observed between A and SP (p = 0.001), A and L (p < 0.001), AS and SP (p = 0.018), and AS and L (p < 0.001), suggesting that students from environmentally and technically oriented programmes may perceive the recreational value of grassland landscapes differently than those from spatial and landscape-oriented disciplines. In terms of overall recreational and leisure attractiveness, lawns ranked highest (Figure 4). Over 70% of respondents rated them as very attractive, and more than 10% as moderately attractive. Over 50% of respondents viewed meadows as very or moderately attractive, while fewer than 40% gave such ratings to pastures. Notably, 40% of respondents found pastures to be of low recreational value.
Respondents’ answers indicate that the vast majority of natural values were considered important or very important in the context of recreation and leisure. Particularly high ratings were given to air quality, oxygen production, silence and tranquillity, water quality improvement, and plant biodiversity. Conversely, the regulation of soil and air temperature (approx. 80% rated as indifferent), the sterilising properties of the atmosphere (approx. 40%), and the availability of surface water, animal diversity, and landform diversity (approx. 25%) were most frequently regarded as insignificant. Approximately 20% of respondents did not recognise the recreational relevance of extensive shaded areas.
When analysed by academic field, the differences were modest: between 40% and 42% of students considered natural values important, and between 37% (agriculture students) and 41% (landscape architecture students) rated them as very important (Figure 5). The highest level of indifference was noted among spatial planning students (24%), and the lowest among landscape architecture students (approx. 17%).
In evaluating landscape values, features most frequently recognised as particularly valuable included scenic beauty and proximity to surface water. These were followed by diversified topography, various land-use practices, and the presence of traditional agricultural landscapes. Interestingly, over 30% of respondents rated wetlands, marshes, and river floodplains as unattractive, which contrasts with the commonly held perception of their ecological appeal. Modern agricultural landscapes (e.g., baled hay) and vast flat areas were also rated lowest in terms of aesthetic value.
Discipline-specific variation in landscape value assessments was also evident. As many as 25% of agriculture and animal science students and 20% of spatial planning students viewed these values as indifferent, compared to only 10% among landscape architecture students (Figure 6). Meanwhile, more than 40% of students from all fields rated the landscape values as important. Landscape architecture students stood out with the highest share (45%) considering them “very important,” exceeding the 30–35% observed in other study groups.
These assessments are consistent with the calculated indices of recreational and aesthetic attractiveness (RLAI and AAI). Lawns scored the highest in recreational attractiveness (RLAI: 44 points), followed by meadows (27 points) and pastures (21 points). After normalisation, lawns reached the maximum value of 1.00, while meadows and pastures scored 0.34 and 0.11, respectively (Table 2). In contrast, aesthetic attractiveness was rated highest for meadows (AAI: 26.36), followed by pastures (23.46), with lawns receiving the lowest score (9.06).

3.2. Estimated Monetary Valuation of Cultural Ecosystem Services

Based on survey data, the percentage distribution of respondents’ answers was presented for three types of land-use: meadows, pastures, and lawns, in terms of declared WTP (willingness to pay)—the amount respondents were willing to pay to preserve grassland ecosystems—and WTA (willingness to accept)—the amount of annual compensation they would accept for restricted access to ecosystem services (Figure 7). The analysis shows that the highest proportion of respondents declared a WTP in the range of EUR 4.91–11.68, particularly for lawns (39.75%) and meadows (40.75%). The second most frequently selected range was the lowest one (<EUR 4.67), especially for meadows (35%). High WTP values (>EUR 23.60) were declared by a relatively small number of respondents—less than 12% for both pastures and lawns. In terms of WTA, the majority of responses fell within the EUR 4.91–11.68 and EUR 11.92–23.36 ranges—particularly for pastures (32.5%) and lawns (39.25%). For meadows, the most frequently selected WTA category was again the lowest (<EUR 4.67), indicated by 42.5% of respondents. Higher compensation values (>EUR 23.60) were rarely accepted.
When recalculated on a per person basis, the highest average WTP for access to grassland communities was recorded among landscaping (L) students (Table 3), who declared they would pay EUR 27.10 annually to use lawns. This group also assigned the highest value to meadows (WTP—EUR 17.06). Interestingly, for pastures, the highest WTP was reported by agriculture (A) students (WTP—EUR 23.60).
Among the professional groups surveyed, animal science (AS) students reported the lowest WTP values for the cultural services provided by grassland communities.
In terms of compensation expectations (WTA), L students again declared the highest value, specifically for lawns (WTA—EUR 28.04). For pastures, the highest compensation was requested by A students (WTA—EUR 26.87). When access to meadows was restricted, AS students expected the highest compensation (WTA—EUR 15.89).
A chi-square test (χ2) was conducted to determine whether there were statistically significant differences in how students from different academic fields assigned WTP and WTA values to specific grassland types.
For meadows and lawns, the test showed no significant differences between fields of study in the values assigned to WTP or WTA (Table 4). However, in the case of pastures, a significant difference emerged for WTP only—with agriculture (A) students assigning significantly higher values, and landscaping (L) students assigning lower ones.
The chi-square test was also applied to evaluate whether respondents within the same academic discipline (A or AS or SP or L) assigned significantly different WTP and WTA values depending on grassland type (Table 5).
The results indicated significant differences within all groups except for animal science (AS) students in terms of WTP, although their p-value was close to the threshold of significance (p = 0.085). This may be attributed to the smaller sample size in that group, which reduced statistical power. Nonetheless, for WTA, significant differences were found within all academic groups.
The results of the linear regression analysis identify the key factors that most strongly influenced the perceived value of cultural ecosystem services provided by different grassland types. The findings indicate that the respondents’ place of residence was a significant factor affecting their perception of these services. In the analysed models, individuals living in rural areas consistently reported lower WTP and WTA values than urban residents, which may reflect differences in green space accessibility or needs related to the living environment (Table 6).
Another important determinant was the field of study, particularly in relation to pasture and meadow ecosystems. Students enrolled in agriculture and animal science programmes tended to assign higher values—both in terms of willingness to pay (WTP) and willingness to accept compensation (WTA)—compared to the reference group (landscape architecture students), although not all coefficients reached statistical significance. The most notable and statistically significant differences were observed in WTA models for meadows and pastures, where the coefficients for these study programmes exceeded 30 units.
The highest model fit (R2 = 0.34) was obtained for the WTP model for lawns, suggesting that the included explanatory variables adequately account for variation in respondent declarations. For the remaining models, R2 values ranged between 0.21 and 0.26, indicating a moderate level of fit. Although the model for lawns did not yield statistically significant predictors, its overall fit implies that WTP values for lawns are more predictable based on the available data than those for other grassland types.
To calculate the total average value of cultural services, the WTP and WTA values declared by respondents were summed (Table 7). The calculated values indicate that, regardless of respondents’ professional background, pastures and lawns are valued more highly than meadows. The mean WTP (willingness to pay) for meadows is significantly lower compared to other land-use types, while the difference between pastures and lawns is not statistically significant. A similar trend was observed for WTA (willingness to accept): pastures were appraised most highly, with respondents demanding the greatest compensation for their loss. Meadows received the lowest valuations, while lawns were rated intermediately, perceived as more valuable than meadows but less than pastures. The mean values also reveal that respondents tended to place a slightly higher value on the loss of an ecosystem service (WTA—EUR 20.47·ha−1·yr−1) than on their willingness to pay for its availability (WTP—EUR 19.00·ha−1·yr−1). However, this phenomenon should not be interpreted solely as a standard result typical for contingent valuation studies. The higher WTA values observed in this study may reflect not only economic assessment but also underlying cultural, emotional, and psychological mechanisms—a phenomenon well-documented in environmental economics literature. With regard to the total cultural service value (WTP + WTA), pastures and lawns yield higher cumulative values than meadows, but also exhibit greater variability in responses, as indicated by standard deviation values. It is worth noting that the identical minimum and maximum values across all land-use types result from standardised monetary intervals used in the survey. This implies that the observed differences in WTP and WTA reflect actual respondent preferences rather than artefacts of the valuation scale design.
Using the contingent valuation method (CVM) and extrapolating based on the surface area of grassland types across the Lubelskie Province, the total annual monetary value of cultural ecosystem services was estimated.
The cumulative value of all services provided by meadows, pastures, and lawns in the region amounts to EUR 10,693,492.99 per year. The highest aggregate value was attributed to meadows, due to their greater total area, even though pastures had a higher per hectare valuation (Table 8).

4. Discussion

Grassland communities (GC) provide a wide range of ecosystem services, encompassing both provisioning and regulatory functions [11]. However, cultural services—particularly those related to recreation, leisure, aesthetics, and cultural heritage—represent a frequently overlooked yet essential component of their societal value [8]. The aim of this study was to explore this specific dimension in greater depth, with a focus on the spatial and landscape characteristics of meadows, pastures, and lawns. To assess their value, two methods were employed—ranking and the Contingent Valuation Method (CVM) based on survey questionnaires. The first method reflects individual preferences and cultural values, allows comparison of the relative importance of different cultural ecosystem services (CES), and is intuitive and simple—giving voice to users and local communities [27]. The second method is increasingly used in the valuation of intangible ecosystem services, as it captures subjective perceptions of the landscape. By applying WTP (willingness to pay) and WTA (willingness to accept), it was possible to estimate the perceived value of different types of grassland communities [28].
The study results reveal significant differences in perception depending on respondents’ academic disciplines and places of residence. Students of agricultural and animal science programmes demonstrated greater attachment to pastures and meadows, which can be attributed to their practical knowledge and professional experience. In contrast, students of landscape architecture and spatial planning rated lawns more highly, likely due to their visual and recreational functions. Such distinctions are consistent with previous findings by van den Berg et al. [29] and Gobster et al. [26]. Gobster et al. [26] noted perceptual differences between farmers and non-farmers regarding cultural landscapes—while the latter may appreciate the visual beauty of landscapes, for farmers, beauty is often associated with appropriate land management and a sense of order, reflected in tidy and well-maintained scenery as visible signs of being a “good farmer”.
Respondents living in rural areas declared significantly lower WTP (willingness to pay) and WTA (willingness to accept) values for the loss of access to these services compared to urban residents. These results align with previous studies suggesting that place of residence strongly influences the perception and valuation of ecosystem services—particularly cultural services, which are closely tied to emotions, accessibility, and lifestyle. For rural inhabitants, everyday access to green infrastructure may reduce the perceived scarcity—and, thus, the perceived value—of these services. Moreover, people may be less inclined to pay for something they consider a “natural given” or a “commons” in the rural context [27,30,31].
Recreational, leisure, and aesthetic preferences were also strongly linked to the structural and spatial features of the studied grassland types. Lawns—perceived as safe, clean, and accessible—received the highest ratings in terms of recreational and leisure value, particularly among urban residents. In contrast, meadows were rated highest for aesthetic value, due to their natural diversity and traditional rural landscape appeal. Lawns showed a clear contrast in assessments: high scores for recreational value but low for aesthetics. This likely results from their practical but visually monotonous character [26]. Lawns are seen as functional and accessible, yet visually uniform and artificial—especially when compared to more natural meadows or pastures. Conversely, landscape elements such as flowering meadows, ponds, or traditional pastures provide more visually stimulating features [5,6].
Lower aesthetic ratings of lawns may also stem from differing aesthetic expectations among respondents. For example, students in fields like landscape architecture or spatial planning may have more demanding visual criteria, resulting in lower aesthetic assessments of lawns. These observations align with previous studies [1], which highlight the divergence in spatial perception based on functional (practical) versus visual values.
When assessing the significance of natural and landscape features in the context of recreation and leisure, respondents particularly emphasised air quality and oxygen production, positive impacts on water quality, tranquillity, and plant biodiversity. These values align with findings from public health and well-being research. Twohig-Bennett and Jones [32], as well as Marselle et al. [33], demonstrated that semi-natural, species-rich grasslands positively contribute to stress reduction, cognitive development, and mitigation of depressive symptoms. Similarly, research conducted on grasslands and agricultural lands revealed that greater plant and bird species richness was associated with improved well-being among residents [34].
Surprisingly low values assigned in this study to wetlands—considered here as part of wet meadows—stand in partial contrast to the ecological literature, which emphasises their exceptional importance for biodiversity, water filtration, and hydrological balance [35,36,37]. It can be assumed that limited accessibility, dominant vegetation, or the perception of wetlands as “inconvenient” spaces may negatively affect their recreational and aesthetic appreciation, especially among individuals raised in urban environments [26]. Wild-looking areas, even when ecologically valuable, may be perceived as neglected or unsafe [38]. Therefore, further research is needed—particularly considering the role of landscape education and contact with nature.
Among aesthetic values, respondents appreciated environments dominated by greenery and beautiful, picturesque landscapes—especially meadows and pastures. Southon et al. [5] likewise noted that the decorative value of rural landscapes is primarily determined by species-rich permanent grasslands, which form colourful compositions changing with the seasons. Aesthetic impressions are further enhanced by structural diversity, such as medium and tall vegetation layers, which both meadows and pastures can provide. Their presence promotes recreational and leisure activity in attractive open areas, which in turn supports the development of local rural economies [11].
The lowest aesthetic value was assigned to areas managed with modern agricultural techniques (e.g., baled hay) and vast, flat terrains. The low aesthetic score of modern meadows and pastures stems not only from subjective preference but also from recognised scientific findings on landscape simplification accompanying agricultural intensification. Such simplification—through homogenization and reduction in visual diversity—diminishes agricultural landscapes that are rich in structure and elements. This is, therefore, not merely a matter of social taste; experts clearly recognise that landscape simplification leads to aesthetic impoverishment and ecological value loss [39].
Consequently, grassland communities (particularly meadows and pastures) play an essential role in enhancing otherwise monotonous agricultural landscapes, increasing not only their biocenotic value but also their aesthetic and recreational appeal [40]. However, aesthetic preferences are heavily influenced by personal experience—for instance, urban dwellers may perceive agricultural landscapes as “empty” or “uninteresting,” whereas others may regard them as carriers of identity, tranquillity, and naturalness [41]. Gunnarsson et al. [40] also indicate that both personal preferences and environmental features interact to shape place-specific human perceptions. Generally, a high level of objectively measured biodiversity tends to positively influence how people perceive a space [6].
The economic analysis confirmed that WTP values for meadows were significantly lower than those for pastures and lawns. Regarding WTA, the highest compensation expectations were declared for pastures, while again the lowest were for meadows. Although lawns and pastures achieved higher per-hectare values, meadows—due to their larger regional area—generated the highest total value of cultural ecosystem services. Particularly noteworthy were the high WTA values associated with pastures. When interpreted in the context of the literature, this suggests that pastures may be perceived not only as utilitarian assets. In terms of recreation and leisure, pastures offer more open space for activity, provide a sense of order and safety, and their shorter vegetation does not obstruct the horizon, which for many creates more pleasant aesthetic experiences [42]. In summary, although both pastures and meadows offer unique natural values, pastures appear to better support various forms of recreation and leisure—especially in the context of agritourism and active outdoor activities [43].
The estimated monetary value of cultural ecosystem services of grassland communities, assessed using the contingent valuation method, revealed that compensation values (WTA) were slightly higher than the willingness to pay (WTP). Classic interpretations of the discrepancy between WTP and WTA refer to the so-called endowment effect and loss aversion, which suggest that individuals value the loss of a good more than its acquisition. However, in the context of cultural ecosystem services, this asymmetry may also reflect deeper factors: emotional attachment, symbolic meaning, perceived control over space, or identity-related values [44]. Another possible explanation may be the generally low public awareness of the ecosystem service value provided by nature [17]. Therefore, the results should also inform environmental and planning education, serving as a useful tool in teaching landscape valuation, participatory design, and raising public awareness regarding the diversity and significance of grassland ecosystems [45].
It is important to note that the WTP/WTA values obtained in this study are considerably lower than those reported in other regional valuation studies [46,47]. Although this may be influenced by local economic conditions, the values observed are comparable to global averages estimated by Costanza et al. [35], de Groot et al. [48], or Křůmalová et al. [28]. This may indicate a particularly strong cultural embedding of grassland landscapes in local community consciousness, rendering them difficult to value in monetary terms. These findings are consistent with literature emphasising the relational and non-market values of landscapes, often overlooked in conventional economic assessments [44,49]. Therefore, actions aimed at improving species composition and diversity of grassland communities are justified not only for ecological purposes but also due to their cultural ecosystem service contributions. Combining recreational and aesthetic experiences with recognition of their ecological sources may shift perceptions and foster conservation efforts [17].
In the international literature, increasing attention is being paid to the complexity and ambiguity of the concept of cultural ecosystem services (CES). CES encompass recreational, aesthetic, spiritual, and identity-related values that are not only difficult to define but also elude conventional economic measurement tools [49,50]. This complexity is directly reflected in the findings of this study—particularly in the discrepancies between aesthetic and recreational evaluations of different types of green areas, as well as the marked variation in perception depending on respondents’ place of residence and experience.
There is a growing call for a relational approach to CES, emphasising social, emotional, and cultural ties rather than individual preferences expressed through willingness to pay [44,51]. This study’s results support such a perspective—lawns were rated as most attractive for recreation, yet respondents’ WTP values were moderate—likely reflecting the perception of these values as part of common heritage rather than market goods. These findings support the need for complementary valuation approaches that integrate both quantitative and qualitative methods. Quantitative results based on WTP and WTA indicate that respondents ascribed value not only to the functional aspects of green areas but also to landscapes with which they shared emotional or symbolic connections.
The findings of this study can also be interpreted as a contribution to the broader discourse on cultural ecosystem services. For instance, the strong dependency of perceived grassland value on life experience, field of study, and place of residence confirms the contextual nature of landscape perception. Similar patterns have been observed in Australia [52], Spain [30], and Southern Europe [27]. This suggests that identifying and evaluating CES requires a relational approach that considers local social values and emotional embeddedness in the landscape.
The results presented here are further supported by data from other European countries. Studies in the Netherlands and the United Kingdom have shown that well-maintained, mown, and accessible landscapes—such as lawns and pastures—are favoured both aesthetically and recreationally [1,5]. Similar trends were reported in Germany, where pastures received higher attractiveness ratings than extensive meadows [16]. Moreover, WTP levels for preserving open landscapes near cities—e.g., EUR 25/ha/year in Kuik’s [53] study—are comparable to those declared by respondents in the current research. This suggests that social perception and valuation of CES may exhibit universal traits, despite local landscape conditions.
This complexity also poses significant methodological challenges. While methods such as WTP and WTA are widely applied and useful for quantitative comparisons, they do not fully capture the emotional and identity-based aspects of human–landscape relationships. In our study, the relatively low WTP despite high declared use value highlights the need for further development of relational and qualitative tools. Future research on CES should pursue mixed-method approaches that integrate economic data with narrative, qualitative, and sociocultural analyses to capture the full spectrum of human–nature relationships [51,54,55].
The findings of this study also carry important practical implications—particularly for spatial, agricultural, and environmental policies. The variation in perceptions and values attributed to landscapes indicates that management strategies for green areas should be grounded in actual public preferences, considering both functional and cultural dimensions. This is particularly important in implementing payment for ecosystem services (PES) programmes, which—if they are to be effective and socially acceptable—must account for local values and expectations [56,57]. Cultural services, though not directly marketable, are a critical component of societal well-being and landscape identity and should be consistently integrated into spatial planning [58].
In conclusion, the study confirmed that the value of cultural ecosystem services is shaped both by specific landscape characteristics and by subjective socio-cultural conditions. Their integration into spatial planning may enhance the effectiveness and public acceptance of environmental protection measures, green infrastructure development, and the reinforcement of local identity. Future research should expand the scope to include regional comparisons (e.g., agricultural vs. tourist landscapes), seasonal variations in perception, and long-term approaches that capture the evolution of ecosystem service perception and valuation over time.

5. Conclusions

In relation to the stated research objectives and hypotheses, the study allows for the formulation of the following conclusions:
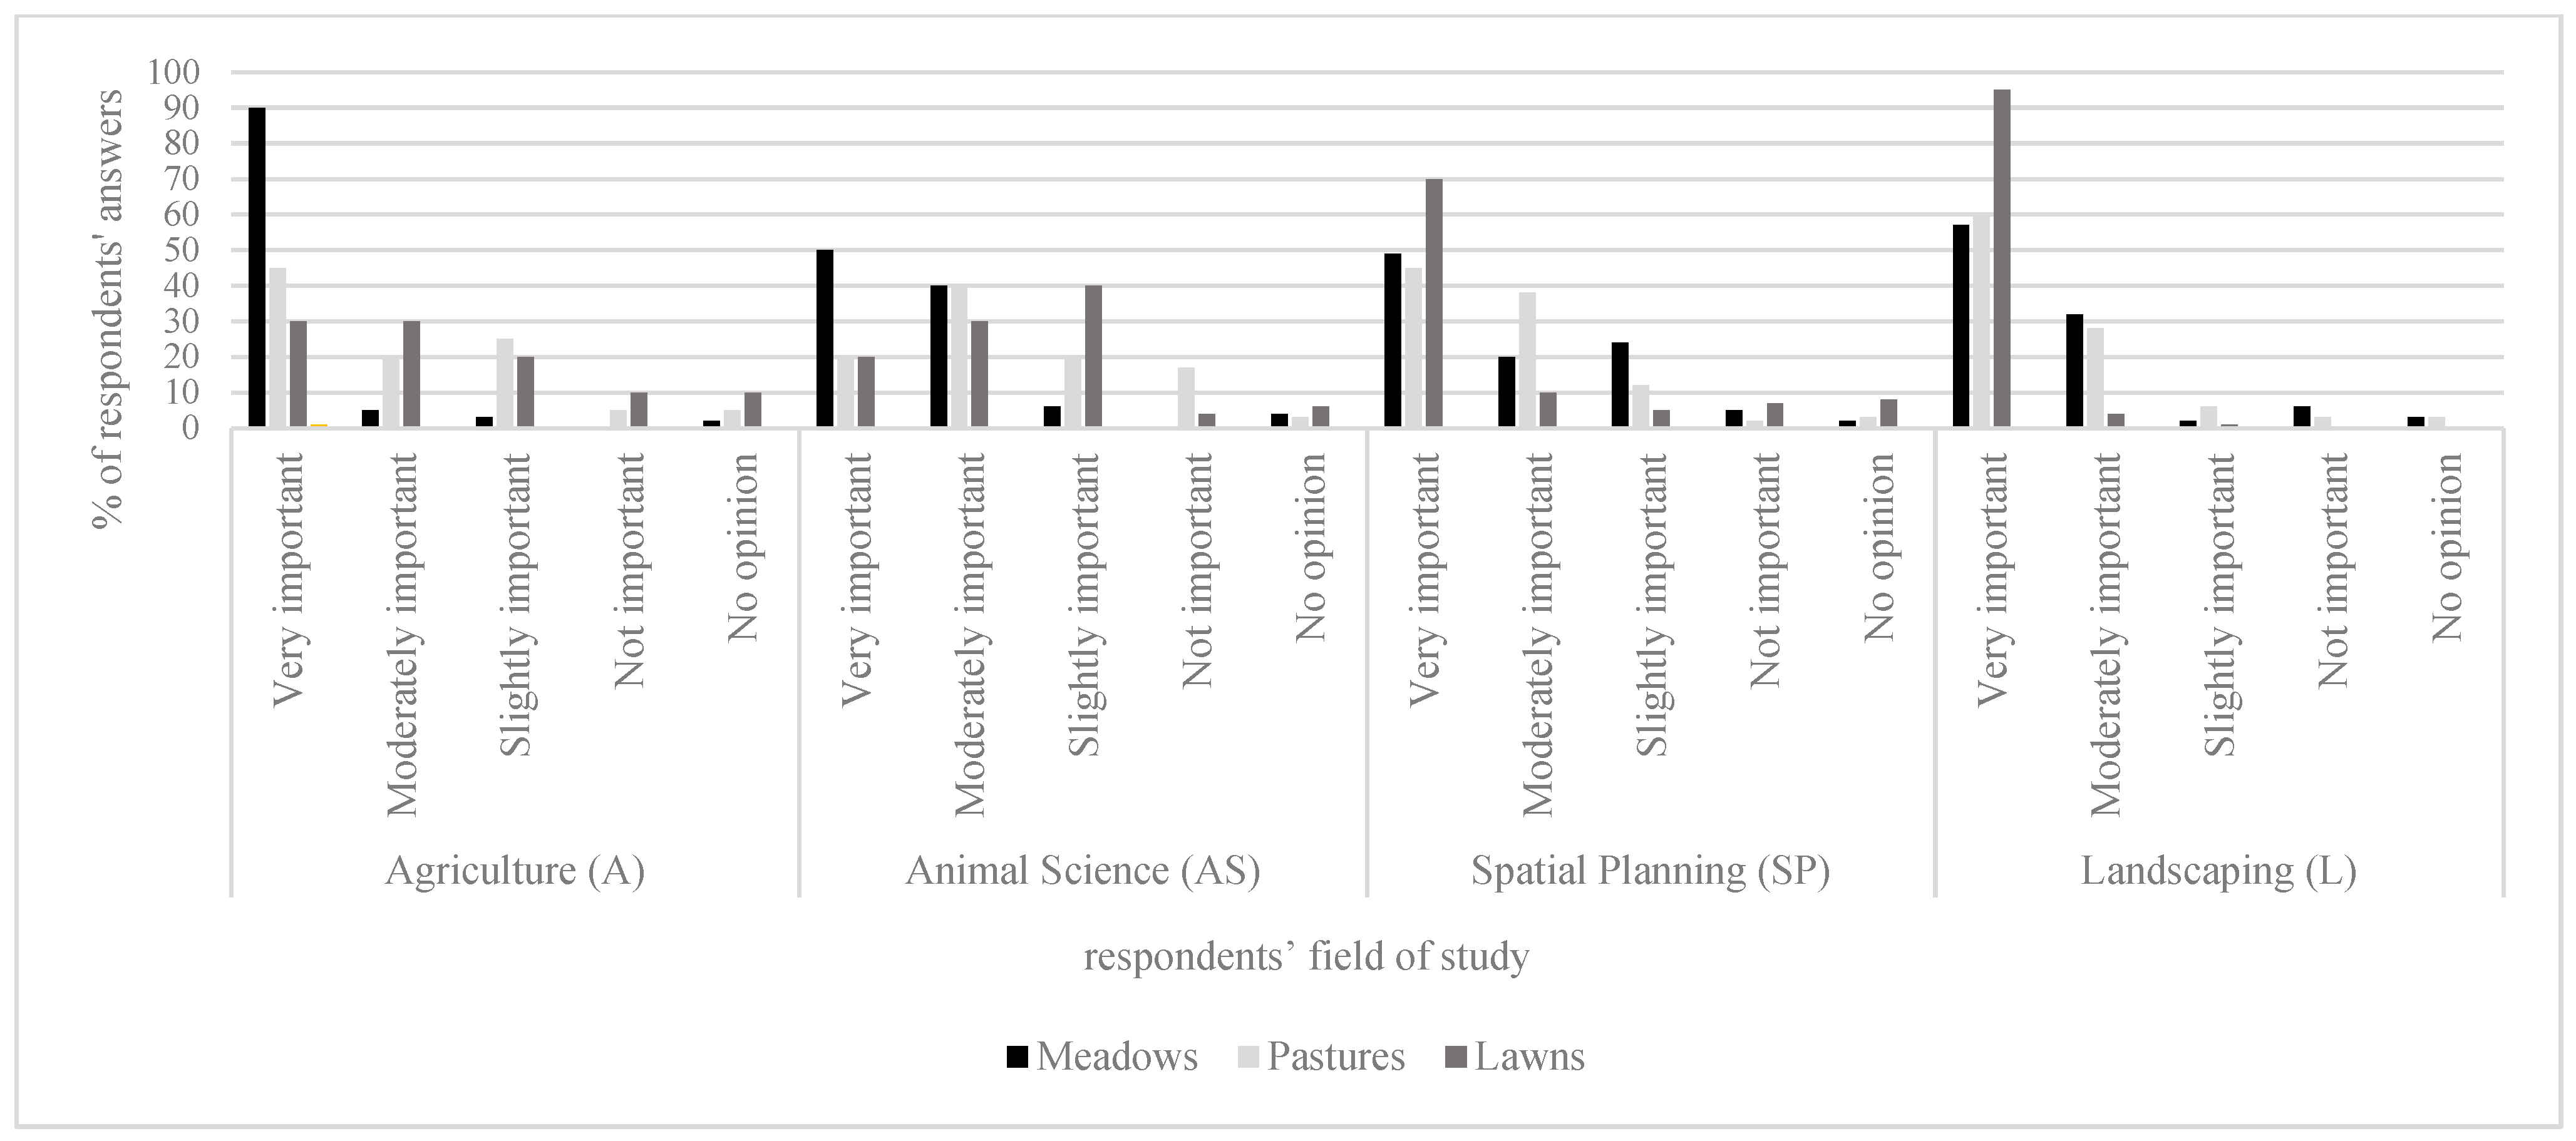
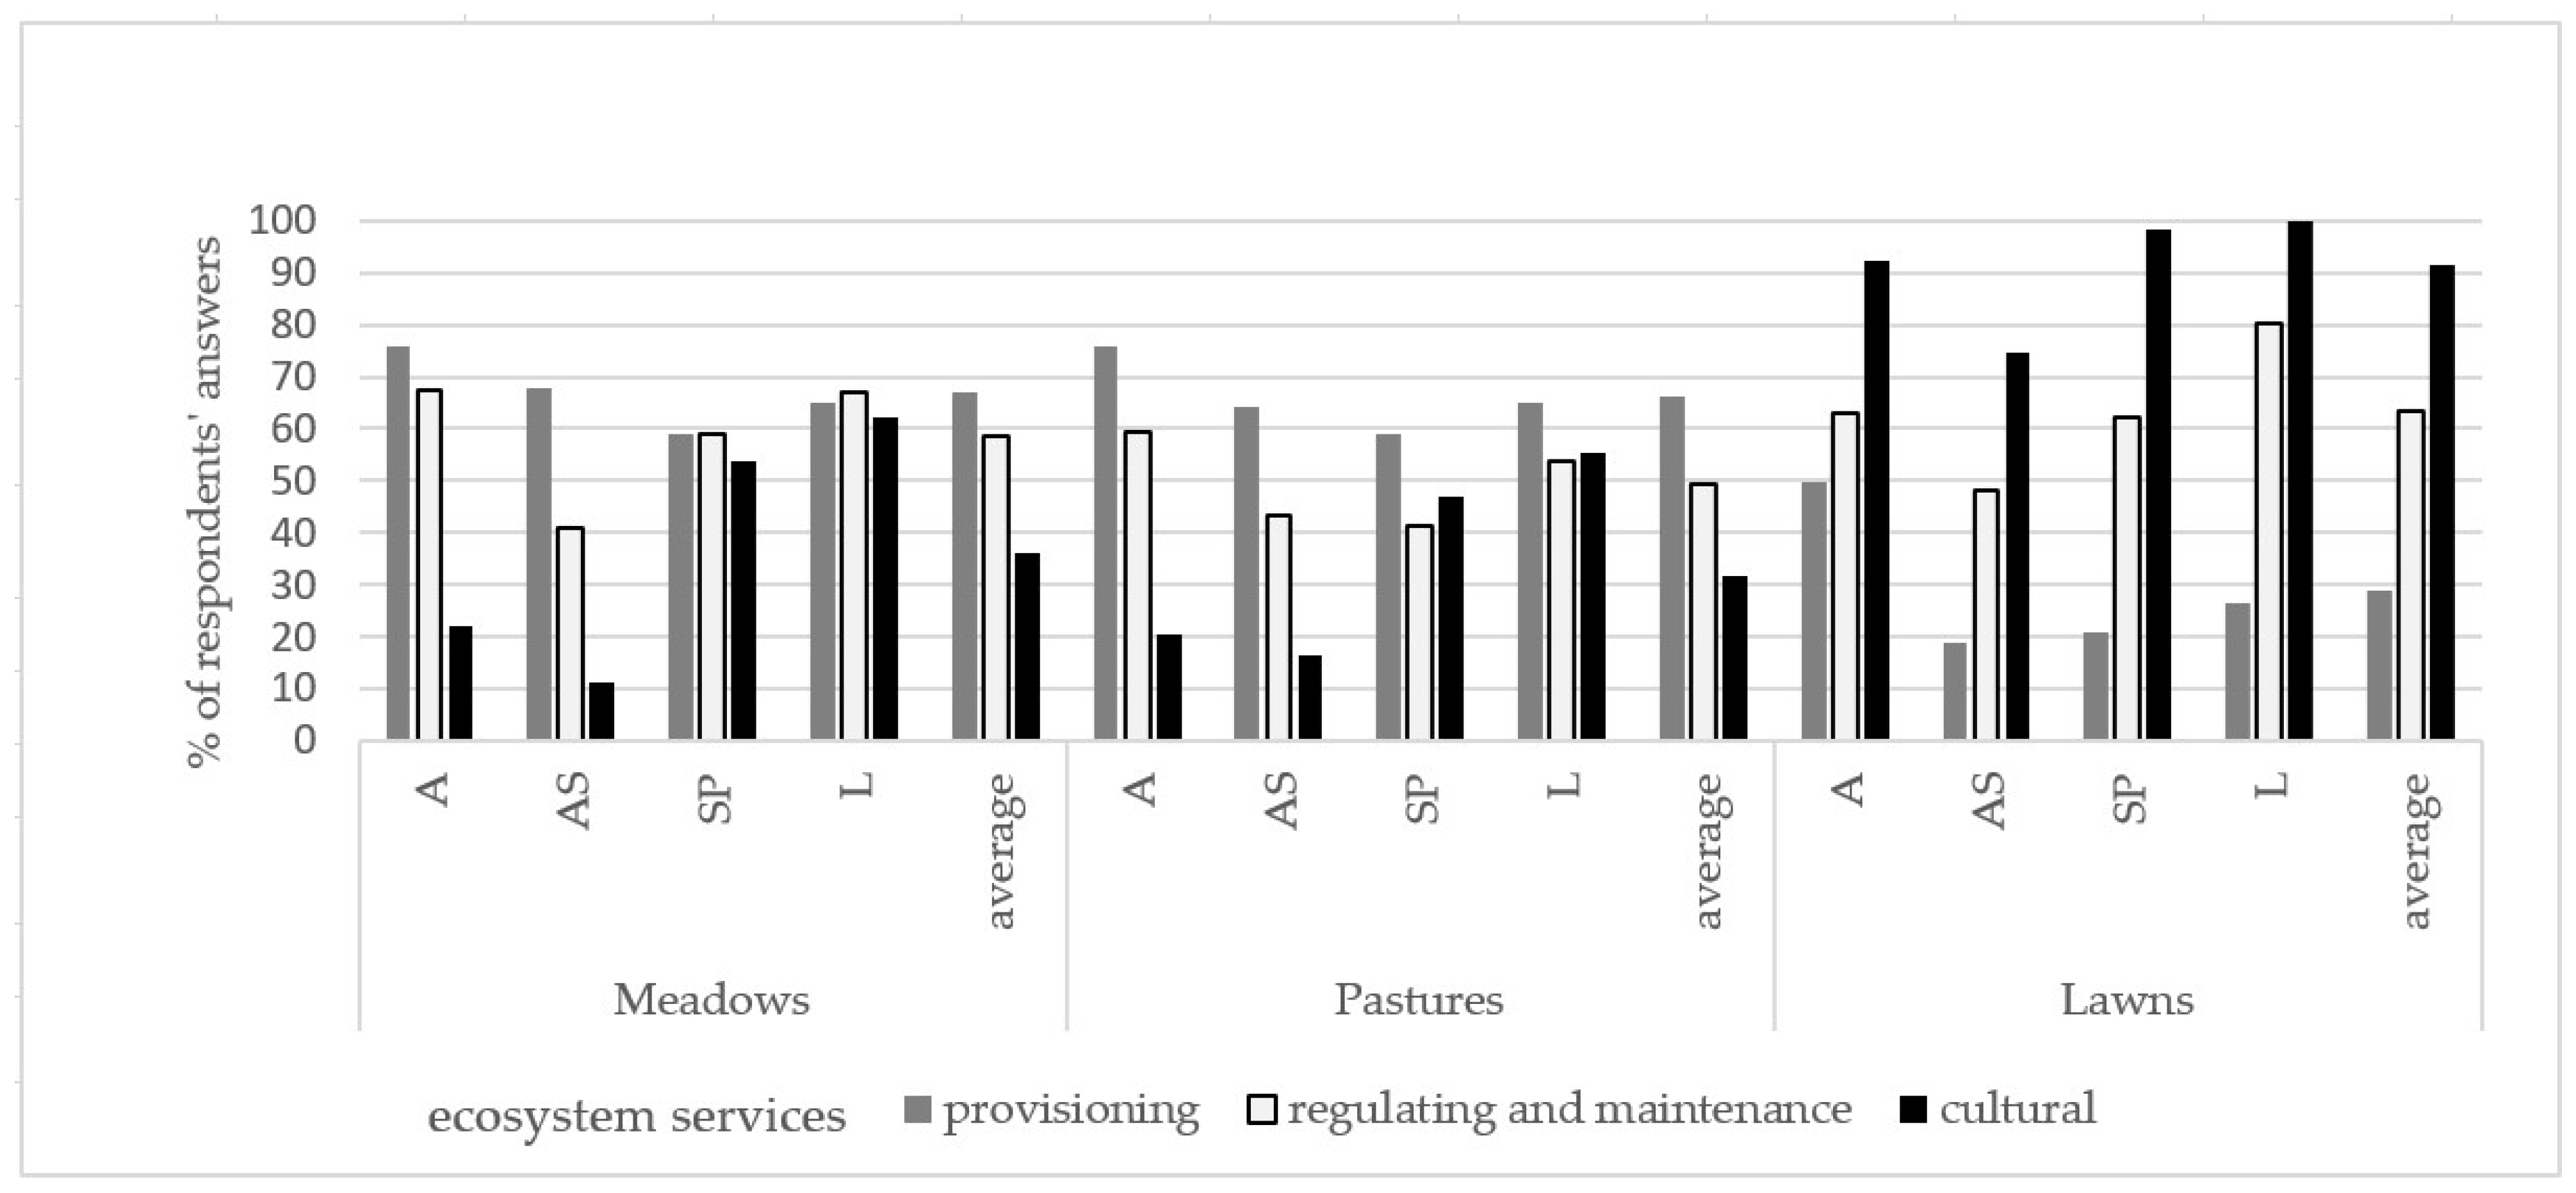
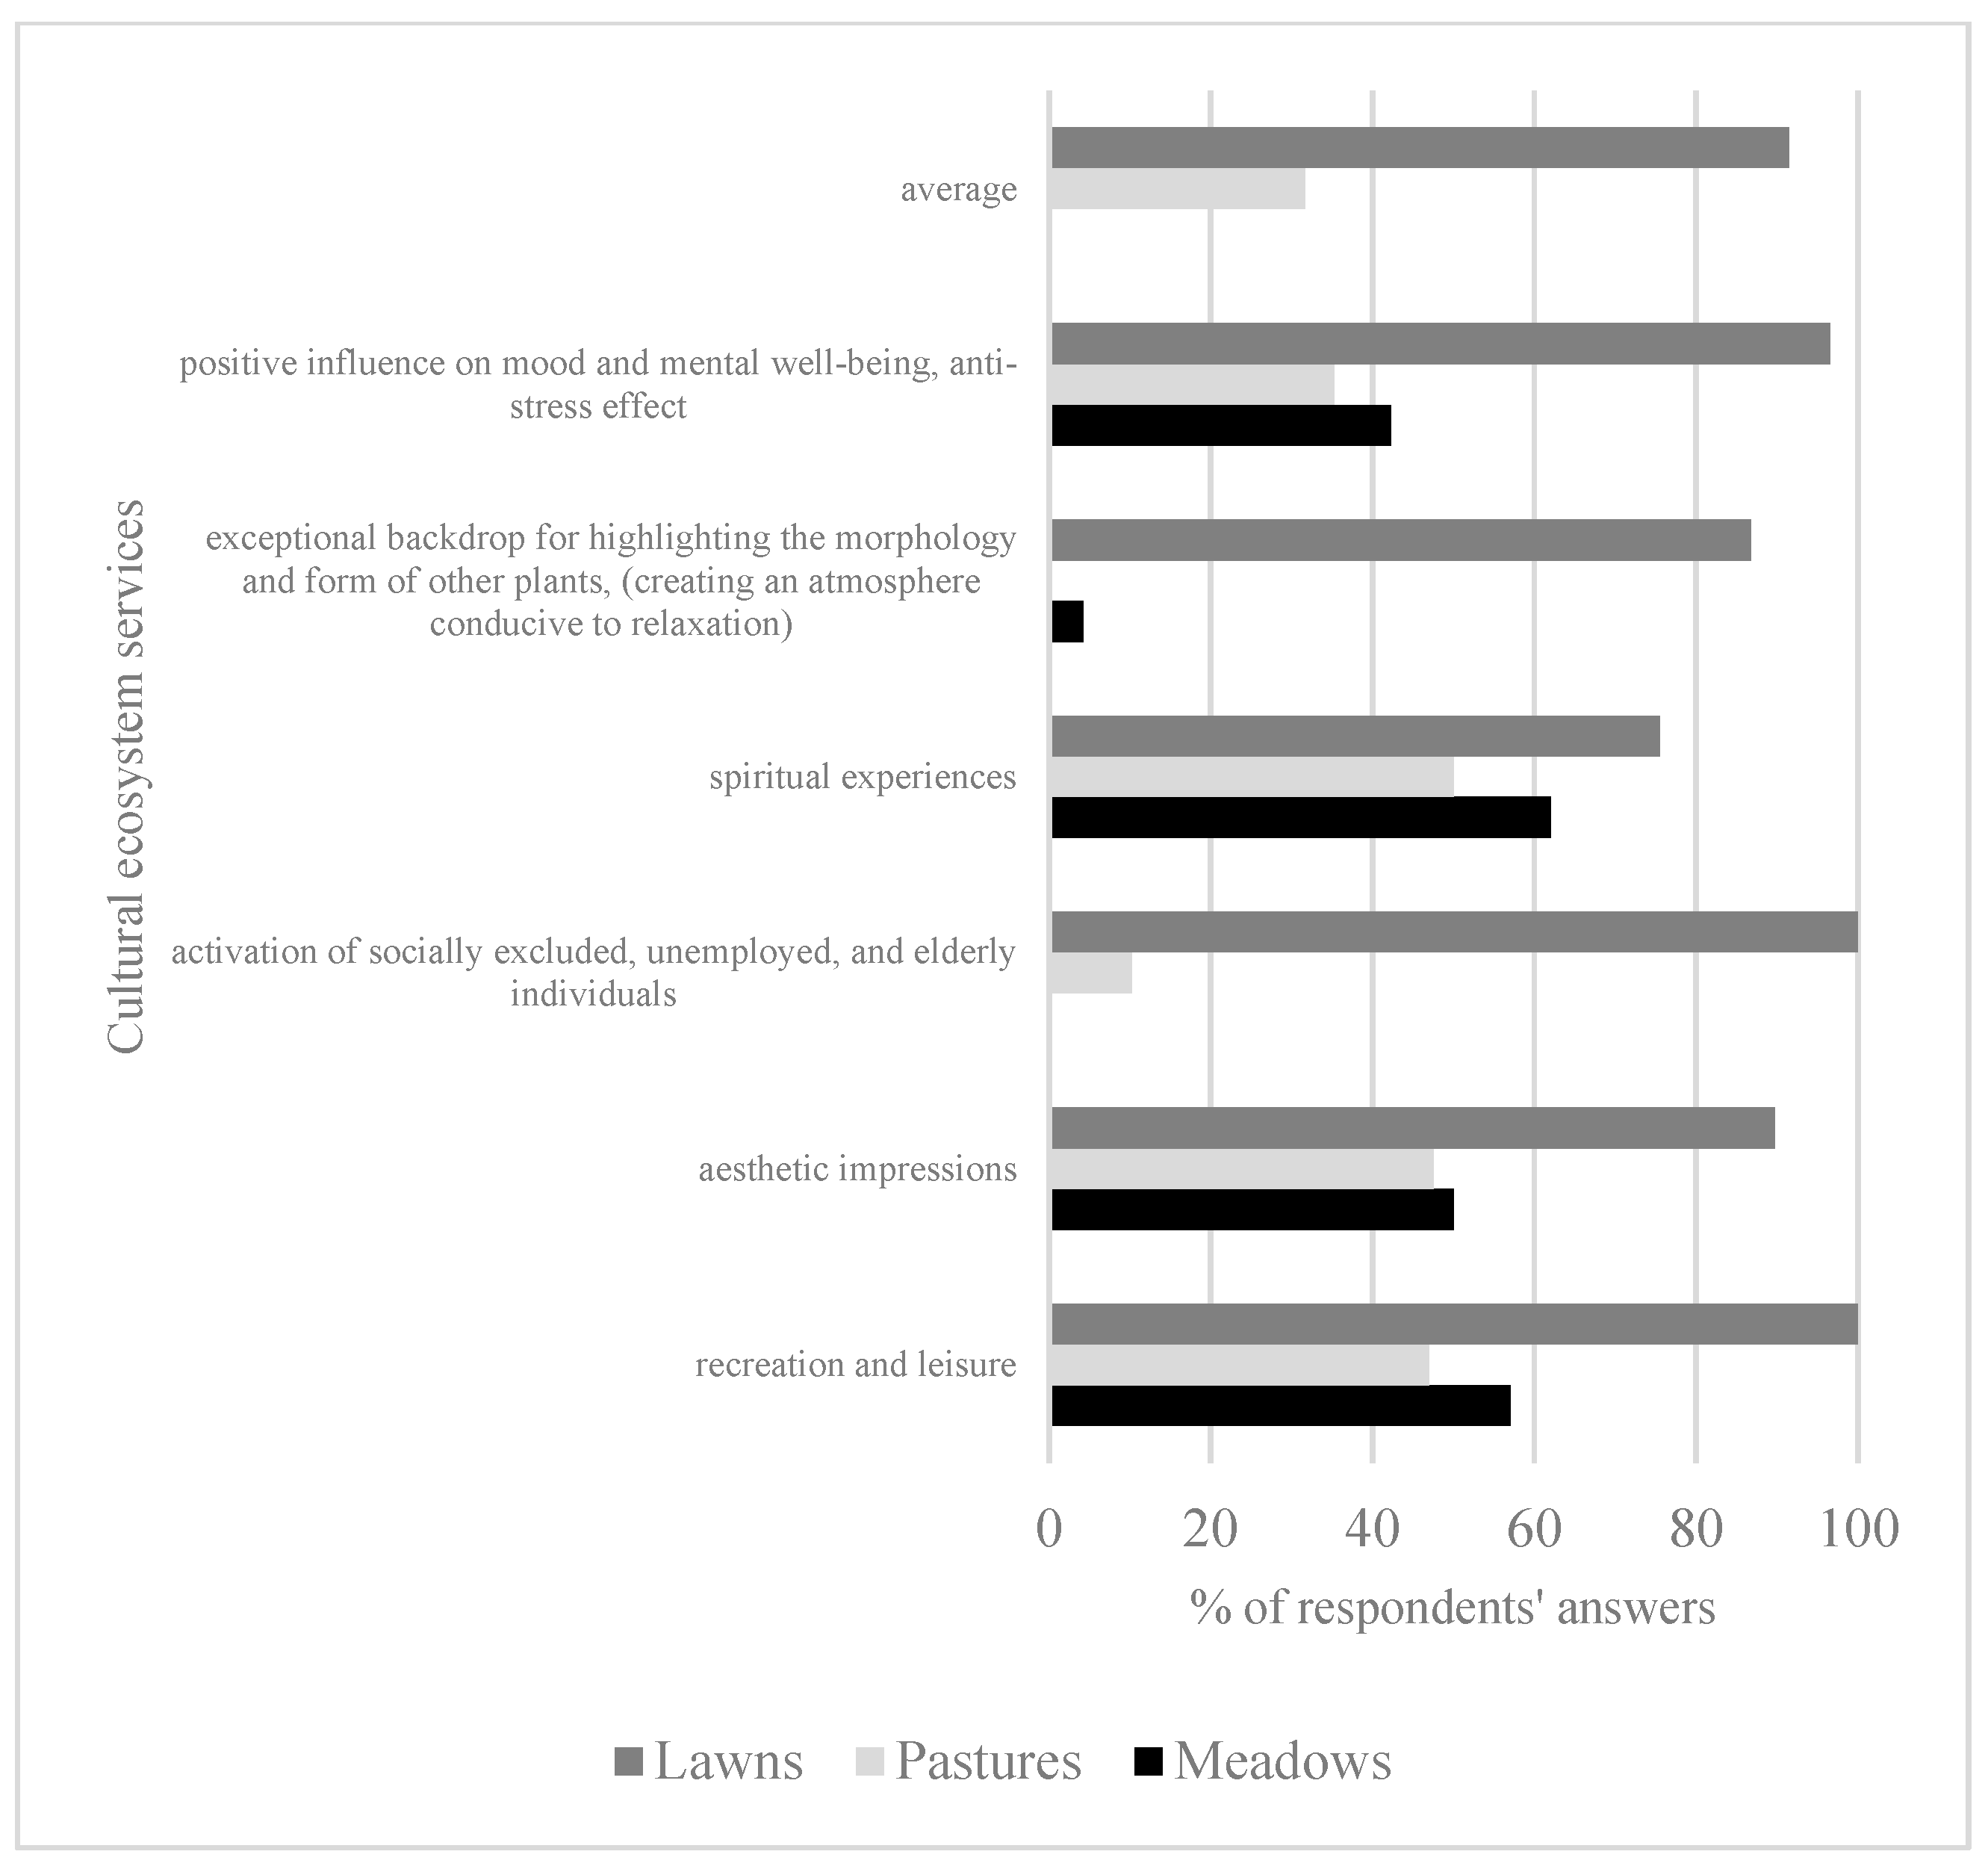
  • Grassland ecosystems (meadows, pastures, and lawns) are clearly perceived as valuable sources of cultural ecosystem services, particularly in terms of recreation, relaxation, and aesthetics. Respondents demonstrated a differentiated yet conscious assessment of the role these landscapes play in enhancing quality of life and the experience of space.
  • Lawns received the highest ratings in terms of recreational and leisure attractiveness, especially among students in landscape architecture-related fields. In contrast, meadows were considered the most aesthetically pleasing, achieving the highest Aesthetic Attractiveness Index (AAI). These results indicate that different types of grasslands contribute to different dimensions of cultural ecosystem services, reflecting users’ diverse visual preferences and cultural associations.
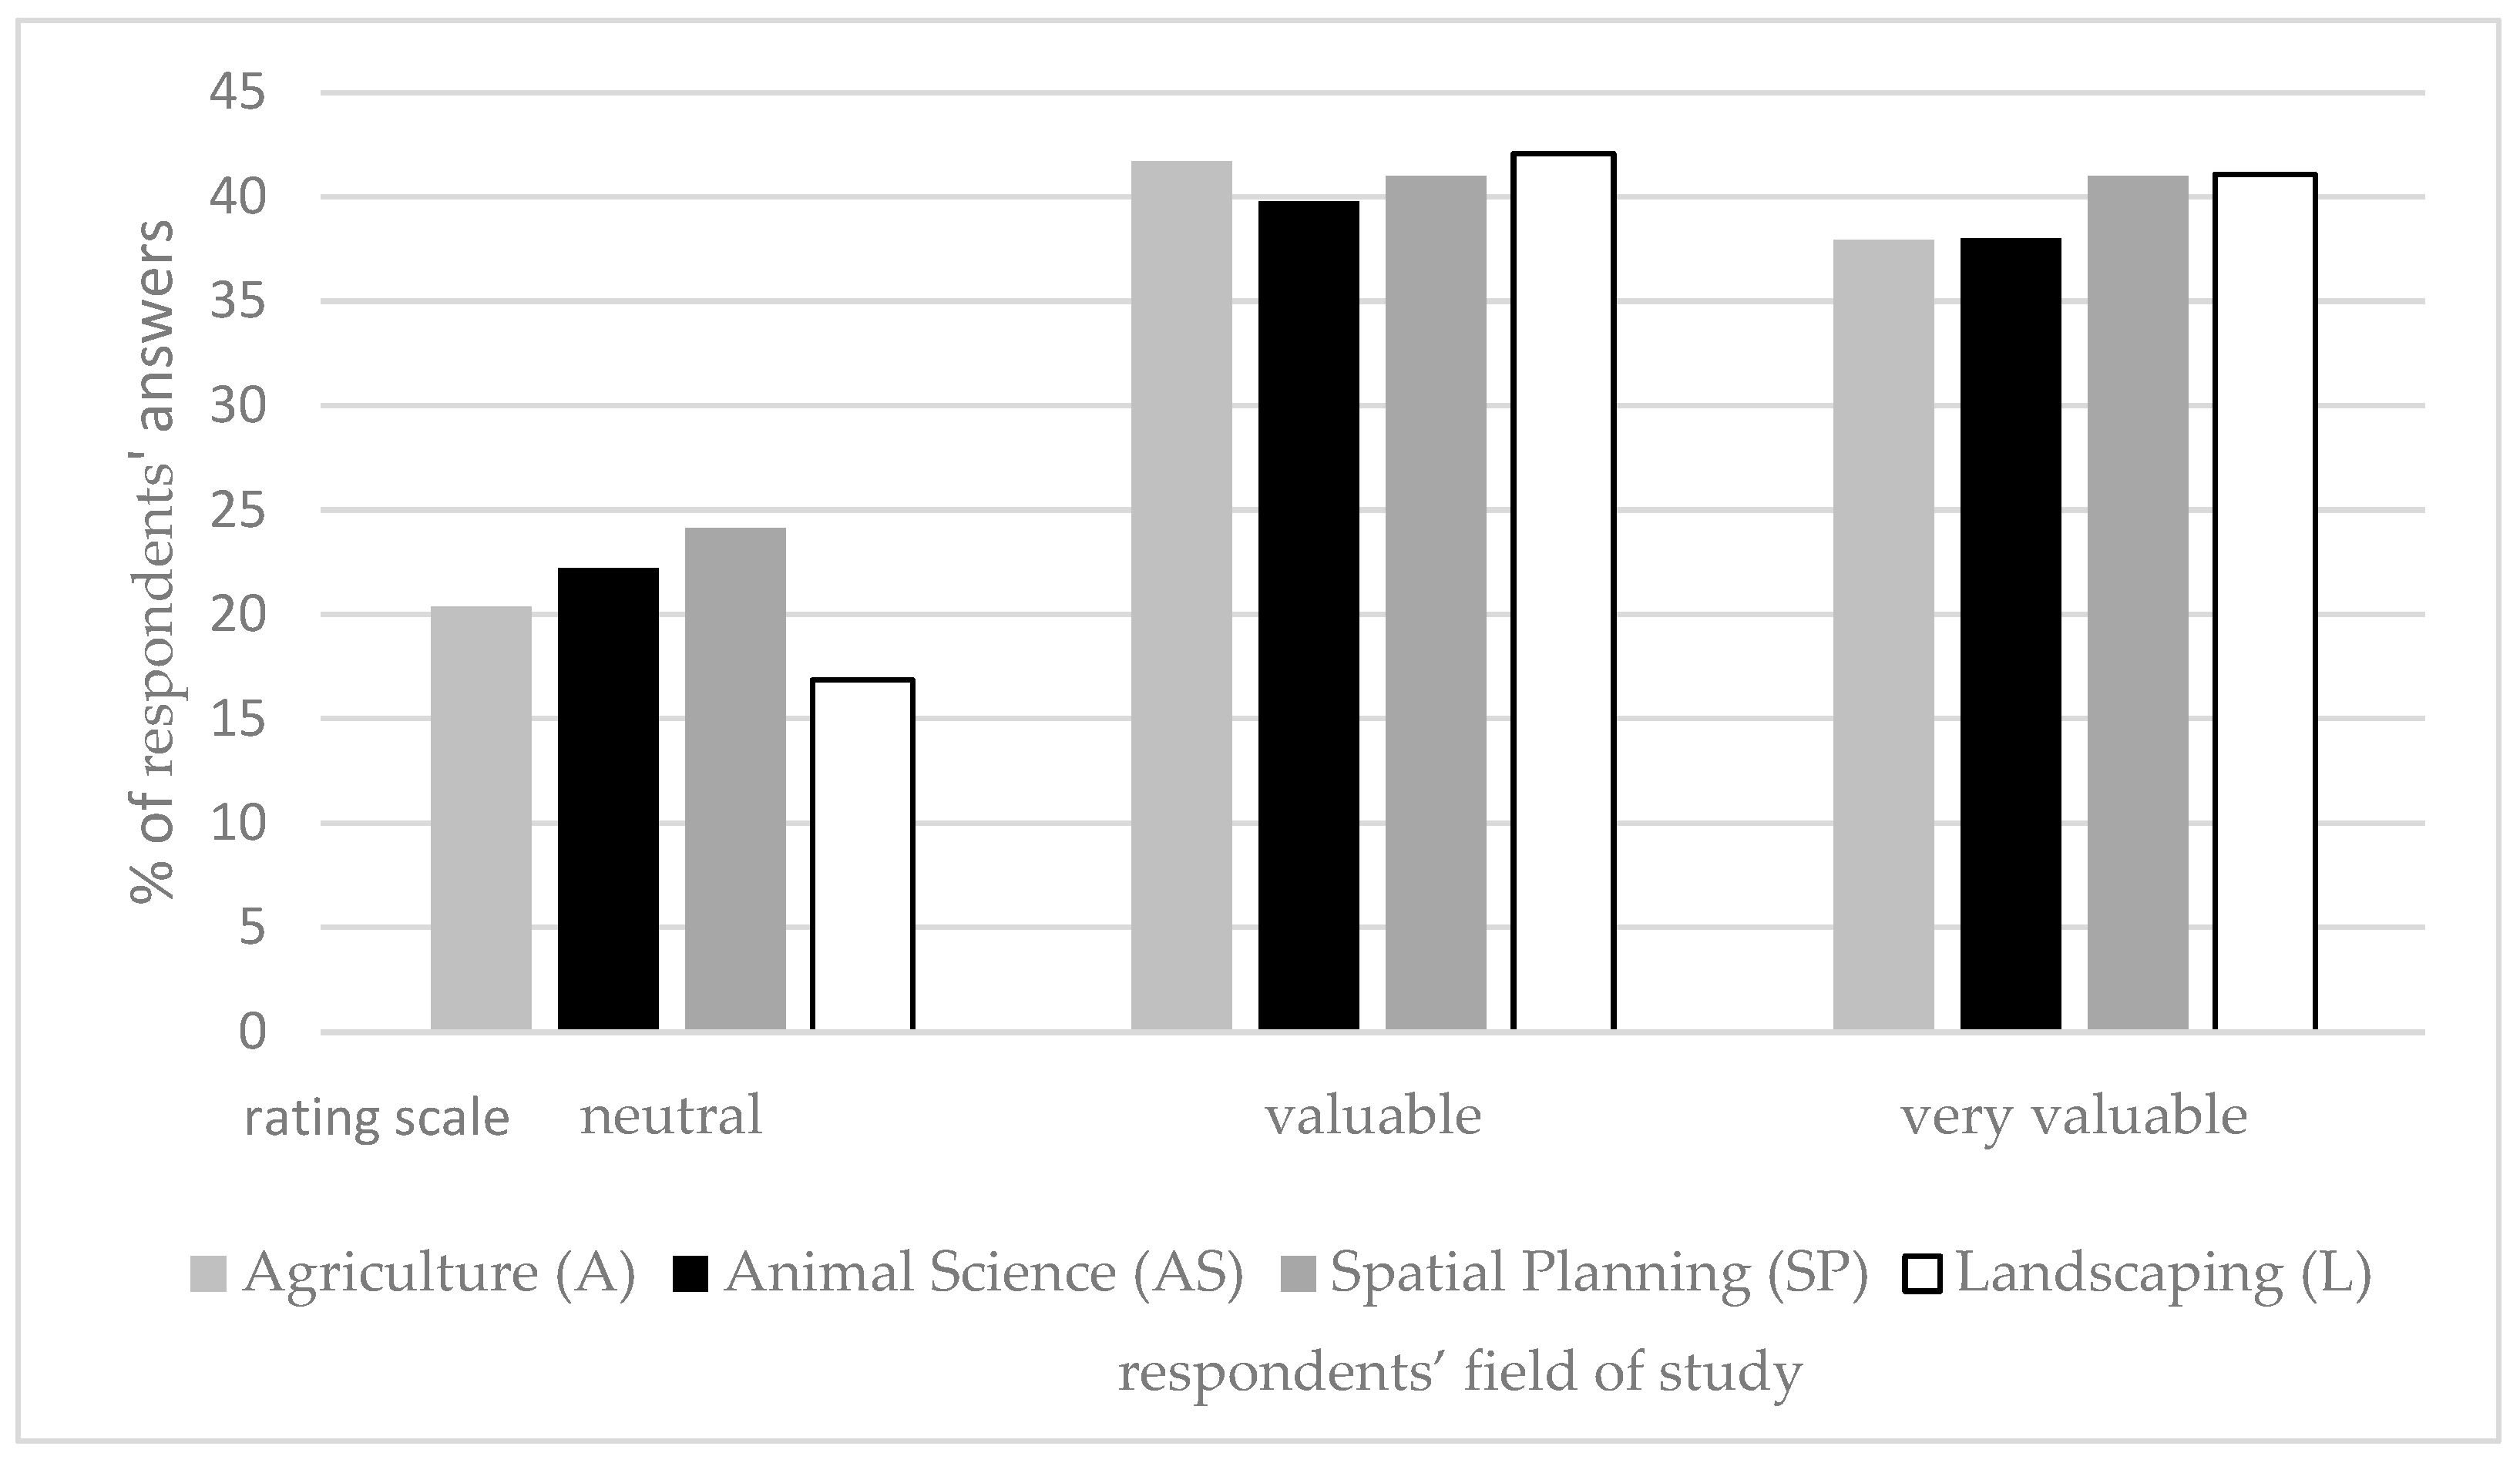
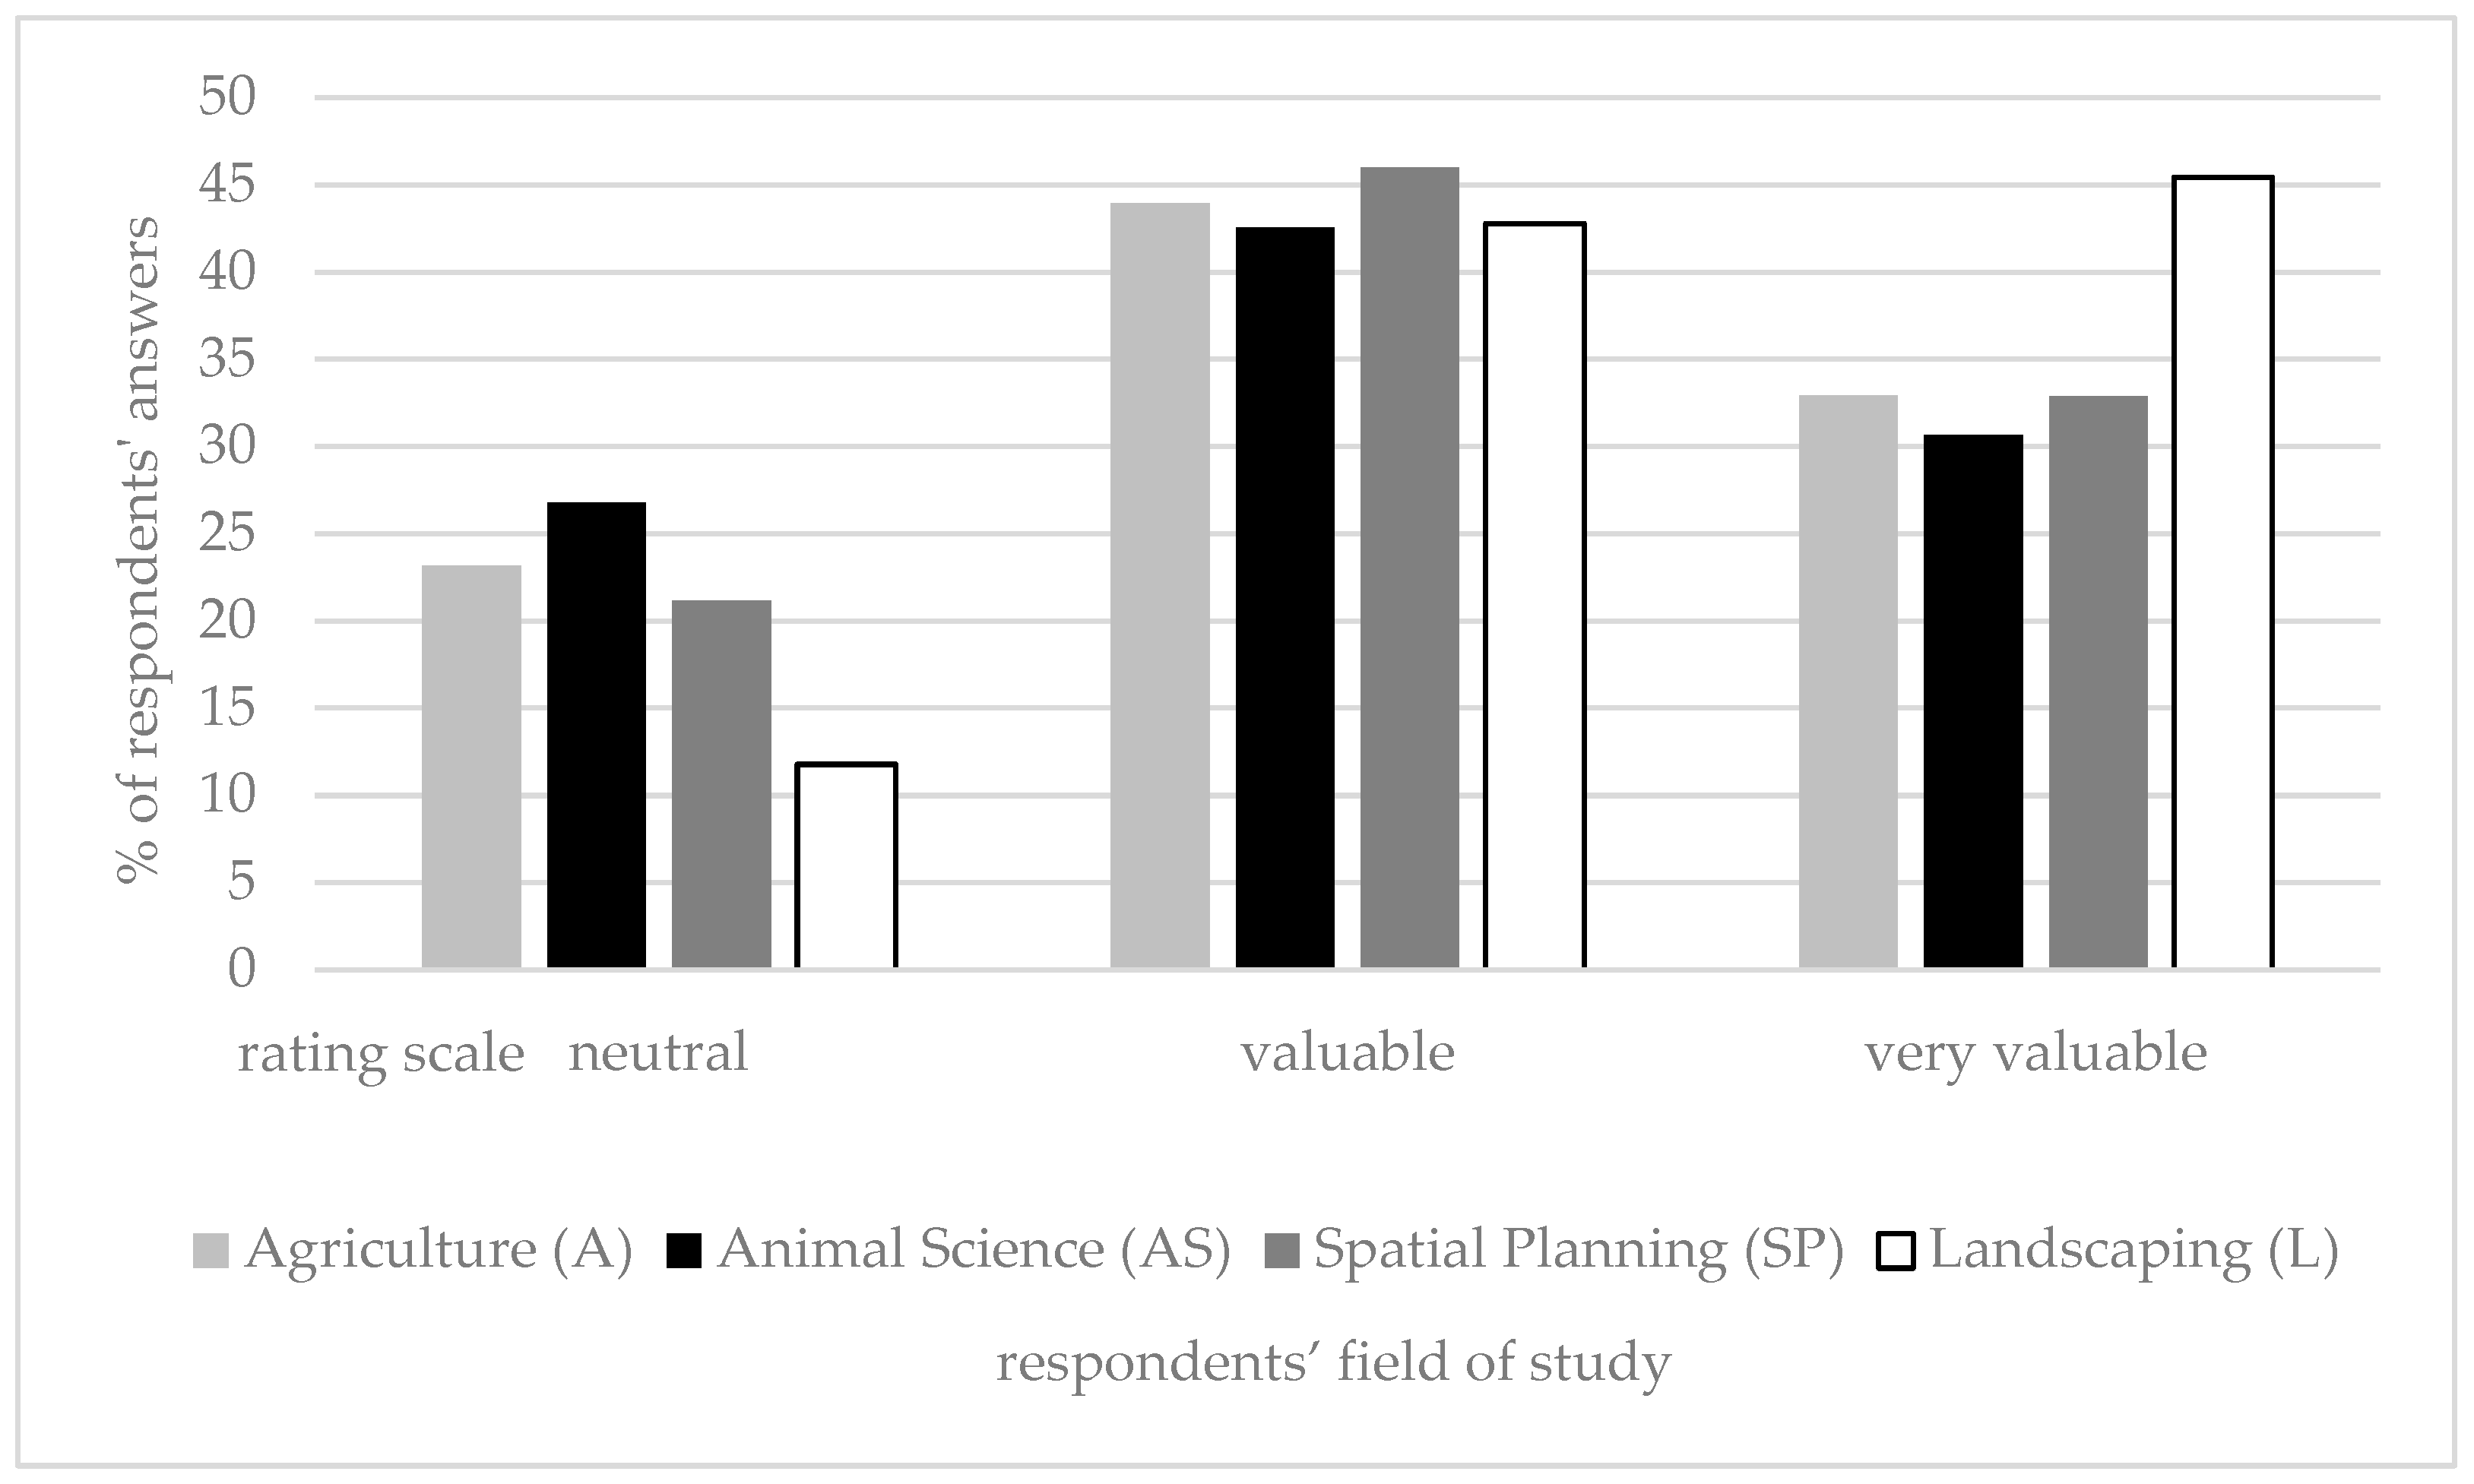
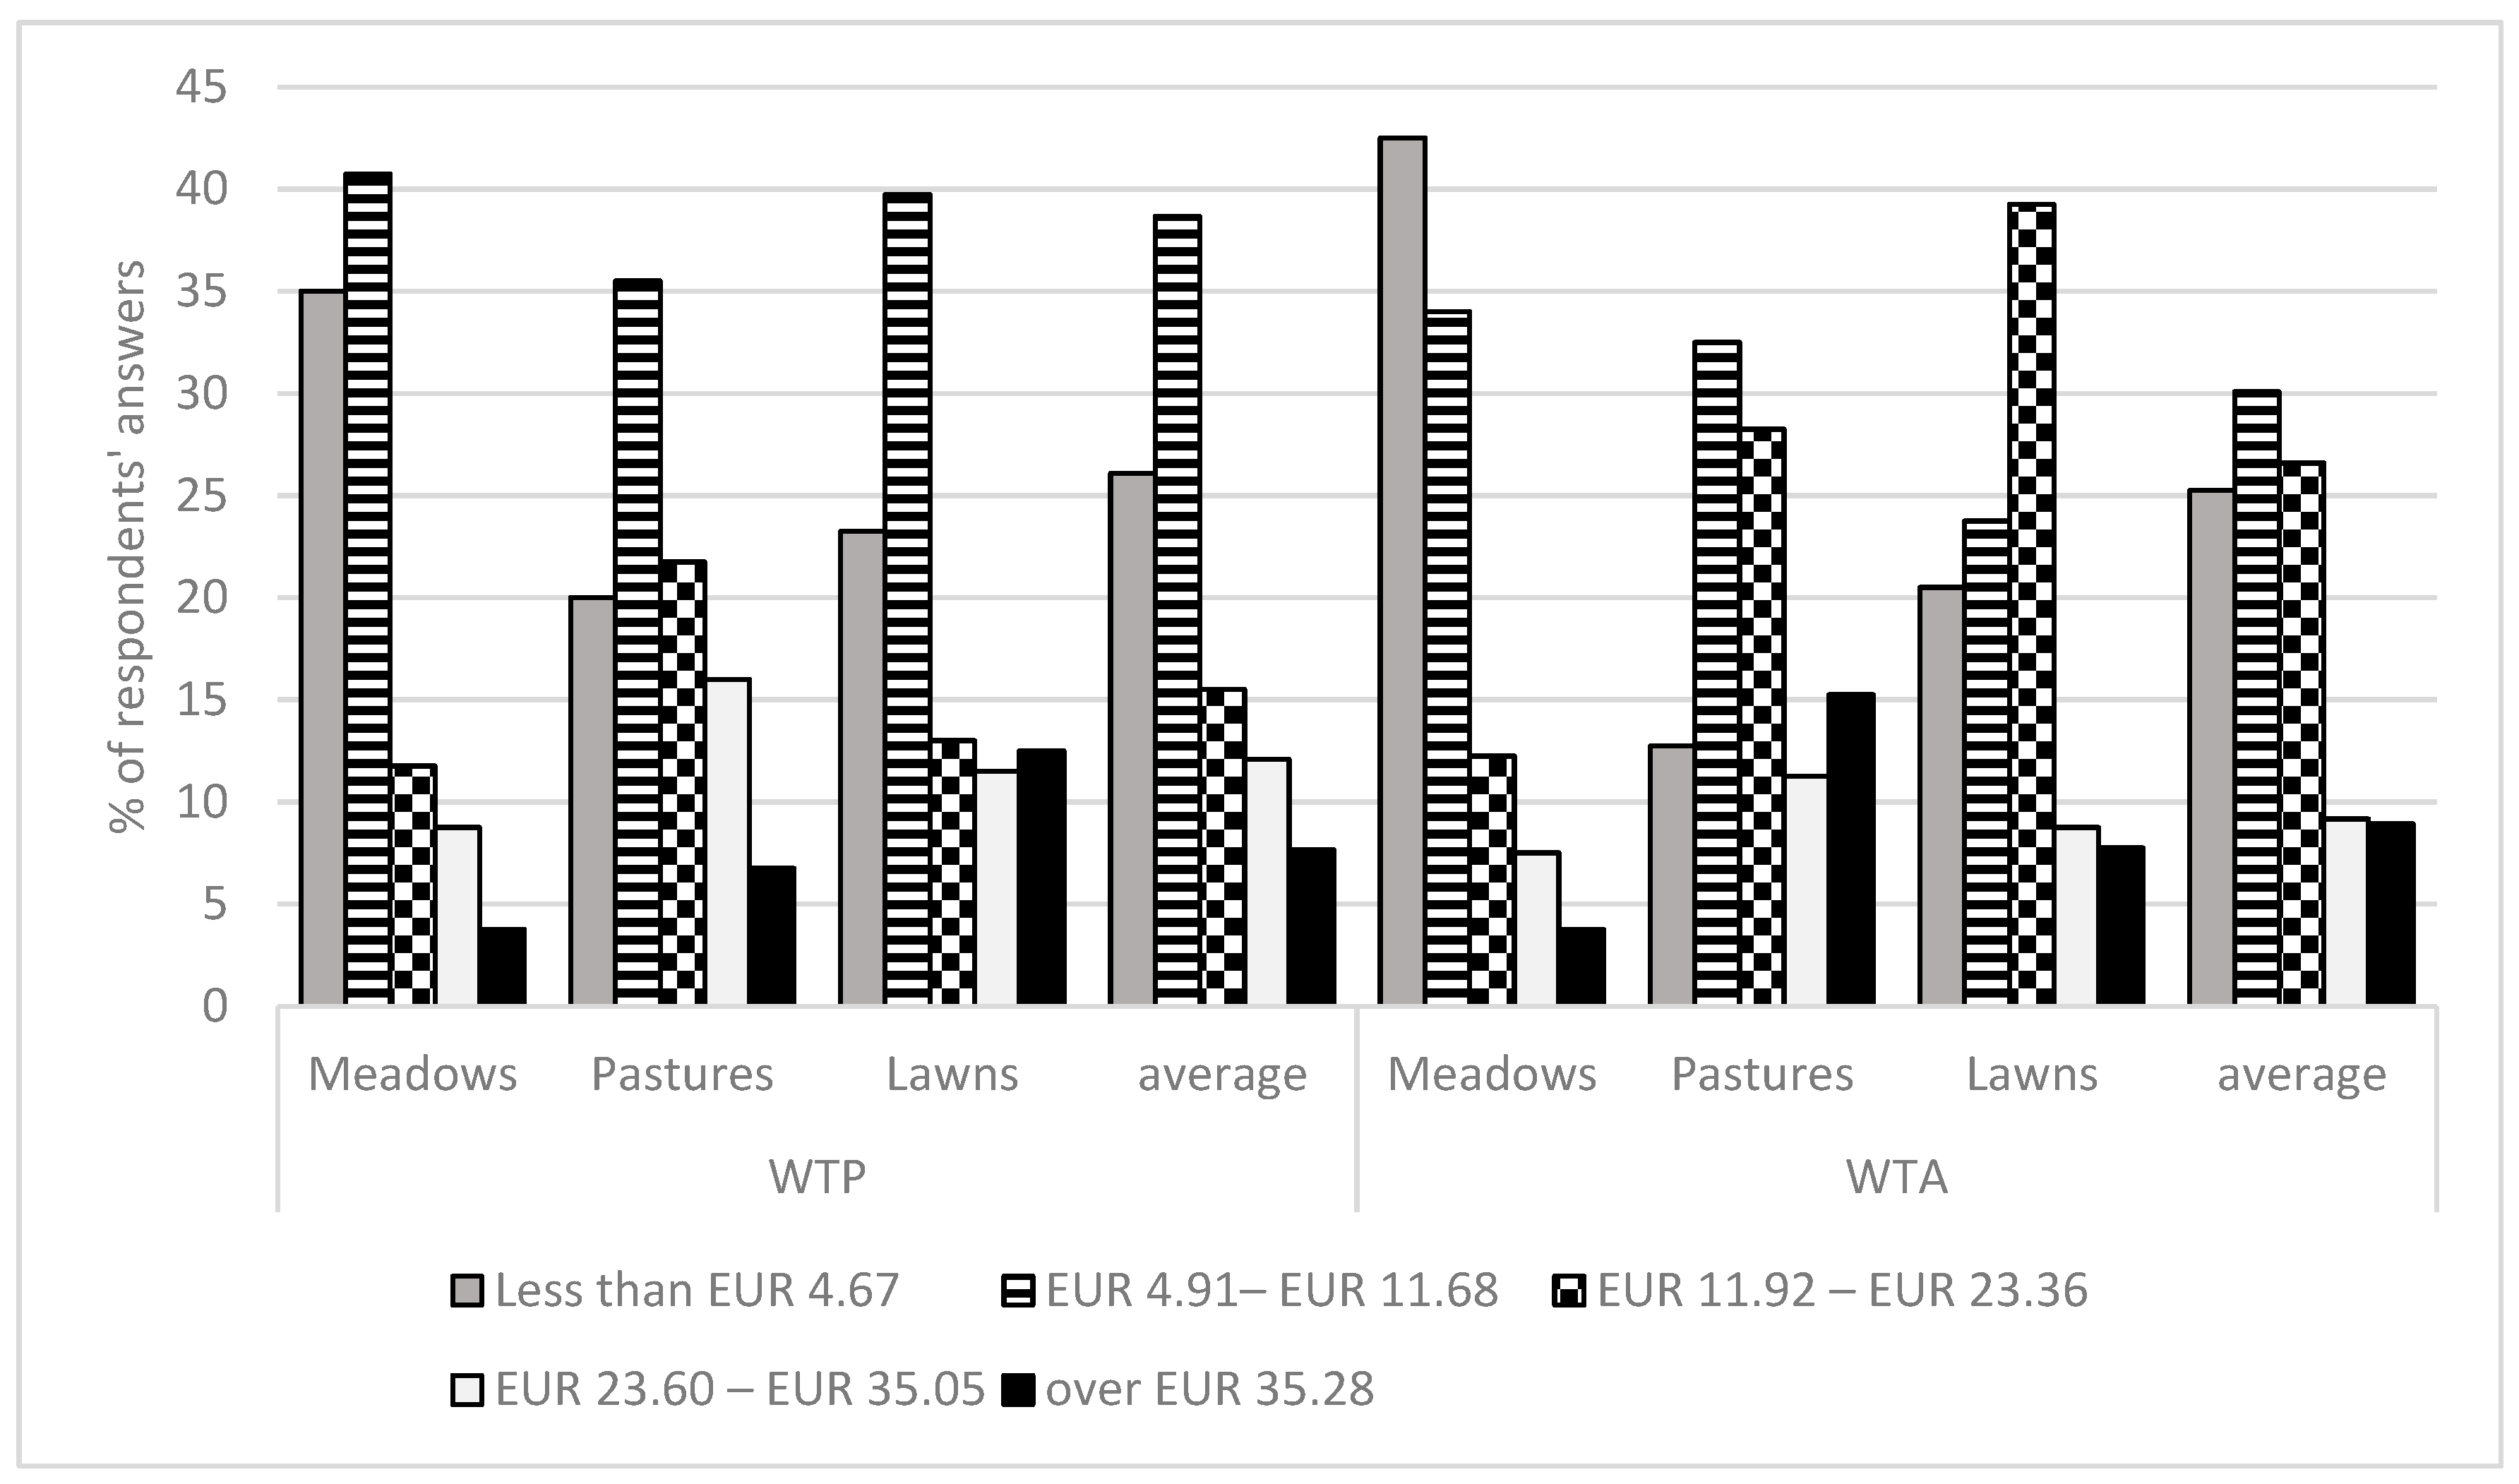
  • Statistically significant differences in WTP and WTA values confirm the influence of the respondents’ field of study and place of residence. Students of agricultural and animal science disciplines rated pastures and meadows more highly, whereas those from spatial planning and landscape architecture disciplines tended to prefer lawns.
  • Respondents living in urban areas consistently declared higher WTP and WTA values than those from rural areas, suggesting that access to and demand for green spaces are largely shaped by the spatial context of everyday life.
  • Although lawns and pastures yielded higher per-hectare values, meadows generated the highest total cultural ecosystem service value due to their larger spatial extent in the Lublin region. This result highlights the importance of combining intensity of perception with spatial scale in valuation studies.
  • The discrepancy between lawns’ low aesthetic ratings (AAI) and their high recreational attractiveness (RLAI) indicates a complex perception structure of cultural services. This divergence may stem from their functional qualities (e.g., accessibility, usability), which outweigh visual appeal. Such asymmetries underscore the multidimensionality of human–landscape relationships and the necessity of evaluating cultural services through a multi-indicator approach.
  • The divergence between WTP and WTA values—where compensation was valued higher than willingness to pay—reflects not only economic rationality but also deeper psychological and cultural mechanisms. This asymmetry is consistent with findings in environmental economics and supports the relevance of contingent valuation for capturing intangible dimensions of nature’s value.
  • The study provides empirical foundations for integrating cultural ecosystem services into local spatial planning, particularly in the context of grassland conservation and green infrastructure development. Management strategies should be aligned with social perceptions of these areas to enhance both public acceptance and policy effectiveness.

Author Contributions

Conceptualization, H.L., A.K. and K.A.-M.; methodology, H.L., W.L. and T.W.; software, S.F.; validation, T.W., H.L., A.K., K.A.-M., W.L., S.F. and A.D.; formal analysis, A.D.; resources, W.L. and S.F.; data curation, W.L. and S.F.; writing—original draft preparation, H.L., A.K., A.D. and K.A.-M.; writing—review and editing, H.L., A.K., A.D. and K.A.-M.; visualisation, S.F.; supervision, K.A.-M. All authors have read and agreed to the published version of the manuscript.

Funding

This research received no external funding.

Institutional Review Board Statement

The Ethics Committee for research Involving Human Subject, University of Life Sciences in Lublin, confirms that its approval was not necessary for the study submitted by the authors titled: Cultural ecosystem services of grassland communities: a case study of Lubelskie Province” (according to Decrees of the Rector of University of Life Sciences in Lublin No.102/2022, and No. 137/2023).

Informed Consent Statement

Informed consent was obtained from all subjects involved in the study.

Data Availability Statement

The source data for this article is available in the authors’ archive. Access to the data can be provided upon request.

Conflicts of Interest

The author Stanisław Franczak was employed by the Proteon Pharmaceuticals SA company. All authors declare that the research was conducted in the absence of any commercial or financial relationships that could be construed as a potential conflict of interest.

References

  1. Ignatieva, M.; Hedblom, M. An Alternative Urban Green Carpet: How Can We Move to Sustainable Lawns in a Time of Climate Change? Science 2018, 362, 148–149. [Google Scholar] [CrossRef] [PubMed]
  2. Watson, C.J.; Carignan-Guillemette, L.; Turcotte, C.; Maire, V.; Proulx, R. Ecological and Economic Benefits of Low-Intensity Urban Lawn Management. J. Appl. Ecol. 2019, 57, 436–446. [Google Scholar] [CrossRef]
  3. Junge, X.; Schüpbach, B.; Walter, T.; Schmid, B.; Lindemann-Matthies, P. Aesthetic Quality of Agricultural Landscape Elements in Different Seasonal Stages in Switzerland. Landsc. Urban Plan. 2015, 133, 67–77. [Google Scholar] [CrossRef]
  4. Nowak-Olejnik, A.; Mocior, E.; Tokarczyk, N. Human Perceptions of Cultural Ecosystem Services of Semi-Natural Grasslands: The Influence of Plant Communities. Ecosyst. Serv. 2020, 46, 101208. [Google Scholar] [CrossRef]
  5. Southon, G.E.; Jorgensen, A.; Dunnett, N.; Hoyle, H.; Evans, K.L. Biodiverse Perennial Meadows Have Aesthetic Value and Increase Residents’ Perceptions of Site Quality in Urban Green-Space. Landsc. Urban Plan. 2017, 158, 105–118. [Google Scholar] [CrossRef]
  6. Romanazzi, G.R.; Koto, R.; De Boni, A.; Palmisano, G.O.; Cioffi, M.; Roma, R. Cultural Ecosystem Services: A Review of Methods and Tools for Economic Evaluation. Environ. Sustain. Indic. 2023, 20, 100304. [Google Scholar] [CrossRef]
  7. Wang, S.; Yang, G.; Xu, Y.; Xu, B. Spatial Impact of Rural Landscape Pattern on Ecosystem Service in Hangzhou. Landsc. Archit. 2025, 32, 125–132. [Google Scholar] [CrossRef]
  8. Tindale, S.; Vicario-Modro, V.; Gallardo-Cobos, R.; Hunter, E.; Miskolci, S.; Newell Price, P.; Sánchez-Zamora, P.; Sonnevelt, M.; Ojo, M.; McInnes, K.; et al. Citizen Perceptions and Values Associated with Ecosystem Services from European Grassland Landscapes. Land Use Policy 2023, 127, 106574. [Google Scholar] [CrossRef]
  9. Klaus, V.H.; Fox, N.; Richter, F.J.; Andreatta, D.; Chaiallah, A. Powerful Flowers: Public Perception of Grassland Aesthetics Is Strongly Related to Management and Biodiversity. bioRxiv 2025. [Google Scholar] [CrossRef]
  10. Liu, Y.-L.; Chiang, J.-T.; Ko, P.-F. The Benefits of Tourism for Rural Community Development. Humanit. Soc. Sci. Commun. 2023, 10, 137. [Google Scholar] [CrossRef] [PubMed]
  11. Bengtsson, J.; Bullock, J.M.; Egoh, B.; Everson, C.; Everson, T.; O’Connor, T.; O’Farrell, P.J.; Smith, H.G.; Lindborg, R. Grasslands—More Important for Ecosystem Services Than You Might Think. Ecosphere 2019, 10, e02582. [Google Scholar] [CrossRef]
  12. Lipińska, H.; Kłopotowska, A.; Włosek, D. The Contingent Valuation Method in the Study of Ecosystem Services on the Example of the Urban Natural System of Lubartów. IOP Conf. Ser. Earth Environ. Sci. 2019, 471, 5–8. [Google Scholar] [CrossRef]
  13. McElwee, P.; He, J.; Hsu, M.J. Challenges to Understanding and Managing Cultural Ecosystem Services in the Global South. Ecol. Soc. 2022, 27, 23. [Google Scholar] [CrossRef]
  14. Lausi, L.; Amodio, M.; Sebastiani, A.; Fusaro, L.; Manes, F. Assessing Cultural Ecosystem Services During the COVID-19 Pandemic at the Garden of Ninfa (Italy). Ann. Bot. 2022, 12, 63–75. [Google Scholar] [CrossRef]
  15. Hunter, E.; Quatrini, S.; Lieberher, E.; Tindale, S.; Sanchez Zamora, P.; Gallardo Cobos, R.; Miskolci, S.; Johansson, C.; Nybom, J.; Cano Vergara, B.; et al. The Effectiveness of Policies Promoting Sustainable Permanent Grasslands Across Five European Countries: Mapping, Understanding, and Key Stakeholder Perceptions; WP4; Deliverable 4.1c; SUPER-G (Sustainable Permanent Grassland Systems and Policies); EC Project Number 774124–2; Newcastle University: Newcastle, UK, 2020. [Google Scholar]
  16. Lindemann-Matthies, P.; Junge, X.; Matthies, D. The Influence of Plant Diversity on People’s Perception and Aesthetic Appreciation of Grassland Vegetation. Biol. Conserv. 2010, 143, 195–202. [Google Scholar] [CrossRef]
  17. Tribot, A.-S.; Deter, J.; Mouquet, N. Integrating the Aesthetic Value of Landscapes and Biological Diversity. Proc. R. Soc. B 2018, 285, 20180971. [Google Scholar] [CrossRef] [PubMed]
  18. Mikkonen, J.; Raatikainen, K.J. Aesthetics in Biodiversity Conservation. J. Aesthet. Art Crit. 2024, 82, 174–190. [Google Scholar] [CrossRef]
  19. Villoslada, M.; Vinogradovs, I.; Ruskule, A.; Veidemane, K.; Nikodemus, O.; Kasparinskis, R.; Sepp, K.; Gulbinas, J. A Multitiered Approach for Grassland Ecosystem Services Mapping and Assessment: The Viva Grass Tool. One Ecosyst. 2018, 3, e25490. [Google Scholar] [CrossRef]
  20. Oppenheim, A.N. Kwestionariusze, Wywiady, Pomiary Postaw; Zysk i S-ka Wydawnictwo: Poznań, Poland, 2004; pp. 35–84. [Google Scholar]
  21. Zydroń, A.; Sikora, A. Valuation of the Sołacki Park in Poznań Using the Contingent Valuation Method. Stud. Pr. Wydz. Nauk Ekon. Zarz. Univ. Szczecin 2015, 42, 246–256. [Google Scholar]
  22. Lupa, P. Quantification of Selected Ecosystem Services at the Local Level: The Case of Krajenka Municipality. Ph.D. Thesis, Adam Mickiewicz University, Poznań, Poland, 2016; pp. 96–160. [Google Scholar]
  23. National Bank of Poland. Table No. 077/A/NBP/2025 of 2025-04-22. Available online: https://nbp.pl/en/archiwum-kursow/table-no-077-a-nbp-2025-of-2025-04-22/ (accessed on 22 April 2025).
  24. Statistics Poland. Statistical Yearbook of Agriculture; Statistics Poland: Warszawa, Poland, 2022; p. 432.
  25. Woźniak-Kostecka, I.; Lipińska, H.; Sosnowska, M.; Wyłupek, T. Directions of changes in the use of permanent grasslands in the Lubelskie Voivodeship in the years 1990–2018. Grassl. Sci. Pol. 2022, 22, 87–105. [Google Scholar]
  26. Gobster, P.H.; Nassauer, J.I.; Daniel, T.C.; Fry, G. The Shared Landscape: What Does Aesthetics Have to Do with Ecology? Landsc. Ecol. 2007, 22, 959–972. [Google Scholar] [CrossRef]
  27. Plieninger, T.; Dijks, S.; Oteros-Rozas, E.; Bieling, C. Assessing, mapping, and quantifying cultural ecosystem services at community level. Land Use Policy 2013, 33, 118–129. [Google Scholar] [CrossRef]
  28. Křůmalová, V.; Pražan, J.; Drlík, J. Valuation of Selected Public Goods from Agriculture; Výzkumný Ústav Zemědělské Ekonomiky: Prague, Czech Republic, 2000. [Google Scholar]
  29. Van den Berg, M.; Birnbaum, L.; Bosveld, A.T.; Brunström, B.; Cook, P.; Feeley, M.; Giesy, J.P.; Hanberg, A.; Hasegawa, R.; Kennedy, S.W.; et al. Toxic Equivalency Factors (TEFs) for PCBs, PCDDs, PCDFs for Humans and Wildlife. Environ. Health Perspect. 1998, 106, 775–787. [Google Scholar] [CrossRef] [PubMed]
  30. Santos-Martín, F.; Martín-López, B.; García-Llorente, M.; Aguado, M.; Benayas, J.; Montes, C. Unraveling the relationships between ecosystem services and human well-being in Spain. PLoS ONE 2013, 8, e73249. [Google Scholar] [CrossRef] [PubMed]
  31. Bertram, C.; Rehdanz, K. Preferences for cultural urban ecosystem services: Comparing attitudes, perception, and use. Ecosyst. Serv. 2015, 12, 187–199. [Google Scholar] [CrossRef]
  32. Twohig-Bennett, C.; Jones, A. The health benefits of the great outdoors: A systematic review and meta-analysis of greenspace exposure and health outcomes. Environ. Res. 2018, 166, 628–637. [Google Scholar] [CrossRef] [PubMed]
  33. Marselle, M.R.; Bowler, D.E.; Watzema, J.; Eichenberg, D.; Kirsten, T.; Bonn, A. Pathways linking biodiversity to human health: A conceptual framework. Environ. Int. 2021, 150, 106420. [Google Scholar] [CrossRef] [PubMed]
  34. Dallimer, M.; Irvine, K.N.; Skinner, A.M.; Davies, Z.G.; Rouquette, J.R.; Maltby, L.L.; Warren, P.H.; Armsworth, P.R.; Gaston, K.J. Biodiversity and the feel-good factor: Understanding associations between self-reported human well-being and species richness. BioScience 2012, 62, 47–55. [Google Scholar] [CrossRef]
  35. Costanza, R.; d’Arge, R.; de Groot, R.; Farber, S.; Grasso, M.; Bruce Hannon, B.; Limburg, K.; Naeem, S.; O.’Neill, R.; Paruelo, J.; et al. The value of the world’s ecosystem services and natural capital. Nature 1997, 387, 253–260. [Google Scholar] [CrossRef]
  36. Millennium Ecosystem Assessment. Ecosystems and Human Well-Being: Synthesis; Island Press: Washington, DC, USA, 2005. [Google Scholar]
  37. Nassauer, J.I. Messy ecosystems, orderly frames. Landsc. J. 1995, 14, 161–170. [Google Scholar] [CrossRef]
  38. Włodarczyk-Marciniak, R.; Frankiewicz, P.; Krauze, K. Socio-cultural valuation of Polish agricultural landscape components by farmers and its consequences. J. Rural. Stud. 2020, 74, 190–200. [Google Scholar] [CrossRef]
  39. Gunnarsson, B.; Knez, I.; Hedblom, M.; Ode Sang, Å. Effects of Biodiversity and Environment-Related Attitude on Perception of Urban Green Space. Urban Ecosyst. 2017, 20, 37–49. [Google Scholar] [CrossRef]
  40. Rechtman, O. Visual Perception of Agricultural Cultivated Landscapes: Key Components as Predictors for Landscape Preferences. Landsc. Res. 2013, 38, 273–294. [Google Scholar] [CrossRef]
  41. Rakosy, D.; Motivans, E.; Stefan, V.; Nowak, A.; Świerszcz, S.; Feldmann, R.; Kuhn, E.; Geppert, C.; Venkataraman, N.; Sobieraj-Betlińska, A.; et al. Intensive Grazing Alters the Diversity, Composition and Structure of Plant–Pollinator Interaction Networks in Central European Grasslands. PLoS ONE 2022, 17, e0263576. [Google Scholar] [CrossRef] [PubMed]
  42. Poczta, J. Natural and Sightseeing Values and Physical Recreation in Agritourism Farms. In Turystyka Kulturowa; Mikos von Rohrscheidt, A., Ed.; Wydawnictwo: Poznań, Poland, 2016. [Google Scholar]
  43. Chan, K.M.A.; Satterfield, T.; Goldstein, J. Rethinking ecosystem services to better address and navigate cultural values. Ecol. Econ. 2012, 74, 8–18. [Google Scholar] [CrossRef]
  44. Hackenburg, D.; McDonough, K.; Kadykalo, A.; Marquina, T.; Winkler, K. Ecosystem Services in Postsecondary and Professional Education: An Overview of Programs and Courses. Ecosyst. People 2023, 19, 2201351. [Google Scholar] [CrossRef]
  45. Kuik, O. The Avoidance Costs of Greenhouse Gas Damage: A Meta-Analysis. In CASES Project; WP3; European Commission: Brussels, Belgium, 2007; pp. 34–65. [Google Scholar]
  46. Goliński, T.; Foltynowicz, Z. Valuation of Ecosystem Services for Implementing Innovative Clean Technology. Pol. J. Environ. Stud. 2018, 27, 4. [Google Scholar] [CrossRef] [PubMed]
  47. de Groot, R.S.; Alkemade, R.; Braat, L.; Hein, L.; Willemen, L. Challenges in integrating the concept of ecosystem services and values in landscape planning, management and decision making. Ecol. Complex. 2010, 7, 260–272. [Google Scholar] [CrossRef]
  48. Fish, R.; Church, A.; Winter, M. Conceptualising cultural ecosystem services: A. novel framework for research and critical engagement. Ecosyst. Serv. 2016, 21, 208–217. [Google Scholar] [CrossRef]
  49. Daniel, T.C.; Muhar, A.; Arnberger, A.; Aznar, O.; Boyd, J.W.; Chan, K.M.A.; von der Dunk, A. Contributions of cultural services to the ecosystem services agenda. Proc. Natl. Acad. Sci. USA 2012, 109, 8812–8819. [Google Scholar] [CrossRef] [PubMed]
  50. Chan, K.M.A.; Balvanera, P.; Benessaiah, K.; Chapman, M.; Díaz, S.; Gómez-Baggethun, E.; Gould, R.; Hannahs, N.; Jax, K.; Klain, S.; et al. Why protect nature? Rethinking values and the environment. Proc. Natl. Acad. Sci. USA 2016, 113, 1462–1465. [Google Scholar] [CrossRef] [PubMed]
  51. Raymond, C.M.; Brown, G.; Robinson, G.M. The influence of place attachment and experience on people’s perceptions of land use options. J. Environ. Manag. 2009, 90, 1204–1212. [Google Scholar] [CrossRef]
  52. Kuik, O. Valuation of Ecosystem Services in Dutch Rural Areas: A Stated Preference Approach; Institute for Environmental Studies (IVM), VU University Amsterdam: Amsterdam, The Netherlands, 2007. [Google Scholar]
  53. Tessema, M.W.; Abebe, B.G. Public Perception on the Role of Urban Green Infrastructure Development and Land Use Management in Rapidly Urbanized Countries: The Case of Hawassa City, Ethiopia. Fudan J. Humanit. Soc. Sci. 2024, 17, 1–41. [Google Scholar] [CrossRef]
  54. Geerts, R.; Buijs, A.E.; Snep, R.P.H. Urban green spaces and perceived ecosystem services: A. cross-European analysis. Landsc. Urban Plan. 2023, 230, 104602. [Google Scholar] [CrossRef]
  55. Seppelt, R.; Dormann, C.F.; Eppink, F.V.; Lautenbach, S.; Schmidt, S. A Quantitative Review of Ecosystem Service Studies: Approaches, Shortcomings and the Road Ahead. J. Appl. Ecol. 2011, 48, 630–636. [Google Scholar] [CrossRef]
  56. Bas-Defossez, F.; Hart, K.; Mottershead, D.H.; Maréchal, A.; Allen, B. Feeding Europe: Agriculture and Sustainable Food Systems; Institute for European Environmental Policy (IEEP): London, UK, 2018. [Google Scholar]
  57. Pietrzyk-Kaszyńska, A.; Czepkiewicz, M.; Kronenberg, J.; Kaczmarek, T. Mainstreaming ecosystem services into spatial planning: The role of indicators. Landsc. Urban Plan. 2022, 221, 104373. [Google Scholar] [CrossRef]
  58. Rambonnet, L.; Vugteveen, P.; Turnhout, E. Policy integration of ecosystem services in spatial planning: Perceptions and action. Environ. Sci. Policy 2019, 96, 61–69. [Google Scholar] [CrossRef]
Figure 1. Ecological and economic significance of selected grassland communities according to respondents.
Sustainability 17 06697 g001
Figure 2. Types of ecosystem services provided by the examined grassland communities, according to respondents. Explanation: A—agriculture; AS—animal science; SP—spatial planning; L—landscaping.
Sustainability 17 06697 g002
Figure 3. Types of cultural services provided by grassland communities, as perceived by respondents.
Sustainability 17 06697 g003
Figure 4. Recreational and leisure attractiveness of grassland communities by academic discipline.
Sustainability 17 06697 g004
Figure 5. Perceived importance of natural features in grassland communities for recreation and leisure.
Sustainability 17 06697 g005
Figure 6. Perceived importance of landscape attributes of grassland communities for environmental aesthetics by academic discipline.
Sustainability 17 06697 g006
Figure 7. Percentage distribution of respondents’ willingness to pay (WTP) for conservation or accept compensation (WTA) for limited access to specific grassland types.
Sustainability 17 06697 g007
Table 1. Declared monetary ranges and values used in WTP and WTA index calculations.
IndexDeclared Monetary Ranges [EUR·ha−1]Values Used for Calculation [EUR]
WTP,
WTA
<EUR 4.67EUR 4.67
EUR 4.67–11.68EUR 11.68
EUR 11.92–23.36EUR 23.36
EUR 23.60–35.05EUR 35.05
>EUR 35.05EUR 70.09
Table 2. Recreational and Aesthetic Attractiveness Indexes (RLAI and AAI) for evaluated grassland types (based on methodology by [22]).
IndexMeadowsPasturesLawns
Recreational and Leisure Attractiveness (RLAI)272144
Normalised Recreational and Leisure Attractiveness (RLAI!)0.340.111.00
Aesthetic Attractiveness (AAI)26.3623.469.06
Normalised Aesthetic Attractiveness (AAI!)1.000.830.00
Table 3. Estimated average per capita monetary value [EUR] of cultural services provided by grassland communities (WTP and WTA), by respondents’ academic discipline.
Grassland
Type
WTP [EUR/Person]WTA [EUR/Person]
AASSPLAASSPL
Meadows15.1913.5514.0217.0614.4915.8914.9512.38
Pastures23.6019.3923.1316.3226.8725.9323.8325.93
Lawns19.3918.2221.2627.1016.5919.8620.7928.04
Average19.3917.0619.3620.0919.1620.5619.8622.20
Explanation: A—agriculture, AS—animal science, SP—spatial planning, L—landscaping.
Table 4. Statistical significance of differences in WTP and WTA values for each grassland type by academic discipline.
Grassland TypeWTPWTA
Meadowsp = 0.899p = 0.907
Pasturesp < 0.001 *p = 0.338
Lawnsp = 0.230p = 0.236
* Statistical significance at α = 0.05.
Table 5. Statistical significance of differences in WTP and WTA values for different grassland types within each academic discipline.
Academic DisciplineWTPWTA
Agriculturep < 0.001 *p < 0.001 *
Animal sciencep = 0.085p < 0.001 *
Spatial planningp < 0.001 *p < 0.001 *
Landscapingp < 0.001 *p < 0.001 *
* Statistical significance at α = 0.05.
Table 6. WTP/WTA indicators, linear regression coefficients, dependent variables, interpretation, and model fit (R2).
IndicatorSignificant Dependent Variables
(p < 0.05)
CoefficientInterpretationR2
WTP—MeadowsPlace of residence: rural−74.34Respondents from rural areas declared significantly lower WTP for meadows.0.26
Field of studyNo significant differences.
WTA—MeadowsPlace of residence: rural−66.47Respondents from rural areas expect lower compensation for the loss of meadows.0.21
Field of study+31.32Students of agriculture, animal science, and spatial management assign significantly higher WTA values to meadows than landscape architecture students.
WTP—PasturesPlace of residence: rural−82.96Respondents from rural areas expect significantly lower compensation for the loss of pastures.0.25
Field of study+38.64Agriculture students declare higher WTP for pastures (confirmed by Chi2 test).
WTA—PasturesPlace of residence: rural−105.82Respondents from rural areas expect significantly lower compensation for the loss of pastures.0.25
Field of study+36.46Students of agriculture and animal science expect significantly higher compensation for loss of access to pastures than landscape architecture students.
WTP—LawnsPlace of residence: rural−118.54Respondents from rural areas declared significantly lower amounts for access to lawns compared to urban residents.0.35
Field of studyBest-fitting model among all, although no statistically significant predictors were found.
WTA—LawnsPlace of residence: rural−66.47Respondents from rural areas expect lower compensation for the loss of lawns.0.33
Field of studyNo significant differences.
Table 7. Average estimated monetary values [EUR ·ha−1⸱year−1] of WTP and WTA for each grassland type.
IndicatorsGrassland TypeMMdSDSEMinMax
WTP [EUR·ha−1]Meadowsa 15.0411.7114.450.914.6870.26
Pasturesb 20.5611.7117.071.084.6870.26
Lawnsb 21.6611.7120.771.314.6870.26
WTA [EUR·ha−1]Meadowsa 14.4911.7114.510.924.6870.26
Pasturesb 25.7023.4220.921.324.6870.26
Lawnsb 21.2623.4216.721.064.6870.26
Total cultural service value
[EUR·ha−1]
Meadowsa 29.4423.4225.671.629.37140.52
Pasturesb 46.2635.1332.812.079.37140.52
Lawnsb 42.7635.1335.982.289.37140.52
Note: M—mean, Md—median, SD—standard deviation, SE—standard error, Min—minimum value, Max—maximum value. Different letters next to mean values (e.g., “a”, “b”) indicate statistically significant differences between land-use types (p < 0.05, Tukey HSD post hoc test). Means sharing the same letter do not differ significantly.
Table 8. Average estimated monetary value of cultural ecosystem services in Lubelskie Province [EUR·ha−1⸱year−1⸱total area].
Grassland
Type
Estimated
Area
[ha]
Total Value per ha [WTP + WTA]
[EUR·ha−1]
Total Value of Cultural Ecosystem Services
[EUR·year−1]
Meadows170,77729.44c 5,027,547.20
Pastures85,38846.26b 3,950,192.52
Lawns40,12842.76a 1,715,753.27
Total296,293118.4610,693,492.99
Note: Different letters next to mean values (e.g., “a”, “b”, “c”) indicate statistically significant differences between land-use types (p < 0.05, Tukey HSD post hoc test). Means sharing the same letter do not differ significantly.
Disclaimer/Publisher’s Note: The statements, opinions and data contained in all publications are solely those of the individual author(s) and contributor(s) and not of MDPI and/or the editor(s). MDPI and/or the editor(s) disclaim responsibility for any injury to people or property resulting from any ideas, methods, instructions or products referred to in the content.

