Article

Examination of the Coordination and Impediments of Rural Socio-Economic-Spatial Coupling in Western Hunan from the Standpoint of Sustainable Development

1
College of Architecture, Changsha University of Science & Technology, Changsha 410076, China
2
School of Architecture and Planning, Hunan University, Changsha 410082, China
*
Authors to whom correspondence should be addressed.
Sustainability 2025, 17(15), 6691; https://doi.org/10.3390/su17156691
Submission received: 11 June 2025 / Revised: 16 July 2025 / Accepted: 21 July 2025 / Published: 22 July 2025

Abstract

Clarifying the coordination and impediments of social, economic, and spatial connection in rural areas is essential for advancing rural revitalization, urban-rural integration, and regional coordinated development. Utilizing the 24 counties and districts in western Hunan as case studies, we developed an evaluation index system for sustainable rural development across three dimensions: social, economic, and spatial. We employed the coupling model, coordination model, and obstacle factor model to investigate the comprehensive development level, coupling and coordination status, and obstacle factors of the villages in the study area at three temporal points: 2002, 2012, and 2022. The findings indicate the following: (1) The degree of rural development in western Hunan has escalated swiftly throughout the study period, transitioning from relative homogeneity to a heterogeneous developmental landscape, accompanied by issues such as inadequate development and regional polarization. (2) The overall rural social, economic, and spatial indices are low, and the degree of coupling has increased variably across different study periods; the average coordination degree has gradually improved over time, yet the level of coordination remains low, and spatial development is unbalanced. (3) The criterion-level impediments hindering the sustainable development of rural society, economy, and space are, in descending order, social factors, spatial factors, and economic factors. The urbanization rate, total fixed investment rate, and arable land change rate are the primary impediments in most counties and cities. The study’s findings will inform the planning of rural development in ethnic regions, promote sustainable social and spatial advancement in the countryside, and serve as a reference for rural revitalization efforts.

1. Introduction

In 2015, the United Nations published the 2030 Agenda for Sustainable Development [1], which encompasses 17 goals and 169 targets within the framework of the United Nations Sustainable Development Goals (SDGs), serving as a crucial reference for the development strategies of nations in urban and rural contexts. As a crucial component of the human ecology, it is essential to investigate the sustainable development of rural areas [2]. Nevertheless, the impact of contemporary industrialization, urbanization, and marketisation has precipitated significant transformations in the rural territorial system and human–land interactions within traditional agricultural societies [3], resulting in economic diversification, intricate social structures, and the modernization of ecological environments in rural areas [4], thereby influencing the sustainable development of the countryside. Rural development in developed nations, stemming from the inception of the global food system and the resultant “farm economic crisis,” has traversed various developmental phases: predominantly economic factors in the 1970s and 1990s, cultural factors in the 1990s, and a blend of factors at the dawn of the 21st century [5], culminating in the evolution of rural areas from cohesive, productive economies to modernized ecological environments. The evolution of rural areas has converged into a coherent narrative of producing countryside, consumptive countryside, multifunctional countryside, and globalized countryside [6]. The implementation of policies and strategies, including integrated rural development, rural revitalisation, and harmonious countryside initiatives, has led to the comprehensive development of natural, ecological, economic, social, and other rural territorial systems [7]. Consequently, the rural subject has shifted from stability to mobility, spatial dynamics have evolved from territoriality to publicity, and structural configurations have transitioned from compactness to looseness.
Numerous studies on socio-economic-spatial aggregation exist; nevertheless, the majority neglect the Sustainable Development Goals (SDGs). Additionally, there are investigations focused on the SDGs that examine the intricate interplay between socio-economic and geographical elements, although they fail to account for the underlying driving forces [8]. Research methodology: the majority of studies predominantly employ the PSR model [9], gravity model, QAP method [10], GeoDa, OLS [11], geographically weighted regression model [12], and GeoDA model [13], among others, to examine the present and prospective development trends of the intertwined social, economic, and spatial connections. Regarding the breadth and depth of research, significant advancements have been achieved in the coupling and synergistic development of social, economic, and spatial elements, alongside various other multifactorial analyses. Notable breakthroughs include studies on population-economy-space-society [14,15,16], population-economy-society-resources-environment [17], economy-society-ecology [18], water-economy-population [19], accessibility-economic-social [20], socio-economic-resource-environmental [21,22], economic-social-resources-government [23], tourism industry-socio-economic-ecological environment [24], water-energy-food [25], atmospheric-ecology-society-economy [26], industry-society-ecology [27], society-education-economy [28], people-land-industry [29,30], and economy-population-housing-society-infrastructure-environment [31]. Simultaneously, extensive research has advanced the coupling coordination degree in various domains, including urbanization and ecology [32], construction land [33], physical security [34], digital governance [35], smart logistics [36], energy transition [37], sports [38], and electricity markets [39].
Currently, research examining the possibility for integrated coordination of several SDGs and holistic assessment has begun to surface. Zhang Pengcheng et al. investigated the integrated coordination of the water-energy-food system in the Yellow River Basin in relation to the SDGs [40]; Xu Hui et al. examined the assessment of the Global Inclusive Green Growth Index and its integrated coordination [41]; and Ye Shuai et al. analyzed the interconnected economic-social-ecological coordination of Qinghai Province from the standpoint of sustainable social security [42]. Nonetheless, there is a lack of documentation about the investigation of “socio-economic-spatial” coupling in ethnic regions, particularly in impoverished multi-ethnic places. The western region of Hunan, represents a regional ethnic concentration characterized by a legacy of “thin foundation, weak background, and late initiation.” This is a result of the prolonged accumulation of ethnic villages influenced by the evolution of the rural socio-economic landscape and the natural development of settlement geography, culminating in an overall depiction of “geographic periphery, spatial isolation, cultural authenticity, and economic primitivism.” The prevailing circumstances are defined by “geographic periphery, spatial isolation, cultural authenticity, and economic primitiveness,” with the issue of uneven development between counties and districts becoming increasingly pronounced. The evolution and development of rural society, economy, and space are, to some extent, characteristic of ethnic regions. To systematically capture the phased evolution of rural development in ethnic minority areas, this study selects the years 2002, 2012, and 2022 as key temporal nodes, thereby constructing a 20-year analytical framework. On the one hand, this time span aligns with major policy milestones in China’s rural sustainable development trajectory: 2002 corresponds to the early stage of the “Western Development Strategy,” 2012 marks the deep implementation phase of both the “New Socialist Countryside” initiative and targeted poverty alleviation, while 2022 represents a crucial year for advancing the “Rural Revitalization” strategy. These temporal markers thus carry strong representativeness in terms of policy context and historical periodization. On the other hand, adopting a decadal interval allows for the effective observation of structural transformations and long-term trends within the social, economic, and spatial systems of rural ethnic areas such as Xiangxi. Nevertheless, it should be noted that this temporal design has certain limitations in capturing short-term socio-economic fluctuations, including sudden events and phased policy adjustments. Future research could build upon this framework by incorporating higher-frequency observational data to provide a more dynamic depiction of the sustainable development pathways in ethnic rural regions.
Meanwhile, with the comprehensive implementation of China’s Rural Revitalization Strategy, profound transformations have gradually unfolded across multiple rural subsystems—social, economic, and spatial dimensions. This is particularly evident in ethnic minority regions, where sustained policy support and increasing investment have created unprecedented opportunities for the development of underdeveloped rural areas. From an overall perspective, rural infrastructure has steadily improved, industrial structures have been progressively optimized, urban-rural integration has advanced continuously, and regional development potential has been increasingly unlocked. Against this backdrop, the present study focuses on the evolution of comprehensive rural development at the county level in Xiangxi Prefecture, aiming to assess whether high-quality rural development has truly been achieved. Accordingly, the following hypotheses are proposed:
H1. 
The overall level of rural development in Xiangxi’s counties has exhibited an upward trend from 2002 to 2022.
H2. 
There are significant disparities in the degree of coupling and coordination among the rural social, economic, and spatial systems across different counties in Xiangxi.
H3. 
The obstructive factors affecting the sustainable development of rural social, economic, and spatial systems in Xiangxi demonstrate distinct temporal evolution characteristics and a hierarchical structure of influence.

2. Study Area and Methodology
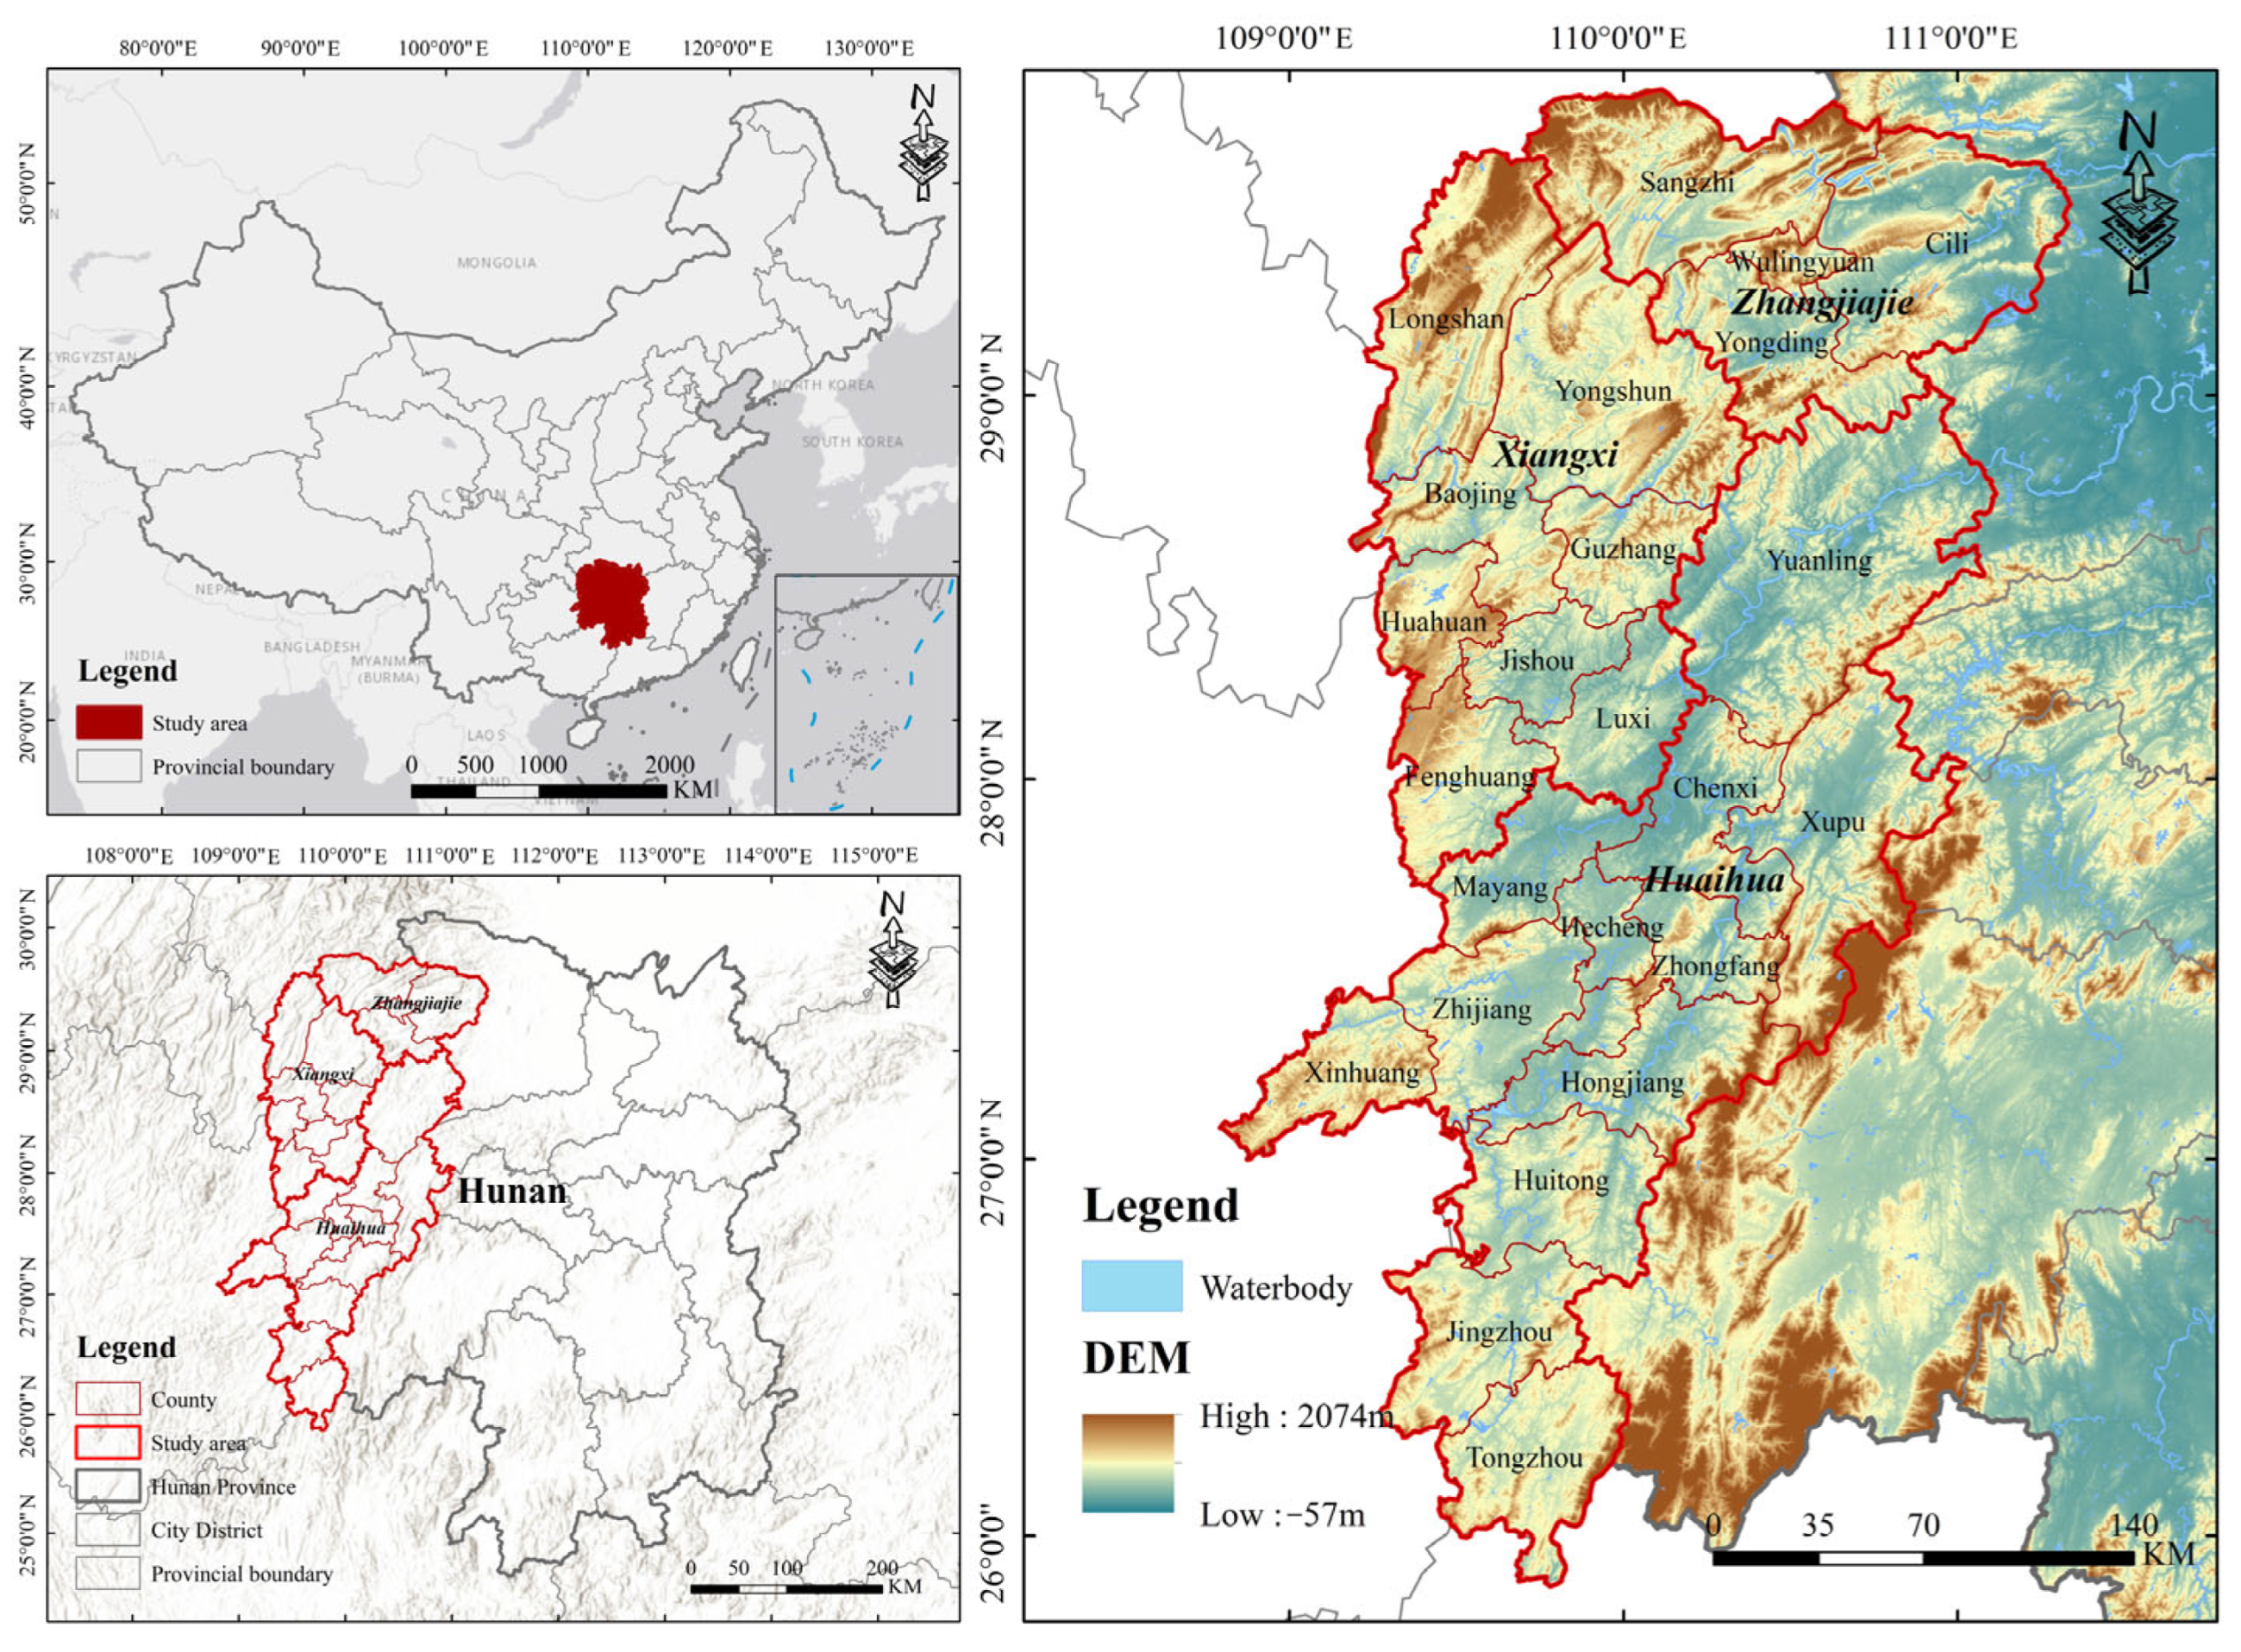
2.1. Study Area

The Xiangxi region is situated in the western portion of Hunan, encompassing the administrative divisions of Zhangjiajie City, Xiangxi Tujia and Miao Autonomous Prefecture (hereafter referred to as Xiangxi Prefecture), and Huaihua City. This area comprises 24 districts and counties, including Wulingyuan District, Luxi County, and Tongdao County (Figure 1), covering a total land area of approximately 52,600 km2. The Xiangxi region is primarily characterized by rugged and hilly terrain, exhibiting significant undulations. Zhangjiajie City comprises a mountainous region that constitutes 76 percent of its total area, characterized predominantly by quartz sandstone peaks and forested landforms. Xiangxi Prefecture is positioned within the Wuling Mountains on the eastern flank of the Yunnan-Guizhou Plateau, exhibiting notable mountainous plains and hillock formations. Huaihua City, located in the eastern section of the Yunnan-Guizhou Plateau, descends from the northwest to the southeast, resulting in a diverse topography that includes basins of varying sizes, terraces, elevated peaks, gulleys, and steep slopes. The region is populated by various ethnic groups, primarily Tujia, Yao, Miao, and Dong, among Hui and Bai communities. It assimilates elements of Confucian culture from the central plains with Hakka culture from the south, resulting in a distinctive regional culture of western Hunan, influenced by local traditions. In recent years, propelled by the tourism development strategy of the Greater Western Hunan Ecological and Cultural Tourism Circle and the “One Circle, One Group, Three Axes and Multiple Points” framework of Hunan Province, the economic and social development of western Hunan has accelerated, boasting a resident population of 8.401 million and a GDP of CNY 338.827 billion in 2023 (Hunan Provincial Statistical Information Network, http://222.240.193.190/2023tjnj/indexch.htm, accessed on 10 June 2025).

2.2. Data Source

This paper conducts a study utilizing county villages as the fundamental unit, employing vector data of county-level administrative units in the Xiangxi region sourced from the Resource and Environment Science and Data Centre of the Chinese Academy of Sciences (CAS) in 2015, with additional basic geographic data also obtained from the CAS Resource and Environment Science Data Centre [43]. Socio-economic data were sourced from the China County (City) Socio-Economic Statistical Yearbook, the China County Statistical Yearbook, and the Hunan Statistical Yearbook for the years 2003, 2013, and 2023. Land use data were sourced from the Resource and Environment Data Centre of the Chinese Academy of Sciences (https://www.resdc.cn/) and the geographic data cloud (www.gscloud.cn) Landsat TM/ETM/OLI decoded data for the years 2002, 2012, and 2022 [44]. To negate the impact of price fluctuations on economic indicators, the comparable prices of pertinent economic data were adjusted using 2002 as the base year.

2.3. Research Methodology

2.3.1. Development of the Socio-Economic-Spatial Coupling Evaluation Index System

The linkage of rural socio-economic and spatial dynamics arises from the combined influence of economic advancement, social transformation, and spatial optimization in response to alterations in both internal rural factors and external regulations. Informed by the rural socio-economic-spatial coupling power factors in the western Hunan region, which include economic development, demographic shifts, and spatial utilization, and grounded in the theory of rural territorial systems while adhering to principles of scientific rigor, operability, and stability, we have developed an evaluation index system for assessing the comprehensive development level of rural counties in western Hunan. This system comprises three dimensions—social, economic, and spatial—and includes ten specific indicators, drawing upon the foundation of existing research [44,45]. The weights of each indicator were established using the expert rating method and hierarchical analysis method (Table 1).

2.3.2. Determination of Indicator Weights

(1) Data are processed in a dimensionless manner. Since the socio-economic-spatial system consists of several indicators, each of which has a different dimension, the indicators were standardized using the extreme value method with the following formula:
d i = x i x m i n x m a x x m i n
where d i represents the dimensionless data post-normalization, assuming values within the interval [0, 1]; x i denotes the value of the ith indicator; x m i n signifies the minimum value of the indicator, and x m a x indicates the maximum value of the indicator, i = 1, 2, …, 10.
(2) Assessment of the social, economic, and spatial development indices of communities. The values of village development across each dimension and the comprehensive development index are derived by weighting and adding the indicators, as outlined in Table 1, using the following formula:
D i = j = 1 3 w i j d i j
R D = i = 1 3 V i D i
where D i represents the development index of village dimension I; w i j represents the weight of indicator j inside dimension I; R D signifies the Rural Comprehensive Development Index (RCDI); and V i indicates the weight of dimension i in the RCDI.
(3) Measurement of the intensity index for rural social spatial reconstruction. The data for the rural reconstruction measurement index were derived from the processing of the rural development evaluation index data. The social reconstruction intensity index (RRI(so)), economic reconstruction intensity index (RRI(e)), spatial reconstruction intensity index (RRI(sp)), and comprehensive reconstruction intensity index (RRI(c)) of the study unit were assessed from 2000 to 2012, 2012 to 2022, and 2002 to 2022 using weighted summation methods analogous to the rural development index.

2.3.3. Coupled Coordination Degree Model

The coordinating condition of rural social-economic-spatial reconstruction connection is assessed using the idea and model of coupling degree. The coupling degree model quantitatively evaluates the intensity of interaction among the three, with the derivation formula provided as follows [45,46]:
C = R R I ( e ) × R R I ( s o ) × R R I ( s p ) R R I ( e ) + R R I ( s o ) + R R I ( s p ) / 3 3 1 / 3
where C denotes the coupling degree, with a value range of [0, 1]; a higher C indicates a superior representation of the coupling state between the district and county units under examination, while a lower C signifies a poorer representation. When the function value of its system in Equation is 0, its coupling degree is also 0. To overcome the above problem, the coefficient of variation is used to derive the equation further as follows:
C = 2 3 × ( R R I e 2 + R R I s o 2 + R R I ( s p ) 2 ) R R I e + R R I s o + R R I ( s p ) 2
The coupling degree solely indicates the strength of the interaction between the systems and does not represent the amount of coordination. Based on the calculations, the coordination degree model is proposed to assess the intensity of social, economic, and spatial connections, hence facilitating a more accurate evaluation of the degree of coordination in their interactive coupling [47].
D = C × R R I ( c )
where D is the degree of coordination; C is the degree of coupling; and RRI(c) is the comprehensive reconstruction intensity index.

2.3.4. Spatial Markov Chain Model

The spatial Markov model integrates the conventional Markov chain with the notion of “spatial lag” [48]. The variation in the regional coupling coordination degree of each county in western Hunan is not independent; rather, it exhibits a notable spatial association. To enhance the examination of this spatial relationship, the spatial lag condition is incorporated into the conventional Markov transfer probability matrix, thereby creating the spatial Markov transfer probability matrix. This facilitates the comparison and analysis of the impact of the coupling coordination degree of neighboring regions on the transfer of the state of the coupling coordination degree within the region [49]. The calculation formula is as follows:
P i j = n i j j n i j
where P i j represents the probability of transferring from state i to state j; and n i j represents all the times of transferring from state i to j.

2.3.5. Obstacle Degree Model

The obstacle degree model was introduced to comprehensively evaluate the comprehensive rural development level of counties in western Hunan region, and to explore the influence of guideline layer and indicator layer on rural development, with the following calculation formula [50]:
T i j = 1 m i j
O i j = T i j W j j = 1 n ( T i j W j ) × 100 %
In the formula, T i j is the indicator deviation; m i j is the standardized value of a single indicator; W j is the factor contribution; O i j is the obstacle degree; and the larger the value of O i j , the greater the influence of the factor on the level of rural social spatial development in western Hunan, the stronger the obstacle degree.

3. Results

3.1. Spatio-Temporal Analysis of Socio-Economic-Spatial Development Levels

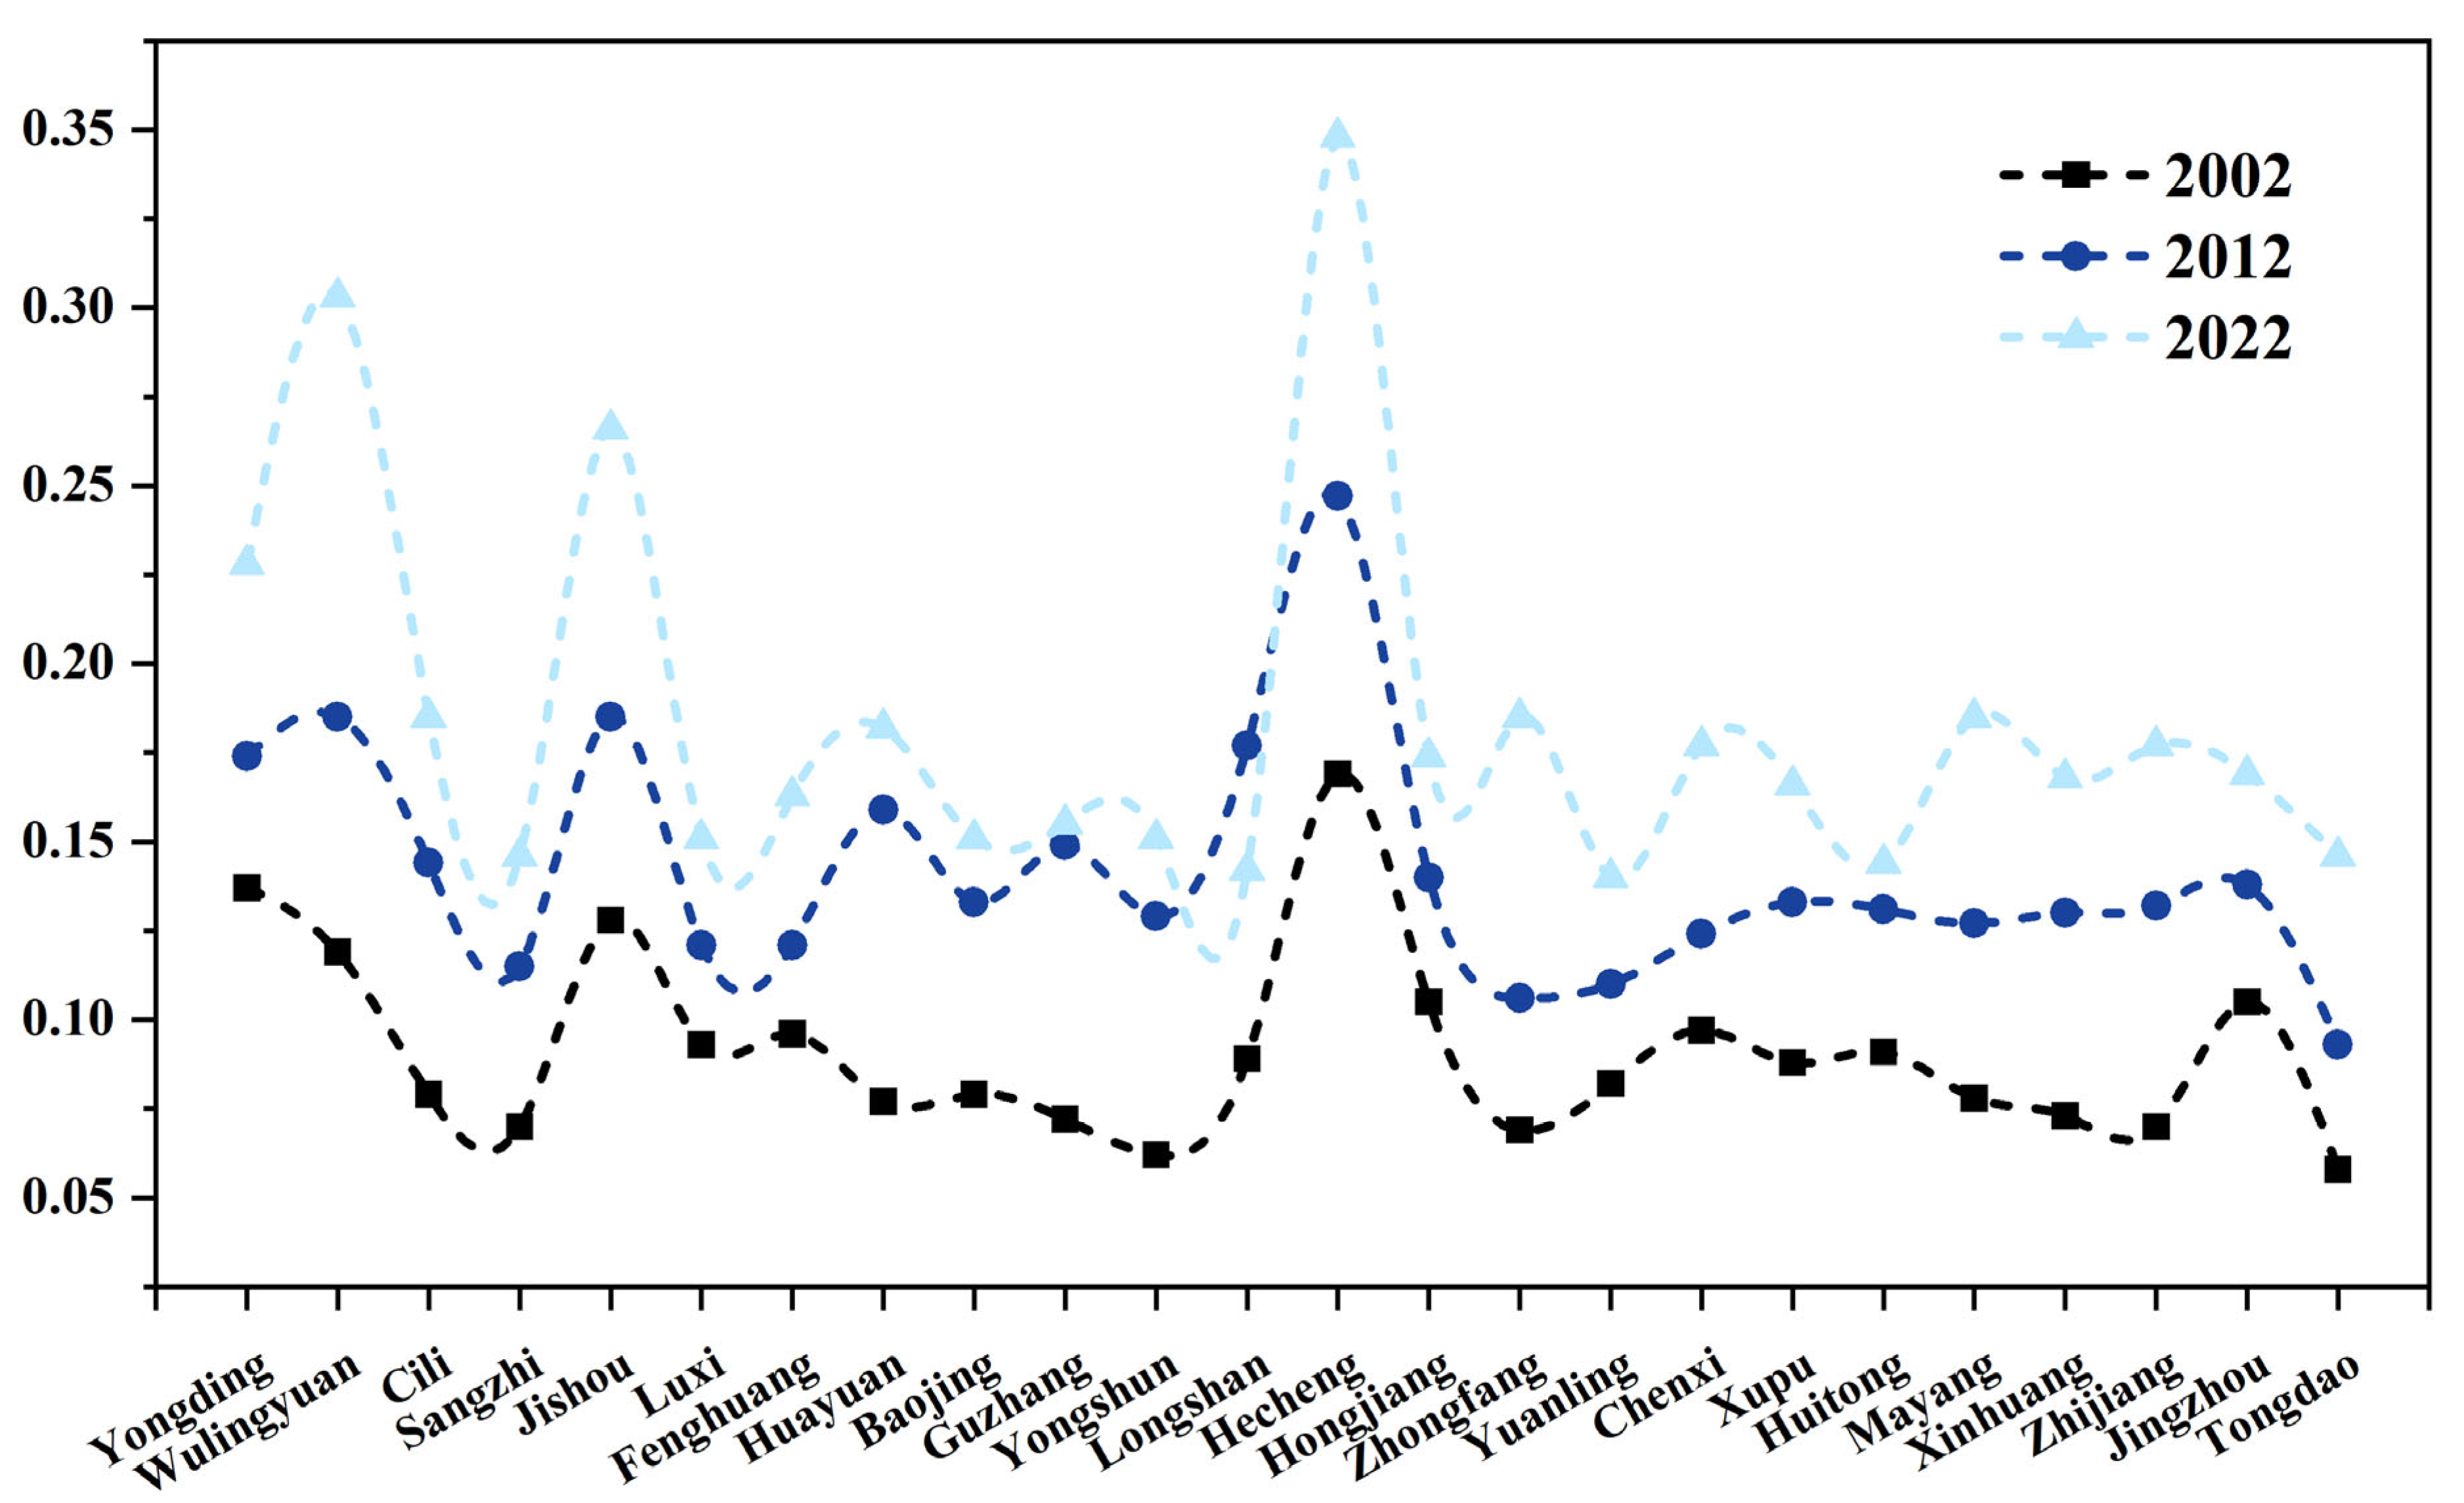
3.1.1. Temporal Evolutionary Features

The average values of the comprehensive rural development index for the years 2002, 2012, and 2022 are 0.091, 0.142, and 0.183, respectively (Figure 2), indicating a progression of villages in the western Hunan region from a low degree of homogeneity to a higher degree of heterogeneity. In 2002, the comprehensive rural development index was highest in Hecheng District at 0.169, followed by Yongding District at 0.137, Jishou City at 0.128, and Wulingyuan at 0.119. The subsequent four were Zhijiang County at 0.070, Zhongfang County at 0.069, Yongshun County at 0.062, and Tongdao County at 0.058. In 2012, Hecheng District had the greatest Comprehensive Rural Development Index (CRDI) at 0.247, succeeded by Wulingyuan and Jishou, both at 0.185, and Longshan County at 0.177. Conversely, Taoxiang and Zhongfang counties exhibited the lowest development indexes, at 0.093 and 0.106, respectively. In 2022, Hecheng District and Wulingyuan exhibited the highest development indices, while Longshan County and Yuanling County recorded the lowest.
The average values of the social, economic, and spatial development indices were 0.177, 0.041, and 0.109, respectively, across the three time points, with the economic index being the highest. This reflects that state and regional policies have significantly influenced the rapid growth in the gross output value of agriculture, forestry, animal husbandry, and fishery, as well as the disposable income per capita of rural permanent residents. The sluggish spatial development is intricately linked to the state’s regulation of land resources and the hastening of urbanization. The statistics for the three dimensions of the development index are observable. In the social dimension, the highest scores are Hecheng District (0.369), Wulingyuan (0.315), and Jishou City (0.277), while the lowest scores are Tongdao County (0.128), Zhongfang County (0.138), and Sangzhi County (0.138). In the economic sector, Hecheng District possesses the greatest development index, succeeded by Hongjiang City and Xupu County, while Tongdao County and Xinhuang County exhibit the lowest indices. In the spatial dimension, Wulingyuan has the highest development index, whilst Mayang County, Longshan County, and Huayuan County demonstrate the lowest development indices. The integration of the three dimensions indicates that locations with elevated economic development indices also exhibit higher social and spatial development indices, demonstrating the significant impact of the economy on society and space.

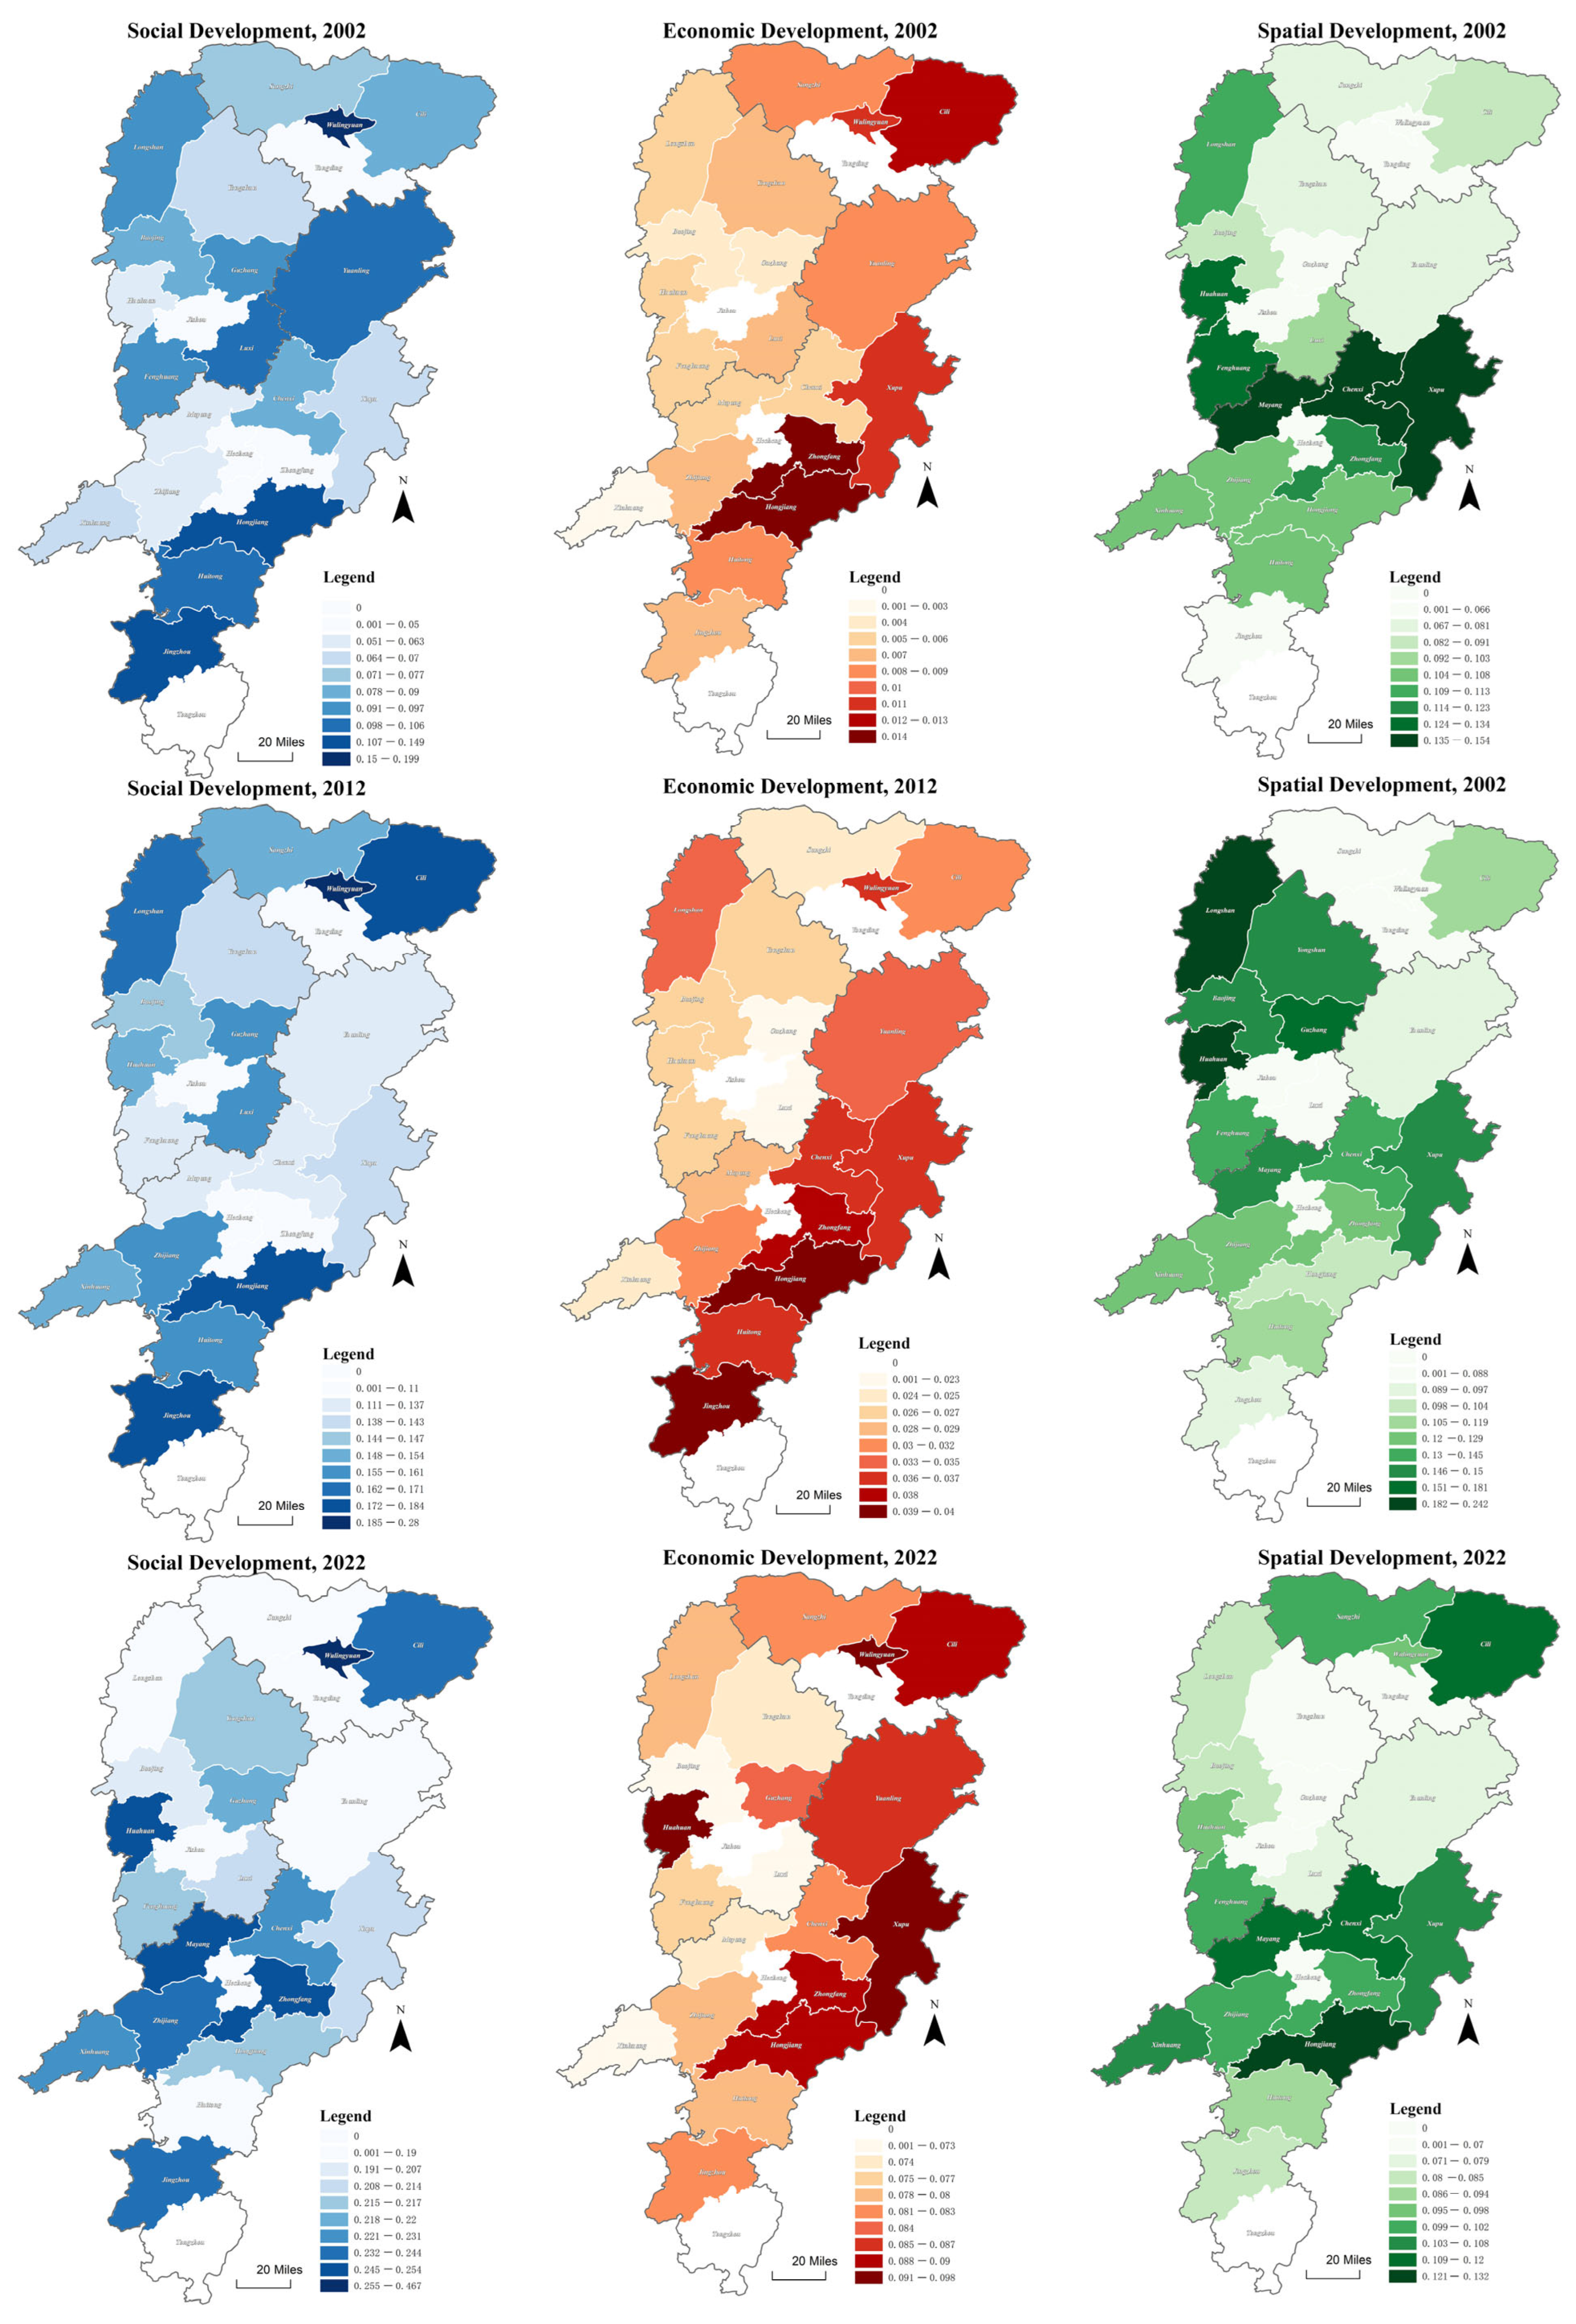
3.1.2. Spatial Evolution Characteristics

(1) The general social development in rural areas is inadequate, with clear regional difference (Figure 3). In 2002, Wulingyuan District had the highest degree of social progress, with an index between 0.150 and 0.199. Subsequently, Hongjiang City and Jingzhou County exhibited indices ranging from 0.107 to 0.149. By 2012, the social development index for rural regions in western Hunan had increased, with Cili County, Sangzhi County, and Longshan County exhibiting more vigorous performance, but Wulingyuan District retained the best ranking. By 2022, the social development index significantly improved, and social engagement expanded from north to south, with the highest-ranking counties remaining constant. The subsequent highest districts are situated adjacent to municipal districts, including Cili County in Zhangjiajie City, Huayuan County in Xiangxi Prefecture, and Zhongfang County, Zhijiang County, Mayang County, and Chenxi County in Huaihua City. Other districts possess marginally lower social development indices; however, they have nevertheless undergone considerable growth.
(2) Rural economic index growth, regional differences (Figure 3). In 2002, the Xiangxi region county rural economic development level is low, the economic index is located in the range of 0.001–0.014, and the economic development index of Hongjiang City and Zhongfang County is higher, but the highest value still did not reach 0.015, reflecting that the region’s rural economy is in the low speed of the level of homogeneous development. By 2012, the economic development index had improved, with better values in the districts and counties situated in the eastern part of western Hunan, forming a belt. However, due to the low initial conditions, the overall development remains at a modest level. By 2022, the extent of rural economic growth at the county level has significantly improved, yet there are substantial regional disparities in development. The Wulingyuan District adjacent to the municipal area, along with Huayuan County and Xupu County in proximity to the municipal area, are designated as high-value regions, with the regional rural economic development index ranging from 0.091 to 0.098. Conversely, Zhangjiajie City and Huaihua City, along with the surrounding municipal area, represent the next tier of high-value areas, with an index range from 0.085 to 0.090.
(3) The extent of rural space utilization has remained relatively stable, exhibiting a pattern of initial increase followed by a decline (Figure 3). In 2002, rural space use in counties of western Hunan was generally low, except for Fenghuang, Mayang, Zhongfang, and Xupu counties, which exhibited a spatial utilization index ranging from 0.124 to 0.154, while the remaining counties had an index below 0.124. Furthermore, the periphery regions of the municipal jurisdiction of Zhangjiajie City exhibit relatively low utilization of rural space. In 2012, the space utilization index of rural areas in counties in western Xiangxi region has been greatly improved, and the development trend of differentiation has been revealed: Longshan County and Fenghuang County have the highest space utilization indexes, which are in the range of 0.182–0.243, followed by the municipal districts of Xiangxi Prefecture, and districts and counties around the municipal districts of Huaihua City, with the indexes located in the range of 0.130–0.181. Rural space utilization in the remaining counties has improved but remains at a low level. In 2022, the spatial utilization index is inferior to that of 2012, with the lowest indices seen in the districts and counties around the municipal area of Xiangxi Prefecture, as well as Jingzhou County and Tongdao County, ranging from 0.001 to 0.085. The districts and counties surrounding the municipal area are highly populated, exhibiting extensive land development and utilization. Conversely, isolated districts and counties exhibit low population density and face resource and environmental limitations, resulting in inefficient land use.

3.2. Analysis of Socio-Economic-Spatial Coupling Degree and Coupling Coordination Degree

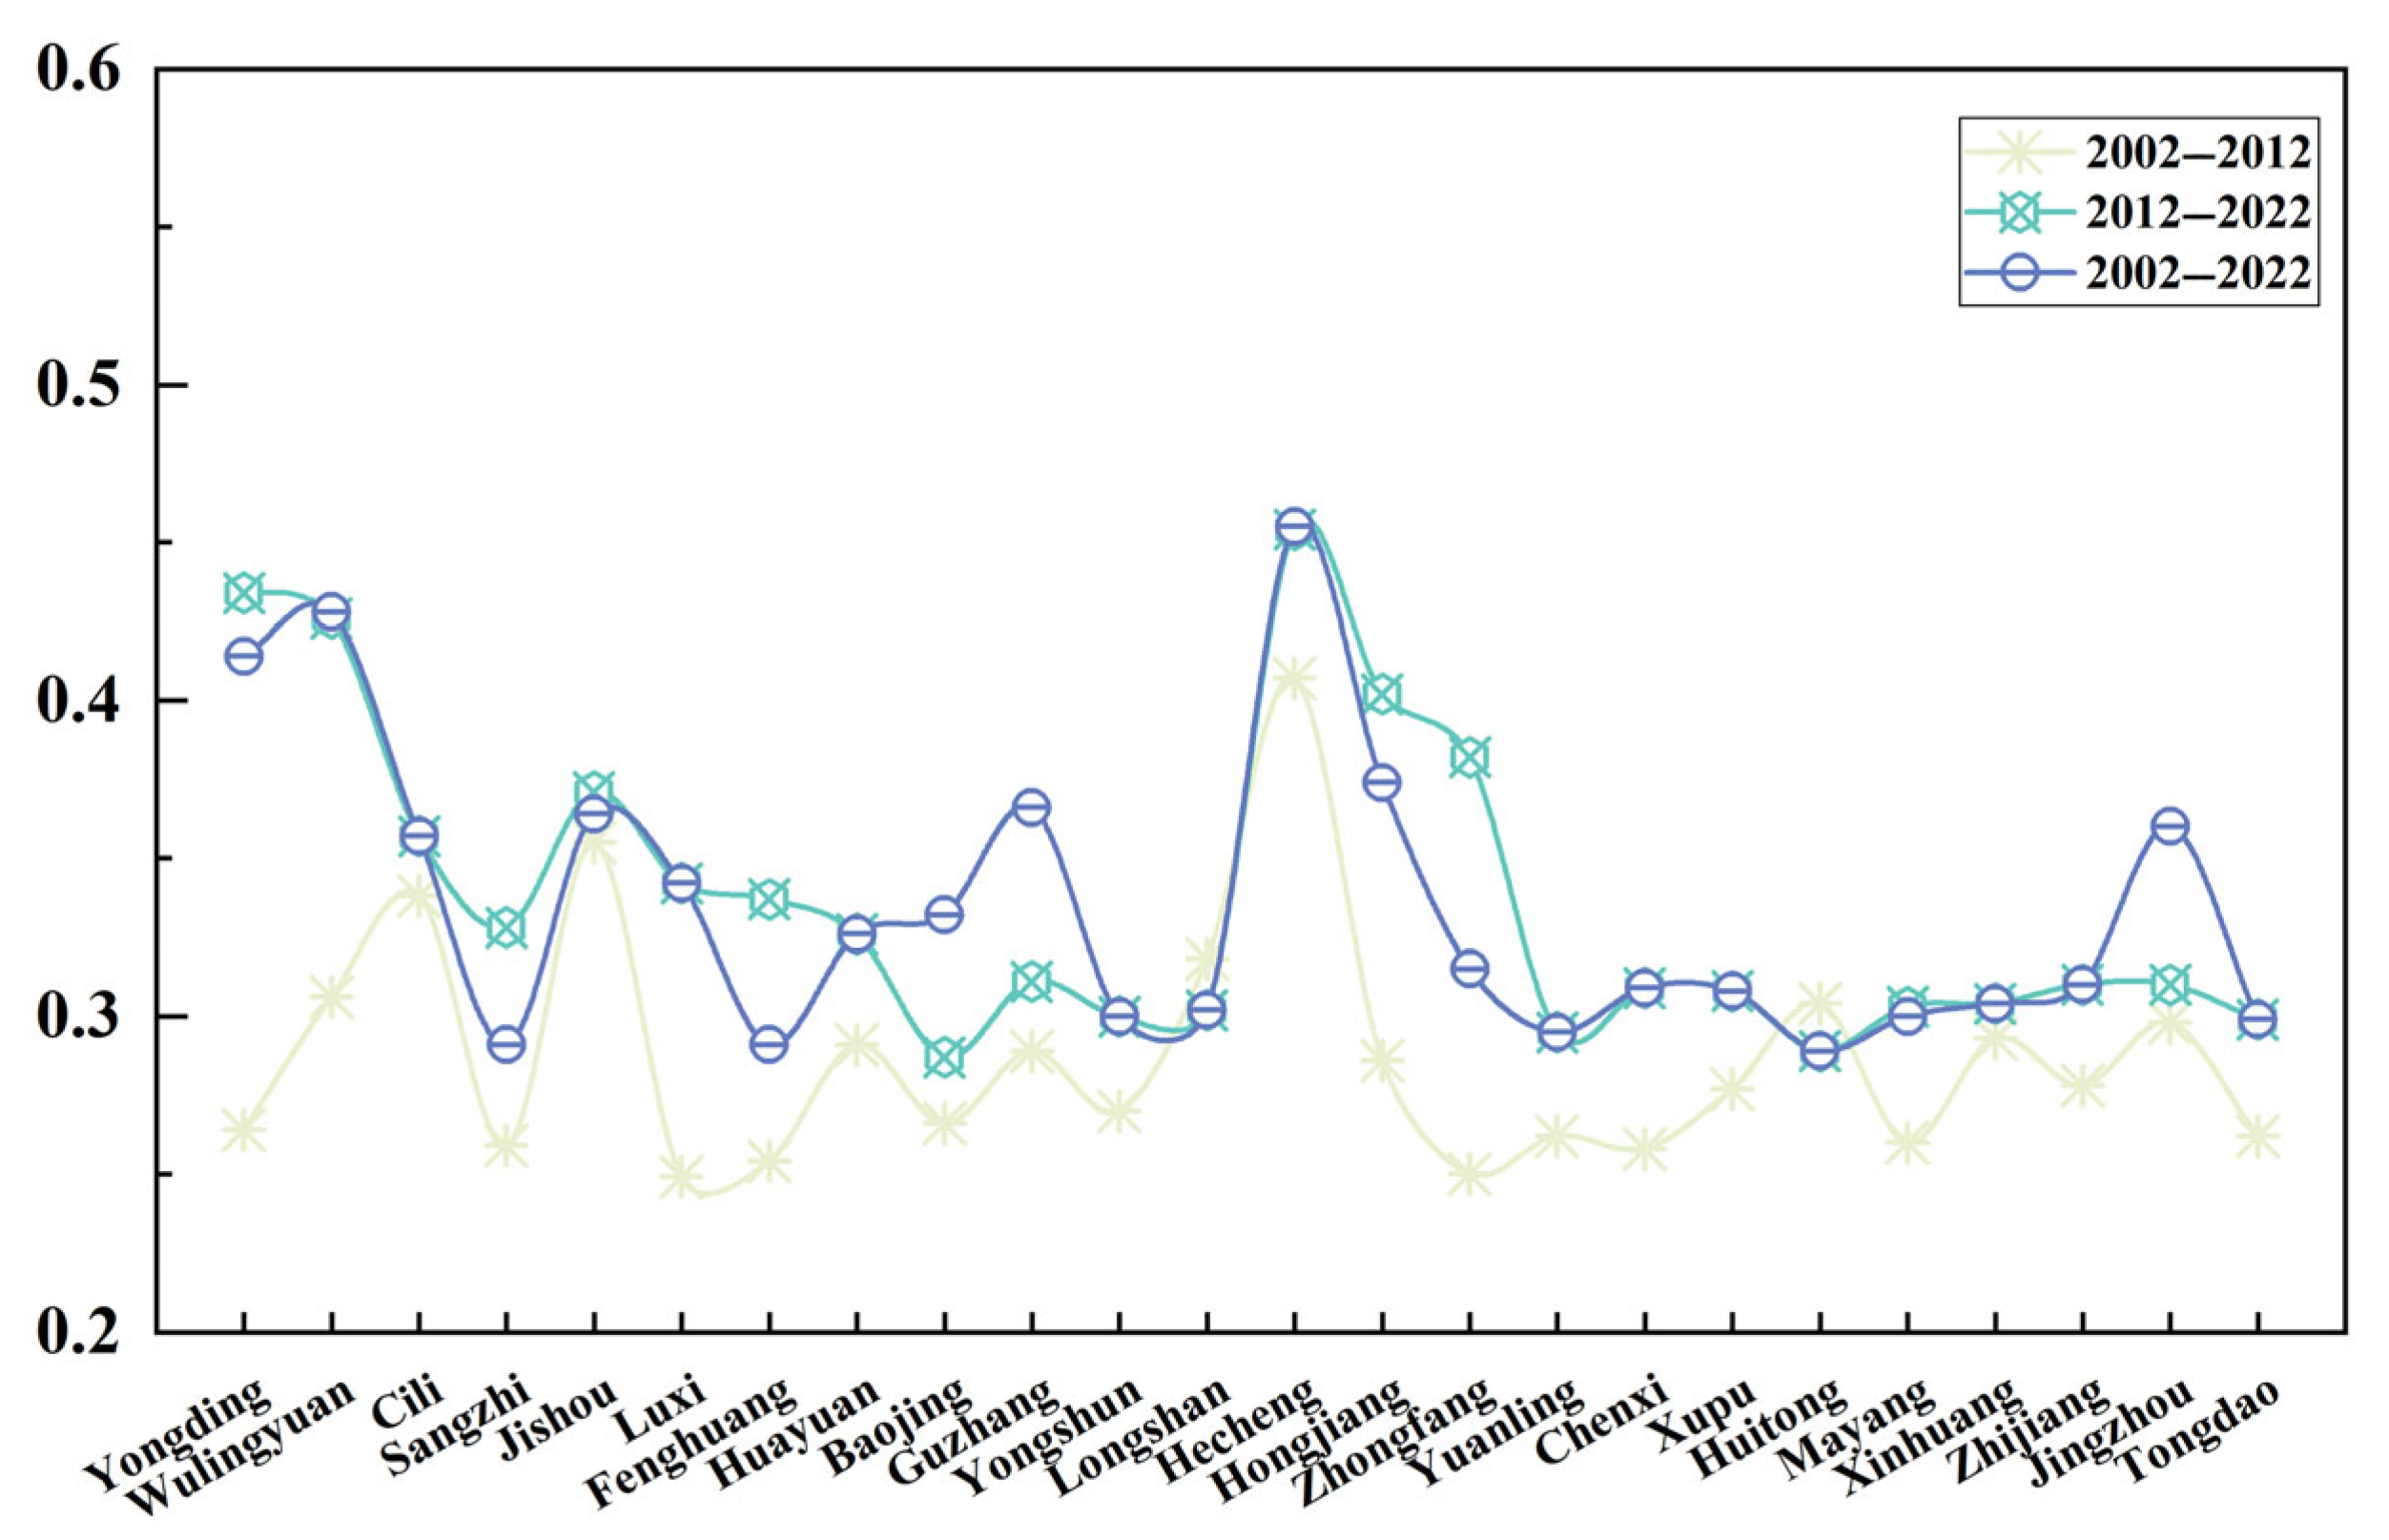
3.2.1. Reconfiguration Analysis

(1) Social reconstruction. The average social reconstruction intensity for the three study periods was 0.139, 0.225, and 0.306, respectively. One-third of the counties exhibited a rural reconstruction intensity exceeding the mean value from 2002 to 2012, with regions surpassing the mean predominantly situated near the municipal districts of Jishou City, Wulingyuan District, and adjacent municipal districts, as well as along the provincial boundary with southwestern Xiangxi (Figure 4). Between 2002 and 2022, 30.43% of districts and counties exhibited rural social reconstruction index values exceeding the mean. The heterogeneous characteristics of reconstruction are evident: the distribution of areas with elevated mean values remains largely stable, particularly in Wulingyuan District, while the second-highest value areas are predominantly located in Jishou City, Huayuan County, Xinhuang County, and Guzhang County. Conversely, the intensity of social reconstruction in Huitong County, Sangzhi County, Yuanling County, and Baojing County is comparatively low.
(2) Economic reconstruction. The average values of the economic reconstruction index over the three research periods are 0.019, 0.081, and 0.086, respectively. From 2002 to 2012, 45.83% of districts and counties exhibited reconstruction indices exceeding the mean value, with high mean values predominantly located in Wulingyuan District, Hongjiang City, and Zhongfang County. From 2012 to 2022, this figure increased to 54.17%, with Wulingyuan District, Huayuan County, and Xupu County identified as the districts and counties with elevated values. Over the long term, the developmental trajectory from 2002 to 2022 mirrors that from 2012 to 2022, exhibiting a general rise in the rural economy reconstruction index; however, merely 25.00 percent of districts and counties possess a rural economy reconstruction index with a mean value between 0.001 and 0.074. Zones of significant economic reconstruction encompass Wulingyuan District, Huayuan County, and Xupu County, but the secondary high-value zones are more dispersed, mostly comprising Zhongfang County, Hongjiang City, Cili County, and Yuanling County (Figure 4). The rural economic reconstruction index in the western Hunan region from 2002 to 2022 is consistently low with minimal variation, and the spatial distribution of high-value districts and counties remains largely stable, situated near the municipal districts. The spatial distribution of low-value districts remains reasonably stable and is situated at a considerable distance from municipal jurisdictions, including Tongdao County and Xinhuang County.
(3) Spatial reconstruction. The intensity of rural spatial reconstruction was minimal, with mean spatial reconstruction index values for the three time periods recorded at 0.104, 0.055, and 0.062, respectively. Between 2002 and 2012, the rural spatial reconstruction index for the majority of districts and counties in western Hunan was below 0.104, with only 29.17% of these areas surpassing the average rural reconstruction index, indicating that most districts exhibited a low spatial reconstruction index (Figure 4). Between 2012 and 2022, the percentage of spatial reconstruction indices surpassing the mean value rose to 41.67%, indicating a trend towards heterogeneity in spatial reconstruction, with high-value areas predominantly in Hongjiang City, followed by Wulingyuan District, Zhongfang County, Fenghuang County, and Sangzhi County as the next highest-value regions. From 2002 to 2022, the spatial reconstruction index exhibited improvement, with 45.83 percent of districts and counties surpassing the mean index value; however, the quantity of districts with elevated reconstruction indexes was limited, predominantly located in Wulingyuan District, Jingzhou County, and Hongjiang City.

3.2.2. Coupling Analysis

The socio-economic-spatial coupling degree was computed in conjunction with the coupling degree model, and spatial distribution maps were generated for three distinct time periods (Figure 5). The findings indicate that the average coupling degree from 2002 to 2012 is 0.773, with a standard deviation of 0.095 and a coefficient of variation of 0.123. Districts and counties exhibiting elevated coupling degrees are concentrated in the central area of western Hunan, notably Zhongfang County, which possesses the highest coupling degree of 0.902, followed by Xupu, Yuanling, and Chenxi counties with coupling degrees of 0.880, 0.879, and 0.867, respectively. Huayuan County, Sangzhi County, Wulingyuan, and Yongding District, situated in the northern section of western Hunan, have lower coupling degrees, recorded as 0.663, 0.643, 0.510, and 0.496, respectively. The average coupling degree from 2012 to 2022 is 0.774, with a standard deviation of 0.095 and a coefficient of variation of 0.122. Higher coupling degrees are dispersed in a fragmented fashion throughout lower districts and counties, exhibiting a more uniform distribution. The maximum coupling degree is 0.948 in Sangzhi County, succeeded by 0.931 in Hongjiang City, 0.908 in Fenghuang County, and 0.881 in Cili County. The counties with the lowest coupling degrees are Xinhuang County (0.638), Jishou City (0.602), Wulingyuan (0.600), and Mayang County (0.590). The mean coupling degree, standard deviation, and coefficient of variation from 2002 to 2022 are 0.779, 0.101, and 0.129, respectively. The high degree of coupling is both centrally and serially distributed, primarily in the northern regions of Cili County (0.881) and Sangzhi County (0.844), the central areas of Yuanling County (0.853), Guzhang County (0.852), and Baojing County (0.911), and the southern locales of Jingzhou County (0.911), Huitong County (0.855), and Hongjiang City (0.884). The allocation of districts and counties exhibiting low coupling is more scattered, including Huayuan County, Xinhuang County, Hecheng District, Wulingyuan, and Jishou City, with coupling degrees of 0.666, 0.638, 0.625, 0.604, and 0.516, respectively.
Due to the inability of the coupling degree to differentiate between low and high reconstruction strength, the degree of coordination model was utilized to assess the level of socio-economic-spatial coordination (Figure 6). Between 2002 and 2012, the average degree of coordination was 0.278, with a standard deviation of 0.039 and a coefficient of variation of 0.041. The counties exhibiting greater levels of collaboration were Hecheng District, Jishou City, Cili County, Longshan County, and Wulingyuan District. The coordination coefficients are 0.407, 0.355, 0.338, 0.318, and 0.306, respectively. A greater number of counties exhibit a low degree of coordination, representing 47.62 percent of the total. Luxi County has the lowest level of coordination, evidenced by a D-value of 0.249, succeeded by Zhongfang County at 0.250, Fenghuang County at 0.254, Chenxi County at 0.258, and Sangzhi County at 0.259. Between 2012 and 2022, the average degree of coordination was 0.309, with a standard deviation of 0.056 and a coefficient of variation of 0.180. The number of districts and counties exhibiting a high degree of coordination is limited to Hecheng District, Yongding District, Wulingyuan, Hongjiang City, and Zhongfang County, with D-values of 0.454, 0.434, 0.426, 0.402, and 0.382, respectively. Only five counties and districts exhibit a medium level of coordination: Jishou City at 0.371, Cili County at 0.357, Luxi County at 0.342, Fenghuang County at 0.337, and Sangzhi County at 0.328. The counties exhibiting cooperation below 0.3 include Channel County, Yuanling County, Huitong County, and Baojing County. Between 2002 and 2022, the average degree of coordination was 0.317, with a standard deviation of 0.049 and a coefficient of variation of 0.153. The districts exhibiting a high degree of coordination are limited to Hecheng District, Wulingyuan District, and Yongding District, which have D-values of 0.455, 0.428, and 0.414, respectively. The six districts and counties exhibiting a significant level of sub-coordination, in order, are Hongjiang City, Guzhang County, Jishou City, Jingzhou County, Cili County, Luxi County, and Baojing County. The districts and counties exhibiting low coordination (0.001–0.326) are dispersed irregularly, comprising 66.66% of the total. Notable examples include Huitong County with a D-value of 0.289, Fenghuang County with a D-value of 0.291, Sangzhi County with a D-value of 0.291, and Yuanling County with a D-value of 0.295. The findings indicate that the average degree of coordination progressively rises over time; nonetheless, the level of coordination remains low.

3.2.3. Coupled Coordination Degree Space Markov Chain Analysis

This study employs the spatial Markov chain method to analyze the transfer probabilities of regional states across various temporal scales (T = 10, T = 20) in the rural villages of Xiangxi County, thereby elucidating the transfer characteristics of inter-regional coupling coordination in diverse spatial neighborhood environments (Figure 7).
(1) Short- to medium-term spatial Markov chain analysis (T = 10). The analysis of the state transfer probability matrix for spatial lag types I and II reveals that when the initial coordination degree of counties and districts in the western Hunan region is low (state I), a significant positive spatial spillover effect exists from neighboring regions with higher coordination levels. The likelihood of transitioning from low to medium-high coordination (state III) attains 50.0% when adjacent to a type I spatial neighborhood, and 44.44% when adjacent to a type II neighborhood, indicating that low-coordination areas can substantially benefit from the advancement of neighboring regions. Spatial lag types III and IV demonstrate a distinct state-locking phenomenon.
The likelihood of a high level of coordination (state IV) region sustaining the status quo in type I, III, and IV neighborhood contexts is 100%, indicating exceptional stability. Simultaneously, the transfer probability in regions with a medium degree of coordination (states II and III) within type III and IV neighborhoods is minimal, resulting in a rather stable state for these regions.
(2) Long-term spatial Markov chain analysis (T = 20). The spatial neighborhood effect is more pronounced over the long term. From the perspective of spatial lag type I, areas with low coordination levels transition to a balanced distribution of medium-low, medium-high, and high coordination levels, each with a transfer probability of 33.33%. This illustrates the substantial diffusion of the long-term neighborhood’s facilitating effect. Moreover, within the spatial neighborhood environment of type II, the low-coordination zone exhibits a distinct trend of increased coordination levels, focusing on the transition among low, medium, and high coordination statuses.
Nonetheless, under prolonged observation, spatial lag types III and IV exhibit a clear steady state or spatial locking effect on the degree of regional coordination, with the transfer probability of each state approaching zero. This indicates that the degree of regional coordination is likely to remain static in these neighboring environments, making it challenging to enhance coordination in western Hunan.
(3) Synthesis, Analysis, and Policy Implications. Spatial Markov chain research across several temporal scales demonstrates that the spatial neighborhood environment significantly influences the dynamic evolution of interregional coupling coordination.

3.2.4. Multiple Stepwise Regression Analysis

According to the findings from the coordination degree study, multiple stepwise regression was employed, with the results presented in Table 2. X2 (rural population change rate), X8 (rate of change in cropland), and X10 (population density in rural areas) are the principal determinants of the spatial coupling coordination degree of rural socio-economics in the western Hunan region across the three study periods. During the periods of 2002–2012 and 2012–2022, the principal determinants of the coupling coordination degree include X1 (urbanization rate), X4 (gross output value of agriculture, forestry, animal husbandry and fisheries), and X6 (disposable income per capita of permanent residents in rural regions). Additionally, the dominant factors for the coupling coordination degree from 2002 to 2022 also encompass X3 (gross fixed investment rate) and X9 (per capita rural housing area).
According to data released by the National Bureau of Statistics of the People’s Republic of China, the per capita disposable income of rural residents nationwide reached CNY 20,133 in 2022. In contrast, the figure for rural permanent residents in Xiangxi was only CNY 13,805, notably below the national rural average, reflecting the region’s developmental lag. The underdevelopment of impoverished ethnic minority areas can be attributed to several interrelated factors. First, geographic marginalization and spatial isolation play a critical role. Many ethnic minority villages are located in mountainous regions with poor transportation and weak infrastructure, which significantly constrain their access to economic opportunities. Second, cultural and institutional mismatches hinder integration. In some minority areas, differences in language, education, and lifestyle norms create barriers to labor market participation and reduce the effectiveness of policy implementation. Third, limitations in resource utilization and land tenure systems are prominent. Ethnic regions often face fragmented landholdings and low agricultural land-use efficiency, which undermine the sustainability of the rural economy. Finally, disparities in policy coverage and local implementation capacity persist. Despite long-standing preferential support from the central government, issues such as weak grassroots governance, inefficient fund utilization, and inadequate industrial support systems frequently result in difficulties in translating policies into tangible outcomes. Thus, the multi-ethnic character of these regions, while culturally rich, has to some extent exacerbated regional development imbalances and constitutes an important contextual variable influencing the coordinated development of rural social-economic-spatial systems.

3.3. Analysis of the Degree of Coupled Socio-Economic-Spatial Barriers

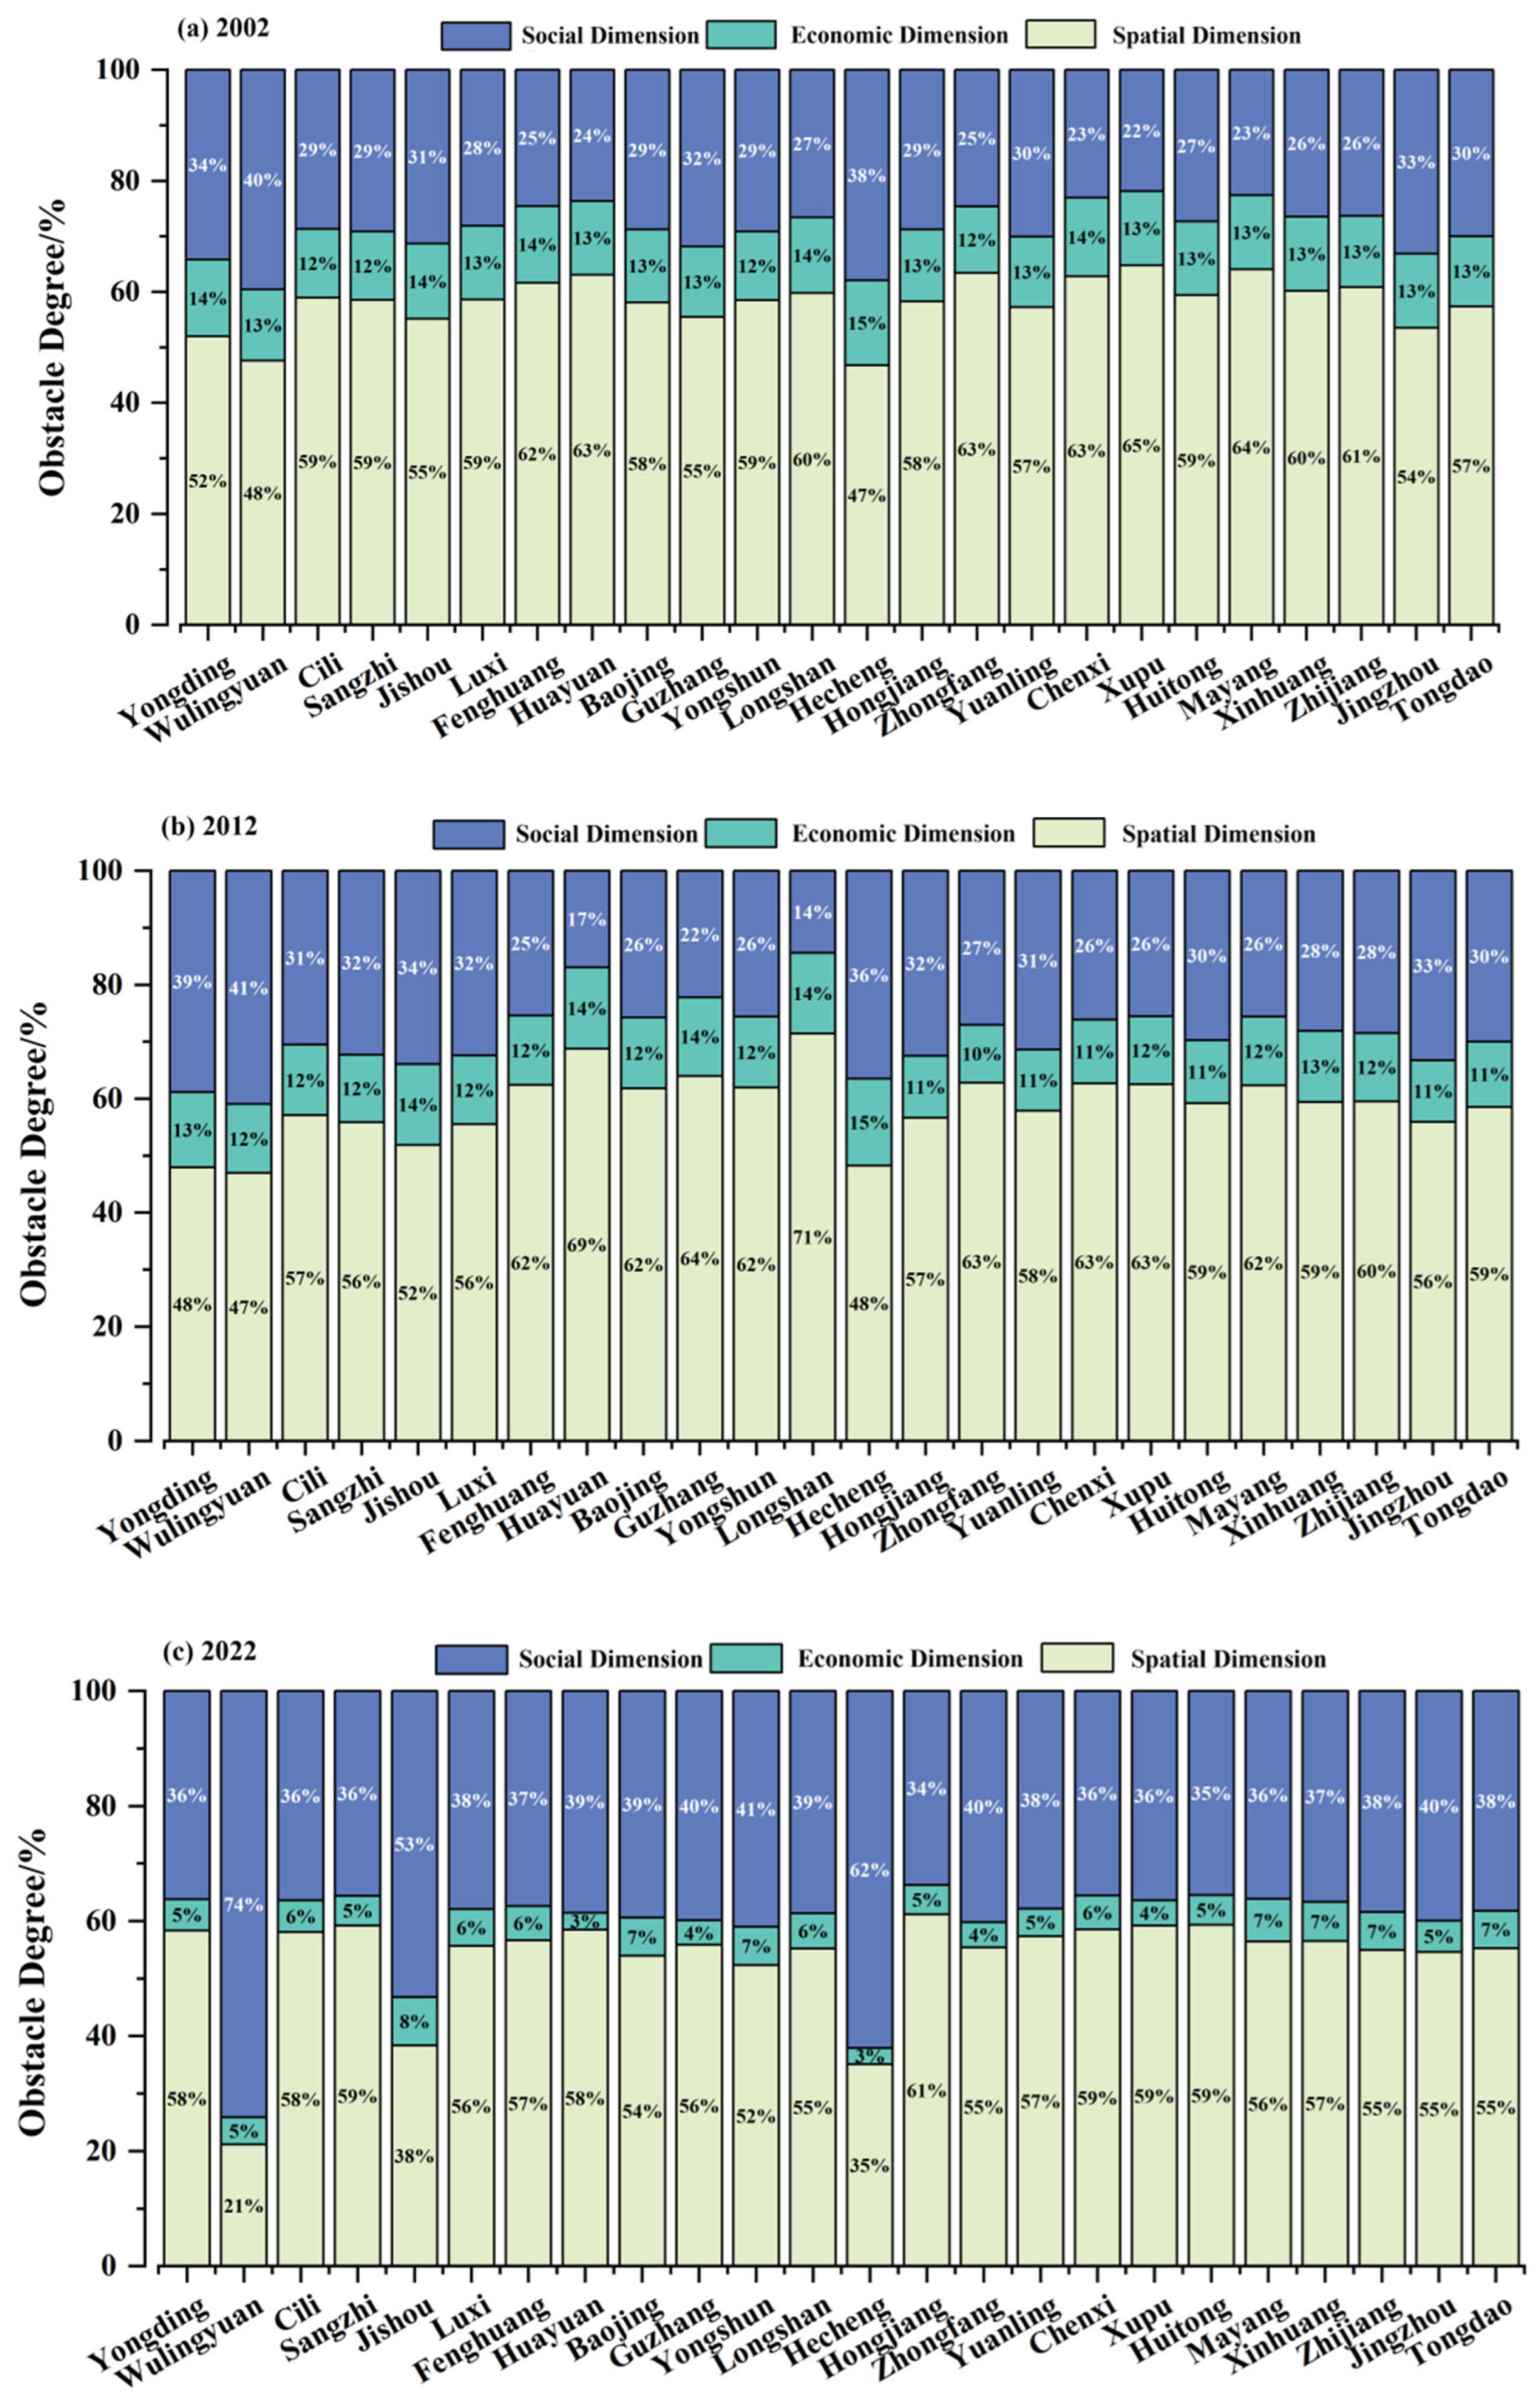
3.3.1. Analysis of Barrier Factors at the Normative Level

Figure 8a–c illustrate the barrier degree of the guideline layer for counties and districts in the western Hunan region for the years 2002, 2012, and 2022, respectively. Figure 8 illustrates that the primary impediment to sustainable rural socio-economic-spatial development in the counties and districts of the western Hunan region is consistently the social dimension, with its level of obstruction generally exhibiting a trend of initial increase followed by a decrease. In 2002, the initial average obstacle degree of the social dimension in rural areas of counties and districts in the western Hunan region was 58.21 percent, with Xupu County exhibiting the highest obstacle degree at 65 percent, while Hecheng District recorded the lowest at 47 percent. The mean hurdle degree for spatial and economic dimensions is 28.71% and 13.13%, respectively. In the spatial dimension, Wulingyuan District exhibits the highest obstacle degree at 40%, while Xupu County displays the lowest at 22%. In the economic component, both Hecheng Districts surpass other counties and districts by 15 percent. By the midpoint of the study (2012), the average barrier degree of the social dimension rose from 58.21% to 58.88%, indicating a marginal increase, whereas Longshan County’s barrier degree escalated from 60% to 71%. The impediments in the economic sector diminished considerably, thereby alleviating the limitations on the socio-economic-spatial sustainable development of rural villages in the counties and districts of western Hunan. By the conclusion of the study (2022), the social dimension remains the predominant impediment to the socio-economic-spatial development of rural villages in counties and districts; however, the severity of this obstacle has diminished from 58.88% to 53.54%. Notably, Hongjiang City exhibits the most significant challenge in the social dimension at 61%. Sangzhi County, Chenxi County, Xupu County, and Huitong County exhibit identical levels of impediments, each at 59%. The spatial dimension has increasingly emerged as a significant impediment to the development of counties and districts, with Wulingyuan and Hecheng District exhibiting substantial spatial dimension obstacles of 74 percent and 62 percent, respectively, while Hongjiang City presents the least spatial dimension obstacle at 34 percent. The average impediment degree of the economic dimension has persistently declined to 5.54%. During the study period, the social dimension has served as a constraining factor impacting the socio-economic and spatial sustainable development of rural villages in the counties and districts of western Hunan. The average barrier degree of the social dimension in western Hunan from 2002 to 2022 is 56.88%, while the average barrier degree of the spatial dimension escalates from 28.71% in 2002 to 40.75% in 2022.

3.3.2. Analysis of Indicator Layer Barriers

The barrier degree of the indicator layer is computed using the barrier degree model, and the average barrier degree values for rural socio-economic-spatial development in the counties and districts of the Xiangxi region for the years 2002, 2012, and 2022 are presented in Figure 9. Figure 9 illustrates that the predominant challenges in each county and district during the study period stem from the social dimension, signifying that this aspect has emerged as the principal constraint on rural development in the western Hunan region. With the exception of Wulingyuan District, Jishou City, and Hecheng District, the predominant impediment for all other counties and districts is X1 (urbanization rate). The average degree of obstruction attributed to urbanization rate per capita across the remaining 21 counties and districts is 29.1%, with Huayuan County exhibiting the highest value at 0.33, while Yongding District records the lowest at 23.2%. The primary impediment for Wulingyuan District, Jishou City, and Hecheng District is X8 (rate of change in cropland), with significant obstacles also posed by X1 (urbanization rate) and X3 (gross fixed investment rate). Their development is influenced by the combined effects of spatial and societal factors. The total fixed investment rate (X3) presents a significant barrier across most counties and districts, with Longshan County exhibiting the highest rate and Wulingyuan District the lowest. Longshan County, characterized as a traditional, diminutive, and impoverished mountainous region, receives minimal governmental investment in rural areas, whereas Wulingyuan District, leveraging tourism growth, allocates greater resources to the countryside. Indicators pertaining to the urbanization rate and the rate of change in arable land were present among all significant impediments in the counties and districts of the western Hunan region, signifying that an irrational urbanization rate and alteration of arable land are primary factors obstructing the social, economic, and spatial advancement of rural villages in this area.

4. Discussion

Research indicates that the social, economic, and physical integration and coordination of rural villages in western Hunan have progressively intensified; however, these villages remain comparatively underdeveloped. Current research predominantly examines the social, economic, and spatial dimensions of megacities and big urban areas, while less investigations have been undertaken in outlying counties. Simultaneously, research at the county level predominantly focuses on the social, economic, and spatial dimensions of villages in developed areas, with insufficient investigation into ethnic regions, particularly those that are more underdeveloped. This study refines the evaluation indicators for rural social, economic, and spatial sustainable development, based on the current conditions of rural development and the resource endowment in ethnic areas, and constructs a comprehensive evaluation scale for these three dimensions. The scale system developed in this study elevates rural development from a unidimensional framework to a multidimensional one, enhancing both the breadth and depth of the scale system, broadening the scope of rural social, economic, and spatial development, and ensuring that the indicators for each variable more comprehensively and objectively reflect the characteristics of sustainable development in rural villages within the western Xiangxi region. This study integrates theoretical frameworks from urban and rural planning, geography, economics, and statistics, employing coupling models, coordination models, and spatial Markov chain models to analyze the social, economic, and spatial coupling characteristics of the countryside in the western Hunan region, thereby enhancing the theories and methodologies of rural research. Analysis of the model reveals that the sustainable development index of rural villages in the western Xiangxi region has progressively improved, exhibiting greater heterogeneity, while the coupling and coordination of social, economic, and spatial factors have also increased, albeit remaining relatively underdeveloped. The data and information presented in this work offer a superior reference for social, economic, and spatial research in rural ethnic regions. The research methodology examines the utilization of the coupling model, coordination model, and spatial Markov chain model to assess the social, economic, and spatial attributes of rural regions in ethnic areas, offering a viable quantitative analysis approach for rural studies. The study’s material serves as a reference for examining sustainable rural development in certain regions.
The application of barrier degree models to assess social, economic, and spatial sustainability elements demonstrated comparable levels of influence and rank order convergence. The majority of current research findings regarding obstacle factors are examined from macro perspectives, including land ecology [51], the tourism economic resilience of urban agglomerations [52], water resources [53], urban-rural integration [54], and ecological and economic corridors [55]. In contrast, there is a paucity of studies addressing the meso level of rural areas, resulting in an inadequate comprehensive understanding of the social, economic, and spatial dimensions of the countryside in ethnic regions. Rural society, economy, and geography serve as the foundation for villagers’ habitation in ethnic regions, acting as the primary determinants of sustainable village development. The barrier degree model effectively examines the simultaneous multidimensional effects of obstacles related to rural social, economic, and geographical coupling elements. The study identified the social dimension in the guideline layer as the primary obstacle, succeeded by the spatial dimension and the economic dimension. The study experimentally established that the urbanization rate, total fixed investment rate, and the rate of change in arable land are principal obstacles to the sustainable development of rural areas. The study elucidates the primary and secondary relationships among the factors influencing the impediments to rural social, economic, and spatial sustainable development in ethnic regions, delineates the similarities and differences among these factors, fosters diversification in research pertaining to rural socio-economic and spatial sustainability, and augments the depth of inquiry into rural social, economic, and spatial sustainability.
This study has some limitations. The sustainable development of rural areas, encompassing social, economic, and spatial dimensions, is a multifaceted and systematic challenge that remains in the exploratory phase. It involves economic, social, and ecological factors, and can only be elucidated through existing literature, resulting in the subjectivity of each evaluative criterion. The indicator system is not complete due to the lack of comparability in results across other researchers and the variability of outcomes when the study region or time series is altered. Secondly, owing to the challenges in data acquisition, only objective indicators pertaining to social, economic, and spatial dimensions have been selected to represent the sustainable development of rural areas. Consequently, a quantitative and intuitive analysis of the villagers’ primary role in this development is unattainable. Future research must incorporate data from subjective questionnaires for a more comprehensive analysis. The study area has a pronounced natural geography, disregarding the social, economic, and spatial disparities in the countryside resulting from variations in scale. This paper exclusively examines the Xiangxi county area and does not include comparative analyses with ethnic regions in adjacent provinces. Future research will encompass a broader regional study to offer comprehensive support for the sustainable development of rural areas in ethnic regions, focusing on social, economic, and spatial development. Ultimately, the selection of temporal nodes was limited to cross-sectional data from three specific years: 2002, 2012, and 2022. This approach inadequately examined the developmental trends of the countryside in the Xiangxi region over time and neglected to capture certain potential characteristics associated with specific temporal nodes, warranting further investigation in subsequent research.
Furthermore, although this study develops a social-economic-spatial indicator system grounded in objective data—suitable for quantitative modeling and statistical analysis—it is important to acknowledge that rural development is a complex and socially embedded process. Subjective perceptions, local participation, and place-based experiential knowledge play equally critical roles. The current analysis does not incorporate the perspectives, behavioral patterns, or development aspirations of key actors such as local residents and grassroots governance bodies. As a result, it falls short in capturing the dynamic human feedback mechanisms that are central to rural social systems. Future research would benefit from integrating qualitative methods—such as semi-structured interviews, participatory rural appraisal, and household surveys—to enrich the construction logic of the indicator system and enhance both the empirical validity and policy applicability of the results.
Lastly, while this study adopts sustainable development as its core analytical lens, the inclusion of ecological and environmental variables remains limited. This is primarily due to the relative ecological and climatic homogeneity within Xiangxi’s rural areas, which reduces spatial variability and limits the explanatory power of ecological indicators in distinguishing development disparities. However, as research evolves toward more fine-grained analyses, incorporating variables such as localized ecological changes, natural disaster risks, and biodiversity will be of increasing relevance. Such additions will support the development of a more robust and comprehensive framework for evaluating sustainable rural development.

5. Conclusions

This paper identifies 10 indicators pertaining to urbanization, demographic characteristics, industrial development, and alterations in arable land to elucidate the social, economic, and spatial dimensions of the countryside, along with its physical environment. The attributes of rural social, economic, and spatial sustainable development patterns, along with the coupling and coordination relationships among 24 districts and counties in western Hunan for the years 2002, 2012, and 2022, are assessed, and the impediments to sustainable development are examined. The principal conclusions are as follows:
(1) The rural development in the western Hunan region has progressed at three intervals: 2002, 2012, and 2022, exhibiting notable variations and spatial disparities in social, economic, and spatial variables. The disparities in social development over the study period are minimal, with elevated average values in the districts and counties adjacent to the urban center and comparatively lower values in rural regions. The spatial distribution of counties exhibiting high and low economic development levels is notably steady, characterized by elevated mean values in the eastern segment of the Xiangxi region and diminished values in the western segment. The spatial distribution of counties exhibiting high and low levels of spatial utilization is relatively steady, characterized by elevated mean values in the center region of western Hunan and diminished mean values in the northern and southern areas of the region. This result confirms Hypothesis 1, indicating that the overall level of rural development at the county scale in Xiangxi exhibited an upward trend from 2002 to 2022, accompanied by increasingly pronounced regional disparities.
(2) Throughout the study period, the social, economic, and spatial coupling of rural villages in the western Hunan region has intensified to varying extents. From 2002 to 2012, areas with high coupling were predominantly located in the central region of western Hunan, while from 2012 to 2022, the coupling exhibited both higher and lower levels in a more dispersed distribution across districts and counties, resulting in a more uniform distribution overall. The high coupling degree shows a concentrated and continuous distribution from 2002 to 2022. In addition, the mean value of coordination gradually increases over time, but the level of coordination is not high. This finding supports Hypothesis 2, suggesting that significant disparities exist in the degree of coupling and coordination among the rural social, economic, and spatial systems across different counties in Xiangxi. Moreover, these disparities exhibit dynamic patterns of evolution over time.
(3) The investigation utilizing the obstacle degree model reveals both consistency and discrepancies in the variables impeding the social, economic, and geographical sustainable development of rural villages in western Hunan. The criterion level analysis indicates that the social and spatial dimensions are categorized at medium and high barrier levels, whilst the economic component is classified at very low and low barrier levels. As economic development progresses, the challenges associated with the social and economic dimensions have diminished; however, the challenges related to the geographical dimension have correspondingly escalated. The examination of the obstacle level for each indicator reveals that the urbanization rate, total fixed investment rate, and arable land change rate are the three primary obstacle factors in the majority of counties and cities. Factors such as the per capita disposable income of rural permanent inhabitants and rural population density are more prevalent. This result confirms Hypothesis 3, indicating that the obstacles to sustainable development in Xiangxi exhibit distinct temporal evolution patterns and a hierarchical structure of influence. These findings offer practical guidance for the formulation of more targeted and context-sensitive policy interventions.

Author Contributions

Writing—review and editing, writing—original draft, formal analysis, data curation, methodology, conceptualization, C.T.; writing—review and editing, formal analysis, software, visualization, T.Q.; formal analysis, writing—review and editing, S.H.; writing—review and editing, W.Z.; writing—review and editing, H.Z.; writing—review and editing, Y.L. All authors have read and agreed to the published version of the manuscript.

Funding

The Humanities and Social Science Research Youth Fund Project of Ministry of Education (23YJC850017); The Philosophy and Social Science Foundation Project of Hunan Province (22YBA089).

Institutional Review Board Statement

Not applicable.

Informed Consent Statement

Not applicable.

Data Availability Statement

The data that support the findings of this study are available from the corresponding author upon reasonable request. Due to ongoing related research, the data are not publicly available at this time.

Conflicts of Interest

The authors declare that they have no known competing financial interests or personal relationships that could have appeared to influence the work reported in this paper.

References

  1. Shao, C.F.; Zhan, X.S.; Chen, S.H. Evaluation index system of rural sustainable development based on SDGs. China Popul. Resour. Environ. 2023, 33, 21–31. [Google Scholar] [CrossRef]
  2. Yan, S.M.; Wen, J.; Growe, A.; Wand, A. Rural Strategy Transferring and Policy Making Towards Sustainable Development Goals: Taking the European Countries as Examples. Urban Plan. Int. 2024, 39, 10–23+41. [Google Scholar] [CrossRef]
  3. Lu, T.H.; Yu, T. Reconstruction of rural social space in tourist destinations based on social network analysis: A case study of Shiwa Beautiful village, Nanjing city. Sci. Geogr. Sinica. 2020, 40, 1522–1531. [Google Scholar] [CrossRef]
  4. Tu, S.S.; Zheng, Y.H.; Long, H.L.; Wan, S.M.; Liang, X.L.; Wang, W. Spatio-temporal pattern of rural development and restructuring and regional path of rural vitalization in Guangxi, China. Geogr. Res. 2020, 75, 365–381. [Google Scholar] [CrossRef]
  5. Yu, B.; Li, Y.Y.; Zhu, Y.Y.; Zhuo, R.R.; Zeng, J.X. Characteristics and regional model of rural restructuring in main agricultural production regions in Central China:A case study of Jianghan Plain. J. Nat. Resour. 2020, 35, 2063–2078. [Google Scholar] [CrossRef]
  6. Hu, S.; Yu, B.; Wang, M. Rural restructuring and transformation: Western experience and its enlightenment to China. Geogr. Res. 2019, 38, 2833–2845. [Google Scholar] [CrossRef]
  7. Long, H.L.; Tu, S.S. Theoretical thinking of rural restructuring. Prog. Geogr. 2018, 37, 581–590. [Google Scholar] [CrossRef]
  8. Zou, Y.N.; Cheng, Q.P.; Ren, Y.T.; Jin, H.Y. Analysis of water-food-energy-ecological-environment coupling coordination and influencing factors at Lincang City of Yunnan Province based on sustainable development goals. Bull. Soil Water Conserv. 2023, 43, 185–195. [Google Scholar] [CrossRef]
  9. He, S.K.; Shuai, X.Y. Research on empowering coordinated development of “water resources-social economy” inYangtze River Economic Belt through environmental regulation. Yangtze River 2024, 55, 44–50. [Google Scholar] [CrossRef]
  10. Hao, Z.J.; Wen, Q.; Shi, L.N.; Wu, X.Y.; Ding, J.M. Spatial Network Analysis of Coupling Coordination Between Social Economy and Eco-Environment in Yellow River Basin Urban Agglomerations. Econ. Geogr. 2023, 43, 181–191. [Google Scholar] [CrossRef]
  11. Zhai, Y.K.; Li, Y.L.; Shen, H.O.; Che, X.C. Spatial autocorrelation patterns and influencing factors of soil and water loss and socio-economic development in Jilin Province. Bull. Soil Water Conserv. 2024, 44, 144–151. [Google Scholar]
  12. Li, K.K.; Zhou, Z.H.; Wang, Z. Analyzing socio-economic spatial factors driving soil erosion in China based on multi-scale geographically weighted regression model. J. Huazhong Agric. Univ. 2024, 43, 29–38. [Google Scholar] [CrossRef]
  13. Gao, H.J.; Han, H.Q.; Yu, H.Y.; Han, M.R. Spatial Correlation of Socideconomic Factors and Ecosystem Service Values in Guizhou Province. Res. Soil Water Conserv. 2016, 23, 262–266. [Google Scholar] [CrossRef]
  14. Jiang, X.J.; Wang, Y.J.; Chen, X.P.; Zhang, Z.L. Temporal and Spatial Evolution Analysis of the Coupling and Coordination Among Population, Economy, Space, and Urbanization. J. Lanzhou Univ. Soc. Sci. 2015, 43, 63–71. [Google Scholar] [CrossRef]
  15. Jin, M.J. Coupling Coordination Analysis of Population-Economy-Space-Social Urbanization in Shanxi Province. Sci. Technol. Manag. Land Resour. 2018, 35, 107–115. [Google Scholar]
  16. Wang, H.; Wang, C.X. Study on the coordinated development of economy-population-society-space urbanization in central China: Taking Hubei province as an example. Hubei Agric. Sci. 2019, 58, 137–141. [Google Scholar] [CrossRef]
  17. Li, H.J.; Qu, J.S.; Pang, J.X.; Xu, L.; Han, J.Y. Spatial-temporal synthetic measurement of coupling coordination and sustainable development of population-economy-society-resource environment system in Gansu Province. Arid. Land Geogr. 2020, 43, 1622–1634. [Google Scholar]
  18. Jiang, Z.Y.; Zhou, J.W.; Zhao, Y. Study on the Time and Space Coupling and Coordination Relationship of Agricultural Economy-Society-Ecological Modernzation in Central China Under the Background of Rural Revitalization. Chin. J. Agric. Resour. Reg. Plan. 2021, 42, 99–108. [Google Scholar]
  19. Liu, Z.W.; Zheng, Y.; Li, Z.H.; Zhang, S.Q.; Yang, H.; Sang, X.F. Evaluation on water resources-economy-population matching degree from perspectiveof spatial equilibrium. Yangtze River 2023, 54, 31–39. [Google Scholar] [CrossRef]
  20. Cui, J.; Li, X.T.; Chu, N.C. Coordination Research of High-Speed Rail Accessibility and Economic-Social Development Level in Less Developed Areas. Econ. Geogr. 2020, 40, 43–51. [Google Scholar] [CrossRef]
  21. Yu, R.L.; Liu, C.L.; Xiong, J.P.; Zeng, J.X. The Coupling Evolvement of ERE Composite System on Wuhan Metropolitan Area. Econ. Geogr. 2012, 32, 120–126. [Google Scholar] [CrossRef]
  22. Jiang, L.; Zhou, H.F.; Bai, L. Spatial Differences in Coupling Degrees of Economy, Urbanization, Social Security and Eco-environment in the Middle Reaches of Yangtze River. Resour. Environ. Yangtze Basin 2017, 26, 649–656. [Google Scholar]
  23. Zheng, Y.F. Evaluation and Spatial Characteristics of the Economic and Social-Development in the Three Gorges Reservoir Area in Chongqing. J. Yangtze Norm. Univ. 2021, 37, 11–21. [Google Scholar] [CrossRef]
  24. Wei, F.W.; Huang, J.; Zhu, H.F. The correlation analysis for the coupling coordinative degree of tourism-economic-ecological environment on provincial region—Take Guangxi as an example. J. Northwest Norm. Univ. Nat. Sci. 2017, 53, 116–123. [Google Scholar] [CrossRef]
  25. Deng, P.; Chen, J.; Chen, D.; Shi, H.Y.; Bi, B.; Liu, Z.; Yin, Y.; Cao, X.C. The evolutionary characteristics analysis of the coupling and coordination among water, energy and food:take Jiangsu Province as an example. J. Water Resour. Water Eng. 2017, 28, 232–238. [Google Scholar] [CrossRef]
  26. Zhong, Q.K.; Fu, H.P.; Yan, J.L.; Zhe, L. How does energy utilization affect rural sustainability development in traditional villages? Re-examination from the coupling coordination degree of atmosphere-ecology-socioeconomics system. Build. Environ. 2024, 257, 111541. [Google Scholar] [CrossRef]
  27. Zhao, Y.; Guan, H.; Wang, S.; Yang, Z.; Li, Z.; Sun, Y. Measurement of Urban and Rural Resilience and Their Coupling Coordination Relationship in Northeast China. Chin. Geogr. Sci. 2025, 35, 612–630. [Google Scholar] [CrossRef]
  28. Yang, Q.; Tian, X.; Wang, H.; Tan, T. Exploration of the coupling coordination between rural tourism development and agricultural eco-efficiency in islands: A case study of Hainan Island in China. J. Nat. Conserv. 2025, 84, 126822. [Google Scholar] [CrossRef]
  29. Chen, X.L.; Zhu, S.Y.; Kong, X.S.; Chen, C.F. Dynamic and Static Characteristics of Spatiotemporal Coupling among Rural Population, Land, and Industry in Hubei Province. Chin. J. Agric. Resour. Reg. Plan. 2021, 42, 31–38. [Google Scholar]
  30. Cheng, M.Y.; Liu, Y.S.; Jiang, N. Study on the spatial pattern and mechanism of rural population land-industry coordinating development in Huang-Huai-Hai Area. Acta Geogr. Sin. 2019, 74, 1576–1589. [Google Scholar] [CrossRef]
  31. Mateusz, T. Evaluation of coupling coordination degree and convergence behaviour of local development: A spatiotemporal analysis of all Polish municipalities over the period 2003–2019. Sustain. Cities Soc. 2021, 71, 102992. [Google Scholar] [CrossRef]
  32. Muhadaisi, A.; Zhang, F.; Liu, K.; Fang, C.L.; Kung, H.T. Coupling coordination analysis of urbanization and eco-environment in Yanqi Basin based on multi-source remote sensing data. Ecol. Indic. 2020, 114, 106331. [Google Scholar] [CrossRef]
  33. Waseem, M.N.; Shahfahad; Swapan, T.; Ishtiaq, M.; Atiqur, R. Modelling built-up land expansion probability using the integrated fuzzy logic and coupling coordination degree model. J. Environ. Manag. 2022, 325 Pt A, 116441. [Google Scholar] [CrossRef] [PubMed]
  34. Gupta, P.; Kolhe, P.N.; Vyas, S. Coupling and coordination association between night light intensity and women safety—A comparative assessment of Indian metropolitan cities. J. Clean. Prod. 2024, 481, 144135. [Google Scholar] [CrossRef]
  35. Kwilinski, A.; Lyulyov, O.; Pimonenko, T. The Coupling and Coordination Degree of Digital Business and Digital Governance in the Context of Sustainable Development. Information 2023, 14, 651. [Google Scholar] [CrossRef]
  36. Ramakrishnan, V.; Ramasamy, N.; Anand, D.M.; Santhi, N. Coupling Coordination and Data Management for Additive Manufacturing Systems Based on Smart Logistics. Environ. Claims J. 2024, 36, 278–304. [Google Scholar] [CrossRef]
  37. Behnke, N.; Hegele, Y. Achieving cross-sectoral policy integration in multilevel structures—Loosely coupled coordination of “energy transition” in the German “Bundesrat”. Rev. Policy Res. 2023, 41, 160–183. [Google Scholar] [CrossRef]
  38. Motoshi, K.; Yoshiaki, T.; Takumi, W.; Toshiaki, H.; Hideo, H. Coordinated force generation of skeletal myosins in myofilaments through motor coupling. Nat. Commun. 2017, 8, 16036. [Google Scholar] [CrossRef] [PubMed]
  39. Nikos, A.; Ioannis, G.; Makrygiorgou, D.I.; Dimitris, S.; Christos, D.; Ioannis, M.; Athanasios, B.; Dimitrios, P. Coordinating Capacity Calculation via Electricity Market Coupling: Insights from the H2020 CROSSBOW Project. Electricity 2022, 3, 182–201. [Google Scholar] [CrossRef]
  40. Zhang, P.C.; Fu, Y.Y.; Lu, B.L.; Li, H.B.; Qu, Y.J.; Ibrahim, H.; Wang, J.X.; Ding, H.; Ma, S.L. Coupling Coordination Evaluation and Optimization of Water–Energy–Food System in the Yellow River Basin for Sustainable Development. Systems 2025, 13, 278. [Google Scholar] [CrossRef]
  41. Xu, H.; Wu, Y.Q. Measurement of the Global Inclusive Green Growth Index and Its Coupling Coordination Evaluation under the Sustainable Development Goals. Econ. Geogr. 2025, 45, 36–47. [Google Scholar] [CrossRef]
  42. Ye, S.; Su, A.Y.; Ge, Y.J. Economic-social-ecological coupling coordination from the perspective of sustainable societal safety: Take Qinghai Province as an example. J. Qinghai Norm. Univ. (Nat. Sci. Ed.) 2024, 40, 14–24+49. [Google Scholar] [CrossRef]
  43. Yin, L.; Wei, W.; Li, H.R.; Xia, J.N.; Bo, L.M. Spatio-temporal differentiation and influencing factors of territorial spatial pattern evolution in China’s land area: A comparative analysis based on the Hu Huanyong Line and the Bole-Taipei Line. Geogr. Res. 2025, 44, 552–576. [Google Scholar] [CrossRef]
  44. Cui, H.; Xu, G.; Yu, H. Spatio-temporal Pattern, Influencing Mechanisms and Optimization Strategies of Rural Restructuring from the Perspective of Territorial Spatial Governance: A Case of Guizhou Province. Hum. Geogr. 2023, 3, 79–91. [Google Scholar] [CrossRef]
  45. Zhang, Y.; Long, H.; Ge, D.; Tu, S.; Qu, Y. Spatio-temporal Characteristics and Dynamic Mechanism of Farmland Functions Evolution in the Huang-Huai-Hai Plain. Acta Geogr. Sin. 2018, 3, 518–534. [Google Scholar] [CrossRef]
  46. Fan, D.; Ke, H.; Cao, R. Modification and Improvement of Coupling Coordination Degree Model. Stat. Decis. 2024, 22, 41–46. [Google Scholar] [CrossRef]
  47. Li, Y.; Wang, J.; Liu, Y.; Long, H. Spatial Pattern and Influencing Factors of the Coordination Development of Industrialization, Informatization, Urbanization and Agricultural Modernization in China: A Prefecture Level Exploratory Spatial Data Analysis. Acta Geogr. Sin. 2014, 2, 199–212. [Google Scholar] [CrossRef]
  48. Yang, Q.; Zhu, H. Analysis of spatial differences and driving factors of agricultural resource allocate on efficiency in China. Stat. Decis. Mak. 2024, 40, 62–66. [Google Scholar] [CrossRef]
  49. Zhou, X.; Ma, Z.M.; Yin, F.; Jiang, D. Analysis and prediction about land use change in area along the Silk Road Economic Belt based on CA-Markov model: A case study of five provinces in Northwest China. J. Northwest Univ. (Nat. Sci. Ed.) 2018, 48, 291–298+305. [Google Scholar] [CrossRef]
  50. Li, J.L.; Pan, J.R.; Feng, F.; Xu, P.; Liu, C. Coupling coordination development of PWEE system and obstacle factors in nine provinces/regions of the Yellow River Basin. J. Water Resour. Water Eng. 2024, 35, 47–56. [Google Scholar] [CrossRef]
  51. Yang, Q.K.; Wang, L.; Lü, L.G.; Li, Y.; Fang, Y.T.; Zhu, G.L.; Wang, Y.X. Evaluation of Land Ecological Status and Diagnosis of Obstacle Factors in Jiangsu, China. Environ. Sci. 2024, 10, 5880–5889. [Google Scholar] [CrossRef]
  52. Yang, S.S.; Huang, L.L.; Duan, Z.C.; Huang, W.H. Spatiotemporal Dynamic and Obstacle Factor Analysis of Tourism Economic Resilience in Chinese Urban Agglomeration. J. Nat. Resour. 2024, 6, 1262–1277. [Google Scholar] [CrossRef]
  53. Du, H.J.; Deng, Q.Z.; Long, Y.H.; Zhang, Z.Q. Sustainable Utilization and Obstacle Factors of Water Resource in Jiangxi Province. Bull. Soil Water Conserv. 2023, 6, 200–208. [Google Scholar] [CrossRef]
  54. Chen, H.; Hua, Y.Y. Measurement, Evolution and Obstacle Factors of High-Quality Development Level of Urban-Rural Integration in the Core Area of the Yangtze River Delta. Resour. Environ. Yangtze Basin 2024, 10, 2071–2084. [Google Scholar]
  55. Zhao, F.F.; Yi, P.; Zhao, X.; Hu, Z. Analysis on Dynamic Mechanism and Obstacle Factors of Industrial Ecologization and Ecological Industrialization in the Three Gorges Ecological Economic Corridor of the Yangtze River. Areal Res. Dev. 2024, 4, 50–56. [Google Scholar] [CrossRef]
Figure 1. Schematic representation of the Xiangxi region’s location.
Sustainability 17 06691 g001
Figure 2. Time-series characteristics of different dimensions of development index of county villages in different years in western Hunan region.
Sustainability 17 06691 g002
Figure 3. Spatial characteristics of different dimensions of development index of county villages in different years in western Hunan region.
Sustainability 17 06691 g003
Figure 4. Intensity pattern of socio-economic and spatial reconstruction in rural villages across counties in the western Hunan region during various years.
Sustainability 17 06691 g004
Figure 5. Analysis of socio-economic-spatial coupling of rural villages in counties of different years in western Hunan region.
Sustainability 17 06691 g005
Figure 6. Analysis of socio-economic-spatial coordination of county villages in western Hunan region in different years.
Sustainability 17 06691 g006
Figure 7. Spatial Markov transfer probability matrix for coupled coordination degree. Note: I denotes a low level of coordination; II denotes a medium-low level of coordination; III denotes a medium-high level of coordination; IV denotes a high level of coordination.
Sustainability 17 06691 g007
Figure 8. Socio-economic-spatial guideline layer barriers for county villages in western Hunan region in different years.
Sustainability 17 06691 g008
Figure 9. Social-economic-spatial indicator layer barriers for county villages in Xiangxi region in different years.
Sustainability 17 06691 g009
Table 1. Evaluation index system of rural socio-spatial development level in Xiangxi region.
Standardized LayerIndicator LayerMeaningCalculation MethodWeights
Social
dimension
Urbanization rate (X1)Rural reconfiguration dominant factorsProportion of urban population to total population0.2948
Rural population change rate (X2)Changes in rural population(Final rural population—Initial rural population)/Initial rural population0.0780
Gross fixed investment rate (CNY million/km2) (X3)Rural territorial infrastructure developmentTotal fixed investment per county area0.1857
Economic
dimension
Gross output value of agriculture, forestry, animal husbandry and fisheries (CNY billion) (X4)Town development attracts and drives the countryside, reflecting industrial developmentGross output value of agriculture, forestry, livestock and fisheries0.0133
Agricultural labor productivity (CNY million per 10,000 individuals) (X5)Agricultural economic developmentGross output of agriculture, forestry, and fisheries divided by the total work force in these sectors0.0057
Disposable income per capita of permanent residents in rural regions (CNY) (X6)Income of rural inhabitantsPer capita disposable income of permanent residents in rural areas0.0672
Engel’s coefficient for rural inhabitants (X7)Rural residents’ food expenditures as a percentage of total consumption expendituresTotal food expense divided by total household consumption spend, multiplied by 100 percent0.0357
Spatial
dimension
Rate of change in cropland (X8)Changes in land use structure, reflecting regional development trends and directions(Final cropland area—Initial cropland area)/Initial cropland area0.1725
Per capita rural housing area (m2) (X9)Size of living spacePer capita housing area in villages0.0522
Population density in rural areas (individuals/km2) (X10)Measuring rural population distributionRural population/Land area0.0949
Table 2. Multiple step-by-step regression analysis of the coupling coordination of counties and districts in Xiangxi region, 2002, 2012 and 2022.
Time PeriodRegression EquationSignificant VariableR2p
2002–2012y = 0.4806 × X1 + 0.6343 × X2 + 5.9410 × X4 + 0.4089 × X8 + 0.3707 × X10 + 0.1742X1, X2, X4,
X8, X10
0.9397<0.05
2012–2022y = 0.2612 × X1 + 0.2618 × X2 + 2.6466 × X6 + 0.3170 × X8 + 0.3505 × X10 + 0.1476X1, X2, X6,
X8, X10
0.9886
2002–2022y = 0.2383 × X2 + 0.1971 × X3 + 2.7607 × X6 + 0.2555 × X8 + 0.1326 × X9 + 0.2034 × X10 + 0.1552X2, X3, X6, X8, X9, X100.9914
Disclaimer/Publisher’s Note: The statements, opinions and data contained in all publications are solely those of the individual author(s) and contributor(s) and not of MDPI and/or the editor(s). MDPI and/or the editor(s) disclaim responsibility for any injury to people or property resulting from any ideas, methods, instructions or products referred to in the content.

