Article

Analysis of Integrated Global SDG Pursuit: Challenges and Progress

The Frederick S. Pardee Institute for International Futures, Josef Korbel School of International Studies, University of Denver, Denver, CO 80208, USA
Sustainability 2025, 17(15), 6672; https://doi.org/10.3390/su17156672
Submission received: 14 May 2025 / Revised: 28 June 2025 / Accepted: 3 July 2025 / Published: 22 July 2025

Abstract

How can we more fully analyze potential progress toward the 17 Sustainable Development Goals, globally and by country? Methodological challenges include (1) the comprehensiveness of issue coverage, integration of causal elaboration, and geographic detail in available models; (2) clear quantification of goal targets; and (3) specification of scenario interventions that connect meaningfully to the potential leverage of agents. This study uses a large-scale, global but country-based analytical system that tightly integrates multiple issue-area models to push against methodological challenges. It explores the prospects for progress toward selected quantified targets across all goals, using scenarios that consider potential agency-linked interventions relative to the Current Path (CP). The scenarios distinguish interventions focused on Human Development (HD) and natural system sustainability (NSS) plus a Combined SDG scenario (CSDG). Even with a large, integrated push through 2030 and 2050, the world in aggregate will fail to reach many targets, and a great many of the 188 countries represented will fall short. Also of interest is possible tension between the underlying thrusts of HD- and NSS-oriented interventions. Both the Current Path of key variables and intervention leverage constraints make NSS goals harder to reach than HD goals. Because synergies of action considerably outweigh trade-offs, however, complementarity better characterizes the two intervention sets.

1. Introduction

The 17 Sustainable Development Goals (SDGs) have, since 2015, set an agenda for global development analysis [1]. Existing analyses of progress toward the SDGs across 169 targets and 231 unique indicators suggest that they will not be reached universally by 2030 or even 2050 [2,3,4,5,6,7]. Many countries will fall far short of most goals. Yet, both such analysis and efforts to help accelerate progress are greatly challenged on several fronts:
  • Quantification of many targets is difficult, and extensive temporal and geographic data across countries are often missing.
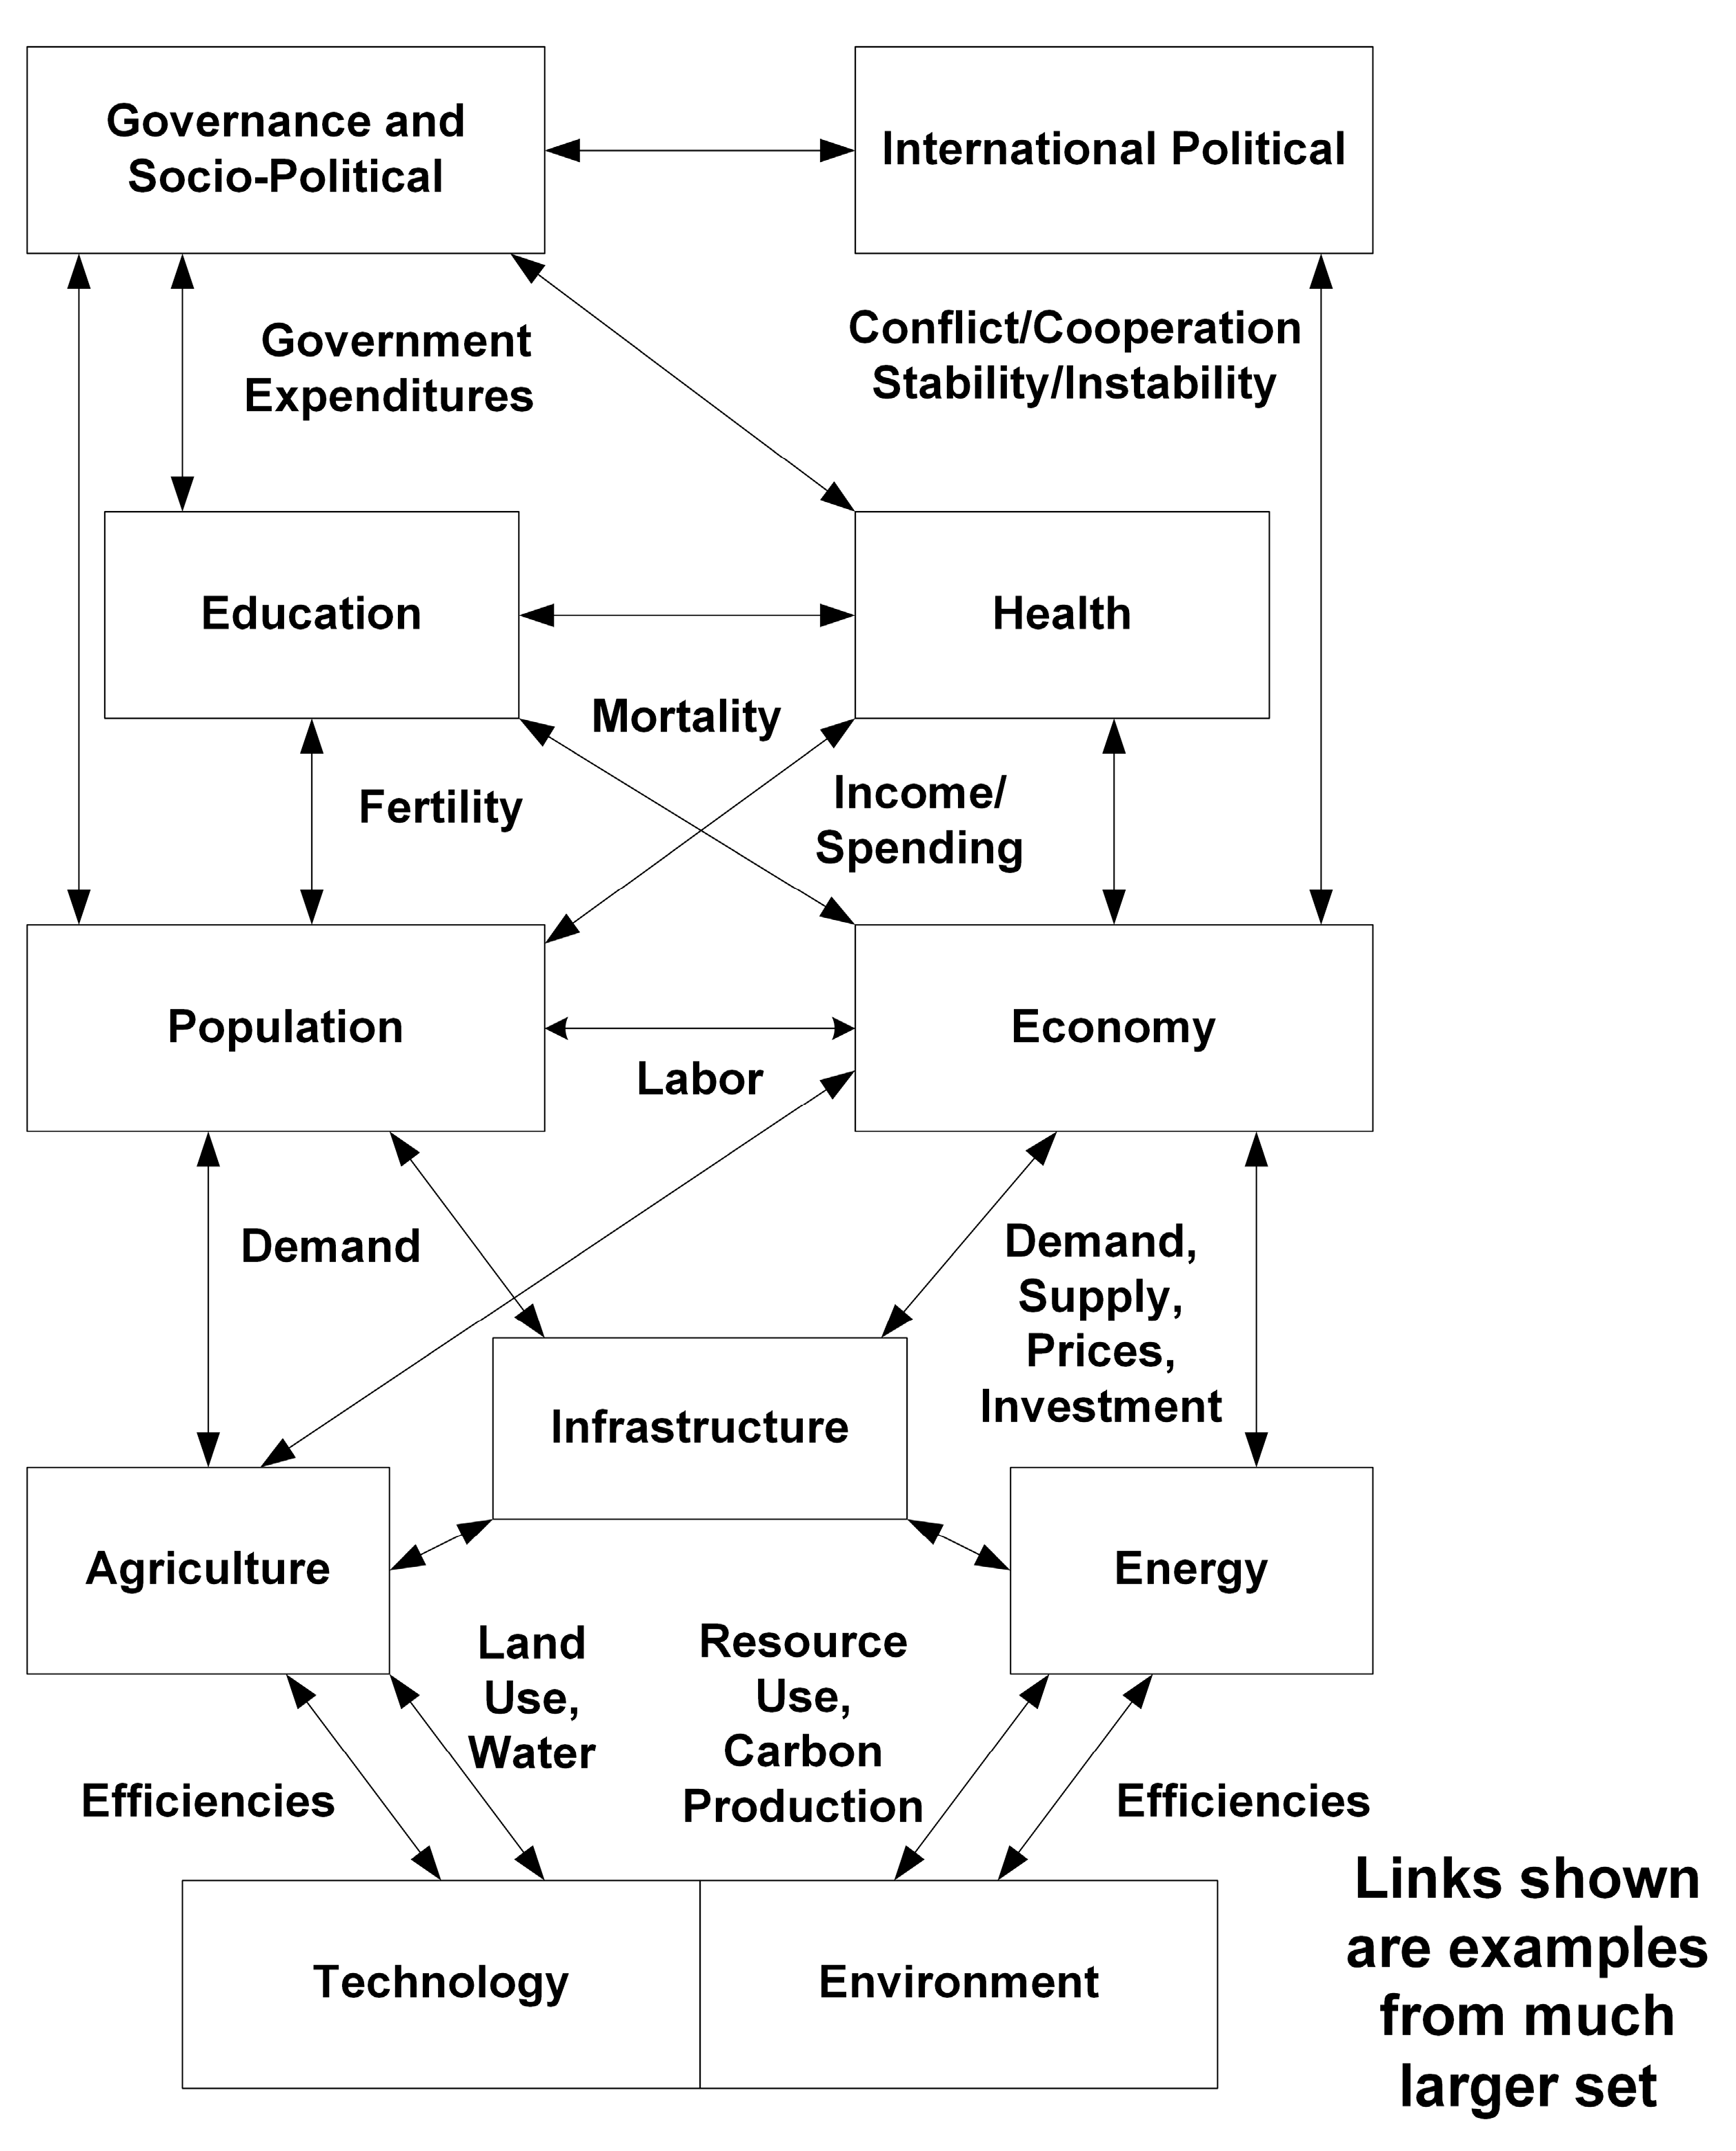
  • Complex and often bi-directional linkages among target variables and with deeper drivers complicate the analysis and pursuit of both single and multiple SDGs.
  • Development and analysis of alternative scenarios are also difficult, especially when models do not include two-way linkages between progress toward targets and the drivers and/or require multiple models to analyze [6].
With respect to data for the SDG targets and indicators, the Sustainable Development Report recognized 100+ useful indicators across all SDGs [8]. Those are drawn from a wide variety of United Nations, OECD, World Health Organization, and other sources, regularly updated and improving.
Over time, quantitative, forward-looking studies have progressively improved the analysis of likely and possible goal attainment. Some earlier studies primarily extrapolated historical trends in target and indicator variables, with little or no attention to the drivers of that progress [9]. Other work gave more attention to a selected set of drivers, generally still related to individual goals/indicator variables (e.g., Bill and Melinda Gates Foundation [10] with respect to poverty and health; Cuaresma et al. [11] on income per capita; Lucas et al. [12] on child mortality).
Many studies have identified a significant nexus of interrelated goals and possible interventions. Weitz et al. examined the water, energy, and food nexus, giving special attention to natural resources as enablers of development [13]. Obersteiner et al. dug into the land resource and food price nexus [14]. Sellers and Ebi elaborated narratives on the linkages of climate change and health [15]. Riahi et al. looked across the SSPs at key environmental variables [16].
Nexus work often uses alternative scenarios in computer models. Obersteiner [14] drew upon three of the five Shared Socioeconomic Pathways (SSPs) scenario set [17,18] and explored 14 policy strategies using runs of GLOBIOM (Global Biosphere Management Model). The most recent Coupled Model Intercomparison Project (CMIC7) identified multiple scenarios to be run ultimately through 2500 using models exploring climate change [19].
Other efforts have identified multiple nexuses that together span the full set of the SDGs. The CD-LINKS project (2015–2019) focused on the linkages between climate change and other SDGs [20]. Building on that work, based on The World in 2050 [21] project, on multiple Integrated Assessment Models (IAMs), and on expert surveys, van Soest et al. [22] identified four clusters of the SDGs, human development, resource use, earth system and governance and infrastructure, and found that multiple IAMs quantitatively represented 3 SDGs well and 10 others less well. Literature analysis identified patterns of relationships among the four clusters. Sahadevan et al. [23] explored scenarios linking progress toward various forms of renewable energy to climate change and a broader set of variables across the SDGs.
Further work within the IAM community proceeded to identify 36 quantifiable and actionable targets spanning all 17 goals and put them into five clusters: people (human development); prosperity; planet integrity; sustainable resource management; and peace, institutions and implementation [24]. Initial analysis looking across multiple existing studies through 2050 surveyed the potential progress toward 13 of those targets across 11 goals.
As work across the SDGs advanced in coverage, it progressed methodologically. Some early studies looked at connections across the full SDG goal set, drawing on expert analysis. Nilsson et al. [25] proposed a 7-point (−3 to +3) scale to assess relationship strength. See ICSU [26,27] for applications to goal subsets. Weitz et al. [28] built a cross-impact matrix across 34 targets (2 per each of the 17 goals) for Sweden. Relevant also to the analysis here, they found that effective institutions had the highest summed relationship with other targets. Pradhan et al. [29] statistically examined the intercorrelation of 122 indicators across SDG targets for 227 countries from 1983 to 2016. Pradhan et al. [30] looked at climate change mitigation and other SDGs through a study of the literature, including reporting from the Intergovernmental Panel on Climate Change.
Some modeling emerged in the systems dynamics literature. For example, the Millennium Institute’s iSDG model [31] is country-specific rather than global but includes great detail and 78 indicators across the SDGs, with 36 policy intervention points. Collste, Pedercini, and Cornell [32] documented an application to Tanzania. The Earth4All project has focused on human development variables and renewable energy potential globally through 2100 [33].
The most significant modeling work to look broadly across the SDGs at the global level and at least differentiate the global north and south has come from IAMs, heavily using models initially developed to focus on environmental issues. The SHAPE project (2019–2023) produced analysis across a wide range of SDGs using two IAMs and two specialized topic models [6]. The work elaborated three primary sustainable development pathway (SDP) scenarios, representing differing clusters of policy emphasis, as well as two scenarios without targeted SD policies.
There remain limitations in SHAPE and other project work. Not least is the common use of exogenously specified variables for population, GDP, and education, drawing from SSP quantifications generated by other models, rather than representing those endogenously in the analysis. Feedback loops with either positive or negative valence should connect change in SDG target variables and these important drivers of global change. Further, IAMs currently have limited representation of agency, including that of governments, households, and firms. Yet we have long understood that much progress in sustainable development (and policy-relevant analysis of it) requires expenditures and transfer payments that draw on financing and judgment about trade-offs by competent governments [34,35,36].

2. Materials and Methods

Earlier studies looking across the SDGs with varying methodologies have almost always concluded that the world and many of its countries will reach very few of the goals by 2030 or even by 2050. We expect the same finding but wish to increase understanding of the extent of progress on each goal that might be attained on the Current Path and with significant interventions to accelerate it.
A topic of many studies has been possible trade-offs or synergies of intervention impact. They often give special attention to how interventions focused on predominantly Human Development (HD) or Natural System Sustainability (NSS) goals might affect those in the other category.
Most often, such studies have suggested synergies rather than trade-offs for integrated pushes by societies toward the SDGs. Using the IMAGE model, van Vuuren et al. [7] concluded that “the scenario analysis does not point at a fundamental trade-off between the objectives related to poverty eradication and those related to environmental sustainability” but did suggest that a push toward bioenergy could complicate achievement of biodiversity and access to food. Using statistical analysis, the work of Pradham et al. [29] found that pursuit of no poverty was synergistic with most other goals and that synergies outweigh trade-offs generally, but SDGs 8, 9, and 12 (which all relate to GDP growth) do have trade-offs. Weitz et al. [28] used cross-impact matrix analysis of Sweden to argue that the SDGs are almost entirely mutually supportive. Work in model-based analysis with the SDP scenarios also found that progress on sustainability is generally supportive of that on human development goals [3,6].
Some studies have suggested, however, that efforts to pursue human development SDGs, including poverty reduction and sustaining economic growth, could negatively impact climate change mitigation. Such studies have also often argued for attention to the details of policy selection to minimize or avoid trade-offs, as did Obersteiner et al. [14] in work on the land resource and food price nexus and as did Dagnachew and Hof [37] and Pradhan et al. [30], looking at climate change mitigation and other SDGs.
Based on such analyses, expectations for this project include that we will find more synergies than trade-offs between efforts focused on human development and natural system sustainability. Because of the demands that increased economic growth and consumption can place on the environment, we can expect that exceptions might more often characterize the impacts of HD efforts on NSS rather than the reverse. In fact, if environmental protection such as slowing climate change actually protects economic growth, that would be positive for HD. Ideally, this study should help us understand some of the past literature’s differences in conclusions about trade-offs and synergies.
Given the progress already made plus the challenges remaining, the agenda of this study is to advance country-specific and global analysis across the integrated SDGs set by:
  • Laying out structural elements of model systems that can help explore the complex impact of individual and multiple interventions. This study uses the International Futures (IFs) model system, with many such elements. IFs can, therefore, project 2030 and 2050 values of selected quantified targets across the full SDG set and facilitate exploration of many interventions.
  • Developing scenarios with some attention to those of the SHAPE project and the SSPs that represent aggressive but reasonable policy-related interventions. These can overlay and interact with endogenously dynamic projections of the foundational population and GDP drivers of change and give attention to agency such as governmental spending [38].
  • Reviewing alternative scenario results across countries and globally, also drilling down into various subcategories of action for insights concerning potential progress and tensions, especially between pursuit of the human development and biophysical sustainability subsets of SDGs.

2.1. Desired Methodological Elements Within the Analytical Toolkit

Comprehensive system representation. Given the extensive framework of the SDGs, we propose model-based analysis endogenously integrated across the issue domains of human development, socioeconomic change (including advance in the capabilities and outputs of government), and biophysical sustainability.
Extensive driver and causal linkage elaboration. We aim for extensive representation, replete with positive and negative feedback loops, of variables and dynamics linking and underlying the SDGs and of policy levers. These include drivers and impacts of economic productivity/GDP growth and population growth; both variables affect and are affected by most SDG indicators.
Fiscal and physical resource competition accounting, with attention to agency. Action trade-offs often lie in competition for resources. Governments (or households) cannot spend the same money on education, health, infrastructure, subsidies for renewable energy, and the military. Gable, Lofgren, and Osorio Rodarte used the concept of “fiscal space” [39]. The UN defined economy and finance as one of the four levers for SDG transformations [8]. Social accounting matrices (SAMs) [40] provide structure for fiscal accounting of and flows among governments, households, and firms. Representation of those agent classes can be further elaborated, for instance, with respect to governmental capacity for extracting and effectively using resources or the growing needs of households for retirement savings with increased income and life expectancy. Differentiating households by skill and/or income levels can also be helpful. IAMs quite routinely and very usefully represent physical resource use competition. Land used for agriculture may not support forests. Fossil fuel resource limits are uncertain but real. Working-age population constrains labor supplies.
Temporal dynamics and lag treatment. While spending on education improves productivity, years pass while increasing the stock of educated young people and still more before their greatest work force contributions. One lesson from systems dynamics modeling is conscious attention to stocks and flows, facilitating analysis of lags. That is important in issues like population aging dynamics and spending, debt, and return on capital generated by investment. Dynamic recursive models generally represent dynamics and lags better than comparative static models.

2.2. The International Futures (IFs) System

No extant modeling system has the full set of desired characteristics for study of the SDGs. The International Futures (IFs) platform has many of them, and this analysis used it. Hughes [41] described the system and compared it with specialized models in each component issue area and with other IAMs. That 2019 volume plus Hughes and Hillebrand [41,42] place IFs contextually in reference to historical data, historically understood global dynamics, and other IAMs as elements of its validation. The system is open for use and documented at https://pardeewiki.du.edu/index.php?title=International_Futures_(IFs) (Accessed on 7 June 2025). Supplementary Material 4 (SM4) provides additional detail on the models that make up the IFs system.
IFs is dynamically recursive with annual time-steps from 2020 through to 2100. Its structure is hybrid, including stock-and-flow and equilibrating feedback representations across time but also building upon statistical formulations based in data and theoretical understandings. Nearly 7000 data series are accessible with the model through its interface. It includes a cohort-component-based demographic model with endogenous fertility and mortality, tied to a full health model. Its 6-sector general equilibrium economic model draws for agriculture and energy on partial equilibrium models of those sectors. It also incorporates models with uniqueness within the IAM and SDG analysis literatures, such as those for student flows through education and adult levels of it, governance, and infrastructure. Culture representation (with importance emphasized by Hughes et al. [43] is unfortunately limited. The integrated models of the IFs system forecast more than 700 variables, including more than 100 representing targets and indicators of the SDGs. It represents 188 countries.
IFs, thus, has much of the desired comprehensiveness across goal arenas [44]. Figure 1 shows primary hard-linked models in the system and illustrative linkages. IFs is somewhat weaker than desired with respect to elaborated feedback of environmental impacts to human and socioeconomic models. Sellers [45] notes that it does not include direct linkages of climate change to health variables. Yet it links climate to GDP using an approach based on models such as DICE [46], including the quadratic form that intensifies economic impact as incremental temperature rises [47]. That economic impact, in turn, broadly affects human development variables including health.
IFs has extensive linkages within and across the human and sociopolitical development models, as well as to and from biophysical systems. For instance, infant mortality, education, and GDP per capita all affect fertility, while nutrition, indoor air pollution, income, and much more affect mortality by cause. Concerning physical resource constraints, IFs represents multiple land uses, various fossil fuel resources, and age–sex-specific demographics underlying labor supply. Financial, physical resource, and sociopolitical representations include stocks and flows, thereby facilitating analysis of lags in adjustment processes.
Enhancing other linkages across models with IFs are two integrative model structures of significance. The first is a representation of total factor productivity (TFP) in the Cobb–Douglas function of the economic model. It is driven by country-specific levels of human capital (including years of adult educational attainment and longevity), social capital (governance character and quality), societal physical capital (infrastructure) and knowledge capital (R&D and trade linkages to the broader world). Hughes and Narayan (2021) [48] document it. This approach extends work on TFP, such as that by Cuaresma [11] and Dellink, Chateau, Lanzi, and Magné [49].
The second structure helps with representation of agency, including the competition for financial resources, namely a full SAM for financial flows among firms, households, and governments [42]. For instance, it represents governmental and household revenues and spending from multiple domestic and international streams, including both direct government expenditures (including health, education, infrastructure, and R&D) and social transfers. Its dynamic structure is initialized with data from the Global Trade and Analysis Project and many other sources.

2.3. Defining Targets

Many SDGs have clear and widely accepted quantified indicators with targets relevant to countries [50,51,52,53]. That is especially true with respect to human development goals, such as reductions in poverty [54], hunger, and maternal and infant mortality. It is less often the case for sociopolitical goals such as labor informality and corruption. It is also more difficult to identify SDG-associated quantitative targets for several natural system or environmental sustainability goals, notably ocean fisheries [55,56,57], carbon emissions, and forest area (see Wackernagel, Hanscom, and Lin [58] on the limitations of the SDG framework with respect to environmental sustainability and Galli et al. [59] and Dang and Serajuddin [60] on the challenges for countries measuring across indicators more generally and, therefore, also of achieving SDGs).
IFs represents more than 100 indicators related to the SDGs, and the core analysis here focuses on at least one target indicator for each goal, choosing based on judgment of centrality to the goal and strength of representation in IFs. Using a single indicator for goals is a known limitation, because some goals, such as Goal 7 concerning access to affordable and renewable energy, encompass sub-targets that do not covary as consistently as do sub-targets of ending poverty.
Supplementary Material 1 (SM1) details specific global and national targets and associated IFs variables that this analysis used. It explains the quantification of targets for this analysis, including their ties to UN documents, other analyses, and inevitably somewhat subjective judgment (as does van Vuuren et al [24]). For Goals 13–15, decisions were not simple, even at the global level, because the goal and primary target language is mostly global and non-quantitative. Illustratively, for protection and rebuilding of global marine fish stocks, this analysis used an aggressive global annual catch target of 50 million metric tons and used 100 mmt as a benchmark for unsustainable, thereby allowing percentage specification of target achievement from a base year. Given global temperature change having already in 2024 touched 1.5 °C relative to pre-industrial levels, the 2 °C temperature target was used to shape analysis of progress or lack thereof in analysis with respect to carbon emission levels. Specifically, the UNEP Emissions Gap Report [61] argued that global emissions must be reduced by more than ½ before 2050 to hold warming to that target. With respect to forest area, an expansion by 5% relative to the 2015 value of 3990 million hectares was used.
For such biophysical variables, it is even more difficult to set national than global targets, because they are globally public rather than nationally private goods. Olson elaborated the challenges of providing public goods when private action has public spillover effects [62]. Weber emphasized national development of public administration to support national public good provision; today, we struggle to do that for global society [63]. Nationally determined contributions (NDCs) are a critical step in that direction for greenhouse emissions and often also treat forestation [64]. Analogues like the Bonn Challenge are emerging with respect to forests and fisheries; in the meantime, this analysis looks to national progress across time.

2.4. Structuring Scenario Interventions

Structuring scenarios challenges all analyses of potential progress toward the SDGs. One reason is frequent failure to recognize the utility of differentiating two dimensions for scenarios, namely SDG target categories and agent-specific action categories. Table 1 provides a rough guide to those dimensions and their relationship to the 17 goals.
With respect to SDG targets, scenario specifications often identify two somewhat overlapping categories, namely human development and physical sustainability goals/targets, exploring the potential tensions between progress within them [22]. Recognizing a third more instrumental governance grouping within the goal set can add value because progress on it is itself important and facilitates that in the other two, one strong basis for synergies across them [65].
The second dimension is agency and focus on policies/actions by which households, governments, or firms can accelerate progress. As indicated earlier, without explicit representation of social accounting, especially government finance, analyses are challenged to elaborate agent- and action-based elements of this dimension interacting with the goal-focused dimension. The SHAPE project moved in that direction with Economy-driven Innovation, Resilient Communities, and Managing the Global Commons scenarios [6]. Leininger et al. [66] explored key elements of governance character, and Dombrowsky et al. [3] elaborated typologies of policy instrument and purpose (building on Rogge and Reichardt [67]. While scenario elaboration should ideally be as “real world” as possible about policy intervention points, character, and magnitude, that is significantly frustrated by the gap (chasm?) between the aggregation level of model specification and the world of policymakers.
Cutting across the two dimensions, another challenge for scenario elaboration is the absence of extensively endogenous elaboration and integration of SDG-related models, as noted for the SHAPE initiative, with its reliance on exogenous representation of population, GDP, and education, ameliorated somewhat by attention to both SSP1 and SSP2 scenarios and by exogenously specified scenario variations in economic paths built around SSP1.
This project builds scenarios with attention to both goal clusters and agency (see Table 2). The Current Path scenario (or Base Case) of IFs is the first of four project scenarios. It represents unfolding of ongoing global dynamics and actions, including significant existing efforts to reach the SDGs. It is not extrapolative but rather the product of full IFs dynamics. The second and third scenarios are Human Development (HD) and Natural System Sustainability (NSS), each with intensified agent interventions focused on related SDGs. HD scenarios rely heavily on interventions that require financial resources and behavioral changes, while NSS scenarios also often require societal behavior changes plus technological advances. Both scenarios often require improved domestic governance and/or global governance support. Combined SDG (CSDG) integrates HD and NSS.
Most IFs intervention points are not at a highly specific policy level (e.g., building new secondary schools and hiring teachers for them) but convey policy orientations (e.g., pushing up admission and completion levels and spending more on education). Further, some interventions directly affect the goal variable (such as government financial transfers and its impact on poverty rates) and others are more causally distant (like the impacts of household income and education advances on health improvement).
The HD scenario includes 35 interventions with 30 parameters, and the NSS scenario specifies 38 interventions across 23 parameters; the surplus of interventions relative to parameters accommodates some differential scaling across countries by level of GDP per capita using World Bank country-income categories. Columns 3 and 8 in Table 1 and Table 2 of SM2 identify magnitudes and specify temporal ramping (often 10–15 years) for interventions that would require it.
Intervention magnitude scaling is challenging [68]. Although a model might allow ramping secondary school intake rates from 10 percent of of-age children to 100 percent in 10 years (IFs does not), such intervention representation would be unreasonable. We need scale at aggressive but reasonable levels and that involves subjective but informed judgment [38]. Column 8 of SM2 tables includes scaling notes, drawing upon good practice/past experience of countries, distance from goals, and specialized issue studies. For this analysis, it was not possible to scale and package different interventions for each of 188 countries, although the model would allow for that. Albeit scaled to be feasible, some interventions unfortunately appear highly improbable. For example, following the UN’s Partnership for the Goals, the intervention for foreign aid from high-income countries (a process rather than outcome variable) was scaled to ramp toward 0.7% (recognizing governmental and non-governmental transfers), an achievable but highly improbable value. While a few have reached that, most are unlikely to follow.
None of the SDGs deal directly with one of the most important leverage points for both long-term human development and natural system sustainability, namely population growth. Nor is there any specific SDG target for the growth of the global economy, although Goal 8.1 calls for per capita economic growth of 7 percent or more in the least developed countries. Economic growth has a difficult position in the SDGs, potentially assisting human development while complicating pursuit of sustainability [69]. Clearly, however, population and GDP per capita significantly affect prospects for reaching all goals. In this analysis, reduced fertility rates are introduced by direct scenario specification, and economic growth is shaped by productivity drivers in the production function that other interventions affect (see Supplementary Material SM2 Figure SM2-1). Given that substantial fertility reductions have already occurred in much of the world, scenario intervention is focused on lower-income countries.
Existing quantifications of the five SSPs were useful in evaluating the behavior of the scenarios on key variables, including population, GDP per capita, and adult educational attainment. SM3 compares the IFs scenario projections on those variables with SSP values. The Current Path scenario is much like SSP2.
Again, governance variables are logically important to both human development and physical sustainability goal sets and are included in both. The analytical conclusion that HD and NSS synergies outweigh trade-offs could be interpreted as partly a specious result of inclusion in both scenarios of that and fertility reduction. It can also be understood, however, as strengthened recognition that capable and foresightful government is, in fact, a common denominator for progress in both arenas. Recognizing the broad importance of agency/action, the UN’s Global Sustainable Development Report emphasized economy and its finance and governance as two of the four key levers for SDG pursuit, along with “Individual and collective action” and “Science and technology” [8].

3. Results

We present results in three categories: (1) the differential implications of the four scenarios for progress toward selected targets of the 17 SDGs; (2) the unfolding of selected key dynamics across the scenarios; and (3) sensitivity of the progress to subsets of the scenario interventions.

3.1. SDG Progress Across the Scenarios

Table 3 details how the world and its countries fare in each scenario across at least one quantified target for each SDG. The first row associated with each numbered goal/target shows the global values for indicator variables in 2020 (the base year of IFs forecasts), 2030 and 2050. The second row indicates how many countries in the 188-country set reach the identified target level in those scenario-years. Target levels concerning population coverage are 3% short of universality, as elaborated in SM-1. Green shading for attained target cells shows that while some may be reached globally, only access to safe water and sanitation might be reached by all 188 countries even in 2050. Almost all countries may reach maternal and infant mortality targets by then [4].
Figure 2 and Figure 3 show progress through 2050 toward a single important target indicator for each goal across all scenarios. The graphics help illustrate how the HD and NSS scenarios might augment or compete. Top panels show globally aggregated percentage movement toward each target, and bottom panels indicate the number of the entire 188-country set in IFs to reach them. SM5 provides similar figures for the lower-middle-income countries that include the largest portion of the world’s population now falling short of human development targets.
Of central interest in Table 3 and the figures are the following questions:
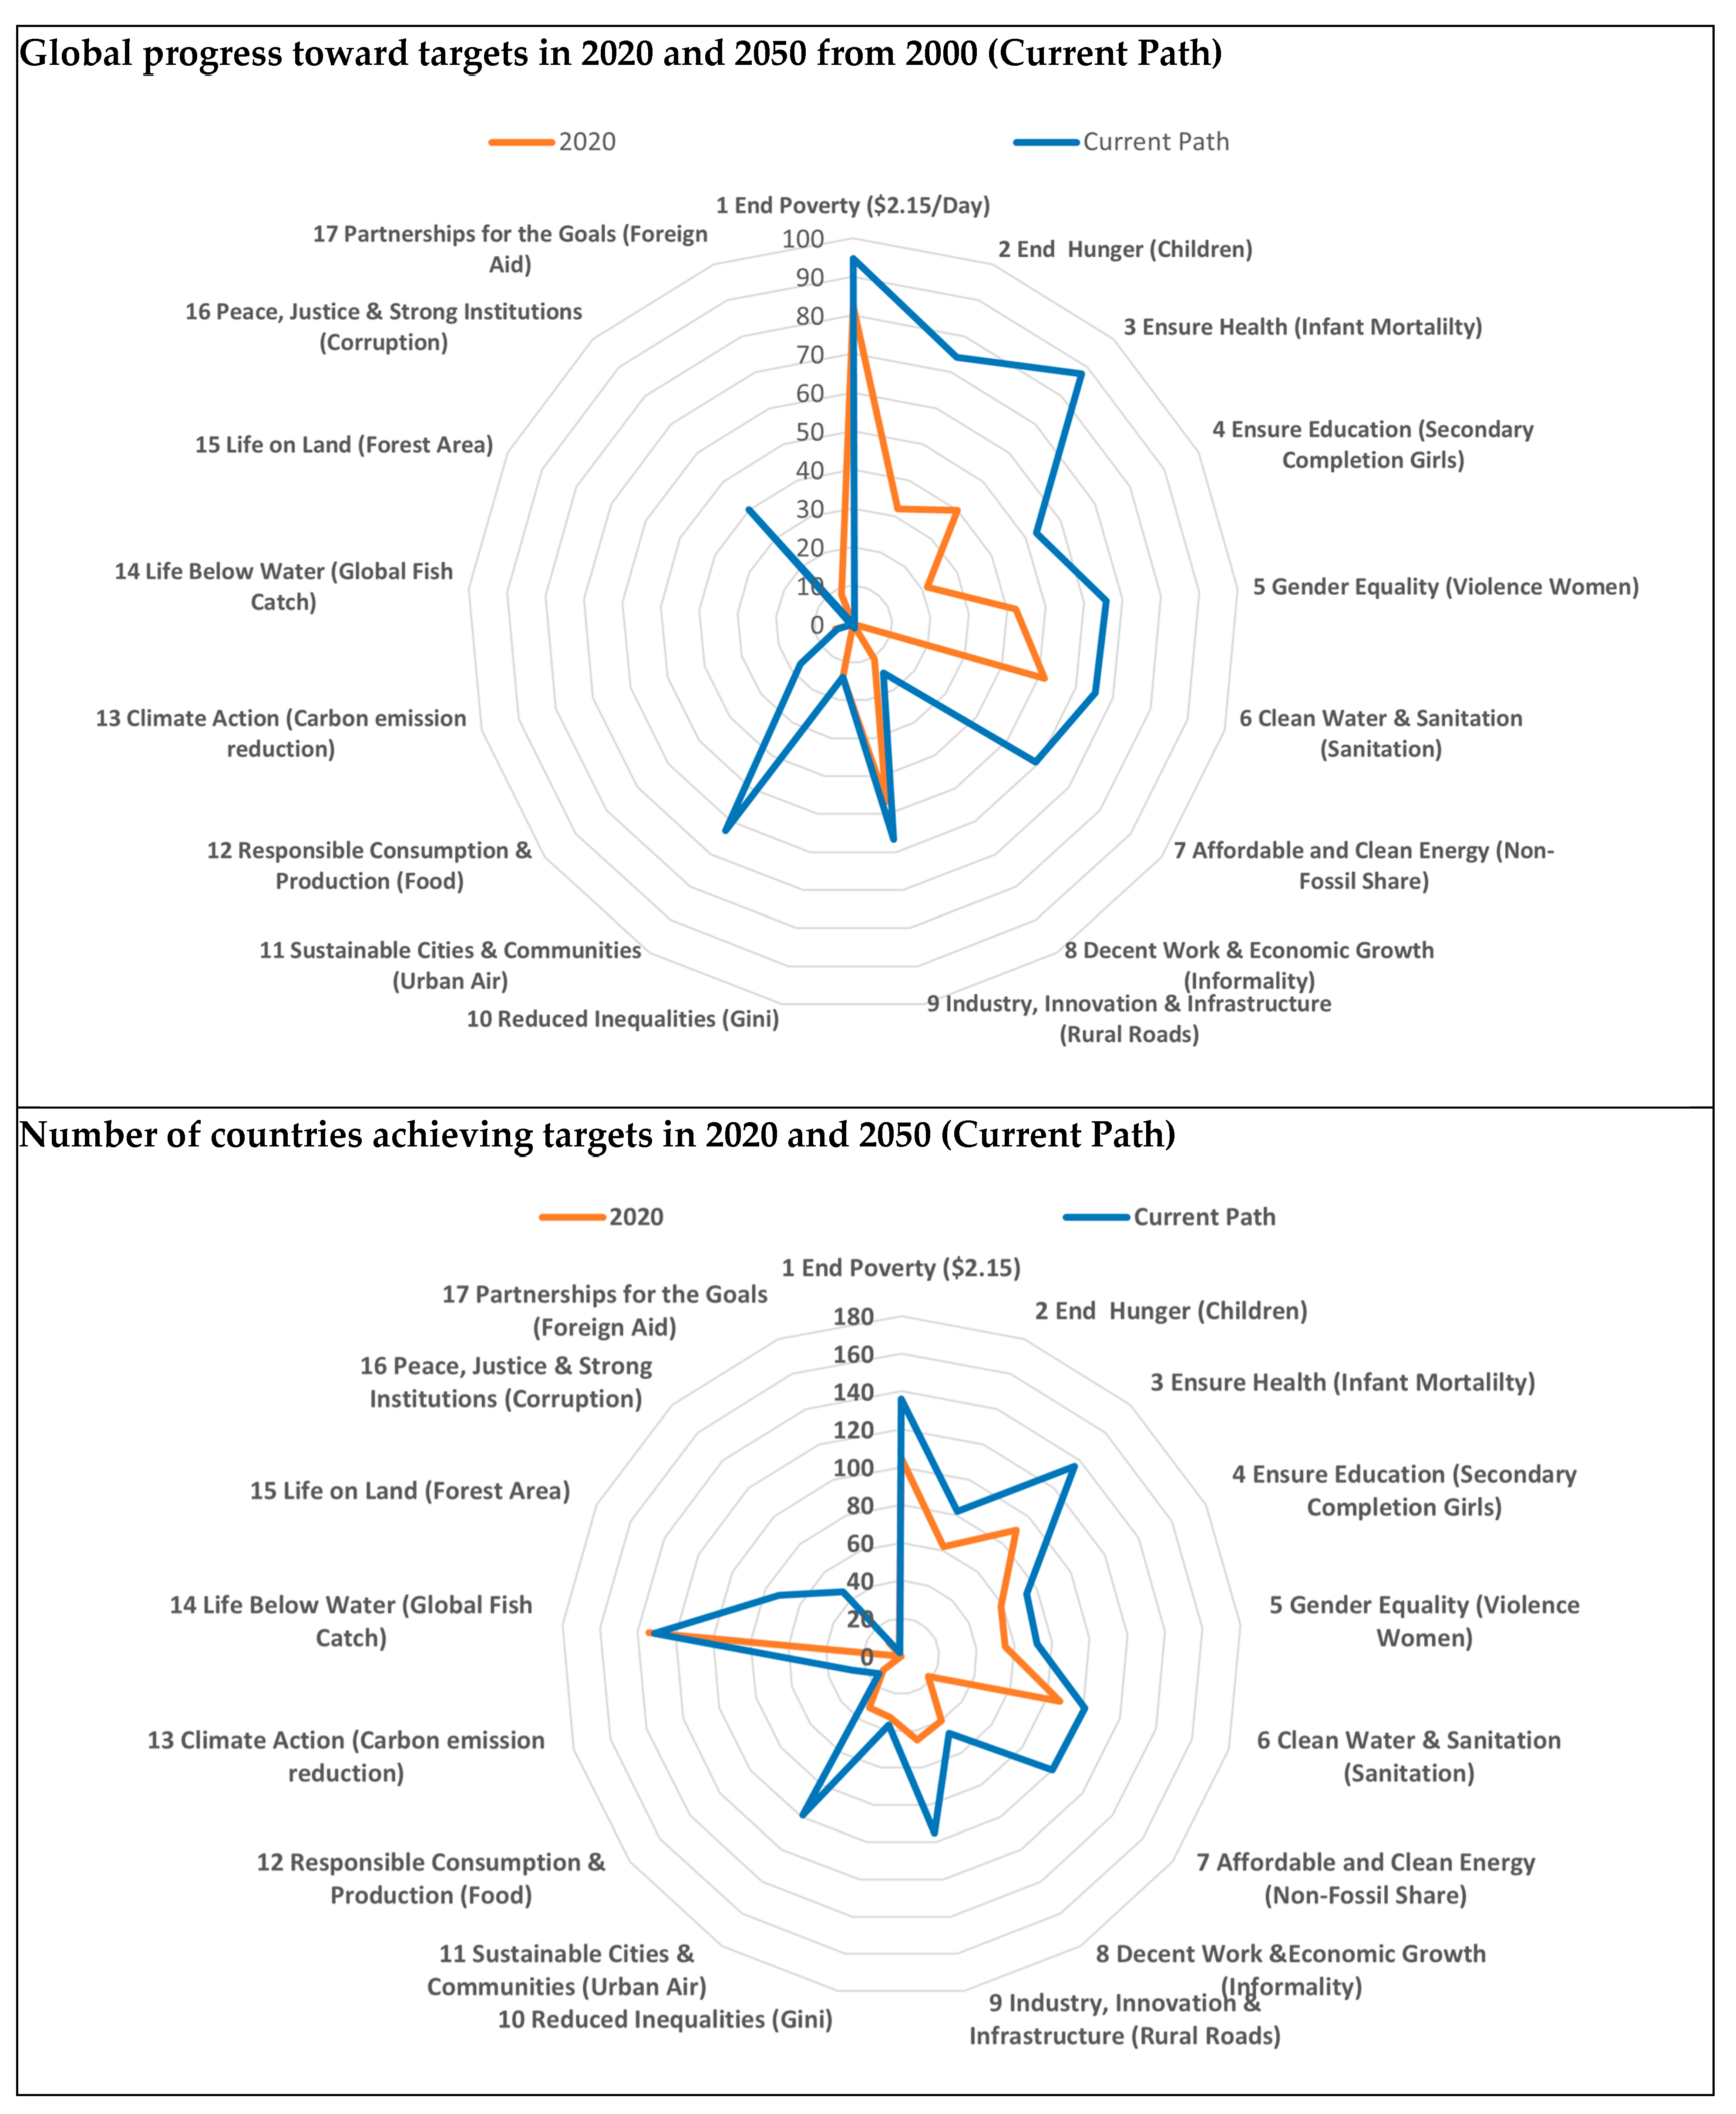
  • Where did the world stand in 2020 with respect to targets for the 17 goals?
  • Where does the Current Path take us by 2030 and 2050?
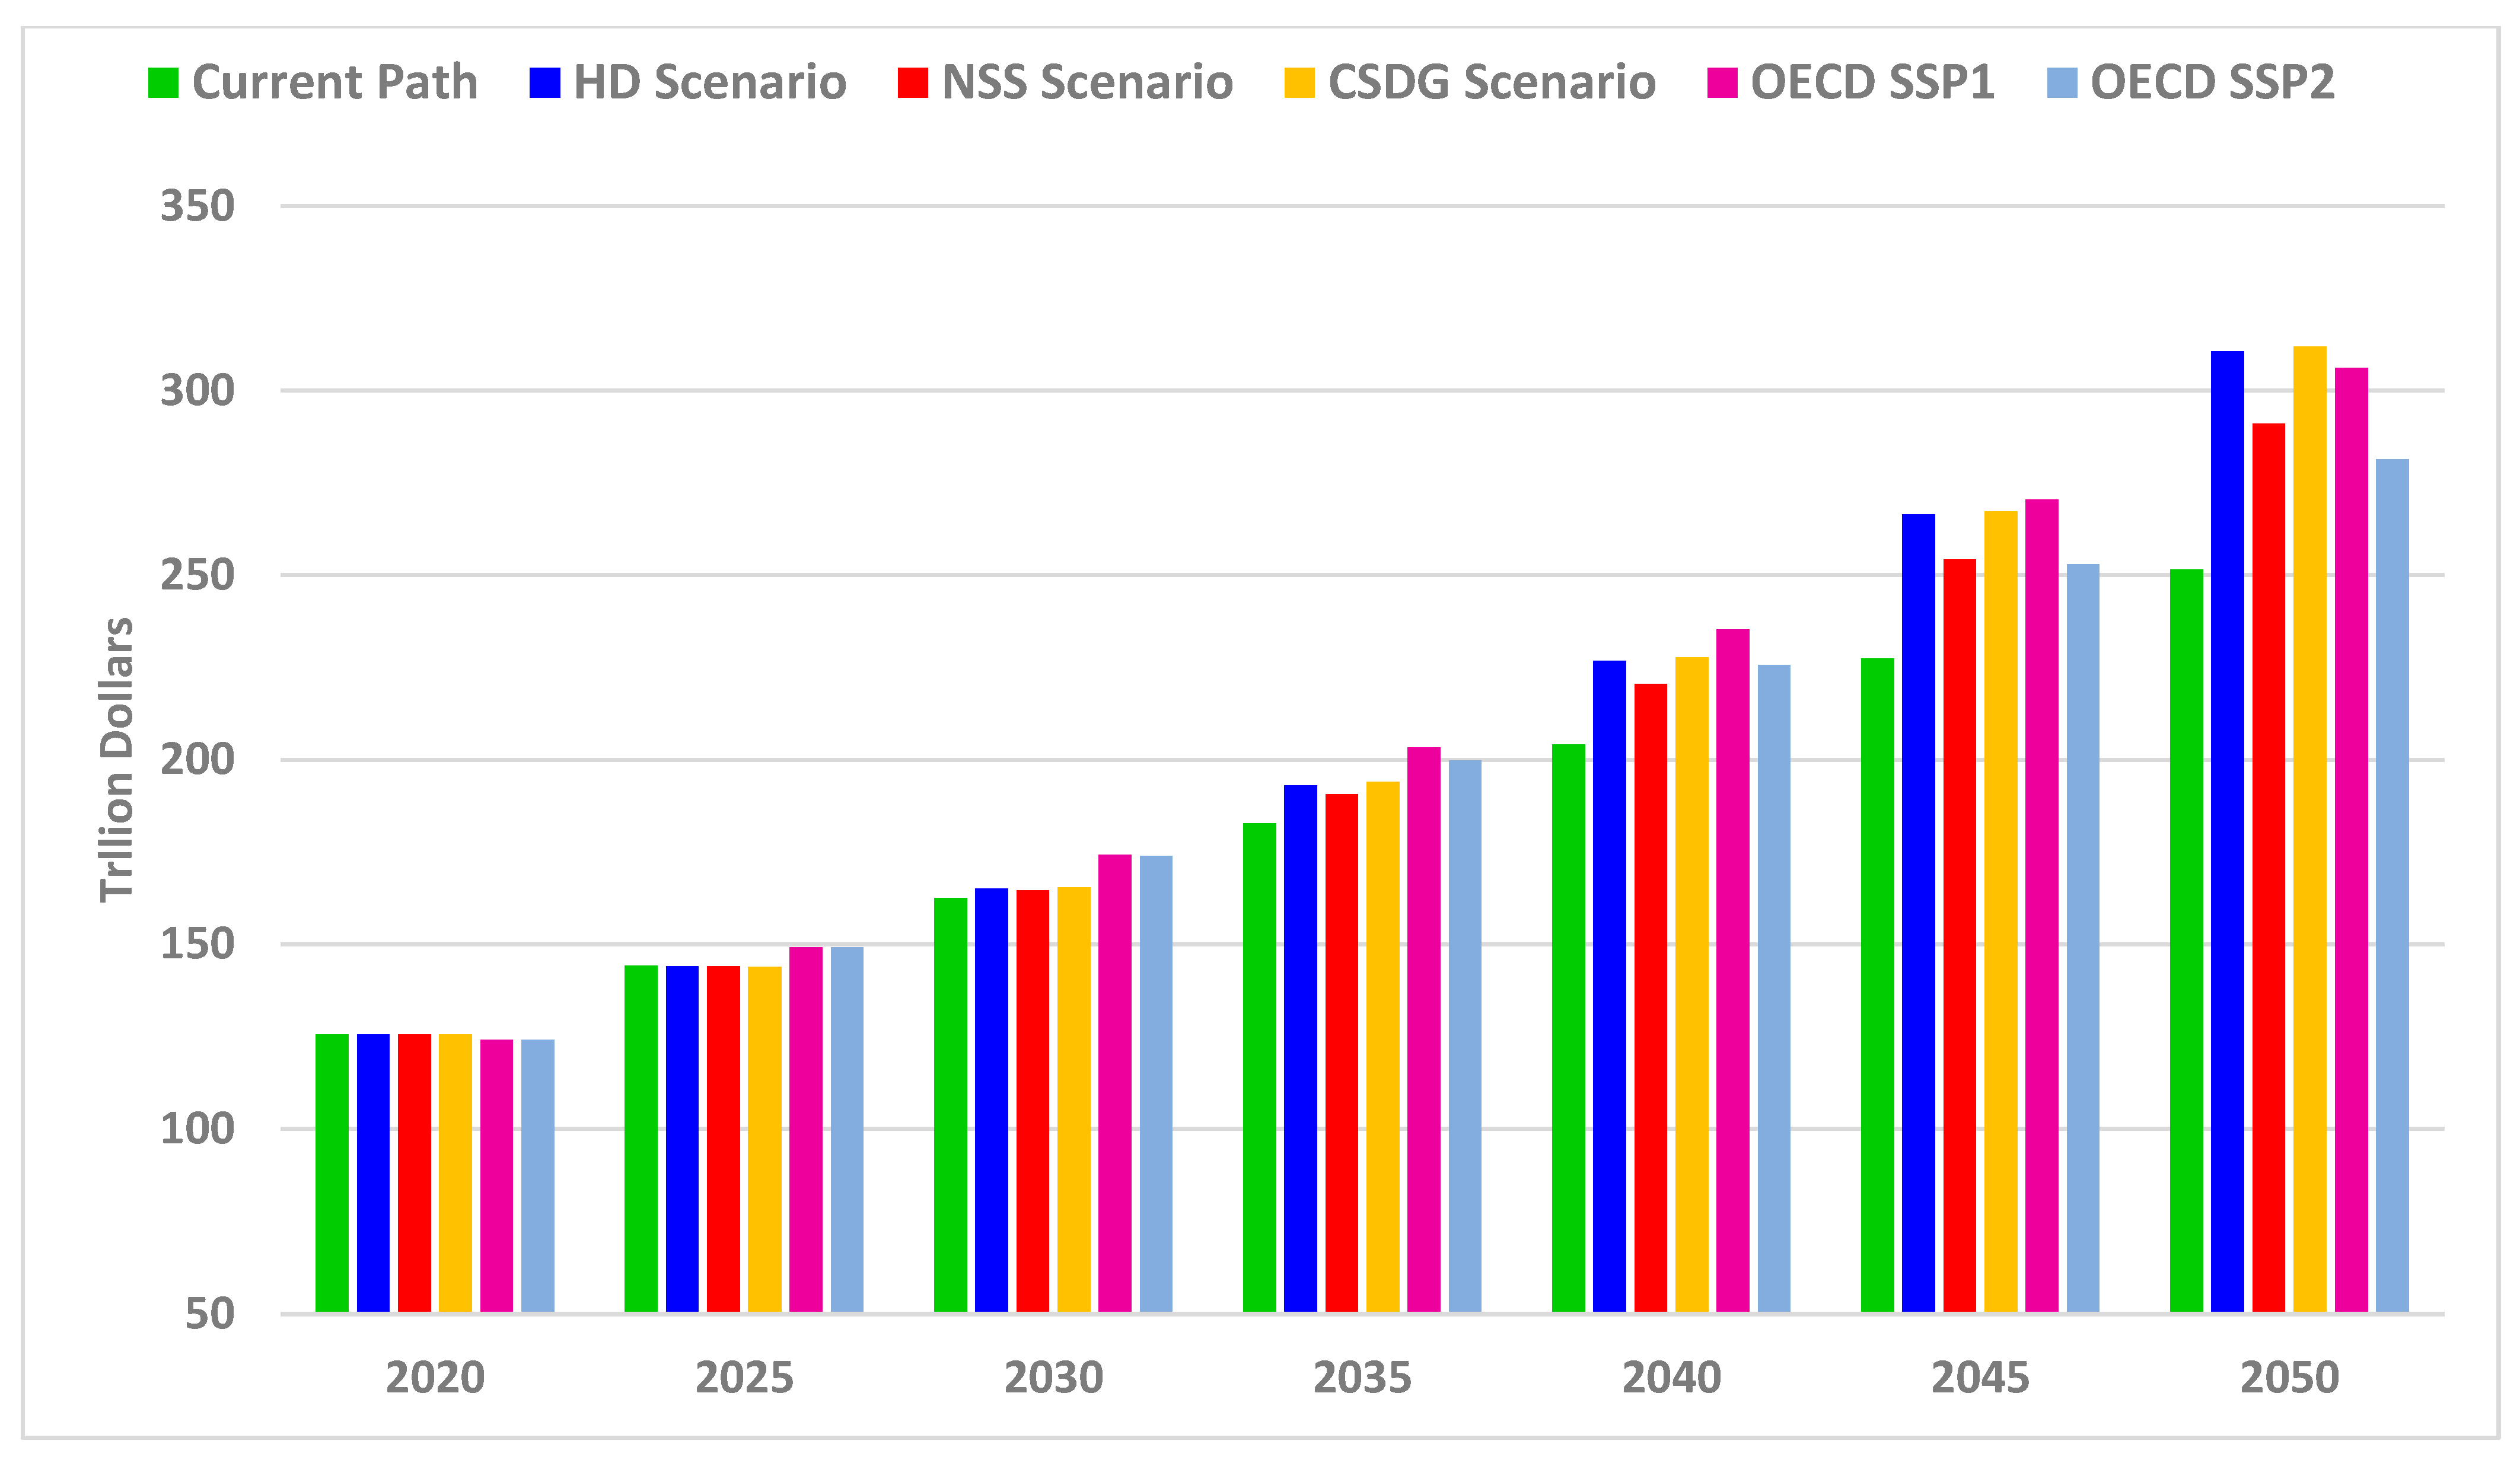
  • How much can the HD and NSS scenarios accelerate and advance?
  • How significantly do the HD and NSS scenarios differ in their contributions to attainment of SDGs?
  • How much do HD and NSS scenarios reinforce or reduce the other’s contribution?
Human development goals cluster on the right-hand side of the graphics. Figure 2 shows considerable likely progress by 2050, even in CP. The world has been making substantial progress in reducing extreme poverty, reducing infant and maternal mortality, and providing safe water and sanitation to all. These reflect human development goals’ tremendous importance to global populations―even in low-income countries (not shown), the rate of infant mortality declined to 45 per 1000 in 2020 from 163 in 1960, albeit far from a goal of 12 per 1000.
Yet, the global aggregate and country-specific pictures differ significantly. The share of countries not reaching the goals in CP even by 2050 is striking. Table 3 and Figure 2 show that only 136 reach 3% or less even at the “extreme poverty” level of USD 2.15 (2017USD) by 2050. The table shows that only in 107 countries do fewer than 3% fall below USD 3.65 daily per capita; that level is sometimes questionably characterized as “moderate poverty” and is linked to the median poverty target for lower-middle-income countries.
Environmental sustainability goals cluster on the left-hand side of the figures. CP does not deliver very substantial aggregate global progress on carbon emissions, forest area, or fisheries by 2050. It does on urban air quality, which has the character of a national and, in fact, local private good and which societies have worked hard to improve as income rises.
Figure 3 shows the additional progress that HD, NSS, and CSDG might generate relative to CP. SM6 provides textual analysis by goal. CSDG generally outperforms CP. This is true in the human development domain for countries with respect to poverty, secondary education of girls, violence against women, informal labor, sanitation, and rural road access. In the environmental sustainability domain, it is true with respect to urban air emission reductions, carbon emissions, and forest area but more generally across almost all targets.
Figure 4 augments the information in Table 3 and Figure 2 and Figure 3. It shows the percentage progress that might be made in each scenario on the primary target indicators. Progress is measured toward the goal levels provided in Table 3 from values in 2020. That progress might even surpass target values assigned for variables like extreme poverty reduction, infant mortality reduction, and access to sanitation. Targets for such variables were set slightly below universality, because even high-income and well-managed countries have not attained that (see Supplementary Material SM1 for elaboration on the selection of the indicators and the setting of targeted values, e.g., 3 percent extreme poverty rather than zero.)
Mostly on environmental goals, but also for foreign assistance on the global partnership goal, some scenarios could result in regression through 2050. The bars also communicate that relative to CP, the HD, NSS, and CSDG scenarios generally accelerate progress with complementary or overlapping contributions but that on environmental goals (as Pradhan et al. [30] suggested) and on global partnership/international aid, there could be trade-offs.
The bars in Figure 4 show that HD interventions do heavy lifting on the targets in that domain, largely overlapping with the CSDG scenario. Yet they also show that the NSS scenario by itself significantly advances human development relative to the CP. This may not be surprising given that NSS includes lower fertility and stronger governance. But other NSS elements also make positive contributions to several biophysical development goals with positive human system linkages, notably clean water and energy but also less food loss [70] and slower global warming.
Not surprisingly, the NSS scenario elements provide considerably greater impetus toward sustainability targets than HD. Yet, HD alone does make biophysical sustainability contributions relative to CP, again not least through fertility reduction in lower-income countries and improved governance. We will see below, however, that HD also increases economic growth, driven largely in IFs by the contributions it makes to economic productivity. Thus, it is of interest that the CSDG scenario sometimes makes greater contributions to biophysical sustainability than NSS alone, especially with respect to forest area and urban air (an indicator of safe cities). Overall, there is limited indication in Figure 4 that the two sets of interventions collectively work against each other and some suggestion of synergy, except on the three environmental indicators. The clearest picture is of complementarity.

3.2. Selected Drivers and Dynamics of Scenario Results

Quantification in the literature of the Shared Socioeconomic Pathways (SSPs) and elaboration of the Sustainable Development Pathways (SDPs) in the SHAPE project has appropriately given much attention to driving variables, including the GDP, population, and levels of adult education [6]. Much IAM analysis of the SDPs gives special attention to exogenously specified values in the relatively sustainable world of SSP1 or variations of it. The three variables are also among the key drivers of progress toward the SDGs in this study, although IFs computes all three endogenously. GDP growth uses a Cobb–Douglas function with endogenous capital, labor, and total factor productivity (TFP). Population is driven by total fertility rate (TFR) and migration as well as mortality from the integrated health model. Educational attainment is driven by a model of flows through schooling years and is one of the many drivers of TFP. Moyer et al. further compares the IFs scenarios and SSP scenarios through 2150 [71].
Figure 5 illustrates the dynamic structure of interactions of such key variables and two SDG target variables without elaborating the larger IFs system. The figure also suggests some of the complex mixture of stock and flow variables in both the SDGs themselves and key driving variables. For instance, access to safe water and sanitation represent infrastructure stock levels, and population size is also a stock. In contrast, the SDG carbon emissions indicator and the GDP are annual flow variables.
All the methodologies for exploring possible SDG futures, including qualitative expert analysis, statistical analysis and modeling, should be sensitive to that stock–flow distinction. It helps us understand one complexity of exploring synergy and trade-off analysis across progress toward the SDGs, namely temporal dynamics. Consider, for instance, how various advances in human development affect environmental variables. Figure 5 shows that advances in schooling for children increase adult education levels, which boost total factor productivity and, thus, GDP, potentially raising energy usage and carbon emissions, thereby increasing atmospheric carbon levels. Together, these dynamics suggest a trade-off between SDG 4 and SDG 12. But with lags in the time between rising schooling and adult attainment levels and between higher emissions and significant changes in atmospheric carbon, two flow-to-stock dynamics are considerable. Potentially, country A in a world of expensive renewable energy would see a trade-off played out over time, while country B in a world of inexpensive renewables could build on higher GDP, good governance, and targeted spending to reduce emissions generating synergy. A study using statistical analysis of historical data (like Pradham et al. [29]) might find the former trade-off result, while a study of Sweden using cross-impact analysis (like Weitz et al. [28]) might find a synergistic result.
Figure 6, Figure 7 and Figure 8 show the important GDP, population, and adult educational attainment variables across the four scenarios. In addition to global values of GDP in the IFs scenarios, Figure 6 shows those from the OECD’s 2023 revision for SSP1 (Sustainability) and SSP2 (sometimes called Middle of the Road) [6,49]. It indicates how the CP scenario falls below the SSP1 and SSP2 scenarios, in early years partly because of the inclusion of COVID-19 effects in IFs analysis [4]. Longer term, the HD and CSDG scenarios roughly follow the higher path of SSP1. The NSS scenario GDP also grows above that of the CP, largely because NSS reduces some negative feedback of environmental damage. By 2050, the IFs scenarios bracket SSP2 and differ from each other by about USD 60 trillion, nearly 25 percent. These patterns of global economic growth have significant secondary implications for all the variables affected by GDP in Figure 5 and the larger IFs/SDG system.
Turning to population, Figure 7 shows that the CP scenario of IFs is slightly higher already in 2020 than the SSP1 and SSP2 values from the Wittgenstein Centre (WIC), as updated in 2023 [72]. However, the growth pattern of the CP closely parallels that of the SSP2 projection
The WIC SSP1 scenario adds about 450 million fewer people through 2050 than does SSP2. With lower fertility in each, the IFs HD, NSS, and CDSG scenarios all reduce population by about 350 million people in 2050 relative to CP. Overall, the difference in those three IFs scenarios from CP for this critical driving variable is much the same as how SSP1 differs from SSP2. Such population differences across scenarios clearly have implications for progress toward all SDGs, just as that progress also affects demographics in the positive feedback loop in Figure 5.
With respect to adult educational attainment, Figure 8 turns focus to the World Bank’s set of low-income countries, because they fall far below the SDGs’ call for universal secondary completion. Driving the values in Figure 8 (but not shown there), the CP scenario raises secondary completion to only about 40% for of-age students by 2050. With the substantial expenditure and other interventions elaborated in Supplementary Material SM2, secondary school completion rises from 19 percent in 2020 to 75 percent in 2050 in the HD and CSDG scenarios.
The result for the adult educational attainment stock variable shown in Figure 8 has a considerably slower rise than that of the secondary completion flow variable because of the gradual replacement of older adults with younger ones. Therefore, even the HD and CSDG scenarios raise adult attainment levels from 2020 to 2050 by only 3.5 years, well short of the 5.2 years in SSP1’s expectation. The NSS scenario’s value in 2050 differs little from that of the CP but is slightly higher. That can be attributed in part to the higher GDP of NSS, in turn a result of the improved environment.
The IFs CSDG attainment projection is above SSP2 but closer to that scenario than it is to SSP1, which counterintuitively grows very rapidly, even in the earliest years of the forecast horizon.
As Figure 5 suggests, these patterns for key driving variables in Figure 6, Figure 7 and Figure 8, themselves responsive to scenario assumptions, have implications that affect the dynamics for all variables in IFs across the SDGs. As in our earlier examination of most SDG indicators, we are seeing differences but not trade-offs across the scenarios in their impact on these major drivers. Complementarities better characterize the patterns.

3.3. Illustrative Sensitivity of Results to Scenario Components

Although comparisons across scenarios and understanding driving dynamics are important, sensitivity analysis can enhance those by decomposing scenarios into component elements, varying assumptions about intervention magnitudes, or directing analysis to specific countries or country groups. Here, we focus on the first and third of those.
The intervention clusters analyzed here (see again Table 1 and Table 2) have been shaped by a combination of the model structure, the SDG policy-focused literature, and known patterns of change over time. They are the subcomponents of the HD and NSS scenarios:
  • Lower global fertility rates. They have fallen around the world since the 1960s, with steady declines in the low-income grouping since the late 1980s but potential for faster decline.
  • Advances in agricultural productivity and energy production. Some diet changes away from meat are also possible.
  • Improvements in governance. Possibilities are increased democracy, reduced corruption, and generally enhanced effectiveness.
  • Increased mobilization and use of financial resources, with direct expenditures on education, health, infrastructure, and R&D. Given levels already reached in high-income countries, the focus is on other World Bank income groupings.
  • Rising government transfer payments in support of lower-income and generally less-skilled sub-populations.
  • Higher intergovernmental and non-governmental international assistance flows. Although, in recent years, the rise has slowed or even reversed, rates of aid as portions of GDP remain well below targets that many donors have identified.
Although generally not together, these cluster points of intervention have appeared prominently in various studies of progress on the SDGs [4,14,29,73].
Two focal points for the attention of those analyzing SDG progress are poverty reduction and the atmospheric concentration of greenhouse gases, especially carbon dioxide. Figure 9 shows the responsiveness of extreme poverty numbers in low-income (LI) countries to the scenario intervention clusters. Each cluster reduces poverty through 2050 relative to the CP; in combination, they cut the number of poverty sufferers by two-thirds. Perhaps surprisingly, the greatest impact comes from higher foreign aid, even though the intervention only raises aid outflow over time from high-income countries from a little more than 0.2% of GDP to 0.6%. One reason is that IFs represents “graduation” from aid receipts by middle-income countries over time as GDP per capita rises. Therefore, aid receipt becomes more concentrated in the low-income countries. That raises receipts from a little less than 10% of their GDP to about 20% in 2035 before falling steadily again. Given the difficulties that low-income countries face in raising revenues domestically, such global partnership boosts of aid facilitate great expansions in direct expenditures and transfers for sustainable human and environmental development.
Figure 10 shows the global impact of the intervention clusters on annual carbon emissions from fossil fuel use. Changes in agriculture and energy systems dominate that impact. We see small trade-off in the CSDG bar, related to improved governance and government expenditures, which boost GDP and energy demand. The trade-off is not huge, and the entire CSDG scenario does somewhat, albeit very inadequately, reduce emissions.
In future work, sensitivity analysis could usefully be extended across other SDG variables, with variations in intervention magnitude, and with more attention to temporal dynamics. This preliminary use complements our more extended analysis across broad scenarios. The results again suggest that efforts simultaneously to pursue SDGs across human development and environmental sustainability dimensions are mostly complementary, rather than generating substantial trade-offs or synergies.

4. Discussion

This study identified methodological challenges to integrated SDG analysis, including the needs for (1) comprehensive system representation with extended, integrated causal linkage, and temporally sensitive elaboration; (2) fiscal and physical resource accounting; (3) distinguishing actor category (households, governments, and firms) motivation and action; (4) addressing lags often with stock/flow representation; (5) recognizing that multiple targets associated with some goals may represent weakly correlated dimensions, and others, especially for biophysical sustainability, may not be quantified or country specific; (6) building intervention scenarios that are aggressive but reasonable (with policy relevance if not detail); and (7) country context sensitivity. Use of the IFs system and the HD and NSS scenarios in this project helped address these challenges but also illustrated the difficulties in overcoming them.
Among the remaining analytical limitations is that official SDG statements often omit quantitative targets, especially for environmental sustainability goals; specifications in this study can be questioned (see again Supplementary Material SM1). A related issue complicating the scaling of country-specific interventions is that while, in the language of private and public goods, the benefits of human development advances are mostly private to countries, most biophysical targets are themselves global. Individual country-based action that has local costs or benefits often makes limited contributions to generating globally public goods. The great real-world difficulty of setting and pursuing nationally determined contributions for carbon emissions relative to identifying national secondary education targets illustrates the distinction.
Another complication of analysis is that it is difficult to assign many interventions to only the HD or NSS set. For instance, reductions in air pollution, improved income distribution [74], and higher agricultural yields potentially belong in both. Sociopolitical interventions, including quality of governance (with related changes in policy orientations) and family planning, supported both sets in this analysis. Further work should more explicitly draw out the characteristics of governance and policy sets that support both HD and NSS. Additionally, changing population age structures with increased shares of the elderly and their claims on governmental resources may, in the longer term, begin to cut against some of the analysis explored here. More generally, further extensively integrated SDG analysis will benefit from the detailed elaboration of dynamic causal stories, identification of possible missing linkages in our tools that are important to those stories, and further elaboration and sensitivity analysis of the impacts of individual, subsets, and large clusters of interventions.

5. Conclusions

What general substantive insights can nonetheless and with caveats be drawn from the analysis here? With respect to progress toward the SDGs, the CP will achieve several human development targets at the aggregate global level by 2050 but not by 2030. This progress is, however, not true for goals related to biophysical system sustainability, with exceptions such as urban air quality. Further, even with extensive aggressive interventions, large numbers of countries will almost certainly not reach most targets in either goal subset by 2050.
With respect to synergies and trade-offs, synergies outweigh trade-offs between and especially within the HD and NSS intervention sets. Advances in education, health, poverty reduction, economic growth, and governance quality reinforce each other, and the IFs system helps assess magnitude. Yet, the economic advances associated with HD thrusts can increase the challenge in meeting some NSS targets such as for global fisheries and carbon emissions. This is at least true in the short run. In the longer term, economic advances may provide incentives and capacity for ameliorating or reversing that impact. As the discussion of Figure 5 suggests, it will be important to enhance the treatment of time (and lags of impact) in SDG analysis, not least because time can change the technological and sociopolitical context of the SDG relationship [29].
To reiterate a key motivation of this report, we want to facilitate analysis that represents the complexity of causal connections among the SDGs and interventions in countries and a world pursuing all of them simultaneously. Existing analytical approaches often focus on individual goals, direct connections among sets of them or nexus subsets, and/or use models with limited issue-area integration or temporal perspectives across complete goal sets. Using a toolkit incorporating a variety of innovations to support analysis, this study has hopefully advanced our understanding and analysis of prospects for reaching the SDGs. The push to achieve the SDGs and successors will be long ongoing, providing some time and many incentives for next steps in both analysis and goal pursuit.

Supplementary Materials

The following supporting information can be downloaded at: https://www.mdpi.com/article/10.3390/su17156672/s1.

Funding

This research did not receive any specific grant from funding agencies in the public, commercial or not-for-profit sectors.

Institutional Review Board Statement

Not applicable.

Informed Consent Statement

Not applicable.

Data Availability Statement

Data used and full results can be accessed and replicated by downloading the latest version of the IFs model, located at the following URL: https://korbel.du.edu/pardee/download-ifs/ (accessed on 2 July 2025).

Acknowledgments

Kaylin McNeil assisted earlier analysis of results and Clay Morgan has done so more recently. David Bohl prepared earlier versions of scenarios upon which this study builds. Jonathan Moyer gave very useful feedback on an earlier version of the manuscript. The much larger Pardee Institute team, past and present, including Steve Hedden, Mohammod Irfan, Kanishka Narayan, Dale Rothman, Taylor Hanna, José Solórzano, and Yutang Xiong, have extended and used the IFs system over many years, making this research possible.

Conflicts of Interest

The author declares no conflict of interest.

References

  1. UNGA. A/RES/70/1: Transforming Our World: The 2030 Agenda for Sustainable Development. United Nations General Assembly. Available online: https://sustainabledevelopment.un.org/content/documents/21252030%20Agenda%20for%20Sustainable%20Development%20web.pdf (accessed on 24 June 2025).
  2. Cuaresma, J.C.; Fengler, W.; Kharas, H.; Bekhtiar, K.; Brottrager, M.; Hofer, M. Will the Sustainable Development Goals be Fulfilled? Assessing Present and Future Global Poverty. Palgrave Commun 2018, 4, 29. [Google Scholar] [CrossRef]
  3. Dombrowsky, I.; Iacobuţă, G.I.; Daioglou, V.; Keppler, D.; Soergel, B.; Weindl, I.; Kriegler, E. Policy mixes for sustainable development pathways: Representation in integrated assessment models. Environ. Res. Lett. 2024, 20, 014030. [Google Scholar] [CrossRef]
  4. Hanna, T.; Hughes, B.B.; Irfan, M.T.; Bohl, D.K.; Solórzano, J.; Abidoye, B.; Patterson, L.; Moyer, J.D. Sustainable Development Goal Attainment in the Wake of COVID-19: Simulating an Ambitious Policy Push. Sustainability 2024, 16, 3309. [Google Scholar] [CrossRef]
  5. Moyer, J.D.; Hedden, S. Are we on the right path to achieve the sustainable development goals? World Dev. 2020, 127, 104749. [Google Scholar] [CrossRef]
  6. Soergel, B.; Rauner, S.; Daioglou, V.; Weindl, I.; Mastrucci, A.; Carrer, F.; Kikstra, J.; Ambrósio, G.; Aguiar, A.P.D.; Baumstark, L.; et al. Multiple pathways towards sustainable development goals and climate targets. Environ. Res. Lett. 2024, 19, 124009. [Google Scholar] [CrossRef]
  7. van Vuuren, D.P.; Kok, M.; Lucas, P.L.; Prins, A.G.; Alkemade, R.; Berg, M.v.D.; Bouwman, L.; van der Esch, S.; Jeuken, M.; Kram, T.; et al. Pathways to achieve a set of ambitious global sustainability objectives by 2050: Explorations using the IMAGE integrated assessment model. Technol. Forecast. Soc. Chang. 2015, 98, 303–323. [Google Scholar] [CrossRef]
  8. United Nations. Independent Group of Scientists appointed by the Secretary-General. In Global Sustainable Development Report 2019: The Future Is Now—Science for Achieving Sustainable Development; United Nations: New York, NY, USA, 2019. [Google Scholar] [CrossRef]
  9. Sachs, J.; Schmidt-Traub, G.; Kroll, C.; Lafortune, G.; Fuller, G. SDG Index and Dashboards Report 2018; Bertelsmann Stiftung and Sustainable Development Solutions Network (SDSN): New York, NY, USA, 2018. [Google Scholar]
  10. Bill and Melinda Gates Foundation. Goalkeepers: The Stories Behind the Data. Seattle: Bill and Melinda Gates Foundation and IHME, University of Washington. 2018. Available online: https://www.gatesfoundation.org/goalkeepersreport2017/ (accessed on 24 June 2025).
  11. Cuaresma, J.C. Income Projections for Climate Change Research: A Framework Based on Human Capital Dynamics. Glob. Environ. Chang. 2017, 42, 226–236. [Google Scholar] [CrossRef]
  12. Lucas, P.L.; Hilderink, H.B.; Janssen, P.H.; Kc, S.; van Vuuren, D.P.; Niessen, L. Future Impacts of Environmental Factors on Achieving the SDG Target on Child Mortality—A Synergistic Assessment. Glob. Environ. Chang. 2019, 57, 101925. [Google Scholar] [CrossRef]
  13. Weitz, N.; Nilsson, M.; Davis, M. A Nexus Approach to the Post-2015 Agenda: Formulating Integrated Water, Energy, and Food SDGs. SAIS Rev. 2014, 34, 37–50. [Google Scholar] [CrossRef]
  14. Obersteiner, M.; Walsh, B.; Frank, S.; Havlík, P.; Cantele, M.; Liu, J.; Palazzo, A.; Herrero, M.; Lu, Y.; Mosnier, A.; et al. Assessing the land resource–food price nexus of the Sustainable Development Goals. Sci. Adv. 2016, 2, e1501499. [Google Scholar] [CrossRef] [PubMed]
  15. Sellers, S.; Ebi, K.L. Climate Change and Health under the Shared Socioeconomic Pathway Framework. Int. J. Environ. Res. Public Health 2017, 15, 3. [Google Scholar] [CrossRef] [PubMed]
  16. Riahi, K.; Van Vuuren, D.P.; Kriegler, E.; Edmonds, J.; O’Neill, B.C.; Fujimori, S.; Bauer, N.; Calvin, K.; Dellink, R.; Fricko, O.; et al. The Shared Socioeconomic Pathways and Their Energy, Land Use, and Greenhouse Gas Emissions Implications: An Overview. Glob. Environ. Chang. 2017, 42, 153–168. [Google Scholar] [CrossRef]
  17. Kriegler, E.; O’Neill, B.C.; Hallegatte, S.; Kram, T.; Lempert, R.J.; Moss, R.H.; Wilbanks, T. The Need For and Use of Socio-Economic Scenarios for Climate Change Analysis: A New Approach Based on Shared Socio-Economic Pathways. Glob. Environ. Chang. 2012, 22, 807–822. [Google Scholar] [CrossRef]
  18. O’Neill, B.C.; Kriegler, E.; Ebi, K.L.; Kemp-Benedict, E.; Riahi, K.; Rothman, D.S.; van Ruijven, B.J.; van Vuuren, D.P.; Birkmann, J.; Kok, K.; et al. The Roads Ahead: Narratives for Shared Socioeconomic Pathways Describing World Futures in the 21st Century. Glob. Environ. Chang. 2017, 42, 169–180. [Google Scholar] [CrossRef]
  19. van Vuuren, D.; O’Neill, B.; Tebaldi, C.; Chini, L.; Friedlingstein, P.; Hasegawa, T.; Riahi, K.; Sanderson, B.; Govindasamy, B.; Bauer, N.; et al. The Scenario Model Intercomparison Project for CMIP7 (ScenarioMIP-CMIP7). EGUsphere 2025, 2025, 1–38. [Google Scholar] [CrossRef]
  20. Riahi, K.; Krey, V.; Bertram, C.; Kriegler, E.; Luderer, G.; Van Vuuren, D.; Roelfsema, M.; van Soest, M.; Schaeffer, R.; Pachauri, S.; et al. Linking Climate and Sustainable Development: Policy Insights From National and Global Pathways; IIASA: Laxenburg, Austria, 2019; Available online: https://pure.iiasa.ac.at/id/eprint/16235/1/CD-Links-for-web_final_November_2019.pdf (accessed on 24 June 2025).
  21. TWI2050—The World in 2050. Transformations to Achieve the Sustainable Development Goals: Report Prepared by The World in 2050 Initiative; International Institute for Applied Systems Analysis (IIASA): Laxenburg, Austria, 2018; Available online: www.twi2050.org (accessed on 24 June 2025).
  22. van Soest, H.L.; van Vuuren, D.P.; Hilaire, J.; Minx, J.C.; Harmsen, M.J.; Krey, V.; Popp, A.; Riahi, K.; Luderer, G. Analyzing Interactions among Sustainable Development Goals with Integrated Assessment Models. Glob. Transit. 2019, 1, 210–225. [Google Scholar] [CrossRef]
  23. Sahadevan, D.; Irfan, M.T.; Luo, C.; Moyer, J.D.; Mason, C.; Beynon, E. Charged for Change: The Case for Renewable Energy in Climate Action; UNDP: New York, NY, USA; Pardee Institute for International Futures: Denver, CO, USA; Octopus Energy: London, UK, 2025. [Google Scholar]
  24. van Vuuren, D.P.; Zimm, C.; Busch, S.; Kriegler, E.; Leininger, J.; Messner, D.; Nakicenovic, N.; Rockstrom, J.; Riahi, K.; Sperling, F.; et al. Defining a sustainable development target space for 2030 and 2050. One Earth 2022, 5, 142–156. [Google Scholar] [CrossRef]
  25. Nilsson, M.; Griggs, D.; Visbeck, M. Policy: Map the interactions between Sustainable Development Goals. Nature 2016, 534, 320–322. Available online: https://www.nature.com/news/policy-map-the-interactions-between-sustainable-development-goals-1.20075 (accessed on 24 June 2025). [CrossRef] [PubMed]
  26. International Council for Science (ICSU); International Social Science Council (ISSC). Review of the Sustainable Development Goals: The Science Perspective. 2015. Available online: https://doi-org.du.idm.oclc.org/10.1177/0973408215600602h (accessed on 24 June 2025).
  27. International Council for Science (ICSU). A Guide to SDG Interactions: From Science to Implementation; Griggs, D.J., Nilsson, M., Stevance, A., McCollum, D., Eds.; International Council for Science: Paris, France, 2017; Available online: https://pure.iiasa.ac.at/14591 (accessed on 24 June 2025).
  28. Weitz, N.; Carlsen, H.; Nilsson, M.; Skånberg, K. Towards systemic and contextual priority setting for implementing the 2030 Agenda. Sustain. Sci. 2017, 13, 531–548. [Google Scholar] [CrossRef] [PubMed]
  29. Pradhan, P.; Costa, L.; Rybski, D.; Lucht, W.; Kropp, J.P. A Systematic Study of Sustainable Development Goal (SDG) Interactions. Earth’s Future 2017, 5, 1169–1179. [Google Scholar] [CrossRef]
  30. Pradhan, P.; Joshi, S.; Dahal, K.; Hu, Y.; Subedi, D.R.; Putra, M.P.I.F.; Vaidya, S.; Pant, L.P.; Dhakal, S.; Hubacek, K.; et al. Policy relevance of IPCC reports for the Sustainable Development Goals and beyond. Resour. Environ. Sustain. 2025, 19, 100192. [Google Scholar] [CrossRef]
  31. Millennium Institute. iSDG Model Documentation; Millennium Institute: Washington, DC, USA; Geneva, Switzerland, 2017; Available online: https://isdgdoc.millennium-institute.org/en/_static/isdg-documentation-en.pdf (accessed on 24 June 2025).
  32. Collste, D.; Pedercini, M.; Cornell, S.E. Policy Coherence to Achieve the SDGs: Using Integrated Simulation Models to Assess Effective Policies. Sustain. Sci. 2017, 12, 921–931. [Google Scholar] [CrossRef] [PubMed]
  33. Dixson-Declève, S.; Gaffney, O.; Ghosh, Y.; Randers, J.; Rockström, J.; Stoknes, P.E. Earth for All: A Survival Guide for Humanity; New Society Publishers: Gabriola Island, BC, Canada, 2022. [Google Scholar]
  34. Sen, A. Development: Which way now? Econom. J. 1983, 93, 745–762. [Google Scholar] [CrossRef]
  35. Scobie, M. Policy coherence in climate governance in Caribbean Small Island Developing States. Environ. Sci. Policy 2016, 58, 16–28. [Google Scholar] [CrossRef]
  36. Zimm, C.; Sperling, F.; Busch, S. Identifying Sustainability and Knowledge Gaps in Socio-Economic Pathways Vis-à-Vis the Sustainable Development Goals. Economies 2018, 6, 20. [Google Scholar] [CrossRef]
  37. Dagnachew, G.; Hof, F. Climate change mitigation and SDGs: Modelling the regional potential of promising mitigation measures and assessing their impact on other SDGs. J. Integr. Environ. Sci. 2022, 19, 289–314. [Google Scholar] [CrossRef]
  38. Hughes, B.B. Development-Oriented Policies and Alternative Human Development Paths: Aggressive But Reasonable Interventions; UNDP-HDRO Occasional Papers No. 2013/05; United Nations: New York, NY, USA, 2013; Available online: https://ssrn.com/abstract=2344474 (accessed on 24 June 2025).
  39. Gable, S.; Lofgren, H.; Rodarte, I.O. Trajectories for Sustainable Development Goals: Framework and Country Applications; World Bank. License: Washington, DC, USA, 2015; Available online: https://www.greenpolicyplatform.org/sites/default/files/downloads/resource/Trajectories_for_Sustainable_Development_Goals_WorldBank.pdf (accessed on 24 June 2025).
  40. Li, C.-I.J. A 1998 Social Accounting Matrix (SAM) for Thailand. TMD Discussion Paper 95, Figure 1; International Food Policy Research Institute: Washington, DC, USA, 2002; Available online: https://hdl.handle.net/10568/157997 (accessed on 7 June 2025).
  41. Hughes, B.B. International Futures: Building and Using Global Models; Elsevier Academic Press: London, UK, 2019; ISBN 9780128042717. [Google Scholar]
  42. Hughes, B.B.; Hillebrand, E.E. Exploring and Shaping International Futures; Paradigm: Boulder, CO, USA, 2006. [Google Scholar]
  43. Hughes, I.; Hernandez, A.M.; Glynn, J.; Hynes, W.; Gallachóir, B.Ó. Conceptualizing global cultural transformation—Developing deep institutional scenarios for whole of society change. Environ. Res. Lett. 2024, 19, 094050. [Google Scholar] [CrossRef]
  44. Hughes, B.B. International Futures (IFs) and Integrated, Long-term Forecasting of Global Transformations. Futures 2016, 81, 98–118. [Google Scholar] [CrossRef]
  45. Sellers, S. Cause of death variation under the shared socioeconomic pathways. Clim. Chang. 2020, 163, 559–577. [Google Scholar] [CrossRef] [PubMed]
  46. Nordhaus, W.D.; Moffat, A. A Survey of Global Impacts of Climate Change: Replication, Survey Methods, and a Statistical Analysis; Yale University: New Haven, CT, USA, 2017; Available online: https://www.nber.org/papers/w23646 (accessed on 7 June 2025).
  47. Burke, M.; Hsiang, S.M.; Miguel, E. Global non-linear effect of temperature on economic production. Nature 2015, 527, 235–239. [Google Scholar] [CrossRef] [PubMed]
  48. Hughes, B.B.; Narayan, K.; Xu, Y. Enhancing integrated analysis of national and global goal pursuit by endogenizing economic productivity. PLoS ONE 2021, 16, e0246797. [Google Scholar] [CrossRef] [PubMed]
  49. Dellink, R.; Chateau, J.; Lanzi, E.; Magné, B. Long-Term Economic Growth Projections in the Shared Socioeconomic Pathways. Glob. Environ. Chang. 2017, 42, 200–214. [Google Scholar] [CrossRef]
  50. Guterres, A. The Sustainable Development Goals Report 2020; United Nations: New York, NY, USA, 2020; pp. 1–64. Available online: https://unstats.un.org/sdgs/report/2020/The-Sustainable-Development-Goals-Report-2020.pdf (accessed on 24 June 2025).
  51. United Nations. Department of Economic and Social Affairs. Global indicator Framework for the Sustainable Development Goals and Targets of the 2030 Agenda for Sustainable Development. Revised Annually, see E/CN.3/2020. 2020. Available online: https://unstats.un.org/sdgs/indicators/indicators-list/ (accessed on 7 June 2025).
  52. United Nations Economic and Social Council. Progress towards the Sustainable Development Goals: Supplementary Information (statistics). E/2020/57. 2020. Available online: https://unstats.un.org/sdgs/indicators/database/ (accessed on 7 June 2025).
  53. United Nations. Independent Group of Scientists appointed by the Secretary-General. In Global Sustainable Development Report 2023: Times of Crisis, Times of Change: Science for Accelerating Transformations to Sustainable Development; United Nations: New York, NY, USA, 2023; Available online: https://sdgs.un.org/sites/default/files/2023-09/FINAL%20GSDR%202023-Digital%20-110923_1.pdf (accessed on 7 June 2025).
  54. Ravallion, M. How Long Will It Take To Lift One Billion People Out Of Poverty? World Bank Res. Obs. 2013, 28, 139–158. [Google Scholar] [CrossRef]
  55. Costello, C.; Ovando, D.; Clavelle, T.; Strauss, C.K.; Hilborn, R.; Melnychuk, M.; Branch, T.A.; Gaines, S.D.; Szuwalski, C.S.; Cabral, R.; et al. Global fishery prospects under contrasting management regimes. Proc. Natl. Acad. Sci. USA 2016, 113, 5125–5129. [Google Scholar] [CrossRef] [PubMed]
  56. Agricultural Organization of the United Nations. The State of World Fisheries and Aquaculture 2018—Meeting the Sustainable Development Goals; License: CC BY-NC-SA 3.0 IGO; Agricultural Organization of the United Nations: Rome, Italy, 2018. [Google Scholar]
  57. Ye, Y.; Cochrane, K.; Bianchi, G.; Willmann, R.; Majkowski, J.; Tandstad, M.; Carocci, F. Rebuilding global fisheries: The World Summit goal, costs and benefits. Fish Fish. 2013, 14, 174–185. [Google Scholar] [CrossRef]
  58. Wackernagel, M.; Hanscom, L.; Lin, D. Making the Sustainable Development Goals Consistent with Sustainability. Front. Energy Res. 2017, 5, 18. [Google Scholar] [CrossRef]
  59. Galli, A.; Đurović, G.; Hanscom, L.; Knežević, J. Think globally, act locally: Implementing the sustainable development goals in Montenegro. Environ. Sci. Policy 2018, 84, 159–169. [Google Scholar] [CrossRef]
  60. Dang, H.-A.H.; Serajuddin, U. Tracking the sustainable development goals: Emerging measurement challenges and further reflections. World Dev. 2020, 127, 104570. [Google Scholar] [CrossRef]
  61. United Nations Environment Programme (UNEP). “The Emissions Gap Report 2019.” United Nations Environment Program, Nairobi, Kenya. 2019. Available online: https://www.unep.org/emissions-gap-report-2020 (accessed on 24 June 2025).
  62. Olson, M. The Logic of Collective Action; Harvard University Press: Cambridge, MA, USA, 1965; ISBN 9780674537514. [Google Scholar]
  63. Weber, M. Economy and Society: An Outline of Interpretive Sociology; University of California Press: Berkeley, CA, USA, 1978; Volume 1. [Google Scholar]
  64. Bhan, M.; Sharma, D.; Ashwin, A.; Mehra, S. Policy forum: Nationally determined climate commitments of the BRICS: At the forefront of forestry-based climate change mitigation. For. Policy Econ. 2017, 85, 172–175. [Google Scholar] [CrossRef]
  65. Andrijevic, M.; Cuaresma, J.C.; Muttarak, R.; Schleussner, C.-F. Governance in socioeconomic pathways and its role for future adaptive capacity. Nat. Sustain. 2019, 3, 35–41. [Google Scholar] [CrossRef]
  66. Leininger, J.; Buhaug, H.; Gilmore, E.A.; Lindberg, S.; Andrijevic, M.; Bauer, N.; Jewell, J.; Moyer, J.; Soergel, B.; Tosun, J.; et al. Climate Futures are Political Futures: Integrating Political Development Into the Shared Socioeconomic Pathways (SSPs). Zenodo 2024. [Google Scholar] [CrossRef]
  67. Rogge, K.S.; Reichardt, K. Policy mixes for sustainability transitions: An extended concept and framework for analysis. Res. Policy 2016, 45, 1620–1635. [Google Scholar] [CrossRef]
  68. Rothman, D.S.; Raskin, P.; Kasper Kok, K.; Robinson, J.; Jager, J.; Hughes, B.; Paul, C.; Sutton Paul, C. Global Discontinuity: Time for a Paradigm Shift in Global Scenario Analysis. Sustainability 2023, 15, 12950. [Google Scholar] [CrossRef]
  69. Coscieme, L.; Mortensen, L.F.; Anderson, S.; Ward, J.; Donohue, I.; Sutton, P.C. Going beyond Gross Domestic Product as an indicator to bring coherence to the Sustainable Development Goals. J. Clean. Prod. 2020, 248, 119232. [Google Scholar] [CrossRef]
  70. Food Wastage Footprint (Project). Food Wastage Footprint: Impacts on Natural Resources; Summary Report; Natural Resources Management and Environment Department: Rome, Italy; FAO: Rome, Italy, 2013; Available online: http://www.fao.org/3/i3347e/i3347e.pdf (accessed on 7 June 2025).
  71. Moyer, J.D.; Hughes, B.B.; Mohammod, T.I.; Solórzano, J.R.; Petry, C.L.; Xiong, Y.T.; Taylor, H.; Meisel, H.C. Broadly Quantifying the Roads Ahead: SSPs for 188 Countries to 2150; Pardee Institute for International Futures: Denver, CO, USA, 2025; Manuscript in preparation. [Google Scholar]
  72. Samir, K.C.; Lutz, W. The Human Core of the Shared Socioeconomic Pathways: Population Scenarios by Age, Sex and Level of Education for All Countries to 2100. Glob. Environ. Chang. 2017, 42, 181–192. [Google Scholar] [CrossRef] [PubMed]
  73. Moyer, J.D.; Bohl, D.K. Alternative Pathways to Human Development: Assessing Trade-Offs and Synergies in Achieving the Sustainable Development Goals. Futures 2019, 105, 199–210. [Google Scholar] [CrossRef]
  74. Rao, N.D.; Sauer, P.; Gidden, M.; Riahi, K. Income inequality projections for the Shared Socioeconomic Pathways (SSPs). Futures 2019, 105, 27–39. [Google Scholar] [CrossRef]
Figure 1. The basic models of the IFs system and illustrative linkages. Source: author.
Sustainability 17 06672 g001
Figure 2. Progress toward SDGs through 2020 and 2050 in the Current Path scenario. Notes: See Table 3 for target values. Using IFs Version 8.37. SM5 provides the same analysis for the lower-middle-income country group.
Sustainability 17 06672 g002
Figure 3. Progress toward single SDG targets through 2050 in alternative scenarios. Notes: See Table 3 for target values. Using IFs Version 8.37. SM5 provides the same analysis for the lower-middle-income country group.
Sustainability 17 06672 g003
Figure 4. Percentage global progress toward each SDG target from 2020 to 2050. Notes: See Table 3 for 2020 and operationalized target values. Using IFs Version 8.37.
Sustainability 17 06672 g004
Figure 5. Causal diagram with focus on GDP, population, and educational attainment. Notes: Hughes (2019) [41] and the IFs Wiki (https://pardeewiki.du.edu/index.php?title=International_Futures_(IFs), accessed on 6 December 2024) elaborate.
Sustainability 17 06672 g005
Figure 6. Comparison of global GDP at PPP across IFs scenarios and in SSP1 and 2 (2023 Revision). Notes: Using IFs Version 8.37; see Supplementary Material SM3 and Supplementary Material SM5 for more comparative analysis. The growth patterns of the HD and CSDG bars are very similar.
Sustainability 17 06672 g006
Figure 7. Comparison of global population across IFs scenarios and in SSP1 and 2 (2023 Revision). Notes: Using IFs Version 8.37; see Supplementary Material SM3 and Supplementary Material SM5 for more comparative analysis.
Sustainability 17 06672 g007
Figure 8. Comparison of adult (25+) years of educational attainment in low-income countries across IFs scenarios and in SSP1 and 2 (2023 Revision). Notes: Using IFs Version 8.37; see Supplementary Material SM3 and Supplementary Material SM5 for more comparative analysis.
Sustainability 17 06672 g008
Figure 9. Low-income country poverty headcount across clusters of scenario intervention. Comparison of adult (25+) years of educational attainment in low-income countries across IFs scenarios and in SSP1 and 2 (2023 Revision). Notes: Using IFs Version 8.37; see Supplementary Material SM3 and Supplementary Material SM5 for more comparative analysis.
Sustainability 17 06672 g009
Figure 10. Global carbon emissions across clusters of scenario intervention. Global comparison across IFs scenarios and in SSP1 and 2 (2023 Revision). Notes: Using IFs Version 8.37; see Supplementary Material SM3 and Supplementary Material SM5 for more comparative analysis.
Sustainability 17 06672 g010
Table 1. SDG target and intervention agency categories.
SDG Target Categories
Human Development (Goals 1–10)Sustainability (Goals 6–7, 11–15)Means/Instrumental (Goals 16–17)
Scenario Intervention Agents and Generalized ActionHouseholds: Social behavior Zero hunger (and good nutrition); Good health; Quality education; Gender equality; Clean water and sanitationFertility patterns (not an SDG); Responsible consumption and production
Governments: Spending, regulation, and informationNo poverty, Zero hunger, Good health; Quality education; Gender quality; Clean water and sanitation; Affordable and clean energy; Reduced inequalitiesSustainable cities and communities; Responsible consumption and production; Climate action; Life below water; Life on landPeace, justice, and strong institutions; Partnerships for the goals
Firms: Technological advance and utilization Decent work and economic growthResponsible consumption and productionIndustry, innovation and infrastructure
Source: author.
Table 2. Summary of leverage points in the scenarios.
Model Issue AreaHuman Development (HD) Leverage Points
EducationSocial support reinforced by government spending for enrollment, progression, completion and transition to and through at least upper secondary level (girls and boys); attention to science/engineering programs
HealthAttention to improved health across populations (supported by additional household and government funding), with special attention to children and the undernourished; safe water and sanitation infrastructure availability
InfrastructureSpecial attention to water, sanitation, electricity, and mobile broadband access, and reduced indoor air pollution (using modern cookstoves)
Natural System Sustainability (NSS) Leverage Points
AgricultureAccelerated advance in yields and improved control of losses at three stages of the food chain; shift of diets to less meat; increased forest area; more efficient water use
EnergyIntroduction/raising of carbon taxes; general increase in low carbon energy technology and production; increased energy use efficiency; reduced electricity transmission losses
Oceans and environmentReduced fish catch by major fishing nations; increased control of urban air pollution; more efficient water use
Leverage Points in Both Scenario Sets
PopulationSupport for family planning to reduce fertility rates beyond high-income countries
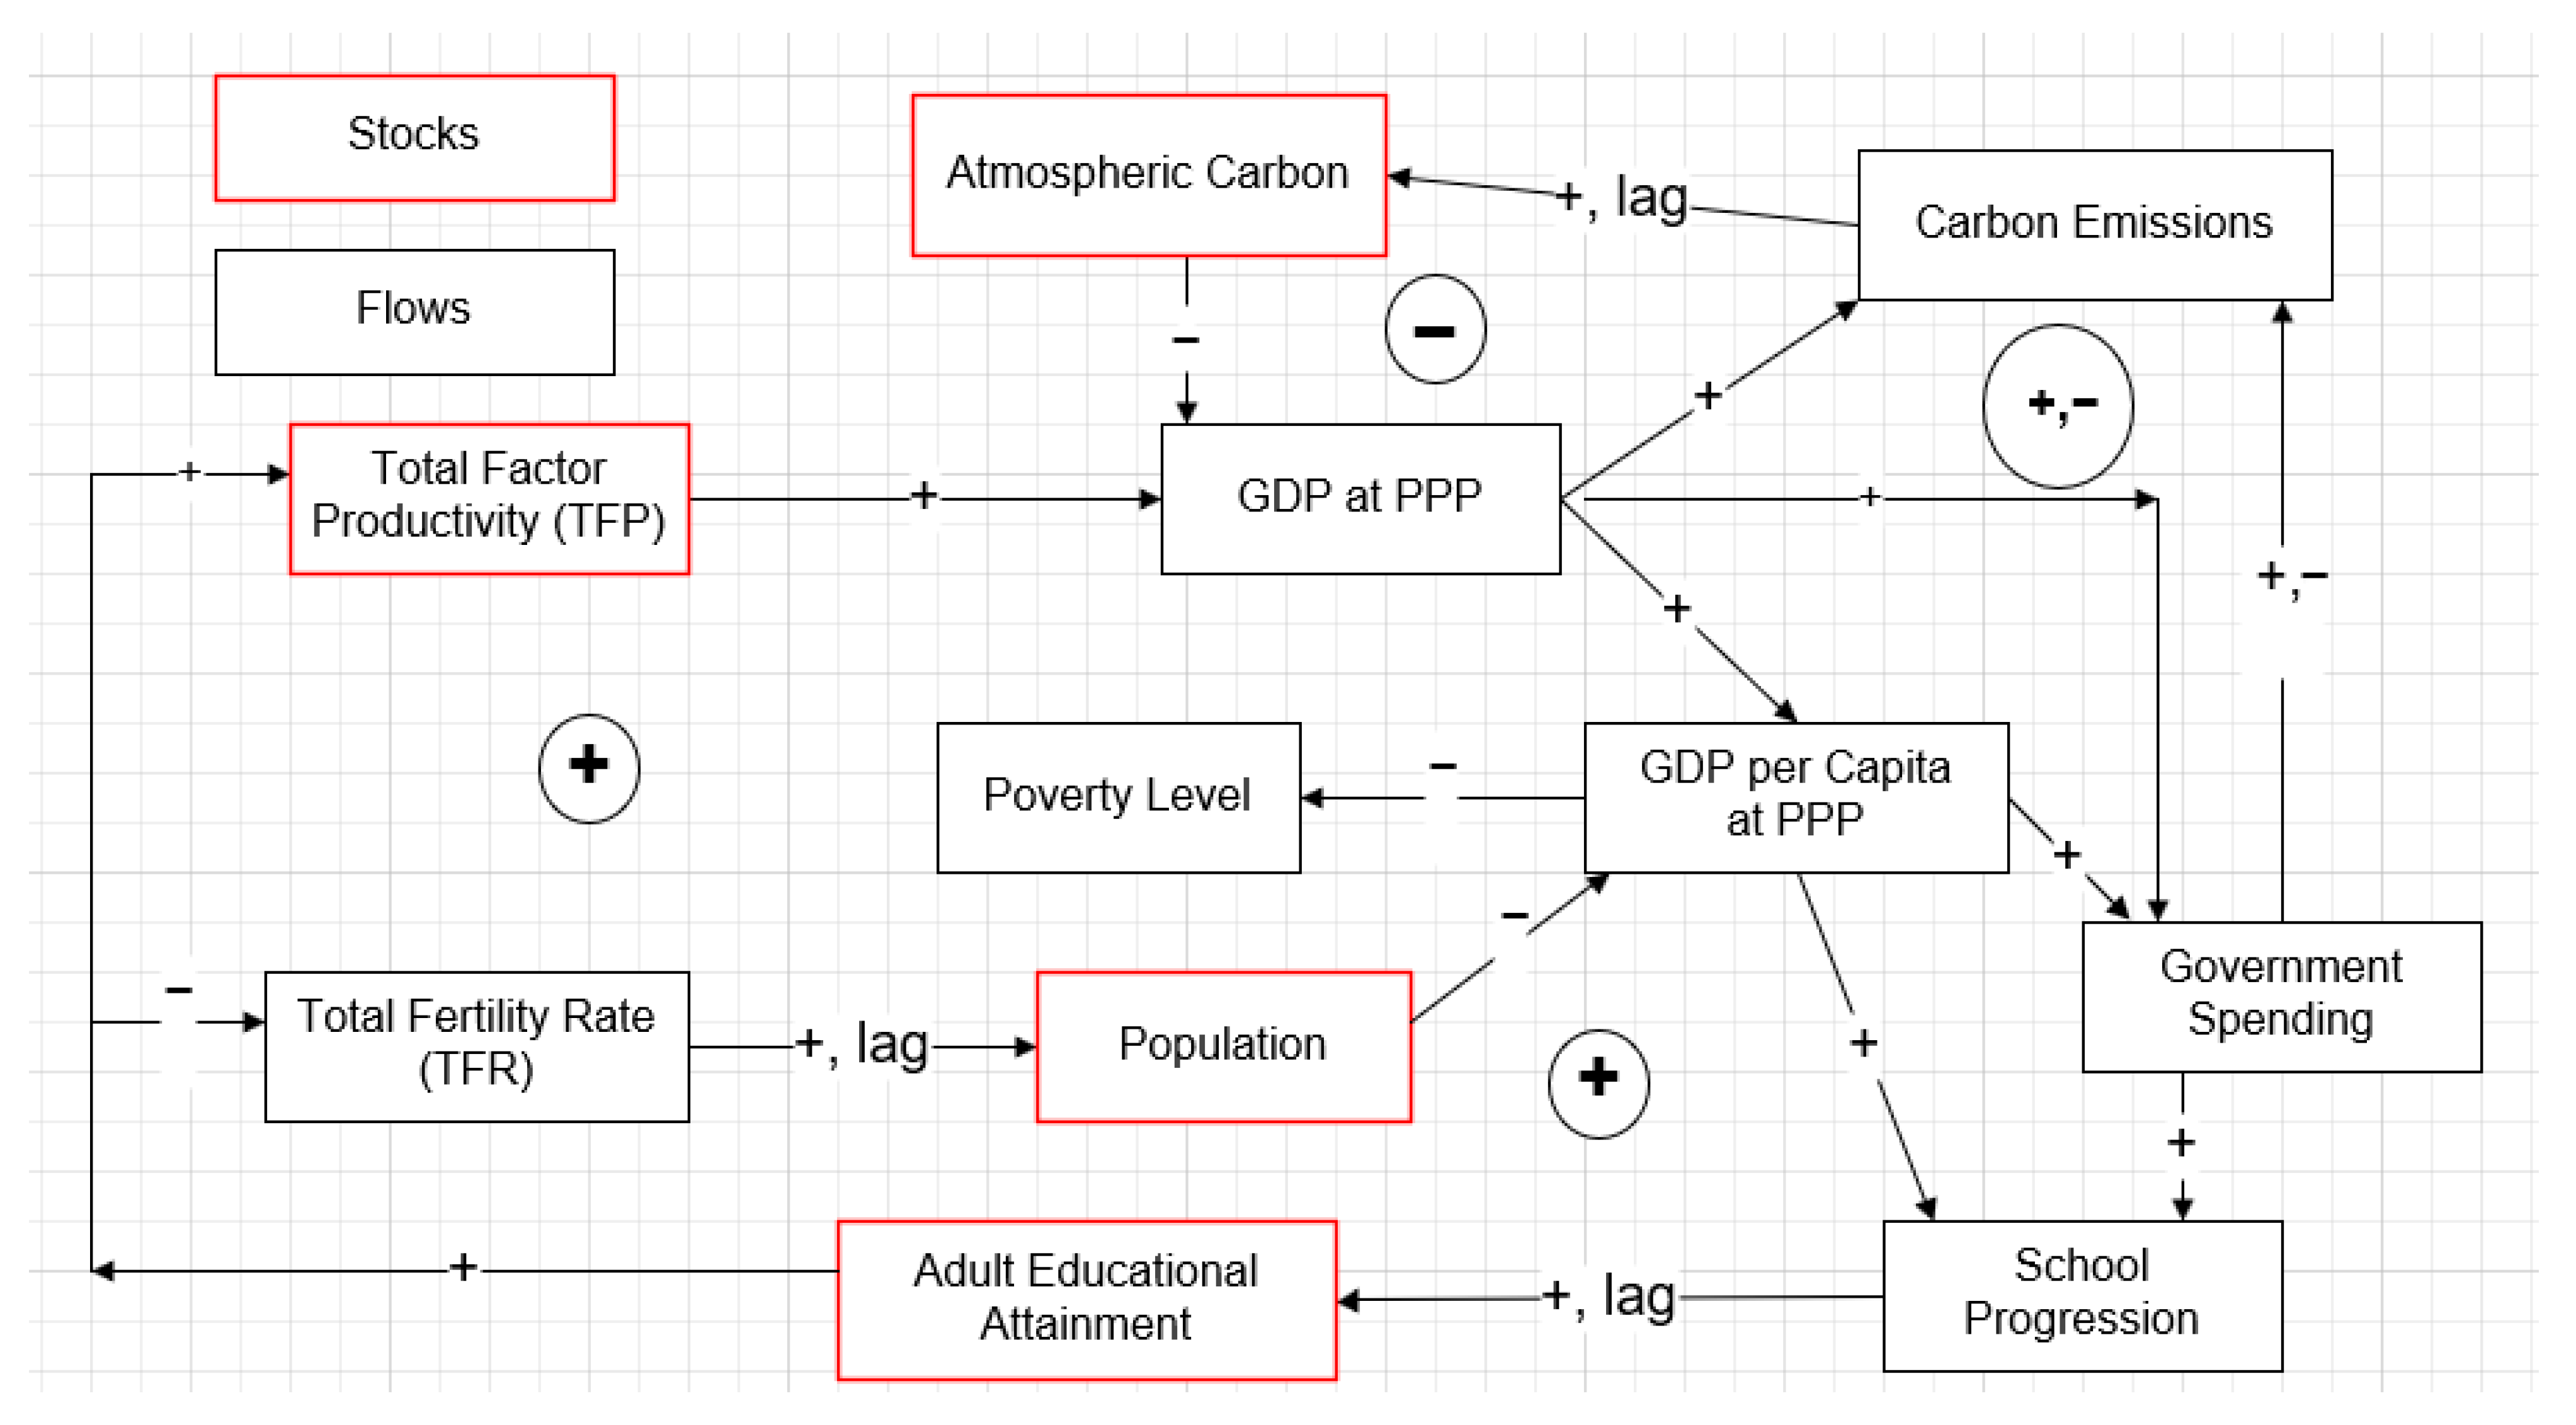
EconomyUse within IFs of (1) the endogenous productivity representation, (2) the SAM, and (3) the partial physical model integrative linkages to the general equilibrium structure to collectively translate other interventions endogenously to economic growth; there are no direct economic growth interventions
GovernanceIncreased government effectiveness, with special attention to decreasing inequality and enhancing inclusion/democracy; reduced corruption
Government financeIncreased spending on education, health, infrastructure, R&D (also private spending) with implicit reductions in military spending; increased transfers to unskilled (poorer) households
Global interactionsIncreased aid, trade, foreign direct investment, and migration with remittances
Notes: SM2 provides specific parametric interventions and scaling information. Using IFs Version 8.37. Source: author.
Table 3. Global and country-number performance of scenarios in pursuit of selected SDG targets.
Goals by Number, Targets by Name, and
Associated Indicator Variables
Current PathHuman DevelopmentNatural Systems Combined
202020302050203020502030205020302050
1.1 PovertyGlobal % living on <$2.15/day9.98.15.17.42.17.83.07.52.0
# countries < 3%10511613611161117147118161
1.1 PovertyGlobal % living on <$3.65/day24.619.813.218.86.819.39.018.96.7
# countries < 3%7586107881318712290131
2.2 HungerGlobal % children undernourished14.812.17.511.46.011.96.911.36.1
# countries < 3%627282709067817190
3.1 HealthGlobal maternal mortality per 100,000210.8175.886.4153.857.6156.262.5153.457.3
# countries < 70107126167143184142183143184
3.2 HealthGlobal infant mortality per 1000 births28.623.615.421.29.422.312.121.09.3
# countries < 1290112136114163113139115163
4.1 Education (Girls)Global secondary gross completion % girls58.864.574.268.992.264.878.269.092.4
# countries > 97%3165324106166124107
4.1 Education (Boys)Global secondary gross completion % boys58.862.189.662.189.462.474.568.289.6
# countries > 97%153414955471496
5.2 Gender EqualityGlobal violence against women deaths/100,0002.22.11.62.11.62.11.62.11.6
# countries <1/100,000556472668065796680
6.1 Safe WaterGlobal improved water %93.694.896.199.810094.896.899.8100
# countries > 97%97111126181188111130188188
6.2 Safe SanitationGlobal improved sanitation %78.180.383.497.299.380.485.497.299.3
# countries > 97%879210117118892103171188
7.1 Modern EnergyGlobal electricity access %90.491.294.197.110097.199.997.2100
# countries > 95%113126134156188156188156188
7.2 Renewable EnergyGlobal % energy non-fossil 6.511.135.211.139.511.241.811.243.4
# countries > 50%
(production)
1830100301143011630121
8.3 Growth and WorkGlobal informal labor share41.440.940.138.329.940.837.938.329.8
# countries < 10%404548558047595679
9.1 Resilient InfrastructureGlobal % within 2 km of all-weather road74.675.878.876.083.476.081.776.183.6
# countries > 97%45629562104629762104
10.4 InequalityGlobal average country GINI0.380.380.380.370.360.370.360.370.36
# countries < 0.30333337333733333337
11.6 Safe CitiesGlobal urban pollution (PPM2.5) mg/cm42.834.222.631.517.732.517.029.913.8
# countries < 12324799611315212566148
12.2 Sustainable Resource UseGlobal water demand as % of renewable28.829.732.129.933.628.724.028.925.1
# countries < 90%1091049710495108111106108
12.3 Food Loss ReductionGlobal % food chain loss15.814.814.313.811.314.313.313.110.3
# countries < 8%121315131626362745
13.1 Climate Resilience/Adaptive CapacityGlobal government capacity index (0–1)0.410.480.570.520.700.520.700.520.71
# countries > 0.7284574531175410556118
13.2 Carbon EmissionsGlobal carbon emissions (billion tons); global 2050 goal = 59.110.09.110.19.89.87.89.88.0
# countries below 50% of 2000 valuesNA527522537536
14.4 OverfishingGlobal ocean catch (goal ≤ 50 mmt)95.496.699.296.7100.493.586.293.586.5
# countries with share <2×population share134134131134133130128131129
15.1 Protection of ForestsGlobal forest size in million hectares
(2050 goal = 4250 mha)
404540254005402540054055417940554180
# countries >their 2020 valueNA55725578102129103129
16.5 Corruption
(Transparency = 10-Corruption)
Global transparency level (1–10)4.34.95.95.57.75.57.45.57.7
# countries > 8102346349434876495
17.2 International AidOECD Aid % of GDP0.220.190.180.430.620.190.140.430.63
# OECD > 0.7% of GDP322111400311
Notes: Bolded goal names indicate variables and targets used in radar diagrams, Figure 2 and Figure 3. Green shading indicates goal attainment. Unless indicated, the global goal is the same as the national. For detail on IFs variables plus selected goals and targets see Supplementary Material 1 (SM1). Using IFs Version 8.37.
Disclaimer/Publisher’s Note: The statements, opinions and data contained in all publications are solely those of the individual author(s) and contributor(s) and not of MDPI and/or the editor(s). MDPI and/or the editor(s) disclaim responsibility for any injury to people or property resulting from any ideas, methods, instructions or products referred to in the content.

