Article

An Analysis of the Compatibility Between Popular Carbon Footprint Calculators and the Canadian National Inventory Report

by
Elizabeth Arif
1,2,†,
Anupama A. Sharan
3,† and
Warren Mabee
3,4,*
1
School of Environmental Studies, Queen’s University, Kingston, ON K7L 3N6, Canada
2
Northern Ontario School of Medicine, Sudbury, ON P3E 2C6, Canada
3
School of Policy Studies, Queen’s University, Kingston, ON K7L 3N6, Canada
4
Department of Geography and Planning, Queen’s University, Kingston, ON K7L 3N6, Canada
*
Author to whom correspondence should be addressed.
These authors contributed equally to this work.
Sustainability 2025, 17(14), 6629; https://doi.org/10.3390/su17146629
Submission received: 10 June 2025 / Revised: 7 July 2025 / Accepted: 11 July 2025 / Published: 21 July 2025
(This article belongs to the Section Sustainable Management)

Abstract

Personal lifestyle choices contribute up to 75% of national emissions and yet the greenhouse gas (GHG) inventories included in the National Inventory Report (NIR) of Canada provide limited insight on these choices. Better insight can be found using carbon footprint calculators that estimate individual emissions; however, they vary in regard to their input parameters, output data, and calculation methods. This study assessed five calculators, which are popular with the public, or compatibility with the Canadian NIR. A quantitative scoring matrix was developed to assess the output depth, academic proficiency, and effectiveness of the calculators to inform lifestyle changes, alongside NIR alignment. The results showed that the calculator with the overall highest cumulative score across all the comparative criteria was the one offered by Carbon Footprint Ltd. The other calculators that scored highly include CoolClimate Calculator and Carbon Independent. The potential of the calculators in regard to informing low-carbon lifestyles can be improved through the incorporation of more depth in terms of capturing the purchase information of goods and services and providing detailed secondary information to users, including mitigation strategies and carbon offset options. The main driver of incompatibility between the calculator tools and the NIR was the different approaches taken to the emissions inventory, with the NIR using a territorial framework and the calculators being consumption driven. The outcomes of this study demonstrate a global need for the evolution of NIR structuring to increase its relatability with citizens and for the improved standardization of publicly available tools.

1. Introduction

Effective action to reduce greenhouse gas (GHG) emissions is critical, as the effects of climate change are becoming undeniably evident. Natural disasters caused due to unexpectedly rapid shifts in global weather phenomena are destabilizing essential ecosystems and impacting natural resources, one of the cornerstones of the Canadian economy [1]. Canada is among the leading countries for global environmental stewardship as a signatory to the Paris Agreement, the first international agreement to set legally binding targets for GHG emissions reductions at national levels [2]. This agreement mandates that all signatories report annually to the United Nations Framework Convention on Climate Change (UNFCCC) on their national GHG emissions in the standardized format of national inventory reports (NIRs). These reports must be written using the Intergovernmental Panel on Climate Change’s (IPCC) 2006 Guidelines for National GHG Inventories and must contain data on cumulative anthropogenic GHG emissions across major economic sectors within a territorial framework [3]. Canada currently employs a “top-down” inventory approach, wherein the estimates are calculated at the provincial/territorial level and are organized into five sectors: (1) energy, (2) Industrial Processes and Product Use, (3) agriculture, (4) Land Use and Land Use Changes and Forestry, and (5) Waste. The development of NIRs has driven change in many countries by enabling policymakers to identify both sources and sinks for GHG emissions and to set national carbon mitigation strategies accordingly [4]. Canada has seen a decline in national emissions as a result of the formulation of climate-smart policies, supported by the NIR [5].
While NIRs are pivotal to meeting national GHG emissions reduction targets, GHG emissions attributed to the personal lifestyle or consumption choices of individuals are only minimally included in this form of national reporting. Personal GHG emissions, or personal carbon footprints, are the emissions that are associated with an individual’s actions and lifestyle over a given period of time [6]. It has been shown that personal and household emissions can contribute up to 60–75% of total national emissions [7,8]. Research has demonstrated that there is a strong association between an individual’s concern about climate change and their knowledge of personal GHG emissions [8,9,10]. Personal lifestyles and daily decisions of individuals can be greatly influenced by GHG accounting methods and the presentation of this data [10]. However, when national reports do not provide the amount of education and awareness needed for individuals to understand personal carbon inventories and reduction strategies, these reports can create frustration and apathy [11].
This apathy is evidenced by recent alarming drops in the public’s concern regarding climate change in Canada [12]. The removal of national pricing of carbon emissions in Canada, which included a consumer-facing component as a surcharge on carbon-based fuels, will likely exacerbate this issue further [13]. Previously, the act of paying a carbon charge provided consumers with valuable information related to their carbon footprint and acted as an incentive for them to choose greener, tax-free options. In the absence of this source of information, it is critical that alternative mechanisms are developed to inform consumers and enable them to support the development of low-carbon sustainable lifestyles. Other imminent policy measures, such as the adoption of carbon border adjustment mechanisms [14], further underscore the need for an increase in the reflection of individuals’ personal emissions and the collection of emission data beyond the standard sectoral frameworks outlined in the NIR.
Carbon footprint calculators are digital user-friendly tools that are readily available for people to estimate their personal or household GHG emissions. There are many organizations, such as governments, non-governmental organizations (NGOs), and businesses, that offer carbon footprint calculators as a way for individuals to calculate their personal GHG inventory [15]. These calculators typically focus on household size and energy consumption, travel, food choices, the purchase of goods and services, and other relevant personal activities [16]. In addition to primary consumption-based outputs, several of these tools also provide important secondary data that enhances the user’s knowledge base around the available choices to help them reduce their personal carbon footprint. Unlike NIRs, these calculators do not have a governing body to mandate the input data used, calculation methodologies, or output data [17]. However, academia is rich in studies that aim to create a better understanding and establish international best practices for personal carbon calculators. Research has been conducted to assess calculators from the point of view of the quality of the input data [15], governmentality [11,18], consistency and transparency [19], comprehensiveness [15,17], usability [15], and overall effectiveness [8,9]. The lack of standardization of carbon footprint calculator tools is one of the key reasons why their ability to support national mitigation efforts is constrained [8]. As stand-alone tools, they cannot be expected to influence change in the absence of supporting policy mechanisms [8,9]. One of the methods to tackle these challenges is through the exploration of avenues that allow for the integration of personal emissions data obtained through the use of calculators into national GHG goals as reflected in NIRs, which, in turn, are standardized under IPCC regulations.
Best practices in terms of carbon footprint calculators and international and national inventory reports are drawn from the same principles [17], such as the use of 100-year Global Warming Potential (GWP) conversion factors. There are, however, also many differences. The most prominent example of this concerns the scope of each of these inventories: the NIR is a territorial accounting system, while carbon calculators are based on a consumption-based accounting system. The IPCC establishes that NIRs are territorial accounting systems and states that they must “include greenhouse gas emissions and removals taking place within national (including administered) territories and offshore areas over which the country has jurisdiction” [20] (p. 5). This means that the Canadian NIR will include any emissions produced within its borders and offshore areas that fall under the jurisdiction of Canada [21]. Conversely, academia has determined that best practices for carbon footprint calculators are based on consumption-based inventories [17]. A consumption-based inventory includes the emissions associated with an individual’s consumption practices [21] (p. 2). This creates vastly different inventories in terms of the input data (emission sources) and resulting output data.
The goal of this study is, therefore, to explore the possibility of incorporating personal carbon footprint calculations with the information from the Canadian NIR to outline and inspire specific and individualized mitigation strategies and lifestyle changes for Canadians to reduce their personal GHG emissions. This goal can be broken down into three research questions: (RQ 1) What pre-existing carbon footprint calculator is the best in the field and what type of output data does it generate? (RQ 2) What types of carbon footprint calculation output data are most critical to inform lifestyle changes for Canadians to reduce their GHG emissions? (RQ 3) Which pre-existing carbon footprint calculator can best inform these lifestyle changes and is also most compatible with the Canadian NIR? Furthermore, for the purpose of this research, this paper defines two types of carbon calculator output data: (1) numerical carbon footprint data, and (2) secondary output information. Numerical carbon footprint data refers to any numerical output that represents an individual’s carbon footprint in the unit of carbon dioxide equivalent emissions (eCO2). Secondary output information refers to any additional information that is provided by the calculator to provide a perspective for and educate the user as a result of the calculation.

2. Methods

2.1. Research Framework

A combined qualitative and quantitative approach was used to answer the main research questions in this study. Qualitative analysis was used to create the main comparative frameworks in this study and quantitative scoring was then used to evaluate the performance of the selected carbon calculator tools within these frameworks in regard to two critical aspects: (1) its compatibility with the Canadian NIR, and (2) its potential to inspire lifestyle changes for the reduction of personal carbon footprints. Prior to a comparison of the calculators, an essential first step was the selection of the calculators to be analyzed in the study. This was conducted using a mixed methodology, combining online rank-based sorting algorithms, as well as previously published academic scoring matrices, to yield the most highly ranked calculators. Figure 1 summarizes the workflow of the study. The scoring scales for all the criteria in this study were fixed at 0–3, in order to ensure comparability with the seminal academic works used to select the calculators.

2.2. Calculator Selection

The scope of this study was limited to digitally available and openly accessible calculators. Two priorities were determined in regard to choosing the calculators to analyze: (1) their popularity, and (2) those that worked best in practice. The popularity of the calculator was determined using Google search engine’s PageRank algorithm [22] that prioritizes the relevancy of the search results in order to present the most popular pages from the search input. Google search was operated in incognito mode to avoid bias based on search history. Furthermore, since the geographical scope of this research is limited to Canada, any calculators found through Google that were specific to a location other than Canada or that used location-specific emission factors and activities that significantly differed from the standard IPCC calculation guidelines, were eliminated from the further analysis. This search was first conducted on 3 January 2022, and replicated over a 6-month period. A Google search query for “carbon footprint calculators” was used to determine the top 10 most relevant and popular calculators. The search engine’s rankings of the results were scaled from 0 to 3, with the most popular result being given the maximum score of 3 and the least popular result being given the minimum score of 0. This scale was chosen in order to be comparable with the best-in-practice score (see below).
For determining the best-in-practice calculators, two seminal papers by Birnik (2013) [17] and Mulrow et al. (2019) [15] were chosen to score the calculators obtained through the online popularity search. The standardization of available online calculator outputs is often contentious, and this is tackled in the work by Birnik (2013) [17], wherein 13 principles are defined for the purpose of accuracy and precision in the calculation of carbon footprints. These principles were used to objectively evaluate existing online calculators. Similarly, Mulrow et al. (2019) [15] developed 15 criteria to evaluate the input quality and user engagement in order to rank carbon footprint calculators. Due to the collective breadth of these studies and their current relevance in academia, this research used these pre-existing comprehensive analysis frameworks to determine the best-in-practice calculators. The scoring scale for this priority category was set to 0–3, reflective of the score established by Birnik (2013) [17]. The scores assigned to the calculators in the work by Murlow et al. (2019) [15] were scaled to a maximum of 3 to be comparable to those established by Birnik (2013) [17] and were averaged for the calculators that were common to both of these studies. The calculators that were obtained from Google, but were not included in either of these studies, were not considered for the final selection and, for the calculators that were included in only one study, the scaled score from that study was used in the place of an average.
Finally, a total score was assigned to all the calculators using the sum of the scores for both categories in order to select the top 5 calculators to be analyzed in this study (1). It must be noted that only the best-in-practice score was used for the final comparison of the selected calculators described later in this study (see Section 2.4) and the popularity of the selected calculators did not impact the final scores.
Cumulative score for calculator selection = Google PageRank Score + Best-in-practice score

2.3. Development of Comparative Indices for the Analysis of Carbon Calculators

2.3.1. Review and Synthesis of Academic Literature

A comprehensive literature review of both academic (Google Scholar, Web of Science) and grey (IPCC and Government of Canada) sources was conducted to retrieve publications, standards, reports, and other relevant types of information to develop a thorough understanding of international, national, and personal GHG accounting practices. In parallel, as described in the previous section, the literature on carbon footprint calculators was also reviewed, focusing on publications that explored calculator accuracy, their effectiveness in informing mitigation strategies, best practices in the field, their role in governmentality, and the quality of input and output data. Furthermore, the calculators selected through the previously described methods were further analyzed to understand the quality of the output data and their compatibility with the Canadian NIR [23]. The Canadian NIR, in turn, was thoroughly analyzed in order to outline the existing reporting categories and identify emission sources and sinks that were more closely related to personal lifestyle choices and understand its potential compatibility with calculator outputs. Based on this review, three indices were chosen to compare and score the calculators based on a comparable scale of 0–3. The scaling method differed for each index and is described in the respective sections.

2.3.2. Index 1: Depth of Calculator Output Values

Prior to conducting a compatibility comparison with the Canadian NIR, each of the selected calculators was analyzed to differentiate all the discrete emission outputs. Despite differences in the number and types of outputs from the calculators, it was possible to group the outputs into four major categories corresponding to typical lifestyle activities: (1) household, (2) transport, (3) travel, and (4) diet. A fifth general category, “other”, was also defined as a broader grouping of the calculator outputs that did not fit into the other defined categories, mostly related to the purchase of goods and services. These categories are defined in Figure 2. This figure was generated in part using the GenAI tool, Apple Image Playground (available with macOS Sequoia 15.2), using textual prompts to generate illustrative images for each of the lifestyle activity categories.
The number of outputs for a given calculator in regard to these categories was determined. Each category was assigned a value equal to the average number of outputs across all the calculators in that category. A scale of 0–3 was used to convert the number of outputs into scores. A calculator was awarded 3 points if the number of outputs was over the average for a given category, 2 points if it was equal to or within ±1.0 of the average, 1 point if it was below the average, and it was awarded 0 if there was no relevant output data. Finally, the calculators were assigned a total score equal to the average of the scores across all the categories (Figure 3).

2.3.3. Index 2: Compatibility of Calculator Outputs with the Canadian National Inventory Report (NIR)

This index was developed to determine which calculators had the highest number of output values that were directly relatable to any single emission sector, as reported in the Canadian NIR. Briefly, these sectors are defined based on the IPCC guidelines and include energy, agriculture, Industrial Processes and Product Use (IPPU), Waste, and the Land Use and Land Use Change and Forestry (LULUCF) sectors. The energy sector further consists of Stationary Combustion, transport, and Fugitive sources [23]. To analyze this, the individual calculator emission output values outlined for Index 1 were used and each output was assessed to see if it could be directly associated with one of the emission sectors in the NIR. Following this evaluation, each calculator was again scored on a scale of 0–3, based on the average number of compatible outputs across all of the calculators. A calculator was awarded 3 points if the number of compatible outputs was over the average, 2 points if it was equal to or within ±1.0 of the average, 1 point if it was below the average, and it was awarded 0 if there was no relevant output data (Figure 4).

2.3.4. Index 3: Potential Effectiveness of Calculators to Inspire Lifestyle Changes

For scoring based on this index, six evaluation categories were developed to determine the potential effectiveness of a calculator for inspiring lifestyle changes to reduce personal carbon footprints through the analysis of the relevant literature sources [8,9,25]. These categories are summarized in Table 1 and relate to the type of secondary output information that is provided at the end of the analysis carried out by a carbon footprint calculator. Five categories used a binary “yes (3)/no (0)” assessment, whereas the sixth category was numerical in nature. Each category was weighted equally, and the calculators then received a score between 0 and 3 for each of the categories. For the sixth evaluation category, a scoring scheme was developed to capture the minimum and maximum values of the initial numerical outputs of all the calculators. These data were then scaled between 0 and 3 to retain their comparability with the other evaluation categories. These six categories were then scored individually, and the average was used as the final score for each calculator (Table 1).

2.4. Comparison of Selected Calculators

Lastly, four scores were used to compare the calculators. These included the scores from the three indexes, as well as the best-in-practice scores. These four scores were plotted on a radar plot generated in MS Excel, with the normalized scale of 0–3 being used across all the score categories. A total score for each calculator could then be determined according to the area covered by the radar plot. This final score determined the calculator that was most compatible with the Canadian NIR, which had the most potential to inspire a reduction in personal GHG emissions.

3. Results

3.1. Selection of the Top Five Carbon Footprint Calculators

A combined approach was used to select the calculators that are both already popular and academically sound, as described previously. A popularity search, conducted through the use of Google on 3 January 2022, using the search string “carbon footprint calculators”, was used to determine the top 10 most relevant and popular calculators and a popularity score scaled from 0 to 3 was assigned using the search rankings. The reproducibility of this approach was tested by repeating the search over several months and conducting searches without using the incognito mode. The same calculator results were obtained from the searches, and the search results were scaled according to the popularity score (Table 2). The popularity score reflects the ranking as per the incognito mode, which was found to differ slightly from the regular search mode, due to the presence of promoted or sponsored results. Any such results were excluded from the analysis.
Next, the best-in-practice score was determined using previous ratings and scores from the works of Birnik (2013) [17] and Mulrow et al. (2019) [15], respectively. These results were scaled according to the 0–3 scale. In the work by Birnik (2013), a rating of “Strong” was scored as 3, “Average” as 2, and “Weak” as 1 (Table 5, [17]). In regard to the work of Mulrow et al. (2019), the calculator with the highest relative original score was assigned a value of 3 and the other scores were scaled accordingly (Figure 1 radar plot score, [15]). Calculators that were not included in both studies were not included in the selection process and for the calculators included in either one of the studies, the scaled score from that study only was used. The average of the scaled scores was used for the final best-in-practice score for the calculators that were present in both of the studies (Table 2).
Based on a cumulative analysis of the popularity and best-in-practice scores, the top five carbon footprint calculators selected for comparison in this study were Carbon Footprint Ltd., The Nature Conservancy, Conservation International, the CoolClimate Calculator, and Carbon Independent (Table 3). During the period of the research, it was found that Nature Conservancy had recently started to employ the CoolClimate Calculator and, therefore, Terrapass was included in this analysis in its place. Terrapass was chosen over US EPA due to its higher best-in-practice score and, even though it references EPA conversion factors in its calculations, which can differ, at times, from IPCC factors, it has location specific data for Canada. The Global Footprint Network and Carbonzero were eliminated from the cumulative analysis as they were not covered in either of the academic studies.

3.2. The Depth of the Outputs Varies Markedly Across Carbon Footprint Calculators

The goal of this evaluation was to determine which carbon calculator had the most output data or depth. Although the calculators varied drastically in terms of the number and types of outputs, five clear categories emerged according to which the outputs could be grouped, as described previously. Interestingly, there was no one calculator which had the highest quantity of outputs across all the categories. Carbon Footprint Ltd. had the highest number of outputs in the household, transport, and other categories, and Carbon Independent had the highest number of outputs in the diet category. All the calculators had the same number of outputs in the travel category, referring to air travel (Table 4). Where applicable, single/point emission source outputs have been identified in the table, due to their better compatibility with the Canadian NIR. For details on the outputs refer to Table S1 (Supplementary Information).
Subsequently, the scoring of the calculators based on the average output values in each category showed that Carbon Footprint Ltd. and Carbon Independent had the same depth score. This was due to the differing number of outputs for each calculator across the evaluation categories (Table 5).
More output data should, in theory, enable a more comprehensive translation of personal GHG emissions [17]. A relatively high number of emission sources and input data would indeed allow for better evaluation of the calculator’s compatibility with the Canadian NIR. To provide effective mitigation strategies, the output values must be transparent in terms of what they represent [26]. Therefore, an output value is most valuable to an inventory when it represents a single emission source and, in this way, it can also be more easily related to the NIR.

3.3. Differences in the Types of Inventories Limit the Compatibility of Carbon Footprint Calculators with the Canadian National Inventory Report (NIR)

The output values of the selected carbon calculators were analyzed for their compatibility with the Canadian NIR [23]. Only those outputs that represented a single source of emission and could be directly related to the IPCC emission sectors in the NIR were considered. The most relatable outputs, therefore, fell into the household energy, transport, travel, and agriculture categories (Table S1, Supplementary Information). The outputs encompassing the purchase of other goods and services could not be related to the NIR. It should be noted that the calculators follow a consumption-style inventory of emissions and the NIR uses a geographic emissions inventory. Despite this difference, for the purpose of this study, the common outputs have been identified to identify areas of alignment for future work. This is discussed further, later in the paper (Section 4.2).
This analysis showed that Carbon Footprint Ltd. had the highest number of relatable output values in comparison to the NIR. This calculator presented individual output values for all the different types of energy used to heat a house, including electricity, natural gas, heating oil, coal, LPG, propane, and wooden pellets [27]. Wooden pellets were not linked with the NIR, as in the NIR they are included under “Waste” rather than the “Energy” sector [23]. Carbon Independent and the CoolClimate Calculator followed in terms of the highest number of relatable output values in comparison to the NIR, which scored similarly. Conservation International was found to have only two outputs that could be related to the NIR. The calculators were then assigned a scaled score between 0 and 3, based on the average number of relatable outputs across all the calculators (Table 6).

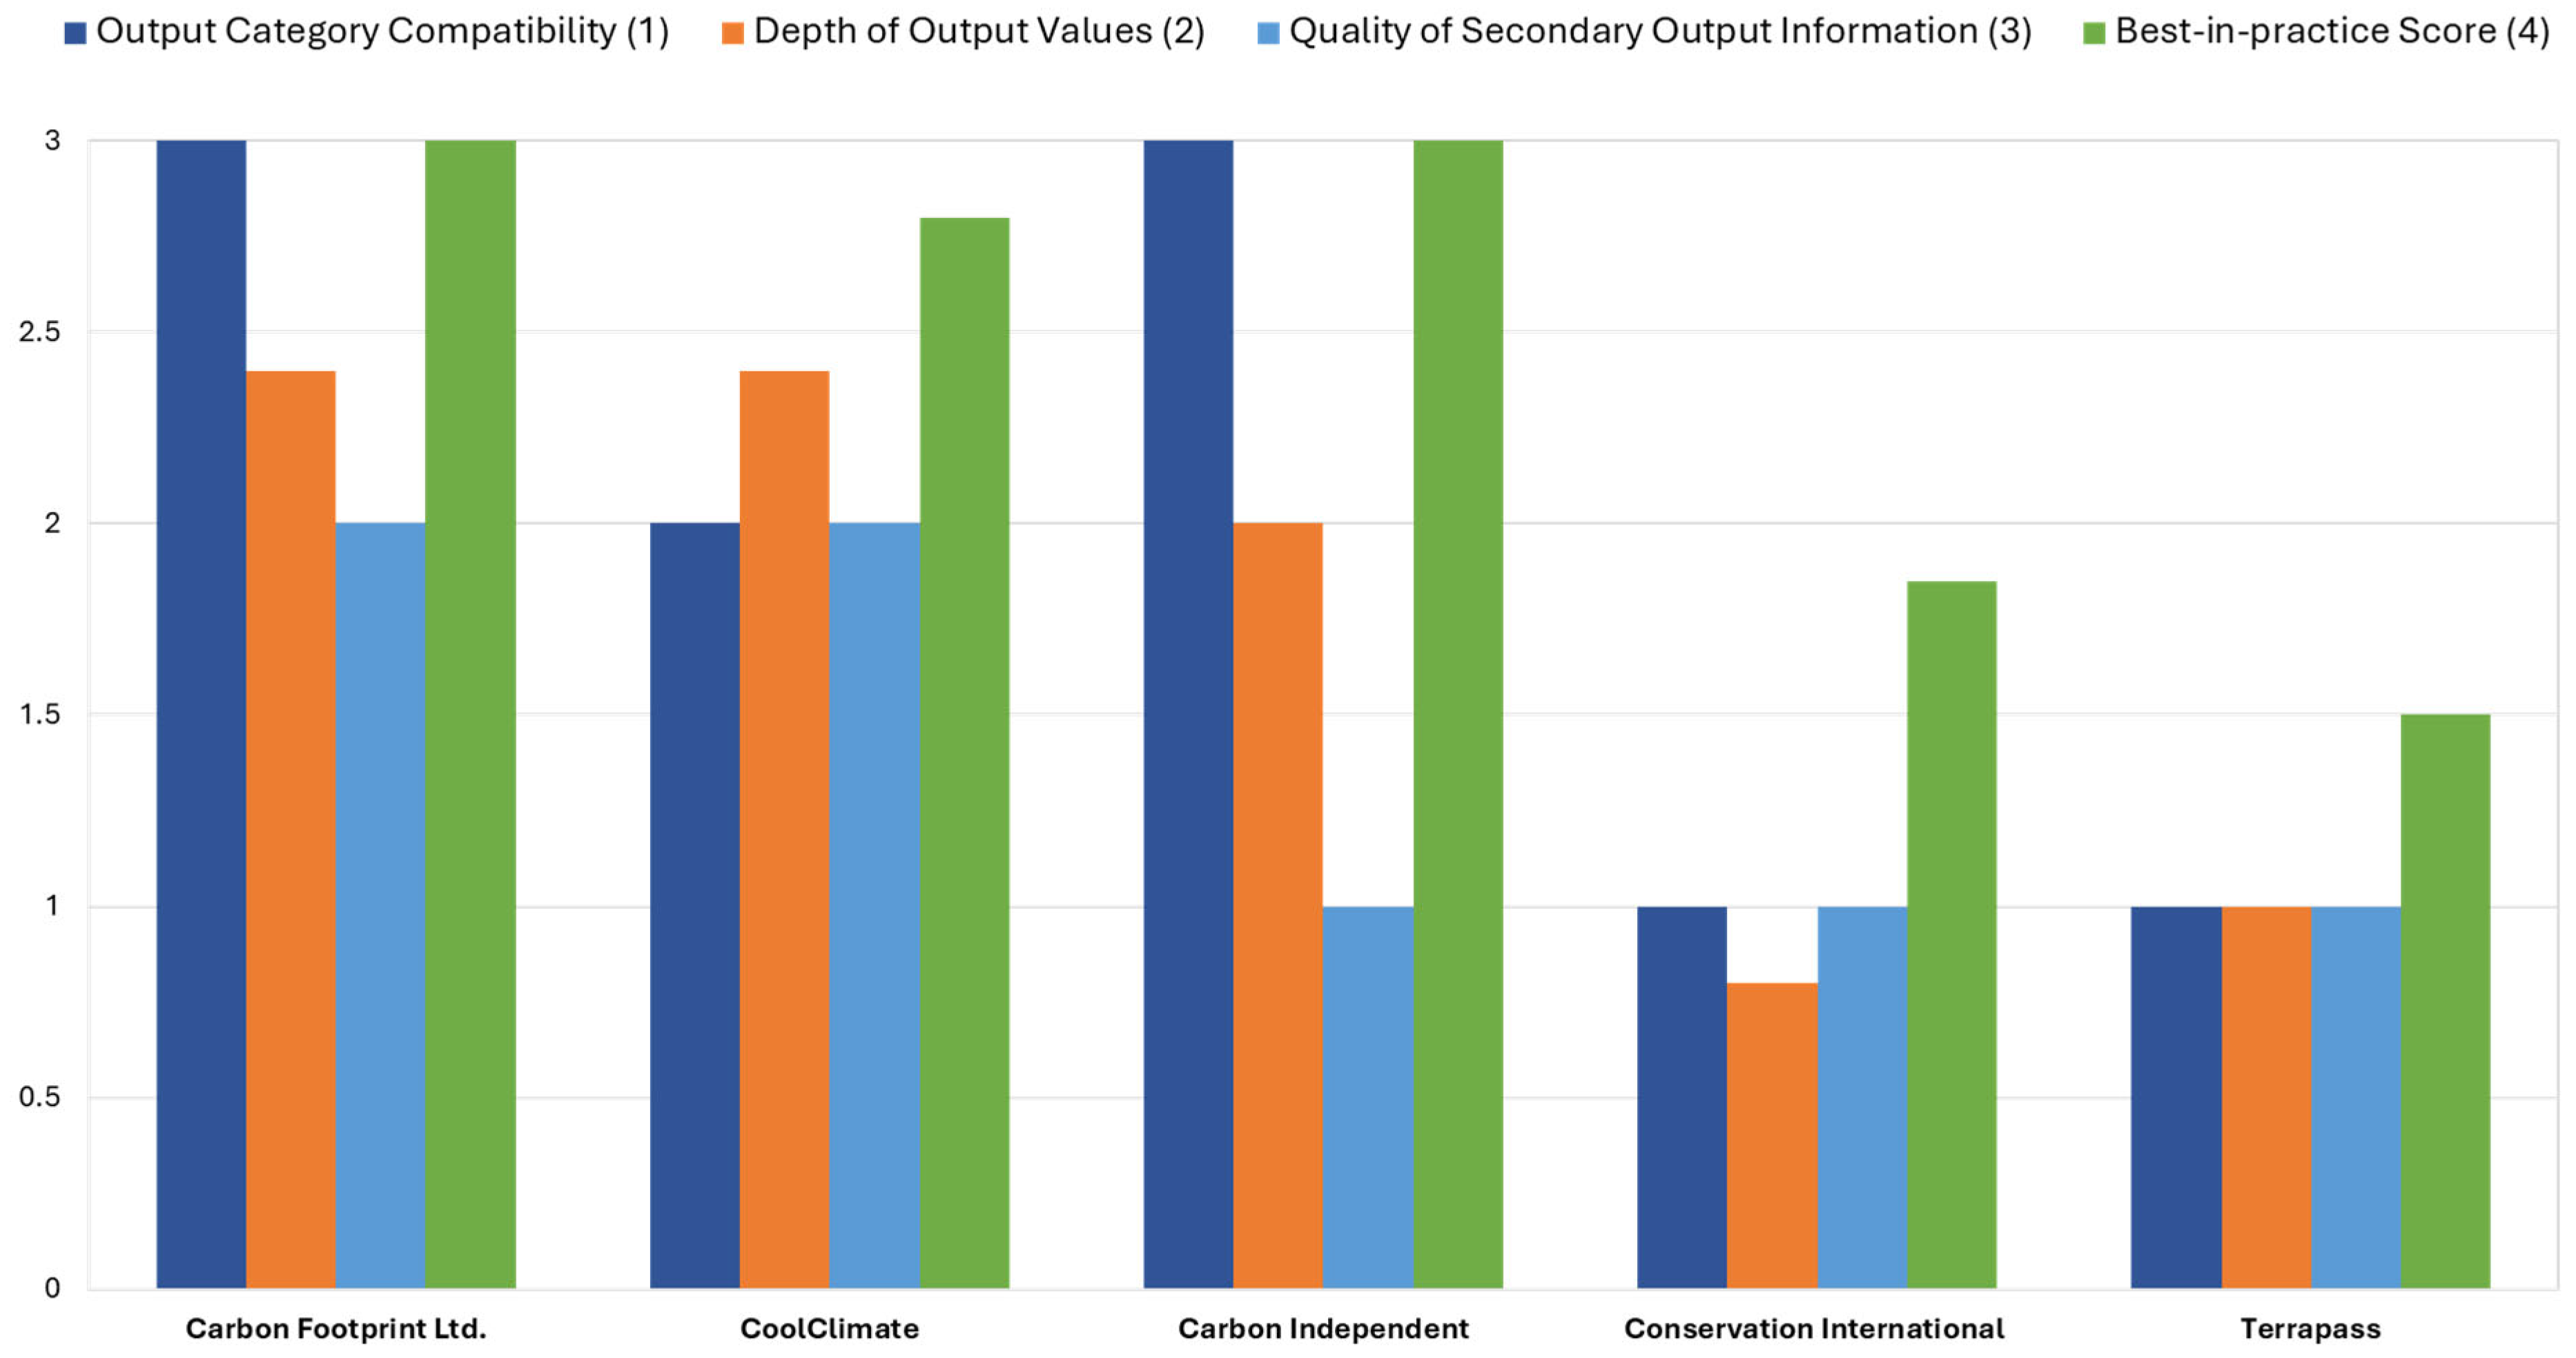
3.4. The Carbon Footprint Calculators Most Compatible with the Canadian National Inventory Report (NIR) Are Also Most Effective at Inspiring Low-Carbon Lifestyle Changes

The effectiveness of the calculators in regard to inspiring low-carbon lifestyle changes was evaluated by analyzing the quality of the secondary output information that was provided to the users of these tools. The secondary output information relates to the ability of the calculator to educate and create awareness in users about the available choices to reduce their carbon footprint in regard to their day-to-day activities. All the calculators were found to offer carbon footprint comparisons between typical consumer choices. However, most of the calculators did not offer options to recalculate the emissions after the user had chosen mitigation strategies, except for the CoolClimate Calculator (Table 7).
Overall, Carbon Footprint Ltd. and the CoolClimate Calculator scored similarly and had the highest potential effectiveness for inspiring lifestyle changes. Carbon Footprint Ltd. was also previously demonstrated to be compatible with the Canadian NIR. However, generally, the ability of all the calculators to provide detailed and quality secondary information was found to be lacking, evidenced by the fact that none of the calculators attained the highest overall score of 3 (Table 8).

3.5. Carbon Footprint Ltd. Determined as Carbon Footprint Calculator of Choice in a Canadian Context

Each calculator was assigned a final score between 0 and 3 in terms of all the three evaluation indices. The final comparison also utilized the best-in-practice scores from the calculator selection process. All the scores (Figure 5) form the axes of a radar plot (Figure 6). This visualization outlines the respective strengths and weaknesses of the calculators and further outlines the diversity in terms of their outputs. Carbon Footprint Ltd., the CoolClimate Calculator, and Carbon Independent all scored competitively, whereas the scores for Conservation International and Terrapass were consistently low for all the assessments.
Based on the overall area in the radar plot (Figure 6), Carbon Footprint Ltd. emerged as the strongest calculator that can be currently used in tandem with the Canadian NIR. It consistently scored highly across all the categories. The CoolClimate Calculator closely follows in the rankings. However, its low compatibility score makes it less desirable to be used with the NIR. Similarly, Carbon Independent has competitive scores in all of the categories, except for its potential effectiveness represented by the quality of secondary information provided to users. This means that it could be relatively ineffective in regard to inspiring lifestyle practices that reduce personal GHG footprints.

4. Discussion

4.1. Popular Carbon Footprint Calculator Choices Might Not Be the Most Academically Proficient

Carbon footprint calculators are undoubtedly a highly accessible tool to understand personal GHG emissions and the carbon intensity of daily life choices [28]. This is especially critical because personal GHG emissions can contribute up to 75% of national emissions, as discussed previously. However, the standardization of these tools in order to govern the quality of the input–output data and the calculation methodologies used remains elusive, even after more than a decade of their use [16,17,29]. Therefore, this study relied on utilizing the previous academic literature that has already created exhaustive assessment frameworks for determining the technical operational quality of various calculators [15,17]. Building on this, the popularity of the calculators was also demonstrated in this study, given that the key objective herein is to identify calculators already extensively used by the public. This comparison led to Carbon Footprint Ltd. being a clear winner in regard to both aspects. However, it is also important to note that other calculators, which might not be as popular, could still be academically very sound, such as the CoolClimate Calculator. Conversely, there are also likely to be popular tools, such as Conservation International or the US EPA, which score poorly in regard to their academic proficiency. The results from the analysis of these tools must therefore be carefully evaluated by users.
This study relied on using Google search results as an informed proximate representation of carbon calculator tool popularity, given that Google has historically represented ~90% of the market share for accessing internet-based tools (https://www.statista.com/statistics/216573/worldwide-market-share-of-search-engines/, accessed on 14 May 2025). The approach in this study, therefore, captures calculator popularity and user accessibility well, but future work can additionally benefit from the evaluation of calculator selection biases through a comparison with other, less popular search engines and the consideration of other metadata relating to usage, including regional languages (such as French in Canada). These tools are also evolving at a rapid rate, especially in an age powered by AI. This further underscores the urgent need for an internationally harmonized standardization framework for carbon footprint calculators, to ensure the soundness of their recommendations and avoid temporal bounds to results from similar studies in the future.

4.2. Suggested Improvements to Overcome Challenges in Linking Carbon Footprint Calculator Outputs to the Canadian National Inventory Report (NIR)

This study found that it was generally challenging to associate carbon footprint calculator output values with the NIR. The main driver of this disconnect is the differences in the inventory methodology and operational boundaries. Calculators use consumption-based inventories and the NIR uses territorial inventories that are production-based, resulting in vastly different emissions data [21]. Furthermore, as noted previously, the lack of standardization in regard to the calculators further creates inconsistencies in the methods used to calculate their inventories, even making comparisons between different calculators challenging [9,19]. The development of a standardized framework to inform data collection and calculation methods for calculators must be conducted carefully to avoid rigid or prescriptive approaches, allowing room for region and/or activity specific emission factors.
NIRs, on the other hand, are standardized due to their governance under the IPCC [19,20], allowing for comparable and reliable data comparisons between member countries. However, the standardized framework constraints NIR outputs to very specific emission sectors defined by the IPCC that focus on computing territorial cumulative emissions [20]. These are undoubtedly crucial for accurate nation-to-nation comparisons, but the lack of the inclusion of personal emission data therein, except for a few residential and settlement categories as part of the major reporting sectors, reduces its potential in regard to public education on how personal lifestyle changes can directly reduce national emissions. This study has shown that there is the potential for alignment between the outputs of both types of inventories across major emission sectors (Section 3.3). However, in the current form, Canadian citizens looking to make significant changes to their lifestyle choices to reduce personal emission impacts will need to appreciate the difference between the two inventories. For example, the fruit and vegetables consumed by Canadians, which are used to calculate diet-based emissions in calculators, are not entirely represented in the agricultural sector of the Canadian NIR. This is because the Canadian NIR only includes emissions associated with the production of fruits and vegetables that occur within Canadian boundaries. Many of those fruits and vegetables are shipped internationally and are not consumed in Canada. For example, ~14% of Canadian potatoes grown in Prince Edward Island are exported (Table 1.1.3, [30]). Conversely, up to 75% of fruits and 50% of vegetables (excluding potatoes) consumed by Canadians are shipped from other locations, such as the United States and Mexico [31,32]. The emissions from imported fruits and vegetables are included in carbon calculators, but only “made in Canada” agricultural goods can be linked to the NIR.
Updates to calculators are also common, including for the calculators assessed in this study, perhaps to retain user engagement and to be more reflective of new and emerging sources of personal emissions. While these updates do not change the major findings reported herein, they can be good directional options for updates to standardized international reporting frameworks, such as IPCC guidelines and NIRs. For example, the latest version of Carbon Footprint Ltd. calculator, found to be the best calculator in this study, now has extensive input options for fuel types for users, including bio-based fuels, as well as diverse electric vehicle options [33]. The Canadian NIR includes data on the rapid expansion of electric vehicles as part of the vehicle fleet in the country, but does not include the related emissions [23].
These examples, among others, help to illuminate GHG emission accounting discrepancies between the two inventories, creating a wide gap in facilitating public awareness. Currently only emissions from household energy, transportation/travel categories, and some agricultural categories are common within the NIR. While these indeed form the majority of sources of emissions, other categories also contribute significantly to personal emissions, as previously noted in the academic literature [7]. Therefore, to add value to the academic literature on carbon calculators, this study included all of the discrete output value categories from carbon calculators, not only the ones that were most relatable to the NIR. This should enable future studies to build on this study, as carbon calculators and NIRs adapt and change over time.
A potential future area of research could be the development of conversion factors to navigate the different forms of emission inventories, allowing citizens to place personal emissions in the context of national emissions. Previously it has been noted in the literature that consumption and production (territorial) approaches are two extreme ends in terms of emission inventory methods that have their own advantages and disadvantages. Together they can also contribute to the problem of carbon leakage when applied to goods and services that are part of international export and trade markets [34]. It is possible to adopt emission inventory methods that enable a more balanced form of accounting across global jurisdictions [35], leading toallocation of emissions in a shared manner between the two types of inventories [34]. Globalization is only increasing and the emergence of new sources of single point emissions, such as data centers, that are directly reflected in consumption from the use of personal electronic devices and the web, necessitates the interlinking of these inventories going forward.

4.3. Quantity and Quality of Personal Emission Data Is Key for Improving Public Engagement

This study outlined the diversity of outputs that could be obtained from the different calculators and their respective strengths and weaknesses, which were evaluated across four comparative indices. All the calculators were found to be particularly weak in regard to the quality and quantity of secondary information categories pertaining to the education of users on emissions and recalculations that show improved results after the application of mitigation strategies. The number of emission mitigation strategies that were offered was also limited. These data are critical in regard to their utilization to inspire lifestyle changes. The findings in this study agree with the existing literature that has outlined quick declines in user engagement [36] or a lack of meaningful takeaways [15] that carbon calculators offer to their users. Therefore, future standardization efforts should consider utilizing the criteria developed in this study to develop key performance indicators related to effective public engagement and the education of users for carbon footprint calculators. The calculator tools that emerged as the most aligned with the Canadian NIR in this study have also previously scored highly in terms of user interface parameters, including carbon emission education, the display of effective results, and the provision of mitigation strategies, among others [15]. This further strengthens the recommendations put forward in this study.
Insights from this study can also inform policy-based tools in Canada. To the authors’ best knowledge, there has been no systematic study conducted to date to track the use of carbon calculators among Canadians. Carbon Footprint Ltd. can be promoted for user uptake through regional and federal government resource materials that are directed at user education or that aim to incentivize users to adopt low-carbon lifestyle changes, such as home energy renovation grants [37]. Recently launched Canadian context-specific tools, such as Tree Canada’s Carbon Tracker App [38], that reference NIR emission factors, must be improved in regard to the use of calculation categories in their offerings to effectively capture lifestyle data and provide mitigation insights [39].
The Government of Canada has also recently developed a Professional Services Carbon Footprint calculator as part of the Low-carbon Procurement initiative. This calculator, while offering contract-level analysis depth as opposed to only company-wide insights, still uses a production and territorial framework and most of the consumption categories are not included in the analysis [40] (Table 1). While such calculations will most certainly be better aligned with the NIR, they will continue to miss personal consumption data that are also key drivers of overall GHG emissions. This is also important for dispelling myths around individual impacts on national GHG emissions and to create consumer market demand for the development of low-carbon alternatives that are critical for the achievement of Canada’s environmental ambitions, which remains one of the worst per capita carbon emitters in the world [41], even though ambitious national net-zero emissions targets have been set in its legislation since 2019 [42].
The alignment with and the inclusion of personal consumption data are critical for the country to stay on track for meeting the Canadian and global climate action targets and for the development of a sustainable low-carbon economy. The discussion in this study is focused on Canada, but the methods developed herein can pave a way forward for similar analysis in other international jurisdictions. The selection of region-specific inventories and the investigation of their alignment with consumption-based inventories in those territories, can similarly lead to the development of policy-based interventions targeting the reduction of personal lifestyle-related emissions, impactfully tailored to enhance the engagement of individual users.

5. Conclusion

This study assessed five carbon footprint calculators based on their output data’s overall ability to relate national Canadian emissions from the NIR to personal emissions in order to educate individuals and inspire lifestyle changes. Providing Canadians with access to this information is of particular importance given the removal of the federal consumer carbon charge. The depth of the output values, output category compatibility, and quality of the secondary output information were used to assess the output data of the five calculators. Additionally, an overall best-in-practice score enabled the analysis to include pertinent data from previous academic research that focused on input values and methodologies. Using these four evaluation categories, the calculator with the strongest opportunity to work in tandem with the NIR is the Carbon Footprint Ltd calculator. The CoolClimate Calculator and Carbon Independent had competitive scores in various categories, and the diverse structure of all the calculators offered lessons in terms of the improvement of the existing calculators. The standardization of footprint calculation methods among different calculator tools and the inclusion of personal emission categories in the NIR emerged as key policy recommendations to inspire low-carbon lifestyle changes by engaged users.

Supplementary Materials

The following supporting information can be downloaded at: https://www.mdpi.com/article/10.3390/su17146629/s1, Table S1: Summary of Output Variables of Carbon Footprint Calculators used in the study. Green shading indicates outputs that could be linked with NIR Emission Categories and used to score calculators.

Author Contributions

Conceptualization, E.A. and W.M.; Methodology, E.A. and W.M.; Validation, E.A., A.A.S., and W.M.; Formal Analysis, Investigation, and Writing—Original Draft, Review and Editing, E.A. and A.A.S.; Project Administration, A.A.S. and W.M.; Writing—Review and Editing, Resources, Supervision, and Funding Acquisition, W.M., E.A., and A.A.S. equally contributed to the manuscript. All authors have read and agreed to the published version of the manuscript.

Funding

This research received no external funding.

Institutional Review Board Statement

Not applicable.

Informed Consent Statement

Not applicable.

Data Availability Statement

The original contributions presented in this study are included in the article/Supplementary Materials. Further inquiries can be directed to the corresponding author.

Acknowledgments

During the preparation of this manuscript, the author(s) used Apple Image Playground (available with macOS Sequoia 15.2) for the purpose of generating part of an illustrative graphic (Figure 2). The authors have reviewed and edited the output and take full responsibility for the content of this publication.

Conflicts of Interest

The authors declare that there are no conflicts of interest.

Abbreviations

The following abbreviations are used in this manuscript:
GHGGreenhouse gas
NIRNational Inventory Report
UNFCCCUnited Nations Framework Convention on Climate Change
IPCCIntergovernmental Panel on Climate Change
NGOsNon-governmental organizations
GWPGlobal Warming Potential

References

  1. Natural Resources Canada. Government of Canada Report Shows Climate Change Impacts—And Adaptation Actions—Are Evident in Sectors and Ecosystems in Canada; Ontario Natural Resources: Ottawa, ON, Canada, 2023. [Google Scholar]
  2. UNFCC. The Paris Agreement. Available online: https://unfccc.int/process-and-meetings/the-paris-agreement (accessed on 30 January 2021).
  3. UNFCC. National Inventory Reports. Available online: https://unfccc.int/process-and-meetings/transparency-and-reporting/reporting-and-review/reporting-and-review-under-the-paris-agreement/national-inventory-reports (accessed on 30 January 2021).
  4. European Evaluation Helpdesk for Rural Development. What Is the National Inventory Report (NIR) and Why Is It Essential for the Assessment of GHG Emissions? Available online: https://ec.europa.eu/enrd/evaluation/publications/what-national-inventory-report-nir-and-why-it-essential-assessment-ghg_en.html (accessed on 1 February 2025).
  5. Smith, C. National Inventory Report Suggests Canada’s Climate Policies Are Starting to Work. Available online: https://www.pembina.org/blog/national-inventory-report-suggests-canadas-climate-policies-are-starting-work (accessed on 1 February 2025).
  6. Lin, S.-m. Reducing students’ carbon footprints using personal carbon footprint management system based on environmental behavioural theory and persuasive technology. Environ. Educ. Res. 2016, 22, 658–682. [Google Scholar] [CrossRef]
  7. Druckman, A.; Jackson, T. Understanding Households as Drivers of Carbon Emissions. In Taking Stock of Industrial Ecology; Clift, R., Druckman, A., Eds.; Springer: Cham, Switzerland, 2016. [Google Scholar]
  8. Chuvieco, E.; Burgui-Burgui, M.; Orellano, A.; Otón, G.; Ruíz-Benito, P. Links between Climate Change Knowledge, Perception and Action: Impacts on Personal Carbon Footprint. Sustainability 2021, 13, 8088. [Google Scholar] [CrossRef]
  9. Burgui-Burgui, M.; Chuvieco, E. Beyond Carbon Footprint Calculators. New Approaches for Linking Consumer Behaviour and Climate Action. Sustainability 2020, 12, 6529. [Google Scholar] [CrossRef]
  10. Kyllönen, S. Climate Change, No-Harm Principle, and Moral Responsibility of Individual Emitters. J. Appl. Philos. 2018, 35, 737–758. [Google Scholar] [CrossRef]
  11. Lövbrand, E.; Stripple, J. Making climate change governable: Accounting for carbon as sinks, credits and personal budgets. Crit. Policy Stud. 2011, 5, 187–200. [Google Scholar] [CrossRef]
  12. Sheppard, E. Public Concern About Climate Change Drops 14-Points Since Last Year. Why? Available online: https://abacusdata.ca/from-climate-action-to-immediate-relief/ (accessed on 1 February 2025).
  13. Lambert, T. Here’s What You Need to Know About the End of the Consumer Carbon Tax. Available online: https://www.cbc.ca/news/canada/edmonton/here-s-what-you-need-to-know-about-the-end-of-the-consumer-carbon-tax-1.7499058 (accessed on 14 May 2025).
  14. Robertson, L.; Teng, H. What a Carney Government Means for Climate. Available online: https://delphi.ca/2025/05/what-a-carney-government-means-for-climate/ (accessed on 14 May 2025).
  15. Mulrow, J.; Machaj, K.; Deanes, J.; Derrible, S. The state of carbon footprint calculators: An evaluation of calculator design and user interaction features. Sustain. Prod. Consum. 2019, 18, 33–40. [Google Scholar] [CrossRef]
  16. Salo, M.; Mattinen-Yuryev, M.K.; Nissinen, A. Opportunities and limitations of carbon footprint calculators to steer sustainable household consumption–Analysis of Nordic calculator features. J. Clean. Prod. 2019, 207, 658–666. [Google Scholar] [CrossRef]
  17. Birnik, A. An evidence-based assessment of online carbon calculators. Int. J. Greenh. Gas Control 2013, 17, 280–293. [Google Scholar] [CrossRef]
  18. Paterson, M.; Stripple, J.; Matthew Paterson, J.S. My Space: Governing Individuals' Carbon Emissions. Environ. Plan. D Soc. Space 2010, 28, 341–362. [Google Scholar] [CrossRef]
  19. Padgett, J.P.; Steinemann, A.C.; Clarke, J.H.; Vandenbergh, M.P. A comparison of carbon calculators. Environ. Impact Assess. Rev. 2008, 28, 106–115. [Google Scholar] [CrossRef]
  20. Eggleston, H.S.; Buendia, L.; Miwa, K.; Ngara, T.; Tanabe, K. 2006 IPCC Guidelines for National Greenhouse Gas Inventories; IPCC: Hayama, Japan, 2006. [Google Scholar]
  21. Dahal, K.; Niemelä, J. Cities’ Greenhouse Gas Accounting Methods: A Study of Helsinki, Stockholm, and Copenhagen. Climate 2017, 5, 31. [Google Scholar] [CrossRef]
  22. Wills, S.R. Google’s pagerank: The math behind the search engine. Math. Intell. 2006, 28, 6–11. [Google Scholar] [CrossRef]
  23. Environment and Climate Change Canada. National Inventory Report, 1990–2022: Greenhouse Gas Sources and Sinks in Canada; 2024. Available online: canada.ca/ghg-inventory (accessed on 30 January 2021).
  24. Apple Support. Create Original Images with Image Playground on Mac. Available online: https://support.apple.com/en-ca/guide/mac-help/mchld5412d00/mac (accessed on 14 May 2025).
  25. Salo, M.; Mattinen, M.K. Carbon Footprint Calculators for Citizens; Nordisk Ministerråd: Copenhagen, Denmark, 2017. [Google Scholar]
  26. Fong, W.K.; Sotos, M.; Doust, M.; Schultz, S.; Marques, A.; Deng-Beck, C. Global Protocol for Community-Scale Greenhouse Gas Inventories; World Resources Institute: New York, NY, USA, 2014. [Google Scholar]
  27. Carbon Calculator: Carbon Footprint Calculator for Individuals and Households. Available online: https://www.carbonfootprint.com/calculator.aspx (accessed on 14 May 2025).
  28. Kok, A.L.; Barendregt, W. Understanding the adoption, use, and effects of ecological footprint calculators among Dutch citizens. J. Clean. Prod. 2021, 326, 129341. [Google Scholar] [CrossRef]
  29. Spandonidis, C.; Belioka, M.-P.; Eriksson, O. Multi-criteria-based evaluation of digital carbon footprint tools from a household user perspective. J. Clean. Prod. 2024, 481, 144151. [Google Scholar] [CrossRef]
  30. Agriculture and Agri-Food Canada. Potato Market Information Review 2023–2024; Statistics Canada: Ottawa, ON, Canada, 2023. [Google Scholar]
  31. Kaushank Bajaj, N.R.; Ondati, E. Tracing Canada’s Food. 2025. Available online: https://canadafoodflows.ca/ (accessed on 1 March 2025).
  32. Wickramasinghe, S. Where Do Canada’s Fruits Veg. Come ? New Website Maps Flow Into Provinces. 2025. Available online: http://news.ubc.ca/2025/01/canada-food-flows/ (accessed on 1 March 2025).
  33. Carbon Footprint Ltd. Sustrax Vita. 2025. Available online: https://www.carbonfootprint.com/sustraxvita.html (accessed on 1 May 2025).
  34. Peters, G.P. From production-based to consumption-based national emission inventories. Ecol. Econ. 2008, 65, 13–23. [Google Scholar] [CrossRef]
  35. Kanemoto, K.; Lenzen, M.; Peters, G.P.; Moran, D.D.; Geschke, A. Frameworks for Comparing Emissions Associated with Production, Consumption, And International Trade. Environ. Sci. Technol. 2011, 46, 172–179. [Google Scholar] [CrossRef] [PubMed]
  36. Enlund, J.; Andersson, D.; Carlsson, F.; Enlund, J.; Andersson, D.; Carlsson, F. Individual Carbon Footprint Reduction: Evidence from Pro-environmental Users of a Carbon Calculator. Environ. Resour. Econ. 2023, 86, 433–467. [Google Scholar] [CrossRef]
  37. Natural Resources Canada. Canada Greener Homes Grant. Available online: https://natural-resources.canada.ca/energy-efficiency/home-energy-efficiency/canada-greener-homes-initiative/canada-greener-homes-grant (accessed on 28 June 2025).
  38. Media, G.; Labbé, S. Canadians Urged to Reduce Carbon Footprint with New Tracker. Available online: https://www.biv.com/news/environment/canadians-urged-reduce-carbon-footprint-new-tracker-8295169 (accessed on 1 May 2025).
  39. Tree Canada. Carbon Calculator Methodology. Available online: https://treecanada.ca/tree-canada-carbon-calculator-methodology/ (accessed on 1 February 2025).
  40. Public Services and Procurement Canada. The Carbon Footprint Calculator for Professional Services: User Guide. 2024. Available online: https://publications.gc.ca/collections/collection_2024/spac-pspc/P4-137-2024-eng.pdf (accessed on 1 May 2025).
  41. Akenji, L.; Bengtsson, M.; Toivio, V.; Lettenmeier, M.; Fawcett, T.; Parag, Y.; Saheb, Y.; Coote, A.; Spangenberg, J.H.; Capstick, S.; et al. 1.5-Degree Lifestyles: Towards A Fair Consumption Space for All; Hot or Cool Institute: Berlin, Germany, 2021. [Google Scholar]
  42. Environment and Natural Resources Canada. Net-Zero Emissions by 2050. 2024. Available online: https://www.canada.ca/en/services/environment/weather/climatechange/climate-plan/net-zero-emissions-2050.html (accessed on 1 March 2025).
Figure 1. Overall workflow of research study (icons/logos/images used herein have free reuse permissions).
Sustainability 17 06629 g001
Figure 2. Definitions of typical personal lifestyle activity categories for grouping of emission outputs from carbon footprint calculators (illustrations in the figure are original images generated using the Apple Image Playground application [24]. For illustrative purposes only).
Sustainability 17 06629 g002
Figure 3. Scoring workflow for Index 1 (depth score) for a given carbon footprint calculator analyzed in this study. The number of outputs is converted into scaled scores between 0 (no outputs in a given category) and 3 (number of outputs > category average + 1.0) to arrive at the total depth score.
Sustainability 17 06629 g003
Figure 4. Scoring workflow for Index 2 (NIR compatibility score) for a given carbon footprint calculator analyzed in this study. The number of NIR compatible outputs are converted into a scaled final score between 0 (no output data compatible with NIR) and 3 (the number of NIR compatible outputs > category average + 1.0).
Sustainability 17 06629 g004
Figure 5. Visual summary of scores of carbon footprint calculators across the comparative indices. All indices were scaled from 0 to 3 prior to plotting.
Sustainability 17 06629 g005
Figure 6. Radar plot visualization of comparative performance of carbon footprint calculators. Comparative indices are represented by numbers on the axes (as outlined in Figure 5). The inset numbers in each plot represent the total area for each carbon footprint calculator.
Sustainability 17 06629 g006
Table 1. Potential effectiveness and quality of secondary output evaluation scoring criteria.
Evaluation Sub-CategoryScoring
Relates GHG Reductions to Money Saving0—The calculator does not relate personal emissions to personal spending.
3—The calculator does relate personal emissions to personal spending.
Offers Carbon Offsetting Options0—The calculator does not offer carbon offsetting after the calculation.
3—The calculator offers carbon offsetting after the calculation.
Offers Recalculation of Emissions After Mitigation Efforts0—The calculator does not recalculate personal emissions after mitigation strategies are applied.
3—The calculator recalculates personal emissions after mitigation strategies are applied.
Education on Data Entry0—The calculator does not guide users on data entry.
3—The calculator provides extensive guidance on data entry.
Carbon Footprint Comparisons0—The calculator does not provide comparisons with one or more carbon footprints after the calculation.
3—The calculator provides comparisons with one or more carbon footprints after the calculation.
Number of Mitigation Strategies Suggested0—The calculator offers no strategies to mitigate personal emissions after the calculation.
1—The calculator offers 0–10 strategies to mitigate personal emissions after the calculation.
2—The calculator offers 20–30 strategies to mitigate personal emissions after the calculation.
3—The calculator offers 30+ strategies to mitigate personal emissions after the calculation.
Total Score for Quality of Secondary Output InformationAverage from all Sub-Category Scores
Table 2. Carbon footprint calculator selection matrix using search engine rankings and best-in-practice scores from the previous literature. N/A denotes calculators not included in previous studies.
NameGoogle PageRank Search RankingPopularity ScoreBirnik (2013) [17] Original RatingBirnik Scaled ScoreMulrow et al. (2019) Original Score
(Figure 1 Radar Plot, [15])
Mulrow Scaled Score Final Best-in-Practice Score (Average of Birnik and Mulrow Scaled Scores) *
Carbon Footprint Ltd. https://www.carbonfootprint.com/sustraxvita.html, accessed on 14 May 202513Strong318.512.93.0
CoolClimate Calculator. https://www.nature.org/en-us/get-involved/how-to-help/carbon-footprint-calculator/, accessed on 14 May 202561.4Strong317.692.72.8
The Nature Conservancy **. https://www.nature.org/en-us/get-involved/how-to-help/carbon-footprint-calculator/, accessed on 14 May 202532.3Average212.001.92.0
Carbon Independent. https://www.carbonindependent.org/index_v3.html, accessed on 14 May 202571.1N/AN/A19.323.03.0
Conservation International. https://footprint.conservation.org/en-us/questionnaire, accessed on 14 May 202542Average211.191.71.8
Terrapass, https://terrapass.com/carbon-footprint-calculator/, accessed on 14 May 202580.7Weak112.812.01.5
US EPA, https://www.epa.gov/ghgemissions/carbon-footprint-calculator, accessed on 14 May 202551.7Weak16.511.01.0
Global Footprint Network. https://www.footprintcalculator.org/home/en, accessed on 14 May 202522.7N/AN/AN/AN/AN/A
Henkel ***100N/AN/A12.201.91.9
Carbonzero. https://app.carbonzero.ca/index/buy-offsets, accessed on 14 May 202590.4N/AN/AN/AN/AN/A
* For the calculators included in only one study, a scaled score from that study is used in place of an average score. ** Nature Conservancy now employs the CoolClimate Calculator. *** Henkel calculator is currently not available via online access.
Table 3. Cumulative score for calculator selection. Selected calculators highlighted in green.
NamePopularity ScoreBest-in-Practice ScoreCumulative Score
Carbon Footprint Ltd.336
The Nature Conservancy2.324.3
Conservation International21.83.8
CoolClimate Calculator1.42.84.2
Carbon Independent1.134.1
US EPA1.712.7
Terrapass0.71.52.2
Henkel01.91.9
Table 4. Quantity of outputs by evaluation sub-category for each calculator evaluated in this study.
Calculator NameHouseholdTransportTravelDietOther
Carbon Footprint Ltd.78 *1 **113
CoolClimate Calculator53 *1 **54
Carbon Independent33 *1 **61
Conservation International11100
Terrapass121 **00
Category Average3.43.412.43.6
* Indicates that each individual private vehicle has an individual output value. ** Indicates that each flight trip has an individual output.
Table 5. Depth of output value final scores for each calculator as an average of the initial scores across all output categories.
Calculator NameHouseholdTransportTravelDietOtherResulting Score
Carbon Footprint Ltd.332132.4
CoolClimate Calculator322322.4
Carbon Independent222312
Conservation International 112000.8
Terrapass122001
Table 6. Calculator scores for output value compatibility with the Canadian National Inventory Report.
Carbon Footprint CalculatorNumber of Relatable Output ValuesResulting Scaled Score
Carbon Footprint Ltd.153
CoolClimate Calculator102
Carbon Independent113
Conservation International21
Terrapass41
Average8.4
Table 7. Secondary outputs obtained from calculators and assessed across evaluation categories that are indicators of effectiveness to inspire low-carbon lifestyle changes.
Calculator NameRelates GHG Reductions to Money SavingOffers Carbon Offsetting OptionsOffers Recalculation of Emissions After Mitigation EffortsEducation on Data EntryCarbon Footprint ComparisonNumber of Mitigation Strategies Suggested
Carbon Footprint Ltd.YesYesNoNoYes29
CoolClimate CalculatorYesNoYesNoYes38
Carbon IndependentNoNoNoYesYes0
Conservation International NoYesNoNoYes6
TerrapassNoYesNoNoYes0
Table 8. Final scores for potential effectiveness of calculators to inspire personal greenhouse gas (GHG) emission reductions.
Calculator NameRelates GHG Reductions to Money SavingOffers Carbon Offsetting OptionsOffers Recalculation of Emissions After Mitigation EffortsEducation on Data EntryCarbon Footprint ComparisonNumber of Mitigation Strategies SuggestedOverall Score
Carbon Footprint Ltd.3300332.0
CoolClimate Calculator3030332.0
Carbon Independent0003301.0
Conservation International 0300301.0
Terrapass0300301.0
Disclaimer/Publisher’s Note: The statements, opinions and data contained in all publications are solely those of the individual author(s) and contributor(s) and not of MDPI and/or the editor(s). MDPI and/or the editor(s) disclaim responsibility for any injury to people or property resulting from any ideas, methods, instructions or products referred to in the content.

