Article

Real-Time Source Dynamics of PM2.5 During Winter Haze Episodes Resolved by SPAMS: A Case Study in Yinchuan, Northwest China

1
Yinchuan Ecological Environment Monitoring Station, Yinchuan 750001, China
2
School of Water and Environment, Chang’an University, Xi’an 710054, China
3
Key Laboratory of Subsurface Hydrology and Ecological Effect in Arid Region of the Ministry of Education, Chang’an University, Xi’an 710054, China
*
Author to whom correspondence should be addressed.
Sustainability 2025, 17(14), 6627; https://doi.org/10.3390/su17146627
Submission received: 12 June 2025 / Revised: 16 July 2025 / Accepted: 17 July 2025 / Published: 20 July 2025

Abstract

The occurrence of haze pollution significantly deteriorates air quality and threatens human health, yet persistent knowledge gaps in real-time source apportionment of fine particulate matter (PM2.5) hinder sustained improvements in atmospheric pollution conditions. Thus, this study employed single-particle aerosol mass spectrometry (SPAMS) to investigate PM2.5 sources and dynamics during winter haze episodes in Yinchuan, Northwest China. Results showed that the average PM2.5 concentration was 57 μg·m−3, peaking at 218 μg·m−3. PM2.5 was dominated by organic carbon (OC, 17.3%), mixed carbonaceous particles (ECOC, 17.0%), and elemental carbon (EC, 14.3%). The primary sources were coal combustion (26.4%), fugitive dust (25.8%), and vehicle emissions (19.1%). Residential coal burning dominated coal emissions (80.9%), highlighting inefficient decentralized heating. Source contributions showed distinct diurnal patterns: coal combustion peaked nocturnally (29.3% at 09:00) due to heating and inversions, fugitive dust rose at night (28.6% at 19:00) from construction and low winds, and vehicle emissions aligned with traffic (17.5% at 07:00). Haze episodes were driven by synergistic increases in local coal (+4.0%), dust (+2.7%), and vehicle (+2.1%) emissions, compounded by regional transport (10.1–36.7%) of aged particles from northwestern zones. Fugitive dust correlated with sulfur dioxide (SO2) and ozone (O3) (p < 0.01), suggesting roles as carriers and reactive interfaces. Findings confirm local emission dominance with spatiotemporal heterogeneity and regional transport influence. SPAMS effectively resolved short-term pollution dynamics, providing critical insights for targeted air quality management in arid regions.

1. Introduction

PM2.5 (particulate matter with aerodynamic diameters ≤ 2.5 μm) has emerged as a critical global environmental threat due to its profound impacts on human health [1], climate systems [2], air pollution [3], and socio-economic development [4]. Numerous epidemiological studies have established robust associations between PM2.5 exposure and increased risks of cardiopulmonary diseases [5], neurological disorders [6], and premature mortality [7]. For instance, the Global Burden of Disease Study estimated that ambient PM2.5 caused 4.1 million deaths globally in 2019, a 102.3% increase from 1990 to 2019. Ischemic heart disease, stroke, and chronic obstructive pulmonary disease (COPD) were the top three causes of death from ambient PM2.5 [8]. Beyond health risks, PM2.5 scatters solar radiation, accelerates glacier melting by depositing light-absorbing components (e.g., black carbon), and exacerbates climate change through cloud–aerosol interactions [9]. In addition, haze pollution characterized by high concentrations of PM2.5, which occurs frequently in developing countries, exacerbates its environmental and health effects [10,11]. For example, sulfate-coated dust particles can penetrate deeper into the respiratory system, while heavy metals (e.g., Pb, Cu) adsorbed on PM2.5 may trigger oxidative stress and DNA damage [12]. Although recent studies have indicated that nanofiber technology can be effective at enhancing protection against PM pollution [13,14], these multifaceted impacts underscore the urgency of understanding PM2.5 sources and the dynamics of PM2.5.
Current research on PM2.5 source apportionment primarily employs three methodologies: emission inventories, receptor models [15], and chemical transport models [16]. The emission inventory approach, as the earliest effective method for estimating pollutant emissions from various sources, demonstrates significant uncertainties in results due to incomplete source information [17]. Receptor-based source apportionment models, particularly chemical mass balance (CMB), Principal Component Analysis (PCA), and Positive Matrix Factorization (PMF), have been widely implemented [18]. For instance, Zhang et al. [19] conducted source apportionment of PM2.5 in a typical island city by integrating the chemical mass balance (CMB) model and the community multiscale air quality (CMAQ) model. The results demonstrated that non-local sources contributed an average of 40.25%. A recent study used a Bayesian isotope mixing model to analyze the source apportionment and formation pathways of atmospheric PM2.5 in the South China Sea and revealed that sulfates primarily form marine biogenic emissions and fossil fuels, while nitrate formation is dominated by the NO2 + ·OH pathway with significant contributions from vehicles, biomass burning, and lightning [20]. However, a critical limitation of receptor models lies in potential discrepancies between predicted emission sources and actual source contributions [19]. Recent advances in chemical transport models enable higher-resolution simulations of aerosol components across spatial and temporal dimensions [21]. Despite widespread acceptance of these established methods, current approaches remain inadequate for tracing short-term (hourly to daily) PM2.5 pollution episodes [22], highlighting the imperative need for real-time source apportionment technologies to characterize dynamic variations in aerosol chemical composition and potential emission sources.
The frequent occurrence of rapid-onset winter haze episodes poses significant challenges for conventional filter sampling coupled with offline laboratory-based source apportionment methods in capturing transient variations in particulate sources [23]. The single-particle aerosol mass spectrometer (SPAMS), an online monitoring instrument, provides high-resolution physicochemical data, including particle size distribution, chemical composition, and mixing states, enabling real-time source identification [24]. Previous SPAMS applications in northern Chinese cities (Beijing and Zhengzhou) [25,26] revealed carbonaceous aerosols and biomass burning as predominant components, though their relative contributions exhibited substantial spatial variations influenced by source profiles and air mass trajectories, demonstrating distinct regional characteristics in particle mixing states. Furthermore, Song et al. [27] employed SPAMS to investigate size-resolved chemical transformations before and after heating periods in 2019, identifying coal combustion, vehicular emissions, and industrial activities as primary sources. A recent study using thermal diffusion-coupled single particle aerosol mass spectrometry (TD-SPAMS) in Chengdu, southwestern China, showed that biomass combustion (37.9%) and automobile exhaust emissions (20.6%) dominated urban fine particulate matter [28]. Nevertheless, the current scarcity of SPAMS-based investigations in China’s northwestern regions substantially hinders comprehensive understanding of haze pollution sources and their formation mechanisms.
Yinchuan, a critical urban center in Northwest China, is situated within the ecotone of the Tengger and Mu Us deserts—characterized as a representative arid/semi-arid region. Due to topographical blockage by the Helan Mountains, winter frequently features atmospheric stagnation with temperature inversions, which trap pollutants and, coupled with heating-season emissions and anthropogenic sources, trigger severe PM2.5 pollution episodes. Consequently, this study selected Yinchuan as the research area, employing single-particle aerosol mass spectrometry (SPAMS) to conduct real-time chemical characterization and source apportionment of individual particles during representative winter pollution events. The integration of air mass trajectory analysis with meteorological parameters (including wind direction and relative humidity) was used to elucidate transport pathways and source contributions to haze formation in Yinchuan. The findings offer new insights for real-time source resolution of haze pollution across Northwest China.

2. Materials and Methods

2.1. Study Area and Monitoring Sites

Yinchuan, located in the northwestern region of China (37°29′–38°52′ N, 105°48′–106°52′ E), within the central Ningxia Plain along the upper Yellow River, spans a total area of 9025.38 km2. The region exhibits a temperate continental climate characterized by cold and dry winters alongside hot and arid summers, with annual precipitation concentrated in brief periods and accompanied by high evaporation rates. Mean annual temperatures range between 8–9 °C, while the multi-year average precipitation approximates 200 mm. Topographically, the area demonstrates elevational heterogeneity, with higher altitudes prevailing in western and southern sectors compared to the relatively low-lying northern and eastern zones. This distinct geoclimatic configuration predisposes the region to frequent aeolian dust events, particularly during spring months. Furthermore, extended winter heating periods combined with coal-dominated energy consumption patterns drive pronounced seasonal atmospheric pollution. These conditions manifest as recurrent winter haze episodes characterized by elevated PM2.5 and SO2 concentrations.
The monitoring station is situated at Yinchuan Sixth Middle School in Jinfeng District (38.47° N, 106.18° E), positioned within a heterogeneous urban environment (Figure 1). To the east, it borders high-traffic arterial roads, including Beijing West Road and Helanshan Middle Road, which exhibit peak vehicular flow exceeding 3000 vehicles·h−1 during rush periods. Northwest of the site, multiple active construction zones with uncovered bare soil surfaces create persistent fugitive dust sources, particularly under wind velocities > 3 m·s−1. Northern and southeastern peripheries encompass urban–rural transition zones characterized by informal settlements where decentralized coal combustion (heating stoves) and biomass burning (crop residues/wood) contribute substantially to localized particulate matter (PM10/PM2.5) and black carbon emissions. Although no major industrial emitters exist within a 500 m radius, a clustered industrial park located 5 km southwest (prevailing downwind direction in winter) introduces potential secondary impacts via transport of industrial process emissions (e.g., volatile organic compounds (VOCs), nitrogen oxide (NOx), and PM2.5). Meteorological analyses confirm this corridor exhibits elevated pollutant advection during stable atmospheric conditions. This multi-source exposure profile makes the site representative of mixed urban pollution typologies in semi-arid regions.

2.2. Monitoring Equipment

This study is based on aerosol observations and analyses conducted at Yinchuan Sixth Middle School using a high-resolution single-particle aerosol mass spectrometer (HR-SPAMS, Hexin, Guangzhou, China) from 01:00 on 1 December 2023 to 14:00 on 3 February 2024. Notably, no data were collected between 01:00 on 15 December 2023 and 10:00 on 19 December 2024 due to instrument malfunction. The HR-SPAMS simultaneously measures size and chemical composition of individual fine aerosol particles (0.2–2 μm). The instrument employs an aerodynamic lens to direct particles into a dual-laser beam sizing system. Particle size is determined via transit time measurement through two 532 nm Nd:YAG laser beams. Sized particles are subsequently ionized by a 266 nm Nd:YAG UV pulsed laser, generating positive and negative ion fragments. These fragments are analyzed using a bipolar high-resolution orthogonal acceleration reflectron time-of-flight mass spectrometer to obtain mass spectral signatures. The total collected particles were automatically classified using an adaptive resonance theory neural network algorithm (ART-2a) with vigilance factor = 0.70, learning rate = 0.05, and 20 iterations. Preliminary classifications were subsequently merged based on similarities in mass spectra, size distributions, and temporal variation patterns.

2.3. Data Analysis

Raw data acquired from the high-resolution single-particle aerosol mass spectrometer (HR-SPAMS) underwent systematic processing: initial particle mass spectra were preprocessed using Microsoft Excel 2019 to filter invalid records, ensuring data integrity prior to classification. Valid particles were classified via an adaptive resonance theory neural network algorithm (ART-2a). Source apportionment was conducted by assigning particles to specific emission sources using diagnostic tracer ions, with contributions quantified as the relative abundance of particle counts weighted by PM2.5 mass concentrations. Statistical analyses were performed in SPSS 26.0 to compute Pearson correlation coefficients between source contributions and environmental parameters (SO2, nitrogen dioxide (NO2), O3, relative humidity, wind speed), with significance thresholds set at p < 0.05 (*) and p < 0.01 (**). Temporal trends in chemical compositions and source resolutions were visualized using OriginPro 2025, while regional transport pathways were assessed via 72 h backward trajectory analysis generated by the HYSPLIT model.

3. Results and Discussion

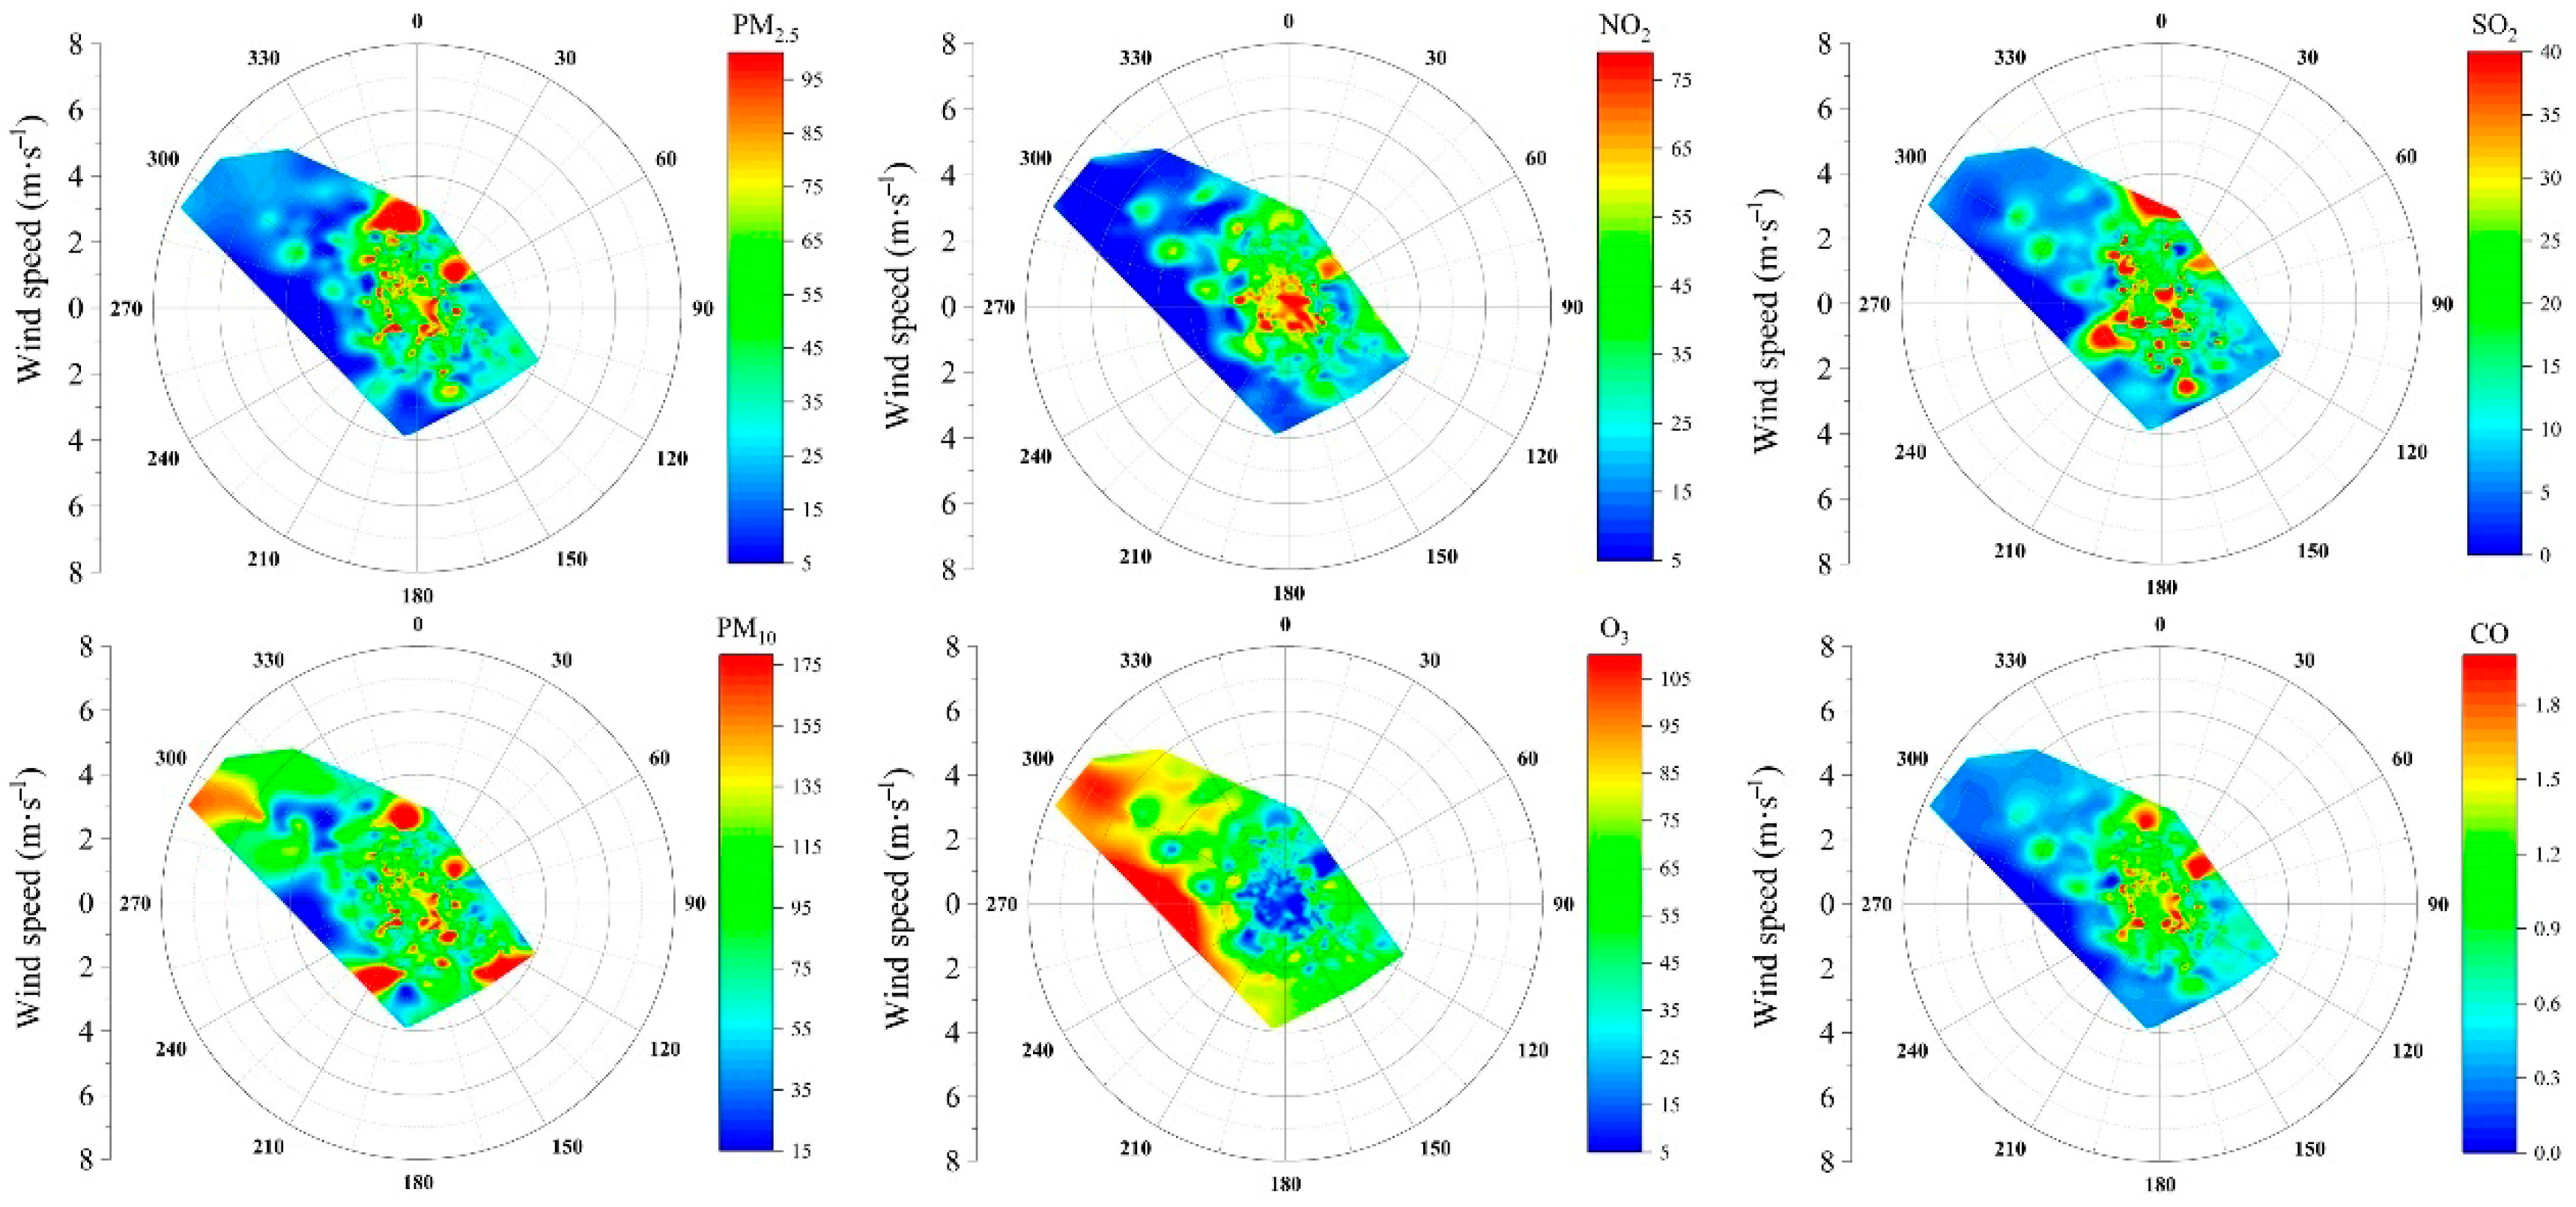
3.1. Overview of Air Pollution During the Observation Period

Figure 2 presents the temporal variations of ambient pollutants (SO2, NO2, PM10, CO, O3–8h, and PM2.5) and meteorological parameters (pressure (P), temperature (T), relative humidity (RH), wind direction (WD), and wind speed (WS)) during the observation period. The results demonstrate that the average concentrations of SO2 (21 µg·m−3), NO2 (46 µg·m−3), PM10 (106 µg·m−3), CO (1.9 mg·m−3), O3–8h (76 µg·m−3), and PM2.5 (57 µg·m−3) were lower than those reported in a heavily polluted northern city (Zhengzhou, winter 2019) but higher than those in southern cities (2015–2016) [25,29]. Wind speed ranged from 0.4 to 7.8 m·s−1, with dominant northwest–northerly winds (Figure S1). The pressure fluctuated between 877.4 hPa and 909.6 hPa. Relative humidity (10.0–85.0%) exhibited a pronounced negative correlation with ambient temperature (−18.2–15.4 °C). Notably, although daily pollutant concentrations remained below China’s National Ambient Air Quality Standard (Grade II), PM2.5 was identified as the primary pollutant in 16 out of 61 observation days. Three typical haze episodes (Haze I: 25–30 December 2023; Haze II: 8–14 January 2024; Haze III: 15–20 January 2024) were identified, characterized by elevated PM2.5 (mean concentrations of 86, 92, and 87 µg·m−3, respectively), PM10, NO2, and CO levels. The peak PM2.5 concentration (218 µg·m−3) occurred at 13:00 on 27 December 2023, underscoring the critical role of particulate matter in air quality deterioration during cold seasons in Yinchuan.
The impacts of wind direction and speed on pollutant transport and accumulation exhibited significant spatiotemporal heterogeneity during the monitoring period (Figure 3). PM2.5 concentrations were predominantly influenced by northerly air masses at moderate wind speeds (~4 m·s−1), suggesting local transport from external sources, such as northern industrial zones or traffic corridors, as a key driver. In contrast, PM10 contributions under high wind speeds (7–8 m·s−1) were strongly associated with northwesterly trajectories, likely driven by dust intrusion from northwestern arid regions, as supported by consistency with concurrent dust forecast models. NO2, SO2, and CO displayed multi-directional high-concentration patterns under stagnant meteorological conditions (wind speed < 2 m·s−1), indicating the dominance of local accumulation from fixed combustion (e.g., residential coal burning) and mobile sources. These findings align with prior studies demonstrating that stagnant conditions, characterized by low wind speeds, a shallow planetary boundary layer height (PBLH), low temperatures, and high humidity, promote localized pollutant buildup, with NO2 hotspots spatially overlapping industrial/transportation emission zones [30]. O3 exhibited distinct transport dynamics, with elevated concentrations linked to southwesterly and northwesterly air masses. The significant positive correlations (p < 0.01) between O3 and biomass burning, cooking, and secondary aerosol sources (Table 1) during low-wind periods imply there is transport of photochemical precursors from potential surrounding emission sources.

3.2. Characteristics and Sources of Changes in PM2.5 Components

Figure 4 illustrates the chemical composition and source apportionment of PM2.5 during the SPAMS monitoring period, classified using the ART-2a algorithm. The results (Figure 4a) reveal that PM2.5 was dominated by organic carbon (OC, 17.3%), mixed carbonaceous particles (ECOC, 17.0%), elemental carbon (EC, 14.3%), high-molecular-weight organic compounds (HOC, 13.4%), levoglucosan (LEV, 11.9%), silicates (SiO3, 10.1%), sodium-rich particles (Na, 7.7%), potassium (K, 3.2%), others (2.9%), and heavy metals (HM, 2.2%). This compositional profile diverges from previous studies in the Guanzhong basin, highlighting significant regional heterogeneity in PM2.5 pollution sources and formation mechanisms [31]. Based on distinct chemical markers, eight emission sources were identified, with contributions ranked as follows (Figure 4b): coal combustion (26.4%), fugitive dust (25.8%), vehicle emissions (19.1%), biomass burning (8.8%), industrial processes (6.5%), other sources (6.0%), cooking-related emissions (4.7%), and secondary sources (2.7%). The dominance of coal combustion, dust, and vehicle emissions underscores their synergistic impacts on air quality in Yinchuan, reflecting the city’s unique energy structure (e.g., decentralized coal heating), arid climate (enhanced dust resuspension), and rapid urbanization (vehicular growth). The study in Guanzhong showed that although the carbonaceous fractions were more dominant, as in the present study (48.6%), the main carbonaceous fractions varied significantly from one region to another. Yinchuan was dominated by OC (17.3%) while Xi’an and Baoji were dominated by EC (42.2–43%), and according to the results of the source allocation, Xi’an and Baoji had a large contribution from motor vehicle emission sources (28.7–37.4%) while coal combustion in Yinchuan was the main source of pollution (26.4%), which led to the differences in the characterization of the PM2.5 fractions of the two regions [31].

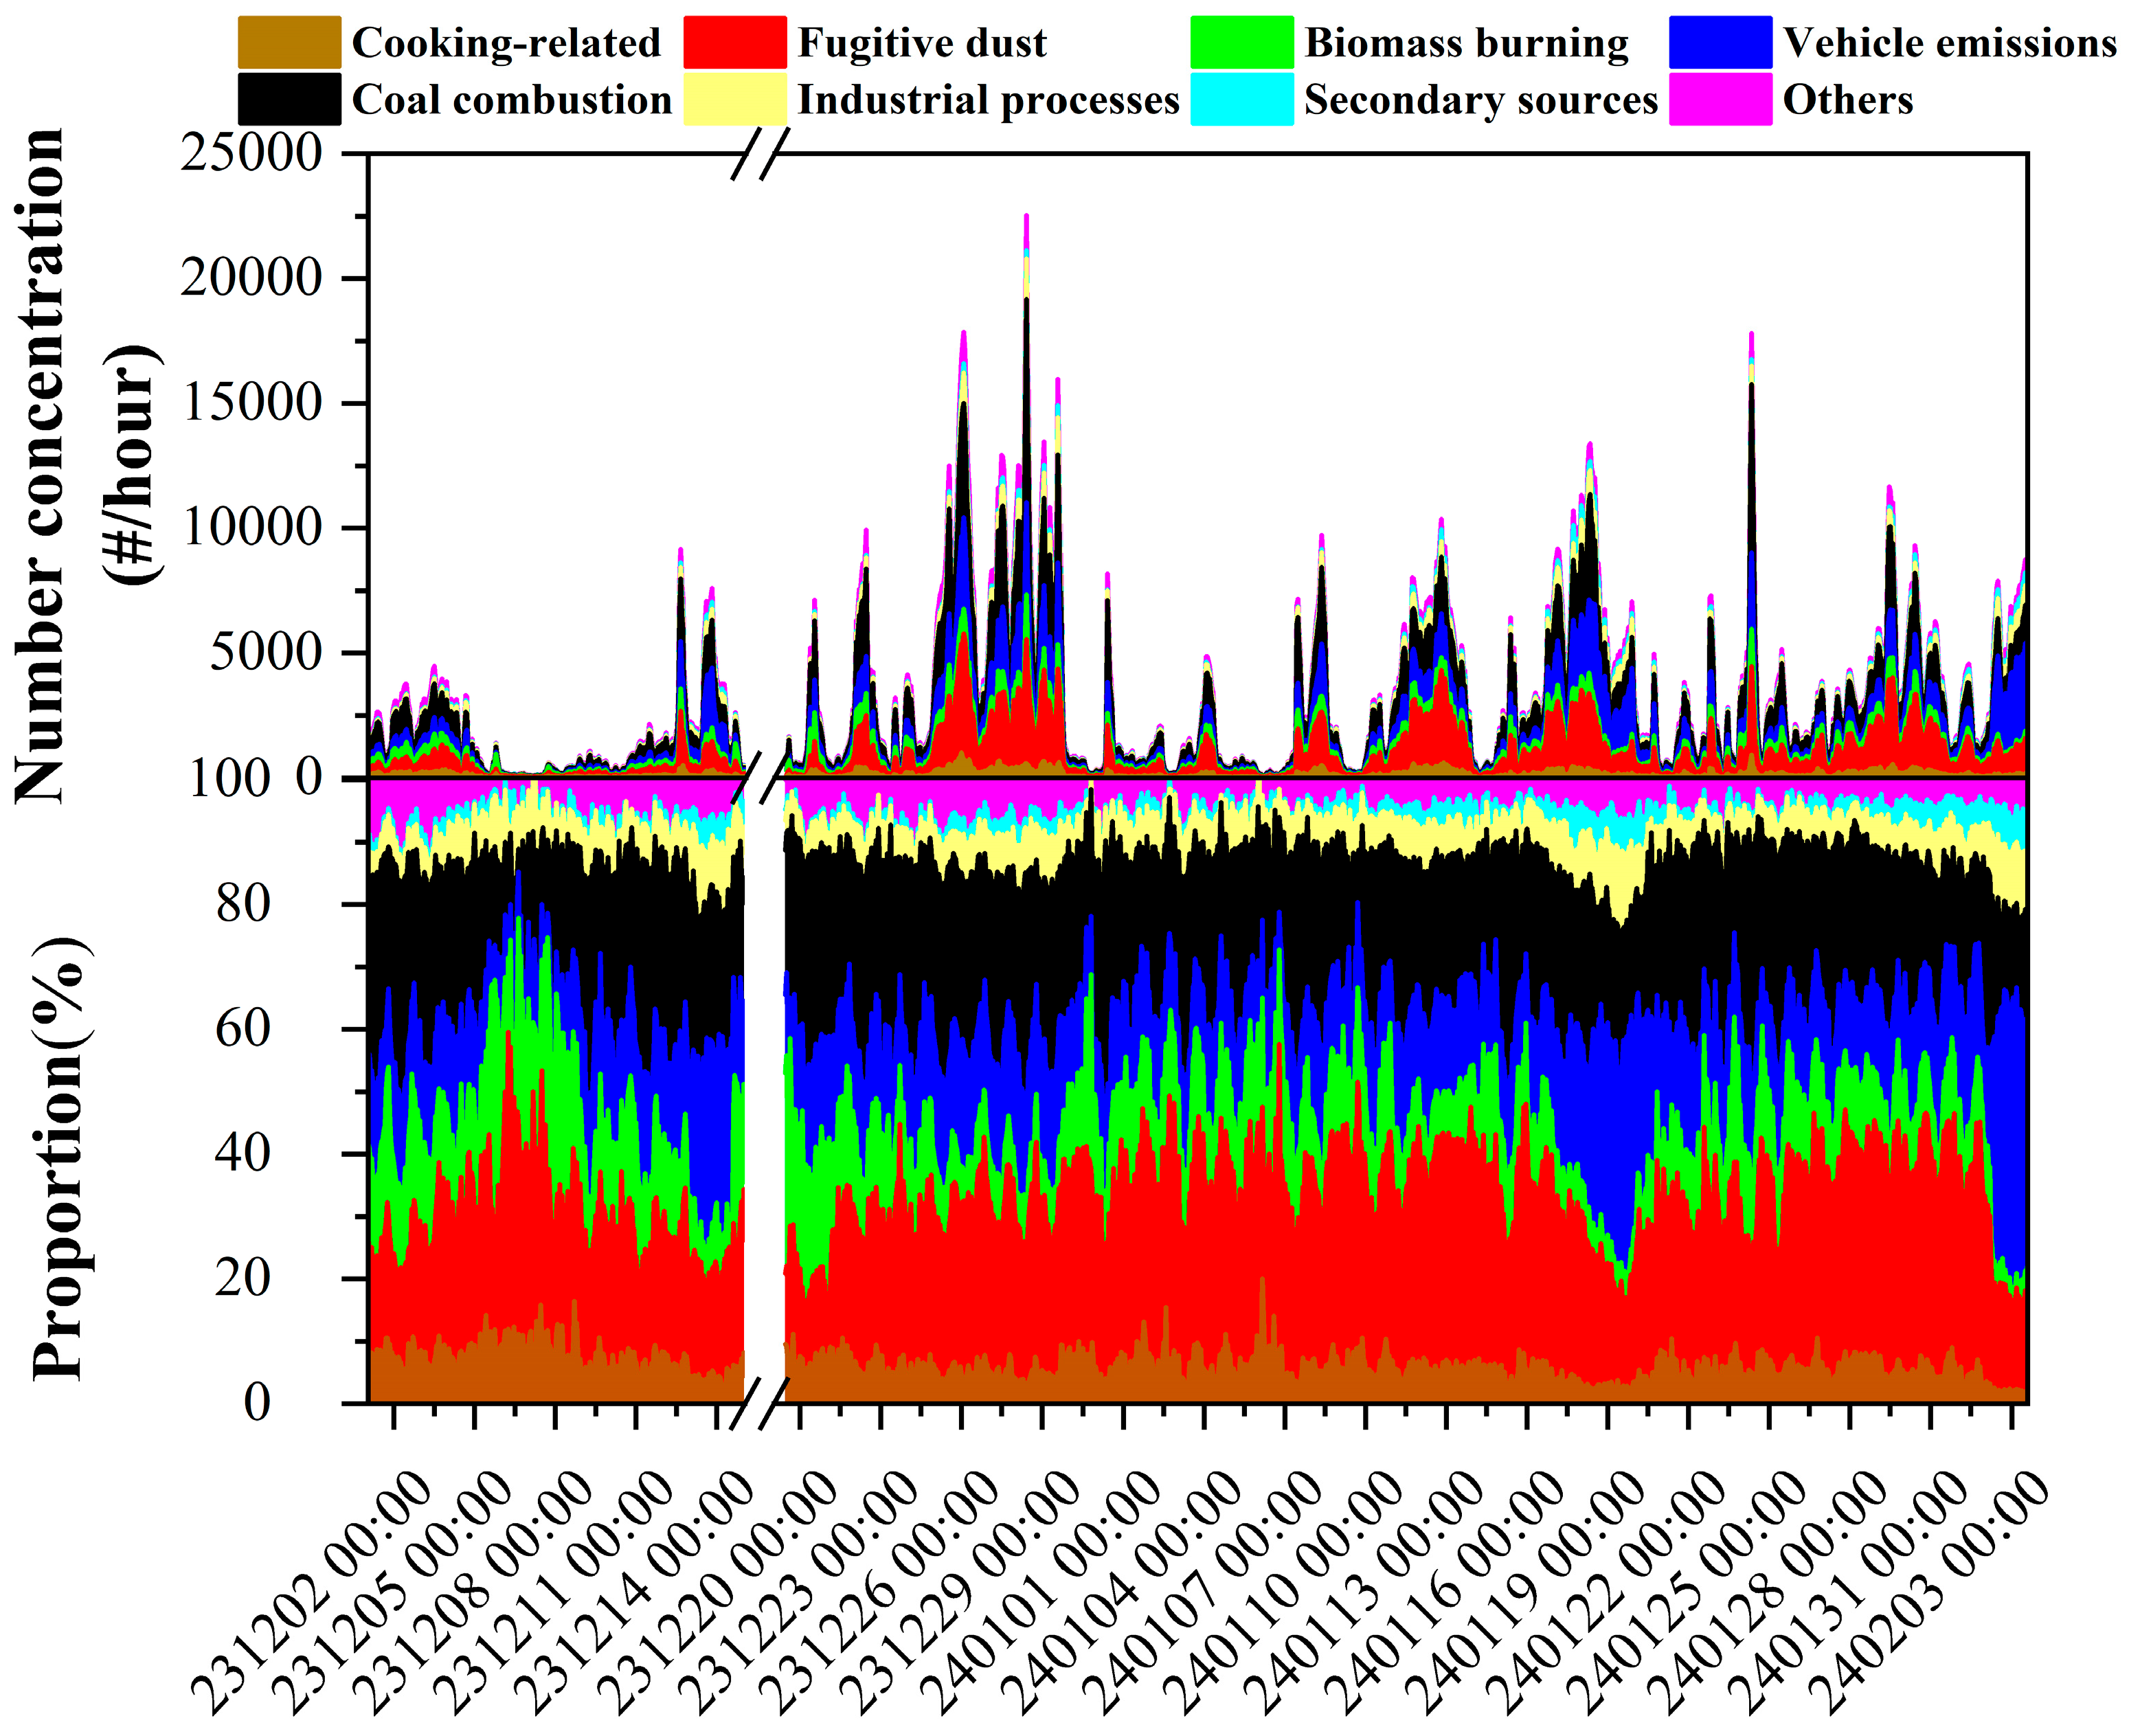
3.2.1. Characterization of Temporal Variation in PM2.5 Source Resolution

Leveraging the high temporal resolution of SPAMS, hourly-resolved source apportionment of particulate matter was achieved [32]. As illustrated in Figure 5, time-series variations in particle number concentrations and fractional contributions of major sources revealed distinct patterns. Coal combustion, fugitive dust, and vehicle emissions exhibited substantial temporal variability, with their contributions significantly amplifying during PM2.5 elevation events (e.g., coal combustion increased by 4.0% from pre-episode to peak pollution), indicating their dominant roles in driving PM2.5 elevation. In contrast, cooking-related sources, industrial processes, and secondary sources maintained relatively stable contributions (<15%) throughout the monitoring period, with negligible fluctuations during pollution episodes (e.g., cooking sources varied by <0.5% during haze events), suggesting their non-dominant roles in acute pollution formation. These observations underscore the synergetic contributions of combustion-related (coal/vehicle) and resuspended dust sources under deteriorating air quality conditions. The methodology demonstrates the ability of SPAMS to resolve source-specific emission patterns at hour scales, critical for identifying rapid-response pollution drivers in urban environments.
Specifically, the 24 h averaged contributions of key pollution sources, including fugitive dust, biomass burning, vehicle emissions, and industrial processes during the monitoring period are statistically summarized in Figure 6. Coal combustion exhibited higher contributions during nighttime to early morning (22:00–12:00 next day), peaking at 09:00 (29.3%), which was likely attributed to persistent emissions from winter heating demands and industrial coal-fired activities [33]. Fugitive dust demonstrated a nighttime-dominant pattern, with contributions progressively increasing from 15:00 to 24:00 and reaching a maximum at 19:00 (28.6%). This temporal trend aligns with the accumulation of construction-related dust, resuspension of road particles by vehicular disturbances, and particle retention under low wind speeds at night [34]. Vehicle emissions peaked between 04:00 and 15:00, with the highest contribution at 07:00 (17.5%), consistent with commuting traffic flows and diesel truck operations. Previous studies have shown that the surge in black carbon and particulate matter emissions during the morning rush hour is linked to the proportion of diesel vehicles in traffic [35]. Biomass burning showed heightened activity from afternoon to evening (13:00–23:00), peaking at 19:00 (14.2%), likely reflecting diurnal cycles of residential heating or open burning practices [36]. Industrial process sources exhibited intermittent fluctuations throughout the day, with slightly elevated contributions during early morning hours (01:00–02:00 and 05:00–08:00, 6.6%), possibly linked to off-peak operational emissions or batch production processes. These hour-resolved variations underscore the synergistic interplay between anthropogenic activity patterns (e.g., transportation, industrial operations) and meteorological conditions (e.g., nocturnal temperature inversion, diurnal wind speed fluctuations).
A diurnal comparative analysis (Figure 7) revealed significant day–night differences in PM2.5 source contributions. During the daytime (07:00–18:00), coal combustion and vehicle emission exhibited higher contributions (26.8% and 19.6%, respectively), attributable to intensified operation of coal-fired boilers and dense traffic activities [33]. At nighttime (19:00–06:00), fugitive dust contributions increased by 2.1%, likely due to relaxed construction dust controls and reduced road-cleaning frequency, enhancing particulate resuspension [37]. Notably, coal combustion maintained persistently high contributions (>25%) from nighttime to early morning (22:00–09:00), reflecting continuous heating demands. Biomass burning showed minimal diurnal variation (nighttime: 8.9%, daytime: 8.7%), yet its nighttime peak at 19:00 (14.2%) correlated with concentrated residential combustion activities (e.g., heating, cooking). Industrial process sources displayed minor diurnal fluctuations (5–7%), with slightly elevated contributions during the pre-dawn hours (01:00–02:00 and 05:00–08:00), potentially linked to emission behaviors timed to avoid regulatory oversight. These diurnal disparities highlight the necessity for time-specific control strategies, such as enhancing nighttime fugitive dust monitoring and optimizing daytime traffic management. The persistent dominance of coal combustion underscores the need for cleaner heating alternatives, while nightly surges in fugitive dust call for stricter enforcement of construction and road maintenance protocols.

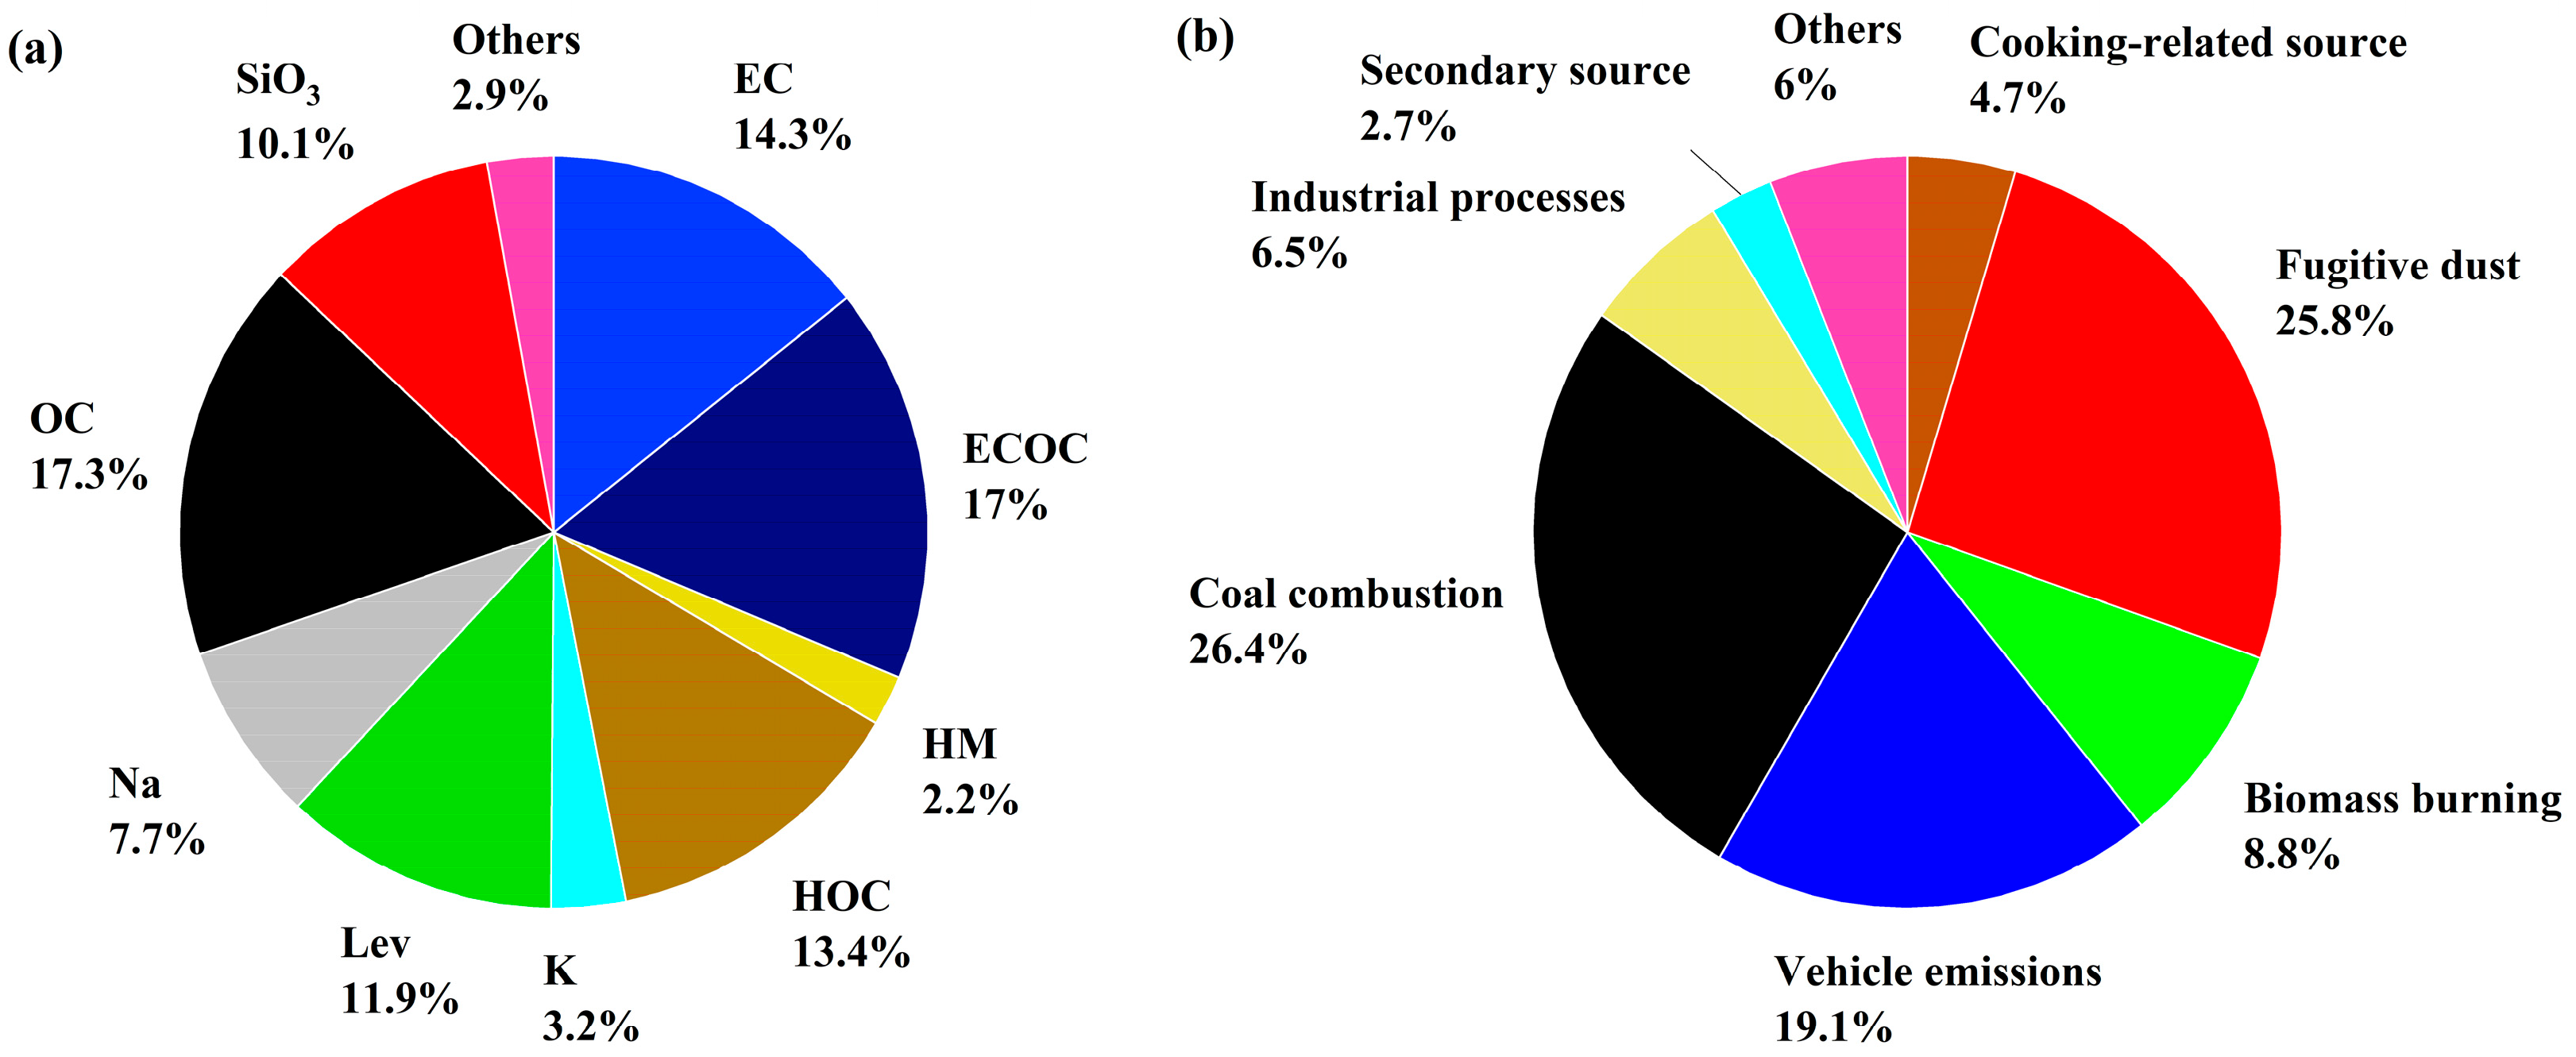
3.2.2. PM2.5 Refined Source Analysis

To refine the source apportionment of PM2.5 pollution in Yinchuan, an in-depth analysis of three major pollution sources was conducted. Coal combustion was categorized into two subtypes: industrial coal (referring to the contribution of particulate matter emissions from coal-fired boilers in enterprises) and residential coal (referring to the contribution of dispersed coal burning) [38]. As shown in Figure 8a, the contribution of residential coal combustion (80.9%) to PM2.5 was significantly higher than that of industrial coal (19.1%). Residential coal combustion has been reported to be an important source of winter PM2.5 in the Beijing–Tianjin–Hebei region [39]. This outcome is primarily attributed to the combined effects of energy structure, combustion efficiency, and geographical distribution. First, peri-urban and rural areas in Yinchuan still rely on residential coal for winter heating. The coal used in these areas is typically low-quality, with high sulfur and ash contents. Combustion occurs in small-scale stoves lacking dust removal or desulfurization facilities, resulting in significantly higher PM2.5 emission intensities per unit of fuel compared to centralized industrial coal-fired boilers [40]. Second, residential coal combustion is spatially dispersed across residential areas, complicating regulatory efforts. Pollutants tend to accumulate under low-temperature, high-humidity conditions. Meteorological data indicate a positive correlation between the contribution of coal combustion sources and humidity. Frequent temperature inversions from nighttime to morning, coupled with reduced atmospheric boundary layer heights, further inhibit pollutant dispersion [39]. Additionally, incomplete implementation of clean energy transitions (e.g., delayed adoption of “coal-to-electricity” and “coal-to-gas” policies in certain areas) has exacerbated the pollution contribution of residential coal combustion [41]. These findings align with the general pattern of prominent residential coal pollution in northern China during winter, highlighting the importance of energy substitution and decentralized source control.
Fugitive dust was classified into four subtypes: construction dust (emissions from building activities), soil dust (unpaved surfaces), road dust (resuspended particles from traffic), and mixed dust (particles with highly overlapping spectral characteristics of the above three categories), governed by the combined effects of human activity patterns, meteorological conditions, and surface characteristics [42]. From an emission perspective, nocturnal activities such as construction waste transportation, road sweeping, and windblown dust from exposed soils increased coarse particle resuspension. The high contributions of soil dust (30.3%) and road dust (27.8%) were due to the presence of extensive unhardened surfaces and transport arteries in the peri-urban transition zones south and northwest of the monitoring site (Figure 8b; Figure S2). Vehicle-induced compaction and wind erosion facilitated particle entrainment into the atmosphere. Meteorologically, reduced nighttime wind speeds (<2 m·s−1) weakened horizontal pollutant dispersion, while low temperatures promoted temperature inversion formation and lowered the vertical mixing layer height, enhancing near-surface dust accumulation [43]. Notably, the positive correlations between fugitive dust contributions and SO2 (r = 0.353, p < 0.01) and O3 (r = 0.176, p < 0.01) suggest that dust particles may act as carriers for secondary components (e.g., sulfates) or reactive interfaces promoting photochemical pollution. This mechanism is linked to the large specific surface area and hygroscopicity of dust particles, highlighting the necessity for dust control strategies that address both primary emissions and secondary transformation processes [44].
Vehicle emissions were categorized into two sources: diesel vehicles (particulate matter contributions from diesel engines) and gasoline vehicles (contributions from gasoline engines). Gasoline vehicles exhibited a higher PM2.5 contribution (70.5%) than diesel vehicles (29.5%), yet diesel emissions significantly impacted specific zones (northern and southern sectors) and periods (04:00–15:00), reflecting differences in traffic composition, emission standards, and driving conditions (Figure 8c and Figure S3). The dominance of gasoline vehicles stems from Yinchuan’s high private car ownership (>1.2 million vehicles in 2023), with incomplete combustion during idling conditions (e.g., traffic congestion) elevating carbonaceous component emissions (OC/EC) [45], positively correlating with PM2.5 mass concentrations (r = 0.256, p < 0.01). Diesel emissions were concentrated along freight corridors (e.g., eastern logistics hubs, northern provincial highways), peaking during heavy-duty transport hours (04:00–15:00) (Figure S3). Furthermore, worsened dispersion conditions in northern sectors (e.g., Beijing West Road) due to traffic-induced urban canyon effects aligned with localized PM2.5 spikes. These findings underscore the need for mobility management strategies integrating fuel-specific emission controls and road network optimization.

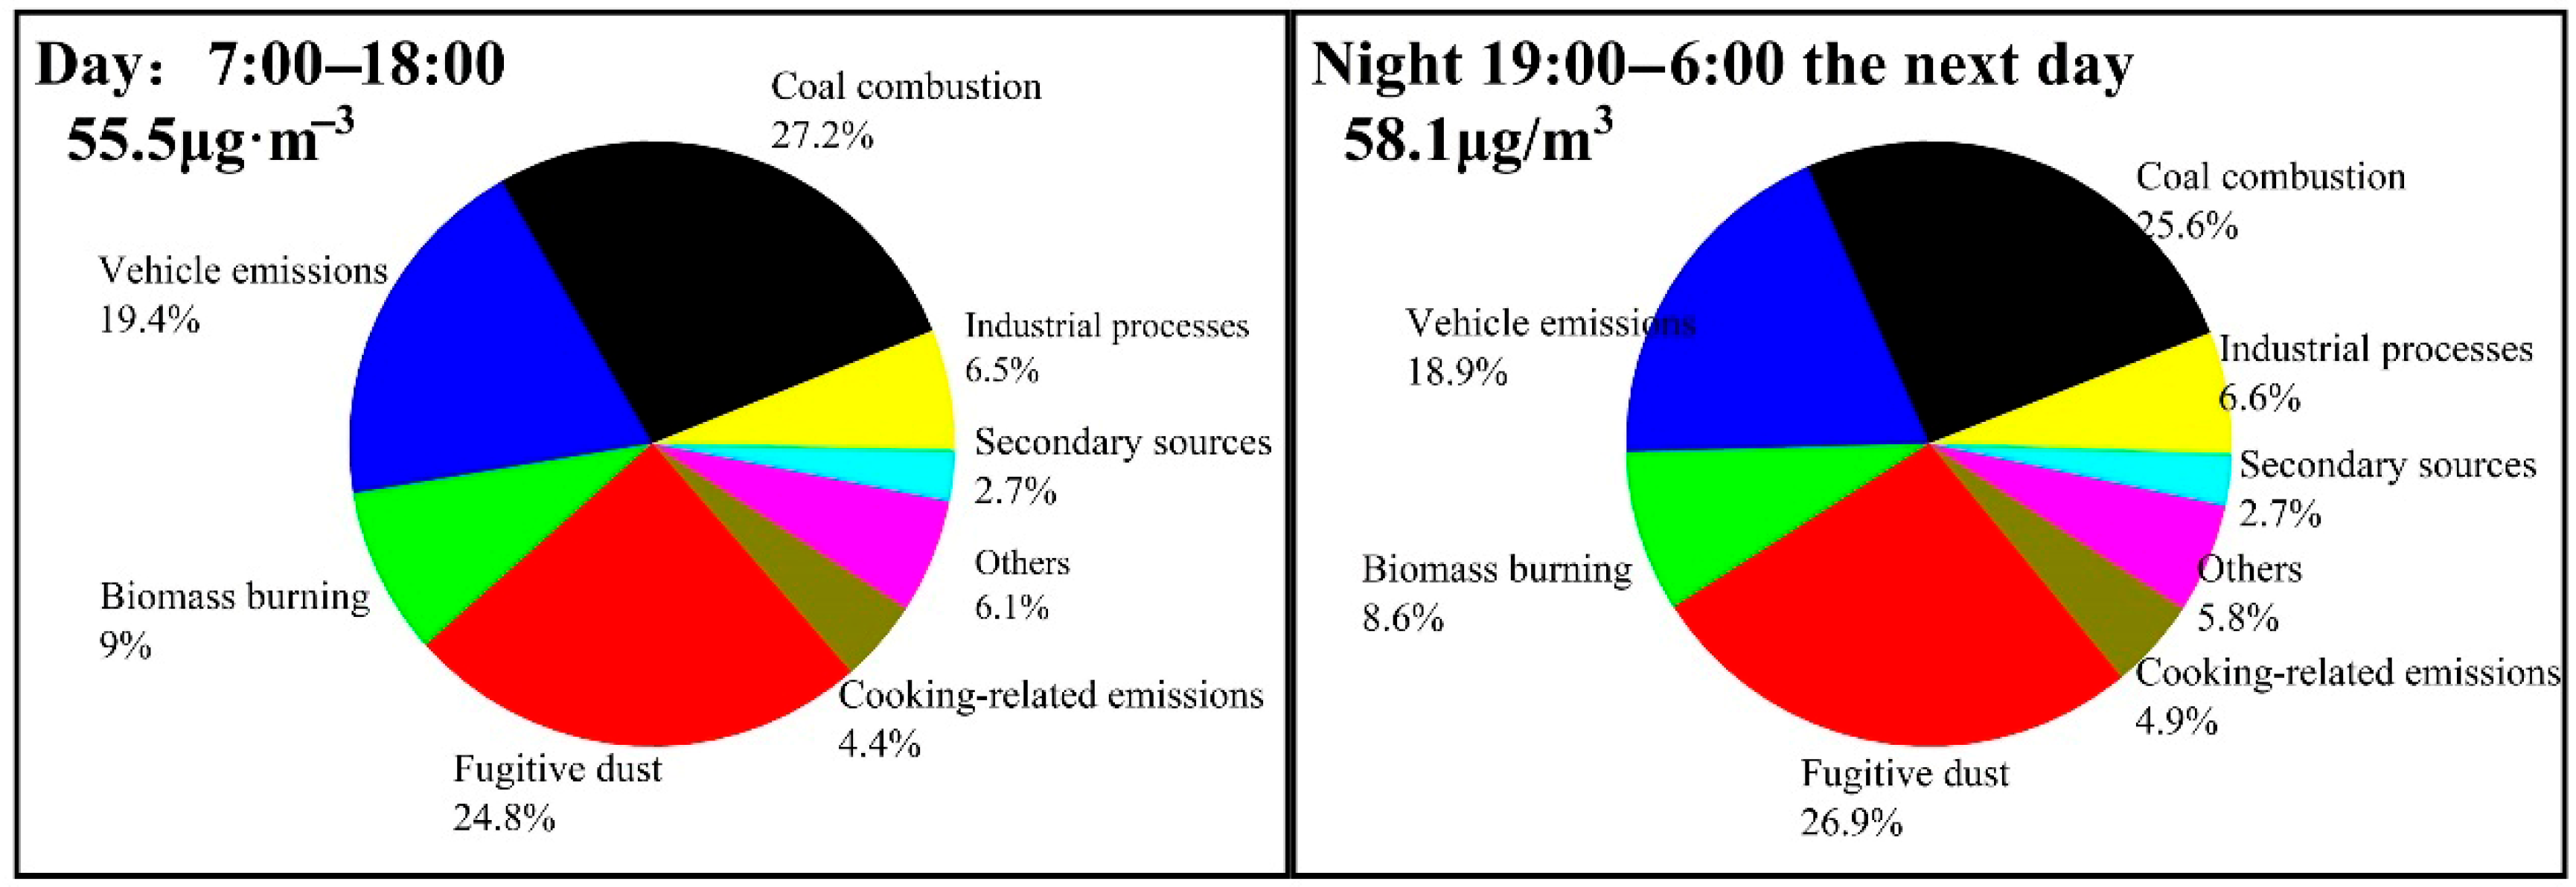
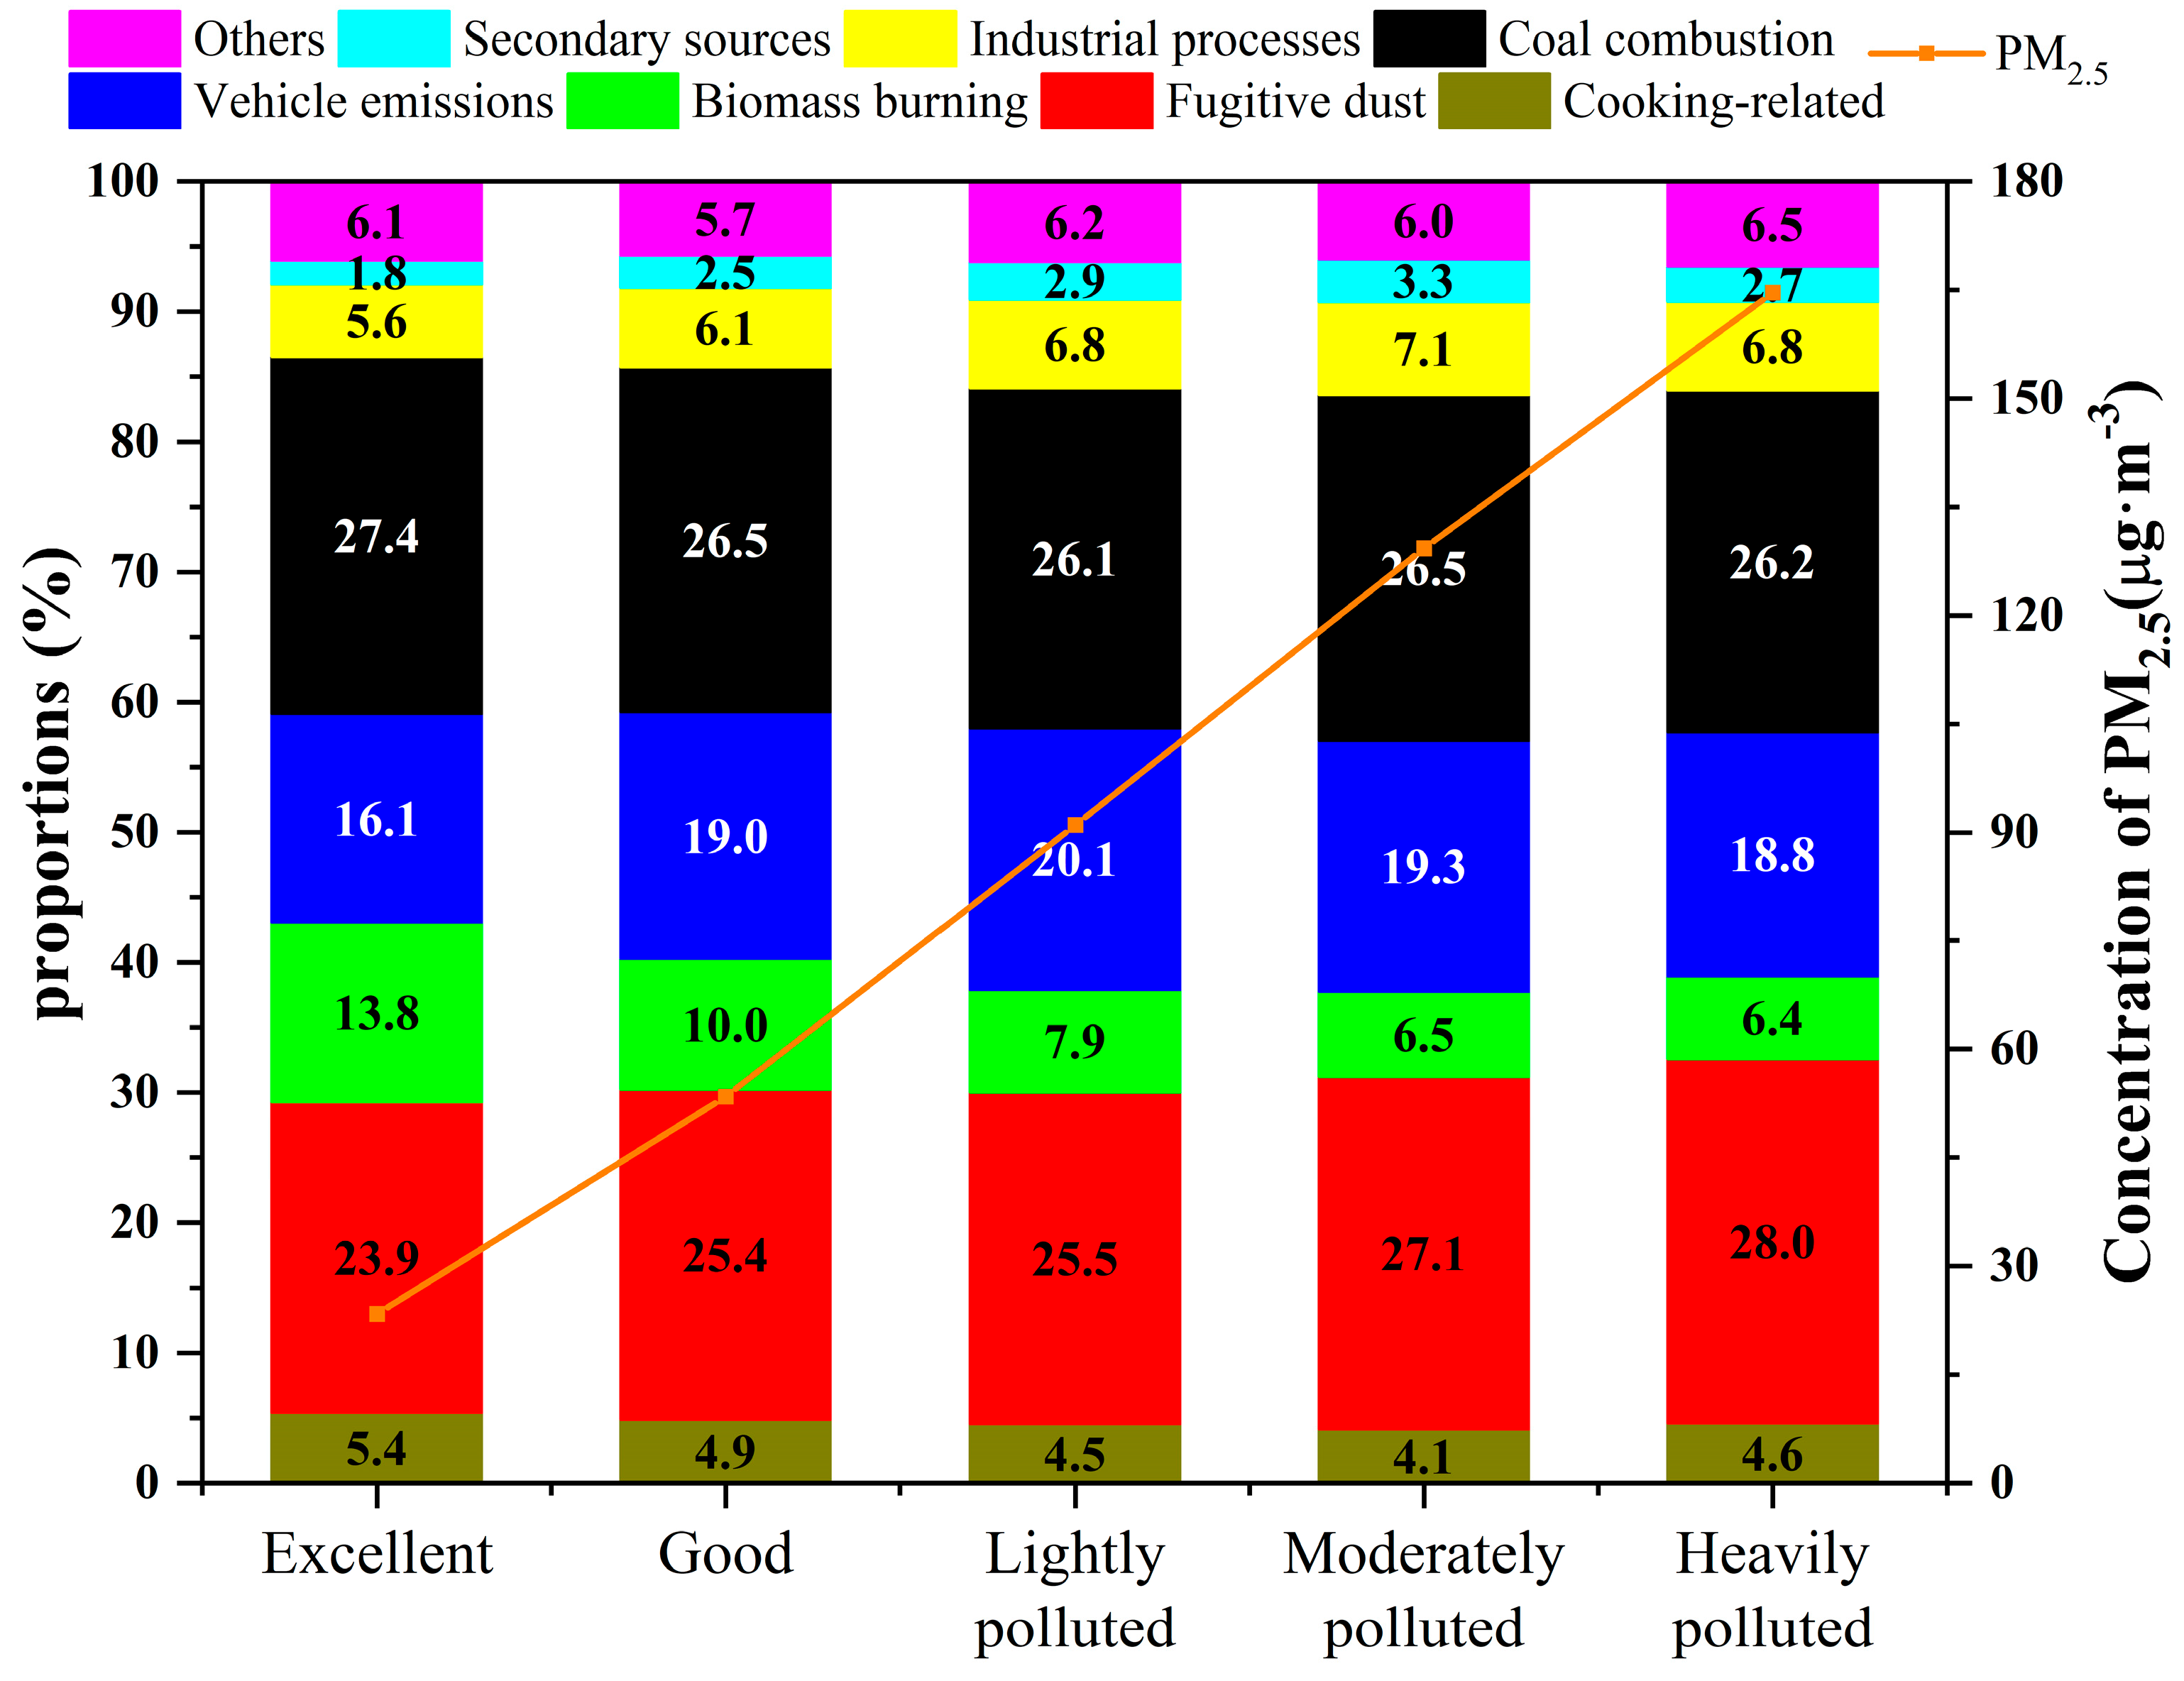
3.2.3. Characteristics of PM2.5 Source Analysis Changes Under Different Pollution Levels

Figure 9 shows the analysis of pollution levels and diurnal source apportionment during the monitoring period, and the results reveal that PM2.5 elevation was strongly associated with enhanced contributions from fugitive dust, vehicle emissions, and coal combustion. When PM2.5 increased from “excellent” (≤35 μg·m−3) to “good” (35–75 μg·m−3), the contributions of vehicle emissions and fugitive dust rose by 2.9% and 1.5%, respectively (Figure 9). During transitions from “moderate” (115–150 μg·m−3) to “severe” pollution (150–250 μg·m−3), fugitive dust contributions further increased by 0.9%, indicating intensified coarse particle resuspension and secondary dust effects (Figure 9). Correlation analysis (Table 1) highlighted significant positive relationships between fugitive dust and SO2 (r = 0.353, p < 0.01) and O3 (r = 0.176, p < 0.01), suggesting dust particles may adsorb sulfates or act as reactive interfaces for photochemical processes [44]. Vehicle emissions correlated positively with PM2.5 (r = 0.256, p < 0.01) and CO (r = 0.153, p < 0.01), reflecting direct carbonaceous emissions from traffic congestion. Coal combustion exhibited associations with NO2 (r = 0.239, p < 0.01) and CO (r = 0.235, p < 0.01), while biomass burning strongly correlated with O3 (r = 0.363, p < 0.01), implying precursor-driven oxidation (NOx, VOCs) alongside direct particulate emissions [46]. This phenomenon arises from the interplay of meteorology, anthropogenic activities, and secondary reactions. First, reduced surface wind speeds (<2 m·s−1) and lowered boundary layer heights (<300 m) during pollution episodes suppressed pollutant dispersion, amplifying contributions from local sources. Second, nocturnal dust accumulation was directly linked to human activities (e.g., nighttime construction operations) and weakened vertical mixing under temperature inversions. Third, morning traffic peaks (04:00–15:00) intensified vehicle emissions due to incomplete fuel combustion during congestion, with synchronized increases in CO and NO2 levels further corroborating mobile source contributions. Additionally, the elevated biomass burning contribution during afternoon-to-night hours (13:00–23:00) aligned with residential heating patterns and may involve O3-enhanced secondary oxidation of combustion byproducts. These findings underscore the compound nature of winter PM2.5 pollution in Yinchuan, where spatiotemporal evolution is jointly regulated by emission intensity, meteorological constraints, and chemical transformation pathways.

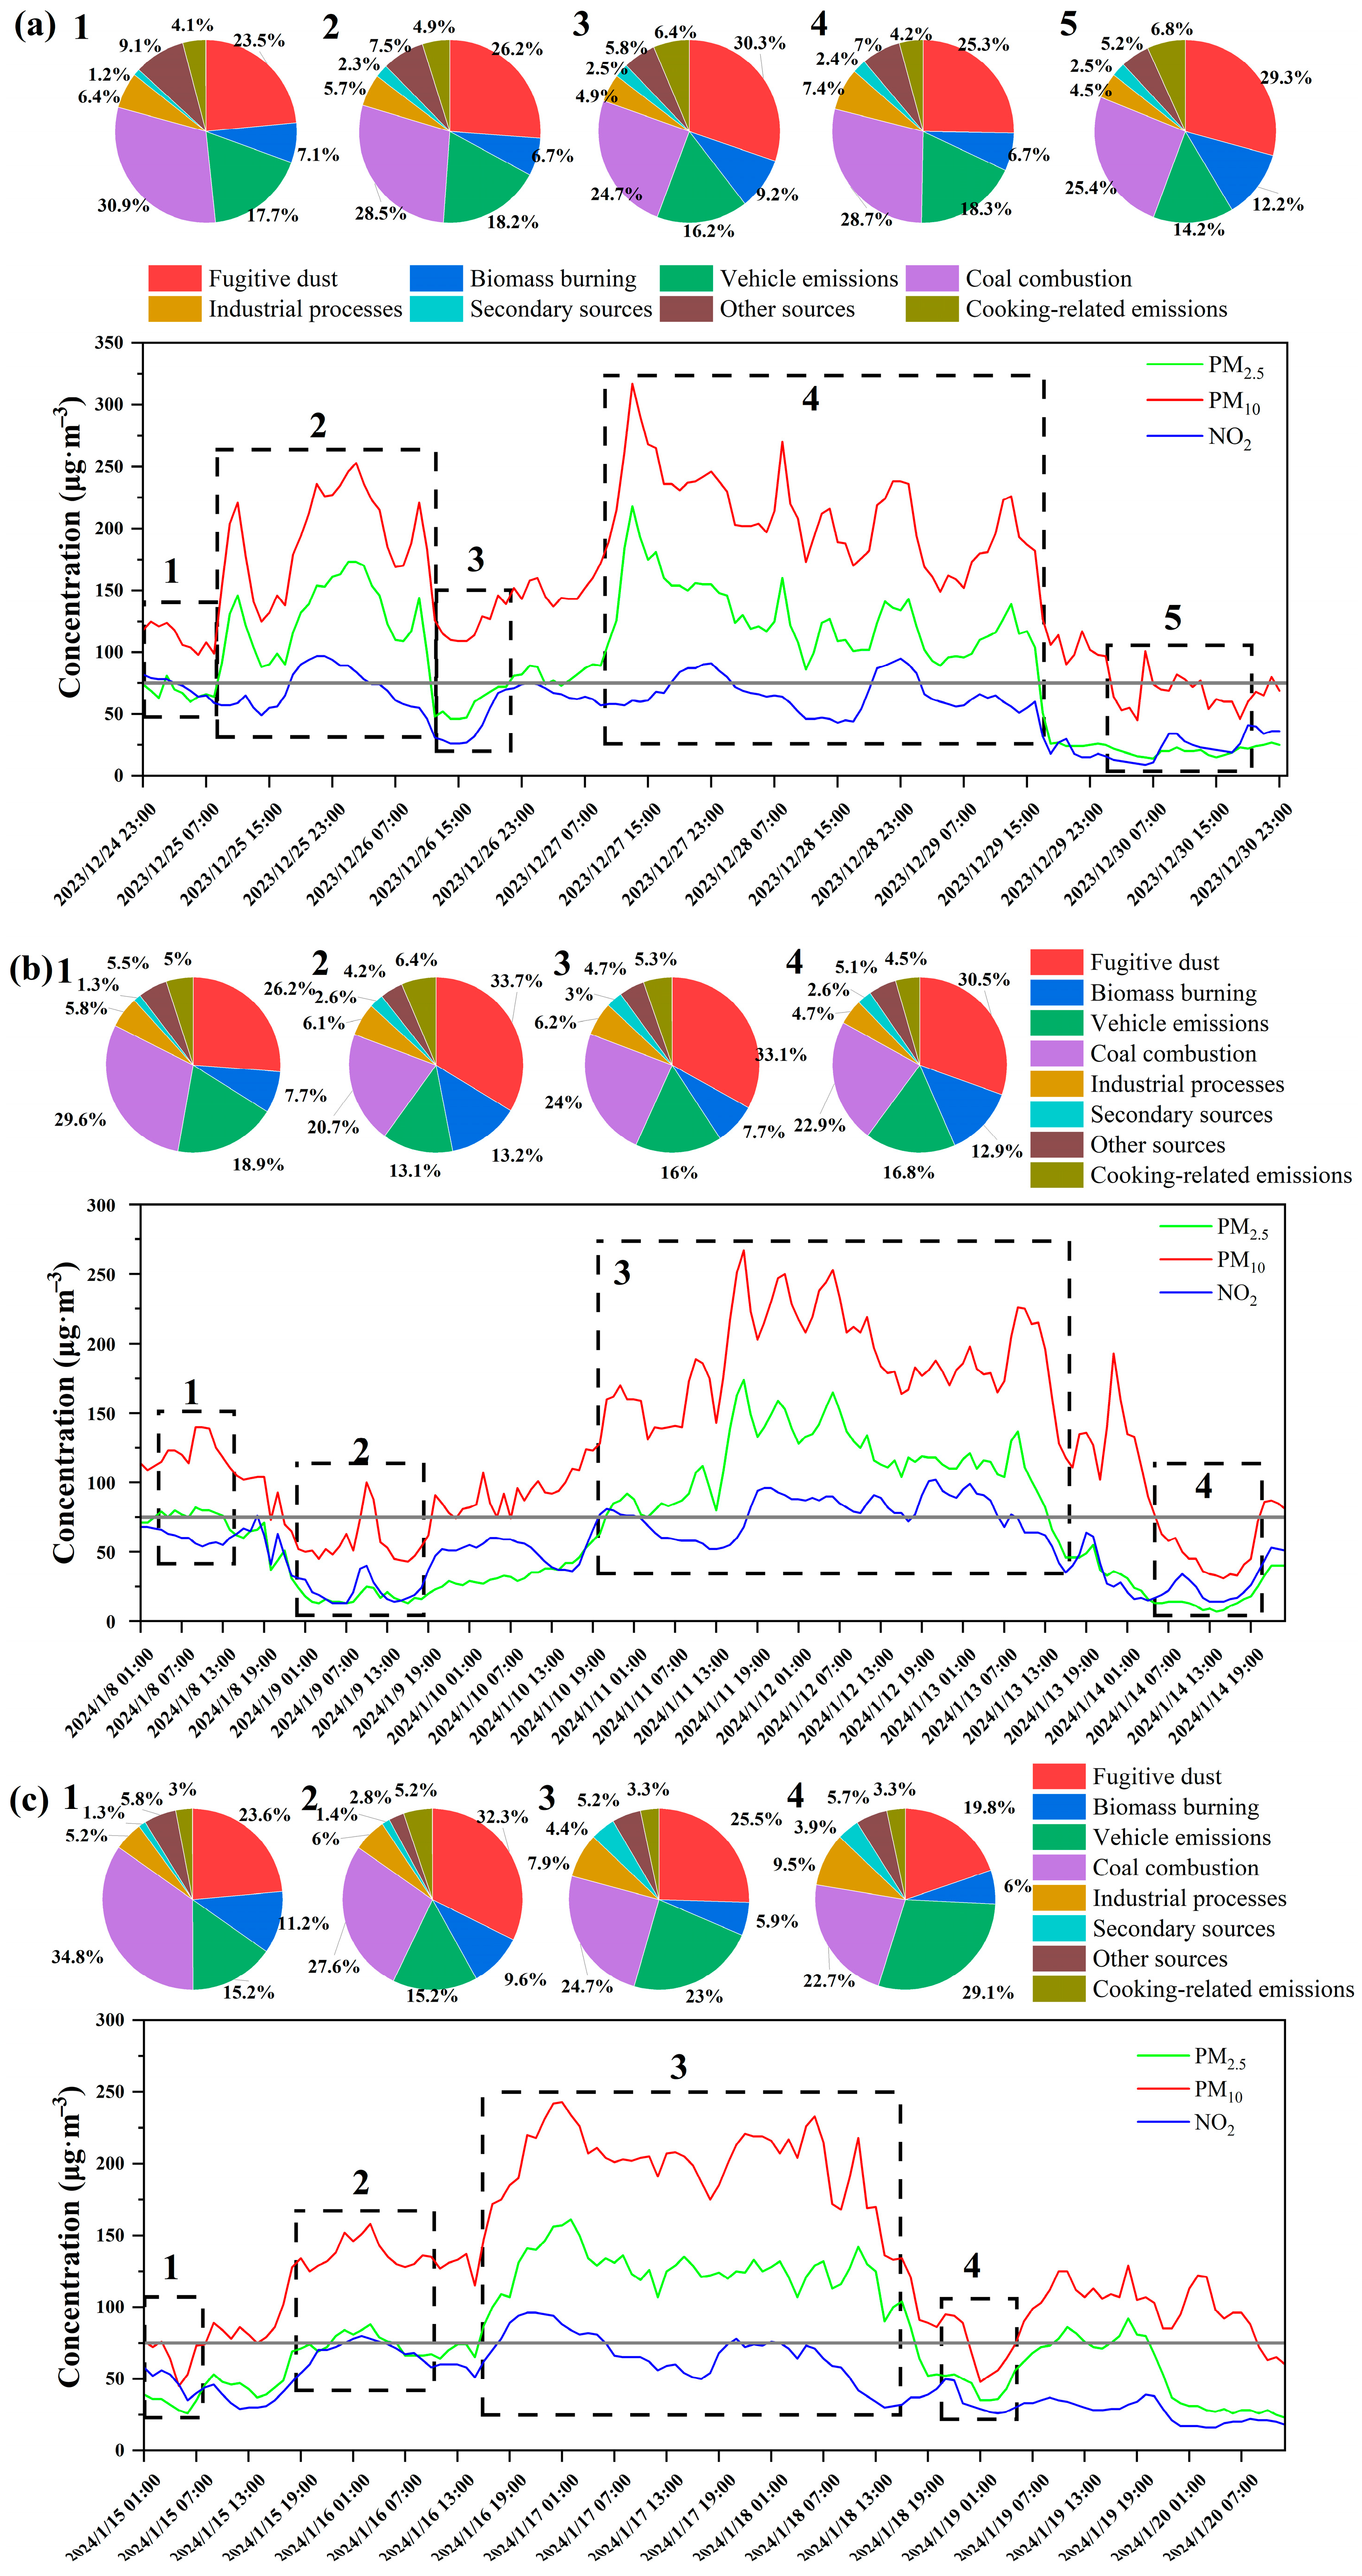
3.3. Formation and Evolution of Typical Pollution Events

Real-time analysis of pollution source contributions during three typical pollution episodes revealed distinct formation and evolution mechanisms. During the Haze I episode (25–30 December 2023), PM2.5 concentrations escalated from 46 μg·m−3 to a peak of 218 μg·m−3, with fugitive dust (25.3%), coal combustion (28.7%), and vehicle emissions (18.3%) exhibiting incremental contributions of 2.7%, 4.0%, and 2.1%, respectively, compared to pre-episode levels (Figure 10a). Concurrently, PM10 surged to 200.2 μg·m−3 under persistently low wind speeds (<2 m/s; Figure 2), likely exacerbating dust resuspension and local pollutant accumulation. Nocturnal dominance of fugitive dust sources (15:00–24:00) correlated with construction waste transportation, delayed road cleaning, and exposed bare soil areas. Coal combustion peaked at 09:00 (29.3% contribution), concentrated north and northwest of the monitoring site (Figure 5), aligning with residential morning heating demands and industrial coal-fired boiler operations. Inefficient residential coal burning released substantial EC and OC, constituting dominant PM2.5 components. This episode exemplifies a compound pollution scenario under winter stagnation conditions, where synergistic effects between primary emissions (fugitive dust and coal combustion) and secondary aerosol transformations drove rapid PM2.5 growth. The findings highlight the critical interplay of source-specific emissions, meteorological constraints, and atmospheric chemistry in shaping severe haze events.
During the Haze II episode (8–14 January 2024), PM2.5 concentrations exhibited a fluctuating upward trend (Figure 10b), peaking at 174 μg·m−3 on 11 January 2024. Industrial processes and coal combustion contributed 6.2% and 24.0%, respectively. Industrial process emissions peaked at 7.9% during 1–2 a.m. and 6 a.m. (Figure 5), predominantly originating from industrial zones southwest and southeast of the monitoring site, consistent with nighttime production cycles in steel and building material industries. Notably, PM2.5 levels initially declined from 78.2 μg·m−3 to 19.0 μg·m−3 from January 8 to January 9, coinciding with intensified northwest winds (4.8 m/s; Figure 2), which enhanced regional pollutant dispersion. However, as wind speeds dropped to 1.5 m/s later in the episode (January 11–13), local industrial process contributions rebounded to 6.2%, while coal combustion increased by 3.4%. Biomass burning contributions rose to 14.1% during the afternoon-to-night hours (Figure 5), aligning with rural crop residue burning and cooking-related emission patterns. This episode highlights an alternating dominance between regional transport and local emissions. Strong winds temporarily alleviated local pollution via atmospheric advection, whereas stagnant conditions amplified PM2.5 buildup driven by industrial activities and residential coal combustion.
During the Haze III episode (15–20 January 2024), PM2.5 concentrations exhibited a “dual-peak” pattern, escalating from 26 μg·m−3 to 161 μg·m−3 (Figure 10c). Vehicle emissions dominated morning rush hours (07:00–09:00), contributing 23.0% to PM2.5, while fugitive dust surged to 32.3% during the evening hours (Figure 4). Significant positive correlations between vehicle emissions and PM2.5 (r = 0.256, p < 0.01) and CO (r = 0.153, p < 0.01) (Table 1) indicated that traffic congestion on major thoroughfares (e.g., Beijing West Road) enhanced incomplete fuel combustion under idling conditions, releasing OC and EC as key PM2.5 precursors. Nocturnal dust contributions were linked to unregulated construction activities, delayed road dust suppression, and resuspension of mineral dust and heavy metal particles. Industrial processes peaked at 6 a.m. (Figure 5), coinciding with coal-fired boiler operations in the southeastern industrial park, where emissions accumulated near the surface due to nighttime temperature inversions. Meteorological analysis revealed elevated relative humidity (Figure 2), promoting hygroscopic growth of dust particles and secondary aerosol formation via aqueous-phase reactions [47]. This episode underscores the synergistic effects of diurnal emission heterogeneity (e.g., daytime traffic vs. nighttime industrial/construction emissions) and meteorological drivers (humidity, inversion layers), which collectively amplify winter PM2.5 pollution in urban environments.

3.4. Analysis of Fresh and Aged Sources of PM2.5

During the Haze I episode, the primary sources of PM2.5 in Yinchuan were fugitive dust (25.1–28.9%), coal combustion (25.6–29.6%), and vehicle exhaust (13.9–18.6%). Dynamic variations in source contributions were observed. During moderate pollution on the 25th, vehicle emission and coal combustion contributions increased by 1.8% and 0.9%, respectively. As pollution intensified, coal combustion rose to 29.6%, while industrial process emissions peaked at 7.7% (Figure 5). Backward trajectory cluster analysis revealed that long-distance transport from the northwest (Trajectory 5, contributing 10.12%, Figure 11a) significantly influenced vehicle exhaust, whereas fugitive dust and coal combustion were predominantly driven by local emissions, with potential source regions concentrated in urban Yinchuan and the Hami–Yumen industrial corridor in the northwest. Particle aging analysis based on the relative peak area of nitrate demonstrated that over 75% of PM2.5 originated from local fresh emissions. During the pollution episode (25–29th), fugitive dust contributions increased by 4.2% as PM2.5 levels rose (24–26th), followed by a 2.5% increase in coal combustion contributions (26–28th), highlighting the critical role of local coal-related activities in pollution escalation (Table S1). Secondary and aged transported sources exhibited minor fluctuations (<3%), further confirming the dominance of local emissions. Notably, aged industrial process sources accounted for 4.3% of PM2.5 during moderate pollution days, indicating the superimposed impact of industrial pollution transported from northwestern regions. These findings underscore that the Haze I episode was primarily driven by local coal combustion, fugitive dust, and vehicle emissions, with additional contributions from regional transport along the northwestern pathway.
Source apportionment of PM2.5 during the Haze II episode in Yinchuan revealed that fugitive dust, coal combustion, vehicle emission, and biomass burning were the dominant contributors, collectively accounting for over 75% of total PM2.5. During the pollution episode, the contributions of fugitive dust and vehicle emission increased significantly with escalating pollution severity. On moderately polluted days (12th), fugitive dust contributed 34.6%, representing a 7.6% rise compared to clean days (10th), highlighting the dominant role of local fugitive dust in pollution accumulation (Figure 5). Coal combustion exhibited regional transport characteristics, with long-distance airflow from the northwest (e.g., Hami and Yumen) carrying higher coal-related pollution contributions compared to short-range southwestern air masses. Potential source analysis further confirmed that high-value zones for fugitive dust were concentrated in the surrounding areas of Yinchuan and the northwestern Tengger Desert (Figure 11b). Particle aging analysis demonstrated that over 75% of fine particles originated from fresh emissions, with fugitive dust contributions exhibiting synchronous fluctuations with PM2.5 concentrations, indicating its direct driving role in pollution dynamics. Aged particles predominantly derived from regional transport of coal combustion, industrial processes, and vehicle exhaust, with their contributions rising to 20.7–21.9% during the mid-pollution period (11th–12th), reflecting the superimposed impacts of polluted air masses from the northwest. Notably, aged coal combustion sources reached 34.8% (8.1% from local aging and 26.7% from transport) on moderately polluted days, underscoring the substantial contribution of regionally transported and chemically transformed coal emissions to local pollution. These findings emphasize the dual influence of local fugitive dust emissions and northwestward-transported coal combustion pollutants in exacerbating the Haze II episode.
Source apportionment during the Haze III episode in Yinchuan revealed that fugitive dust (15.9–30.5%), coal combustion (11.7–26.5%), vehicle exhaust (11.5–17.5%), and biomass burning (3.0–9.7%) were the dominant contributors to PM2.5 (Figure 5). A significant dynamic correlation was observed between pollution severity and source contributions. During mild pollution (16th), fugitive dust, vehicle emission, and industrial process sources increased by 3.5%, 0.9%, and 1.2%, respectively, compared to clean days, while coal combustion contributions decreased by 5.3%. Under moderate pollution (17th), vehicle emission contributions surged by 5.3%, and industrial process sources continued to rise, underscoring the critical role of mobile and industrial emissions in pollution aggravation. Backward trajectory analysis indicated that long-distance transport from the northwest (3.33% contribution, Figure 11c) significantly influenced vehicle exhaust, whereas coal combustion and fugitive dust were predominantly driven by local emissions, with potential source areas concentrated near Yinchuan and northwestern industrial cities. Particle aging analysis based on nitrate relative peak area demonstrated that local fresh emissions consistently accounted for over 60% of PM2.5. However, during heavy pollution (17th–18th), contributions from secondary and aged transported sources rose sharply to 31.1–39.0%, marking a 19.1–27.1% increase compared to clean periods (15th). Notably, aged vehicle exhaust from regional transport accounted for 10.2–17.5% during polluted days, confirming the synergistic effects of regional transport on pollution accumulation. Coal combustion-derived aged particles contributed 9.7% during moderate pollution days, revealing the secondary pollution formed through atmospheric chemical transformation of local coal emissions. These results highlight the hybrid nature of PM2.5 pollution in Yinchuan, characterized by local emission dominance with regional transport superposition. Specifically, under stagnant meteorological conditions, the secondary transformation of local mobile and industrial emissions, combined with northwestern pollutant transport, synergistically exacerbated pollution levels.

4. Conclusions

This study provides high-resolution insights into the chemical dynamics and source apportionment of PM2.5 during winter haze episodes in Yinchuan, an arid city in Northwest China. SPAMS-based analysis revealed that local emissions dominated PM2.5 pollution, with coal combustion (26.4%), fugitive dust (25.8%), and vehicle emissions (19.1%) collectively contributing 71.3% of total PM2.5. Notably, decentralized residential coal burning accounted for 80.9% of coal-related emissions, reflecting inefficient heating practices prevalent in peri-urban areas. Diurnal source variations highlighted the synergistic interplay of anthropogenic activity patterns and meteorological constraints: coal combustion peaked nocturnally (29.3% at 09:00) due to heating demand and temperature inversions, fugitive dust contributions rose at night (28.6% at 19:00) under low wind speeds and construction activities, and vehicle emissions aligned with traffic peaks (17.5% at 07:00). During haze episodes, synergistic amplification of local sources (4.0% increase for coal combustion) and regional transport of aged particles from northwestern industrial zones (contributing 10.1–36.7%) drove rapid PM2.5 escalation. Fugitive dust exhibited dual roles as primary emitters and secondary reaction interfaces, evidenced by correlations with SO2 (r = 0.353, p < 0.01) and O3 (r = 0.176, p < 0.01). The findings underscore the capability of SPAMS in resolving spatiotemporal source heterogeneity and short-term pollution dynamics, offering critical evidence for time-specific control strategies. Prioritizing decentralized coal replacement, enforcing nocturnal dust suppression, and enhancing regional joint prevention mechanisms are imperative to mitigate winter haze in arid northwestern regions. This work advances understanding of source–receptor relationships in arid ecosystems and demonstrates the utility of real-time single-particle analysis for targeted air quality management.

Supplementary Materials

The following supporting information can be downloaded at: https://www.mdpi.com/article/10.3390/su17146627/s1.

Author Contributions

H.D.: writing—original draft, data curation, software, visualization, investigation, formal analysis, funding acquisition, resources, methodology. T.T.: writing—original draft, writing– review and editing, visualization, investigation. J.P.: software, visualization. M.X.: software, visualization. A.L.: software, visualization. Y.L.: writing—review and editing, supervision. All authors have read and agreed to the published version of the manuscript.

Funding

This research was funded by the Natural Science Foundation of Ningxia Province grant number 2024AAC03817.

Data Availability Statement

Data will be made available upon request.

Acknowledgments

The authors gratefully acknowledge the financial support from the Natural Science Foundation of Ningxia Province (2024AAC03817).

Conflicts of Interest

The authors declare that they have no known competing financial interests or personal relationships that could have appeared to influence the work reported in this paper.

References

  1. Zhang, Q.; Meng, X.; Shi, S.; Kan, L.; Chen, R.; Kan, H. Overview of particulate air pollution and human health in China: Evidence, challenges, and opportunities. Innovation 2022, 3, 13. [Google Scholar] [CrossRef] [PubMed]
  2. He, C.; Liu, C.; Chen, R.; Meng, X.; Wang, W.; Ji, J.; Kang, L.; Liang, J.; Li, X.; Liu, Y.; et al. Fine particulate matter air pollution and under-5 children mortality in China: A national time-stratified case-crossover study. Environ. Int. 2025, 159, 107022. [Google Scholar] [CrossRef]
  3. Tan, T.; Zhang, G.; Liu, C.; Li, Y. Multi-year (2015–2023) trend and key factors of bioaerosols in urban atmosphere: A case study in Xi′an. Atmos. Environ. 2025, 353, 121258. [Google Scholar] [CrossRef]
  4. Bhatti, U.A.; Marjan, S.; Wahid, A.; Syam, M.S.; Huang, M.; Tang, H.; Hasnain, A. The effects of socioeconomic factors on particulate matter concentration in China′s: New evidence from spatial econometric model. J. Clean. Prod. 2023, 417, 137969. [Google Scholar] [CrossRef]
  5. Sangkham, S.; Phairuang, W.; Sherchan, S.P.; Pansakun, N.; Munkong, N.; Sarndhong, K.; Islam, M.; Sakunkoo, P. An update on adverse health effects from exposure to PM2.5. Environ. Advances 2024, 18, 100603. [Google Scholar] [CrossRef]
  6. Chen, S.; Liu, D.; Huang, L.; Guo, C.; Gao, X.; Xu, Z.; Yang, Z.; Chen, Y.; Li, M.; Yang, J. Global associations between long-term exposure to PM2.5 constituents and health: A systematic review and meta-analysis of cohort studies. J. Hazard. Mater. 2024, 474, 134715. [Google Scholar] [CrossRef] [PubMed]
  7. Beelen, R.; Hoek, G.; Raaschou-Nielsen, O.; Stafoggia, M.; Andersen, Z.J.; Weinmayr, G.; Hoffmann, B.; Wolf, K.; Samoli, E.; H Fischer, P.; et al. Natural-cause mortality and long-term exposure to particle components: An analysis of 19 european cohorts within the multi-center ESCAPE project. Environ. Health Perspect. 2015, 123, 525–533. [Google Scholar] [CrossRef]
  8. Sang, S.; Chu, C.; Zhang, T.; Chen, H.; Yang, X. The global burden of disease attributable to ambient fine particulate matter in 204 countries and territories, 1990–2019: A systematic analysis of the Global Burden of Disease Study 2019. Ecotoxicol. Environ. Saf. 2022, 238, 113588. [Google Scholar] [CrossRef]
  9. Liu, S.; Xing, J.; Wang, J.; Wang, S.; Zhang, X.; Ding, A. Understanding of aerosol–climate interactions in China- aerosol impacts on solar radiation, temperature, cloud, and precipitation and its changes under future climate and emission scenarios. Curr. Pollut. Rep. 2019, 5, 36–51. [Google Scholar] [CrossRef]
  10. Huang, R.; Zhang, Y.; Bozzetti, C.; Ho, K.; Cao, J.; Han, Y.; Daellenbach, K.R.; Slowik, J.G.; Platt, S.M.; Canonaco, F.; et al. High secondary aerosol contribution to particulate pollution during haze events in China. Nature 2014, 514, 218–222. [Google Scholar] [CrossRef]
  11. Madaniyazi, L.; Nagashima, T.; Guo, Y.; Yu, W.; Tong, S. Projecting fine particulate matter-related mortality in east China. Environ. Sci. Technol. 2015, 49, 11141–11150. [Google Scholar] [CrossRef]
  12. Moreno-Ríos, A.; Tejeda-Benítez, L.P.; Bustillo-Lecompte, C.F. Sources, characteristics, toxicity, and control of ultrafine particles: An overview. Geosci. Front. 2022, 13, 101147. [Google Scholar] [CrossRef]
  13. Zhang, S.; Liu, H.; Tang, N.; Ge, J.; Yu, J.; Ding, B. Direct electronetting of high-performance membranes based on self-assembled 2D nanoarchitectured networks. Nat. Commun. 2019, 10, 1458. [Google Scholar] [CrossRef] [PubMed]
  14. Wang, X.; Liu, H.; Cui, W.; Li, Y.; Guan, X.; Liu, Y. Cascade co-polarized hydro-charged nanofibers enable long-term and harsh-environment-tolerant air filtration. J. Mater. Chem. A 2024, 12, 29469. [Google Scholar] [CrossRef]
  15. Liu, Y.; Wang, R.; Zhao, T.; Gao, J.; Zheng, C.; Wang, M. Spatiotemporal distribution of atmospheric particulate matters and correlations among them in different functional areas of a typical mining city in northwestern China. Sustainability 2025, 17, 5945. [Google Scholar] [CrossRef]
  16. Wong, Y.; Huang, X.; Yu, J. Incorporating hopane degradation into chemical mass balance model: Improving accuracy of vehicular source contribution estimation. Atmos. Environ. 2019, 210, 211–219. [Google Scholar] [CrossRef]
  17. Feng, X.; Chen, Y.; Jiang, H.; Cai, J.; Liu, Z.; Feng, Y.; Li, M.; Mu, Y.; Chen, J.; Chen, T. Combination of multiple isotopes and PMF model provide insights into the method optimization of PM2.5 source apportionment during haze episodes. J. Geophys. Res. Atmos. 2024, 129, e2024JD041350. [Google Scholar] [CrossRef]
  18. Zhang, X.; Feng, X.; Tian, J.; Zhang, Y.; Li, Z.; Wang, Q.; Cao, J.; Wang, J. Dynamic harmonization of source-oriented and receptor models for source apportionment. Sci. Total Environ. 2023, 859, 160312. [Google Scholar] [CrossRef]
  19. Zhang, C.; Jing, D.; Wu, C.; Li, S.; Cheng, N.; Li, W.; Wang, G.; Chen, B.; Wang, Q.; Hu, J. Integrating chemical mass balance and the community multiscale air quality models for source identification and apportionment of PM2.5. Process Saf. Environ. Prot. 2021, 149, 665–675. [Google Scholar] [CrossRef]
  20. Zhang, Y.; Gao, M.; Sun, X.; Liang, B.; Sun, C.; Sun, Q.; Ni, X.; Ou, H.; Mai, S.; Zhou, S.; et al. The isotopic characteristics, sources, and formation pathways of atmospheric sulfate and nitrate in the South China Sea. Sustainability 2025, 16, 8733. [Google Scholar] [CrossRef]
  21. Nault, B.; Campuzano-Jost, P.; Day, D.A.; Jo, D.S.; Schroder, J.C.; Allen, H.M.; Bahreini, R.; Bian, H.; Blake, D.R.; Chin, M.; et al. Chemical transport models often underestimate inorganic aerosol acidity in remote regions of the atmosphere. Commun. Earth Environ. 2021, 2, 93. [Google Scholar] [CrossRef]
  22. Wang, S.; Wang, Q.; Cheng, Y.; Chen, H.; Zhang, Z.; Li, J.; Feng, X.; Wang, Z.; Yu, J. Molecular and elemental tracers-based receptor modeling of PM2.5 in suburban Hong Kong with hourly time-scale air quality considerations. J. Geophys. Res. Atmos. 2023, 128, e2023JD039875. [Google Scholar] [CrossRef]
  23. Zhang, Y.; Yin, Z.; Wang, H. Roles of climate variability on the rapid increases of early winter haze pollution in North China after 2010. Atmos. Chem. Phys. 2020, 20, 12211–12221. [Google Scholar] [CrossRef]
  24. Liu, Z.; Chen, H.; Li, L.; Xie, G.; Ouyang, H.; Tang, X.; Ju, R.; Li, B.; Zhang, R.; Chen, J. Real-time single particle characterization of oxidized organic aerosols in the East China Sea. npj Clim. Atmos. Sci. 2022, 5, 47. [Google Scholar] [CrossRef]
  25. Wang, S.; He, B.; Yuan, M.; Su, F.; Yin, S.; Yan, Q.; Jinag, N.; Zhang, R.; Tang, X. Characterization of individual particles and meteorological conditions during the cold season in Zhengzhou using a single particle aerosol mass spectrometer. Atmos. Res. 2019, 219, 13–23. [Google Scholar] [CrossRef]
  26. Liu, L.; Wang, Y.; Du, S.; Zhang, W.; Hou, L.; Vedal, S.; Han, B.; Yang, W.; Chen, M.; Bai, Z. Characteristics of atmospheric single particles during haze periods in a typical urban area of Beijing: A case study in October, 2014. J. Environ. Sci. 2016, 40, 145–153. [Google Scholar] [CrossRef] [PubMed]
  27. Song, A.; Meng, J.; Zhou, R.; Li, Z.; Li, Y.; Chen, M.; Hou, Z.; Yan, L.; Wang, Y. Characteristics and sources of single particles in the urban Liaocheng of North China during the heating period. Aerosol Air Qual. Res. 2021, 21, 210144. [Google Scholar] [CrossRef]
  28. Chen, L.; Zhang, J.; Li, J.; Huang, X.; Xiang, Y.; Chen, J.; Pan, T.; Zhang, W. Real-time, single-particle chemical composition, volatility and mixing state measurements of urban aerosol particles in southwest China. J. Environ. Sci. 2024, 136, 361–371. [Google Scholar] [CrossRef]
  29. Li, R.; Wang, Z.; Cui, L.; Fu, H.; Zhang, L.; Kong, L.; Chen, W.; Chen, J. Air pollution characteristics in China during 2015–2016: Spatiotemporal variations and key meteorological factors. Sci. Total Environ. 2019, 648, 902–915. [Google Scholar] [CrossRef]
  30. Shen, Y.; Jiang, F.; Feng, S.; Zheng, Y.; Cai, Z.; Lyu, X. Impact of weather and emission changes on NO2 concentrations in China during 2014–2019. Environ. Pollut. 2021, 269, 116163. [Google Scholar] [CrossRef]
  31. Cao, L.; Tao, Y.; Zheng, H.; Wang, M.; Li, S.; Xu, Y.; Li, M. Chemical composition and source of PM2.5 during winter heating period in Guanzhong Basin. Atmosphere 2023, 14, 1640. [Google Scholar] [CrossRef]
  32. Wang, F.; Yu, H.; Wang, Z.; Liang, W.; Shi, G.; Gao, J.; Li, M.; Feng, Y. Review of online source apportionment research based on observation for ambient particulate matter. Sci. Total Environ. 2021, 762, 144095. [Google Scholar] [CrossRef]
  33. Fan, M.; He, G.; Zhou, M. The winter choke: Coal-Fired heating, air pollution, and mortality in China. J. Health Econ. 2020, 71, 102316. [Google Scholar] [CrossRef]
  34. Cui, M.; Lu, H.; Etyemezian, V.; Su, Q. Quantifying the emission potentials of fugitive dust sources in Nanjing, East China. Atmos. Environ. 2019, 207, 129–135. [Google Scholar] [CrossRef]
  35. Wang, J.; Jeong, C.; Zimmerman, N.; Healy, R.M.; Evans, G.J. Real world vehicle fleet emission factors: Seasonal and diurnal variations in traffic related air pollutants. Atmos. Environ. 2018, 184, 77–86. [Google Scholar] [CrossRef]
  36. Bao, Z.; Zhang, X.; Li, Q.; Zhou, J.; Shi, G.; Zhou, L.; Yang, F.; Xie, S.; Zhang, D.; Zhai, C.; et al. Measurement report: Intensive biomass burning emissions and rapid nitrate formation drive severe haze formation in the Sichuan Basin, China insights from aerosol mass spectrometry. Atmos. Chem. Phys. 2023, 23, 1147–1167. [Google Scholar] [CrossRef]
  37. Chen, S.; Zhang, X.; Lin, J.; Huang, J.; Zhao, D.; Yuan, T.; Huang, K.; Luo, Y.; Jia, Z.; Zang, Z.; et al. Fugitive road dust PM2.5 emissions and their potential health impacts. Environ. Sci. Technol. 2019, 53, 8455–8465. [Google Scholar] [CrossRef] [PubMed]
  38. Zhang, Y.; Schauer, J.J.; Zhang, Y.; Zeng, L.; Wei, Y.; Liu, y.; Shao, M. Characteristics of particulate carbon emissions from real-world Chinese coal combustion. Environ. Sci. Technol. 2008, 42, 5068–5073. [Google Scholar] [CrossRef] [PubMed]
  39. Zhang, Z.; Wang, W.; Cheng, M.; Liu, S.; Xu, J.; He, Y.; Meng, F. The contribution of residential coal combustion to PM2.5 pollution over China′s Beijing-Tianjin-Hebei region in winter. Atmos. Environ. 2017, 159, 147–161. [Google Scholar] [CrossRef]
  40. Zhang, Z.; Zhou, Y.; Zhao, N.; Li, H.; Tohniyaz, B.; Mperejekumana, P.; Hong, Q.; Wu, R.; Li, G.; Sultan, M.; et al. Clean heating during winter season in Northern China: A review. Renew. Sustain. Energy Rev. 2021, 149, 111339. [Google Scholar] [CrossRef]
  41. Li, Z.; Meng, F.; Wu, S.; Afthanorhan, A.; Hao, Y. Guiding clean energy transitions in rural households: Insights from China′s pilot low-carbon policies. J. Environ. Manag. 2024, 370, 122782. [Google Scholar] [CrossRef]
  42. Li, T.; Dong, W.; Dai, Q.; Feng, Y.; Bi, X.; Zhang, Y.; Wu, J. Application and validation of the fugitive dust source emission inventory compilation method in Xiong′an New Area, China. Sci. Total Environ. 2021, 798, 149114. [Google Scholar] [CrossRef]
  43. Makar, P.; Stroud, C.; Akingunola, A.; Zhang, J.; Ren, S.; Cheung, P.; Zeng, Q. Vehicle-induced turbulence and atmospheric pollution. Atmos. Chem. Phys. 2021, 21, 12291–12316. [Google Scholar] [CrossRef]
  44. Sun, J.; Shen, Z.; Zhang, L.; Lei, Y.; Gong, X.; Zhang, Q.; Zhang, T.; Xu, H.; Cui, S.; Wang, Q.; et al. Chemical source profiles of urban fugitive dust PM2.5 samples from 21 cities across China. Sci. Total Environ. 2019, 649, 1045–1053. [Google Scholar] [CrossRef]
  45. Chin, J.; Batterman, S.A.; Northrop, W.F.; Bohac, S.V.; Assanis, D.N. Gaseous and particulate emissions from diesel engines at Idle and under load: Comparison of biodiesel blend and ultralow sulfur diesel fuels. Energy Fuels 2012, 26, 6737–6748. [Google Scholar] [CrossRef] [PubMed]
  46. Zhao, Z.; Cao, F.; Fan, M.; Zhang, W.; Zhai, X.; Wang, Q.; Zhang, Y. Coal and biomass burning as major emissions of NOX in Northeast China: Implication from dual isotopes analysis of fine nitrate aerosols. Atmos. Environ. 2020, 242, 117762. [Google Scholar] [CrossRef]
  47. Liu, T.; He, Q.; Chen, Y.; Liu, J.; Liu, Q.; Fu, X.; Zhang, J.; Huang, G.; Li, R. Distinct impacts of humidity profiles on physical properties and secondary formation of aerosols in Shanghai. Atmos. Environ. 2021, 267, 118756. [Google Scholar] [CrossRef]
Figure 1. Schematic of the study area and monitoring sites. Red triangle represents study area.
Sustainability 17 06627 g001
Figure 2. Temporal changes in (a) air quality and (b) meteorological parameters during the monitoring period.
Sustainability 17 06627 g002
Figure 3. Air pollutant concentration distributions in polar coordinates under wind-driven conditions.
Sustainability 17 06627 g003
Figure 4. PM2.5 components based on Art-2a classification and source analysis results. (a) Percentage of chemical composition; (b) source contribution.
Sustainability 17 06627 g004
Figure 5. Time series of PM2.5 source resolution during the monitoring period.
Sustainability 17 06627 g005
Figure 6. Diurnal evolution of PM2.5 concentrations coupled with dynamic source contributions.
Sustainability 17 06627 g006
Figure 7. Day and night evolution of PM2.5 concentrations coupled with dynamic source contributions.
Sustainability 17 06627 g007
Figure 8. Refined source analysis of (a) coal combustion, (b) fugitive dust, and (c) vehicle emissions.
Sustainability 17 06627 g008
Figure 9. Comparison of PM2.5 sources for different pollution levels.
Sustainability 17 06627 g009
Figure 10. Changes in source contributions during typical pollution periods. (a) Haze I: 25-30 December 2023, (b) Haze II: 8–14 January 2024, (c) Haze III: 15–20 January 2024.
Sustainability 17 06627 g010
Figure 11. Backward clustering trajectories in Yinchuan. (a) 24–30 December 2023; (b) 10–13 January 2024; (c) 15–19 January 2024.
Sustainability 17 06627 g011
Table 1. Correlation analysis between pollution sources and environmental and meteorological parameters.
Environmental FactorsCookingFugitive DustBiomass BurningVehicle EmissionsCoal
Combustion
Industrial ProcessesSecondary SourcesOthers
PM2.5−0.250 **0.068 **−0.493 **0.256 **0.054 *0.188 **0.267 **0.057 *
PM10−0.134 **0.093 **−0.346 **0.135 **−0.0080.180 **0.238 **0.020
NO2−0.052 *0.168 **−0.299 **−0.098 **0.239 **−0.065 *−0.065 *0.070 **
SO2−0.054 *0.353 **−0.230 **−0.096 **−0.007−0.096 **0.131 **−0.164 **
CO−0.270 **0.056 *−0.492 **0.153 **0.235 **0.127 **0.118 *0.104 **
O30.287 *0.176 **0.363 **−0.094 **−0.501 **−0.087 **0.183 **−0.251 **
T0.274 **0.264 **0.139 **−0.043 **−0.564 **0.159 **0.266 **−0.226 **
RH−0.522 **−0.526 **−0.463 **0.591 **0.330 **0.355 **0.147 **0.357 **
WS0.171 **−0.0240.284 **−0.066 *−0.251 **0.076 **0.077 **−0.117 **
Note: * means p < 0.05, ** means p < 0.01.
Disclaimer/Publisher’s Note: The statements, opinions and data contained in all publications are solely those of the individual author(s) and contributor(s) and not of MDPI and/or the editor(s). MDPI and/or the editor(s) disclaim responsibility for any injury to people or property resulting from any ideas, methods, instructions or products referred to in the content.

