

Threats and Opportunities for Biodiversity Conservation and Sustainable Use in the Buffer Zones of National Parks in the Brazilian Cerrado

 , , and
Abstract
1. Introduction
2. Materials and Methods
2.1. Study Area
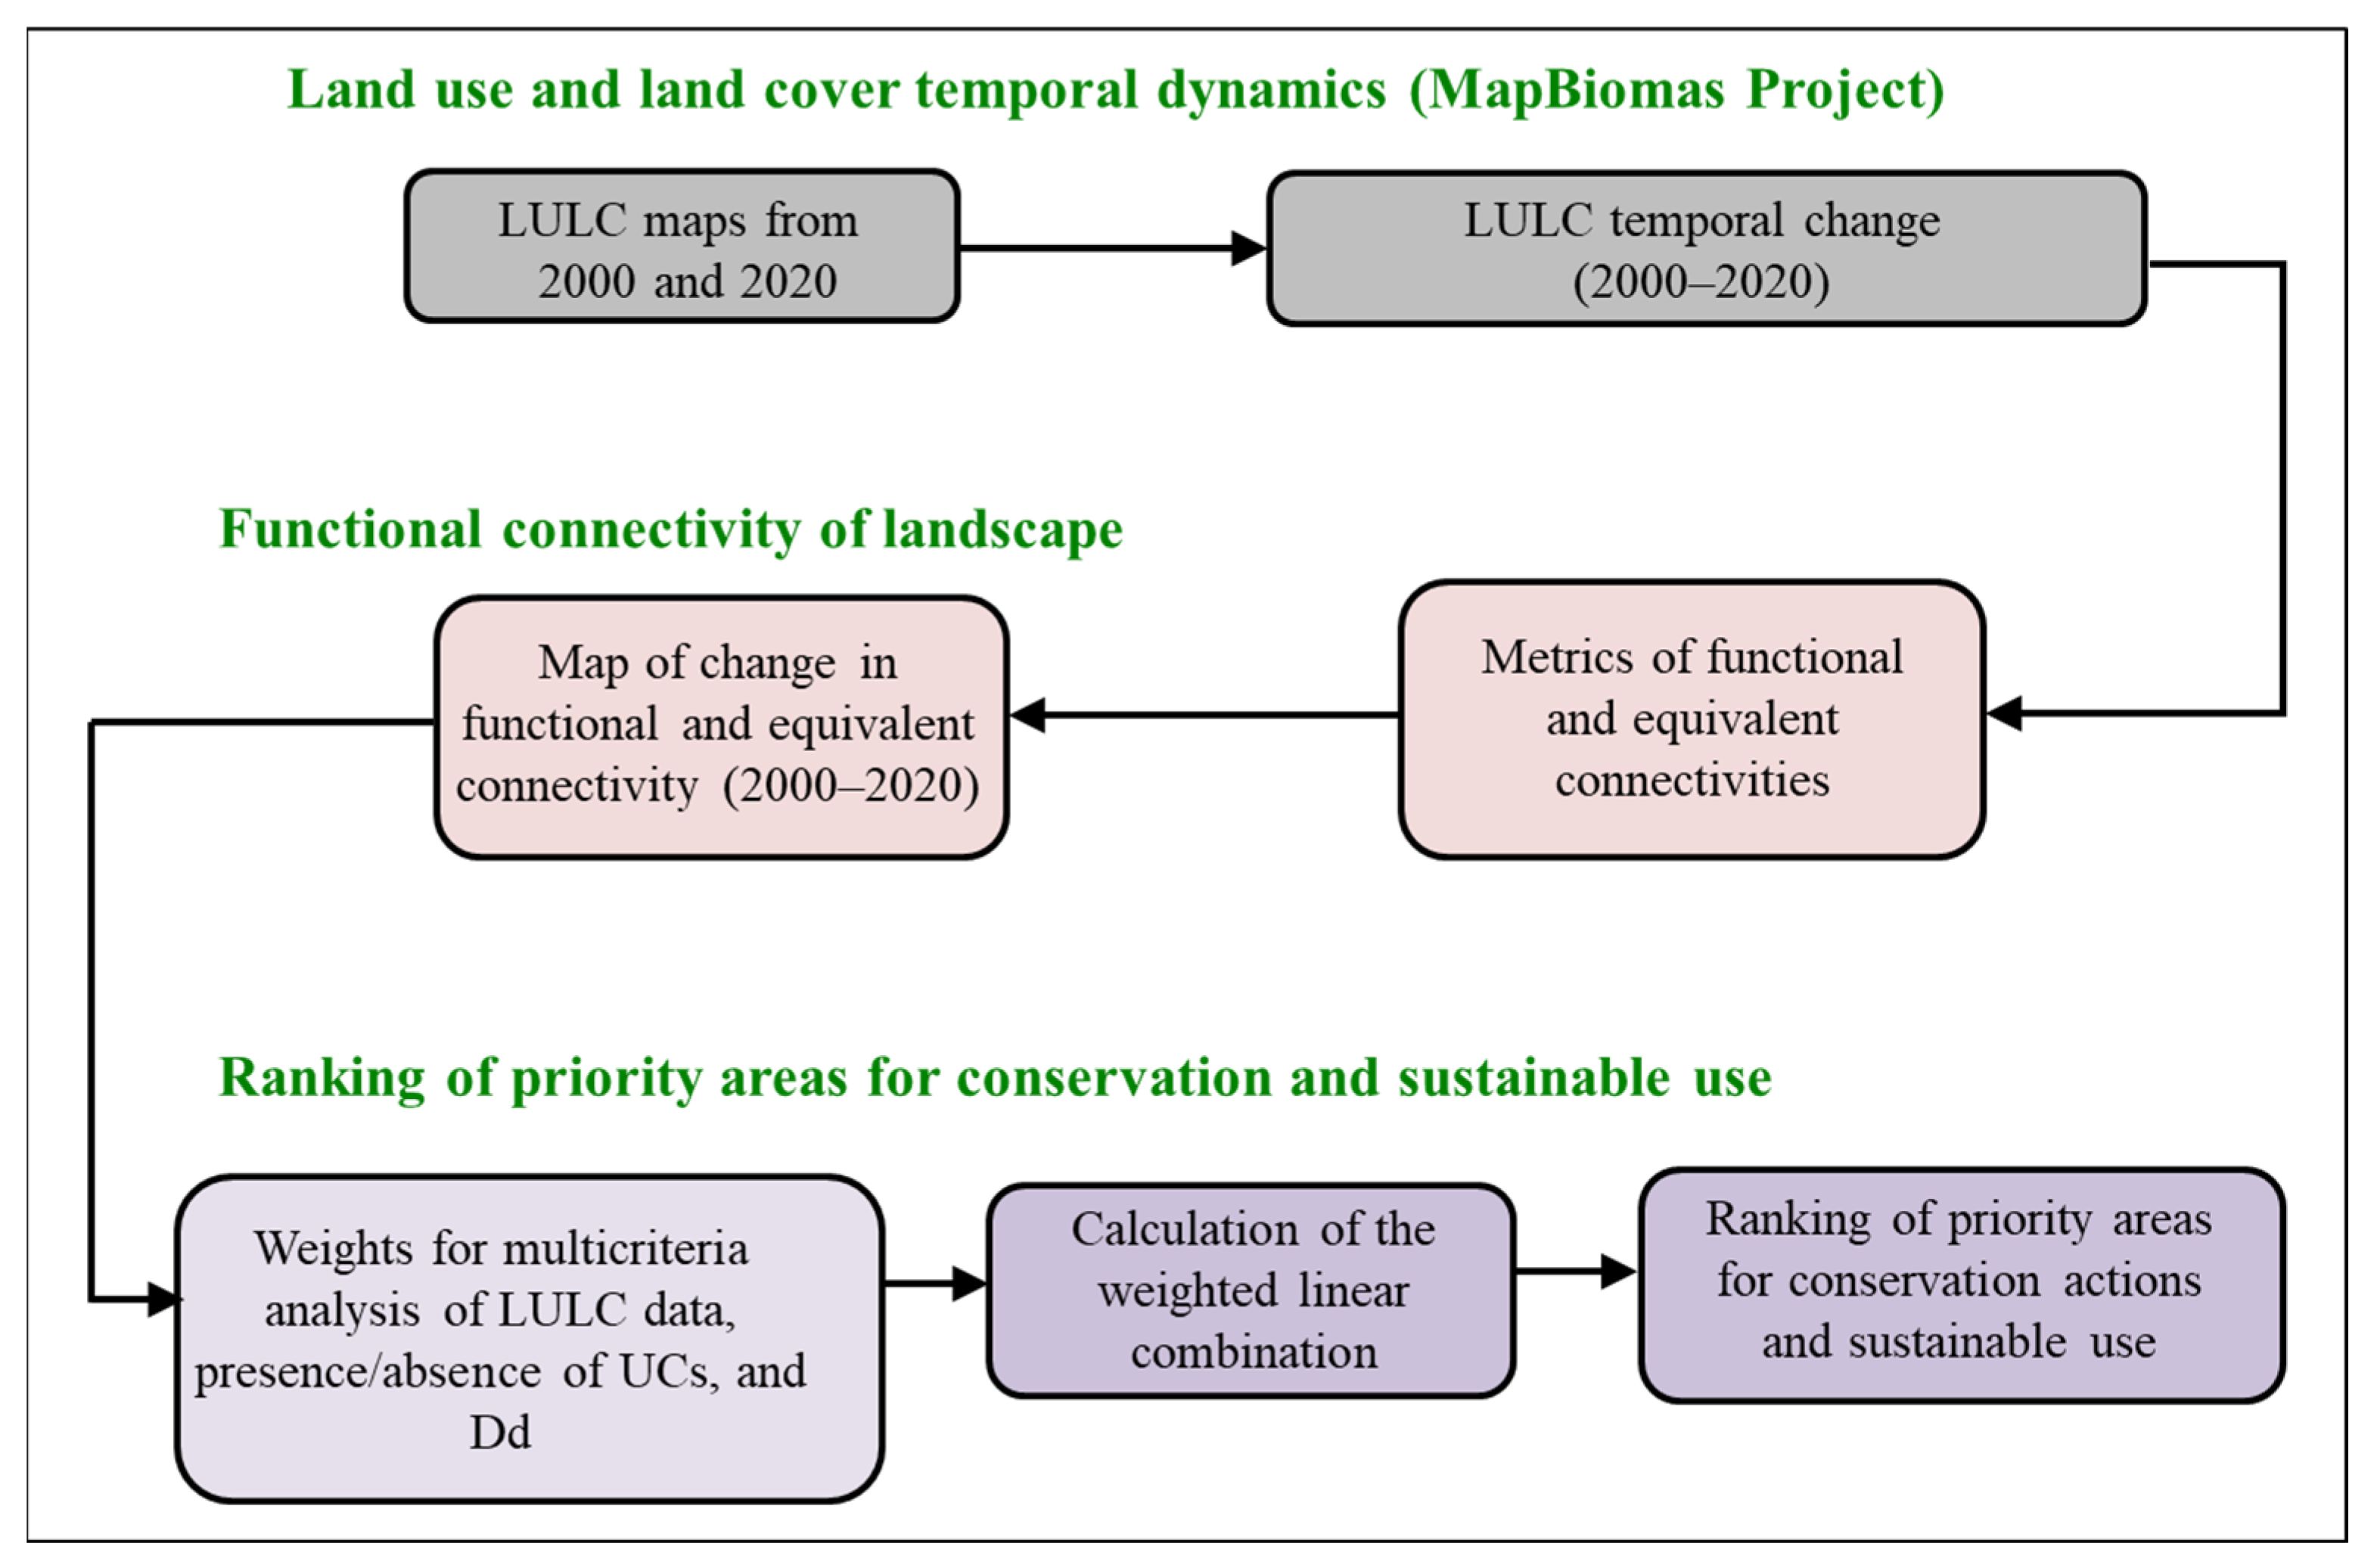
2.2. Methods
2.2.1. Land Use and Land Cover Data
2.2.2. Functional Connectivity
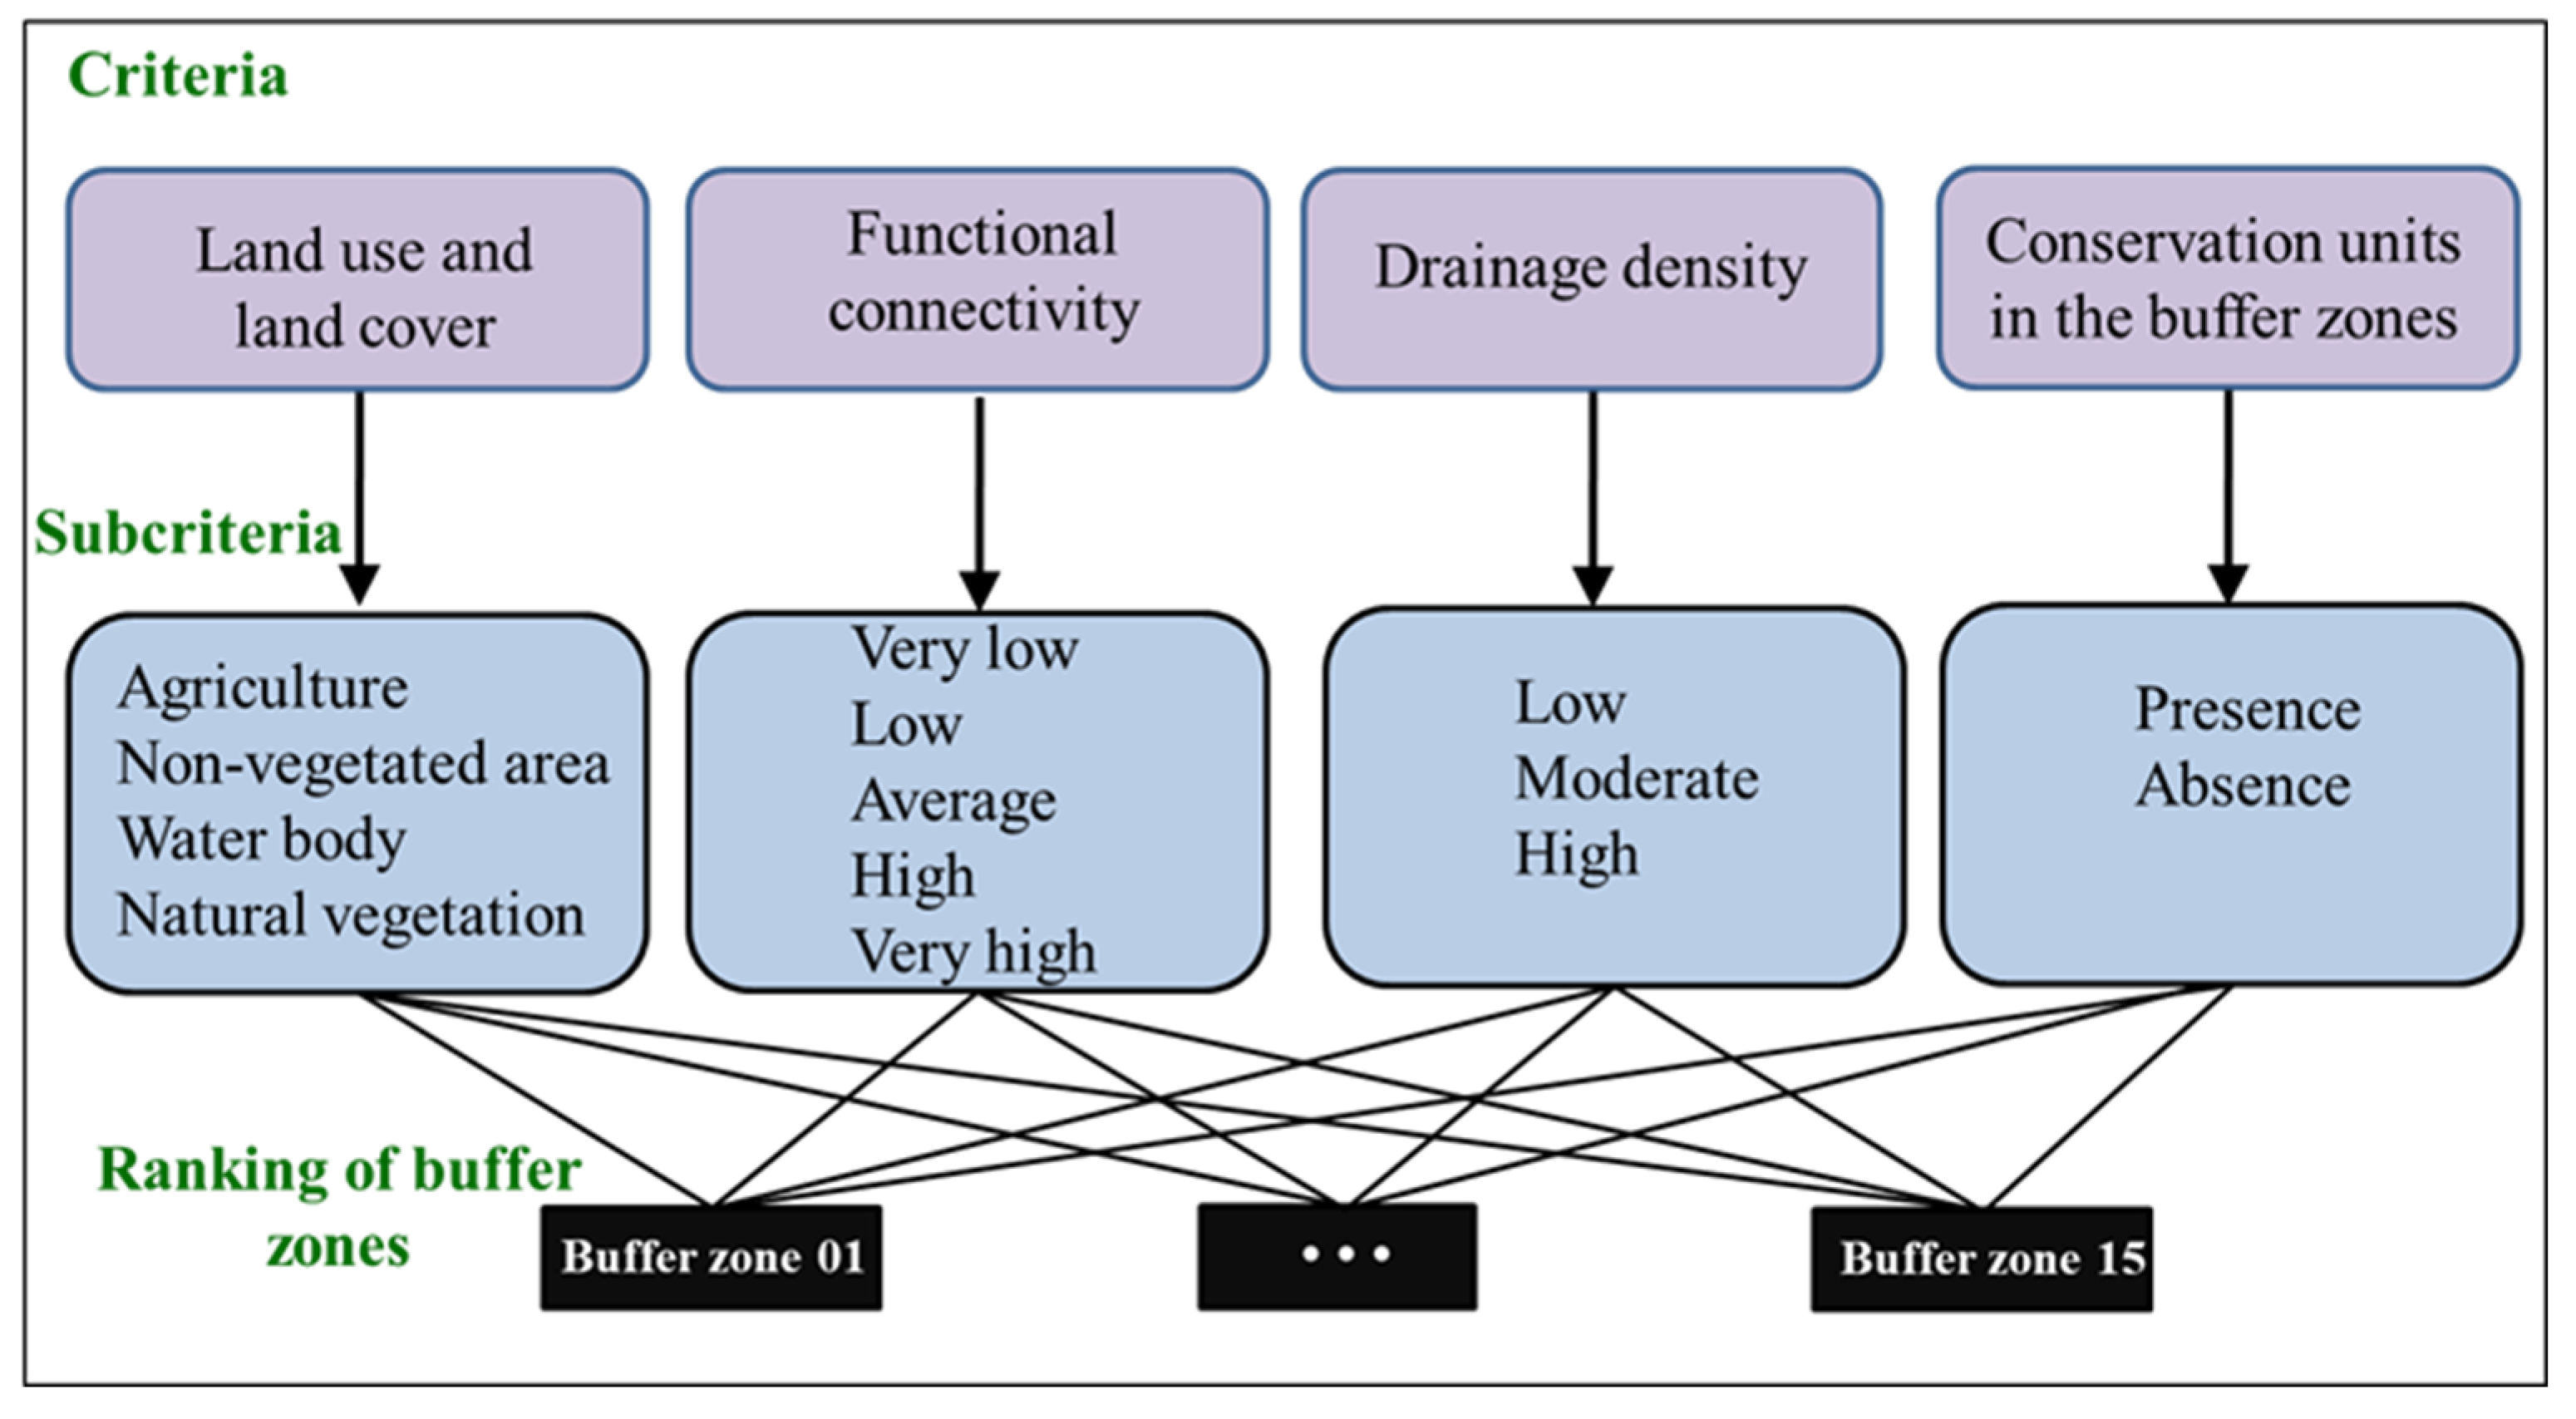
2.2.3. Ranking the Priority Areas for Biodiversity Conservation
3. Results
3.1. Weights for Hierarchical Analysis
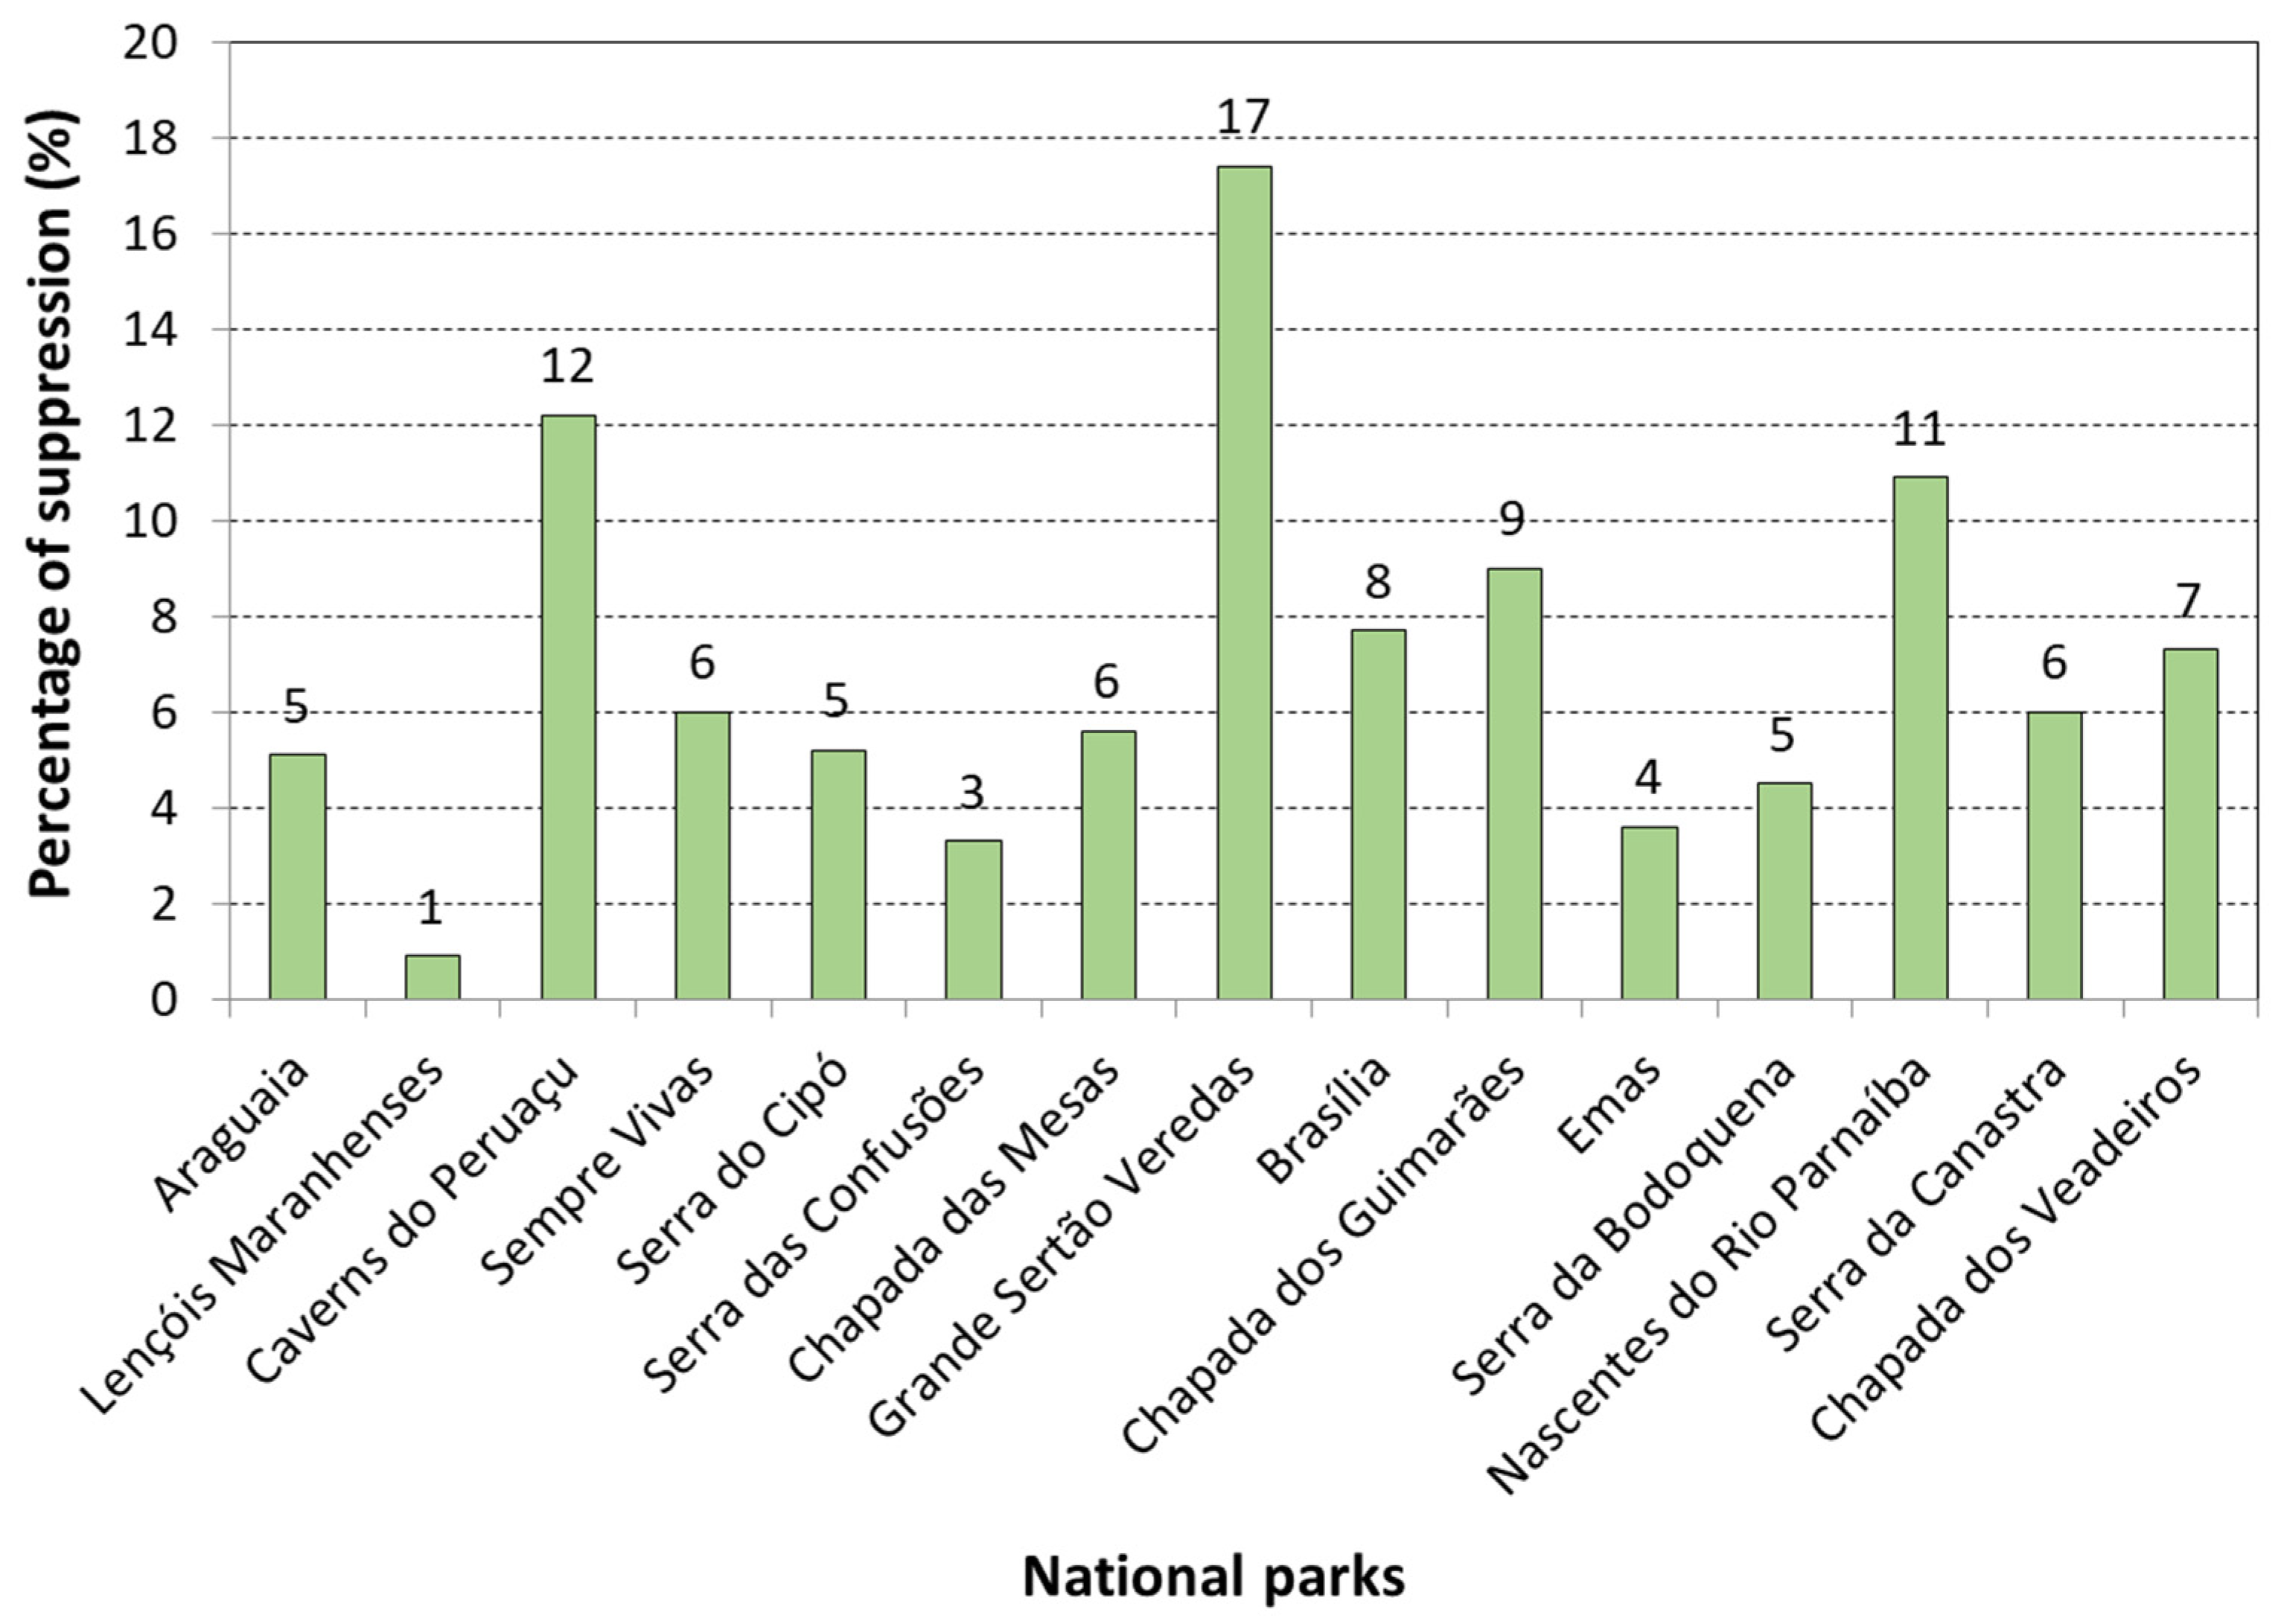
3.2. Land Use and Land Cover Change
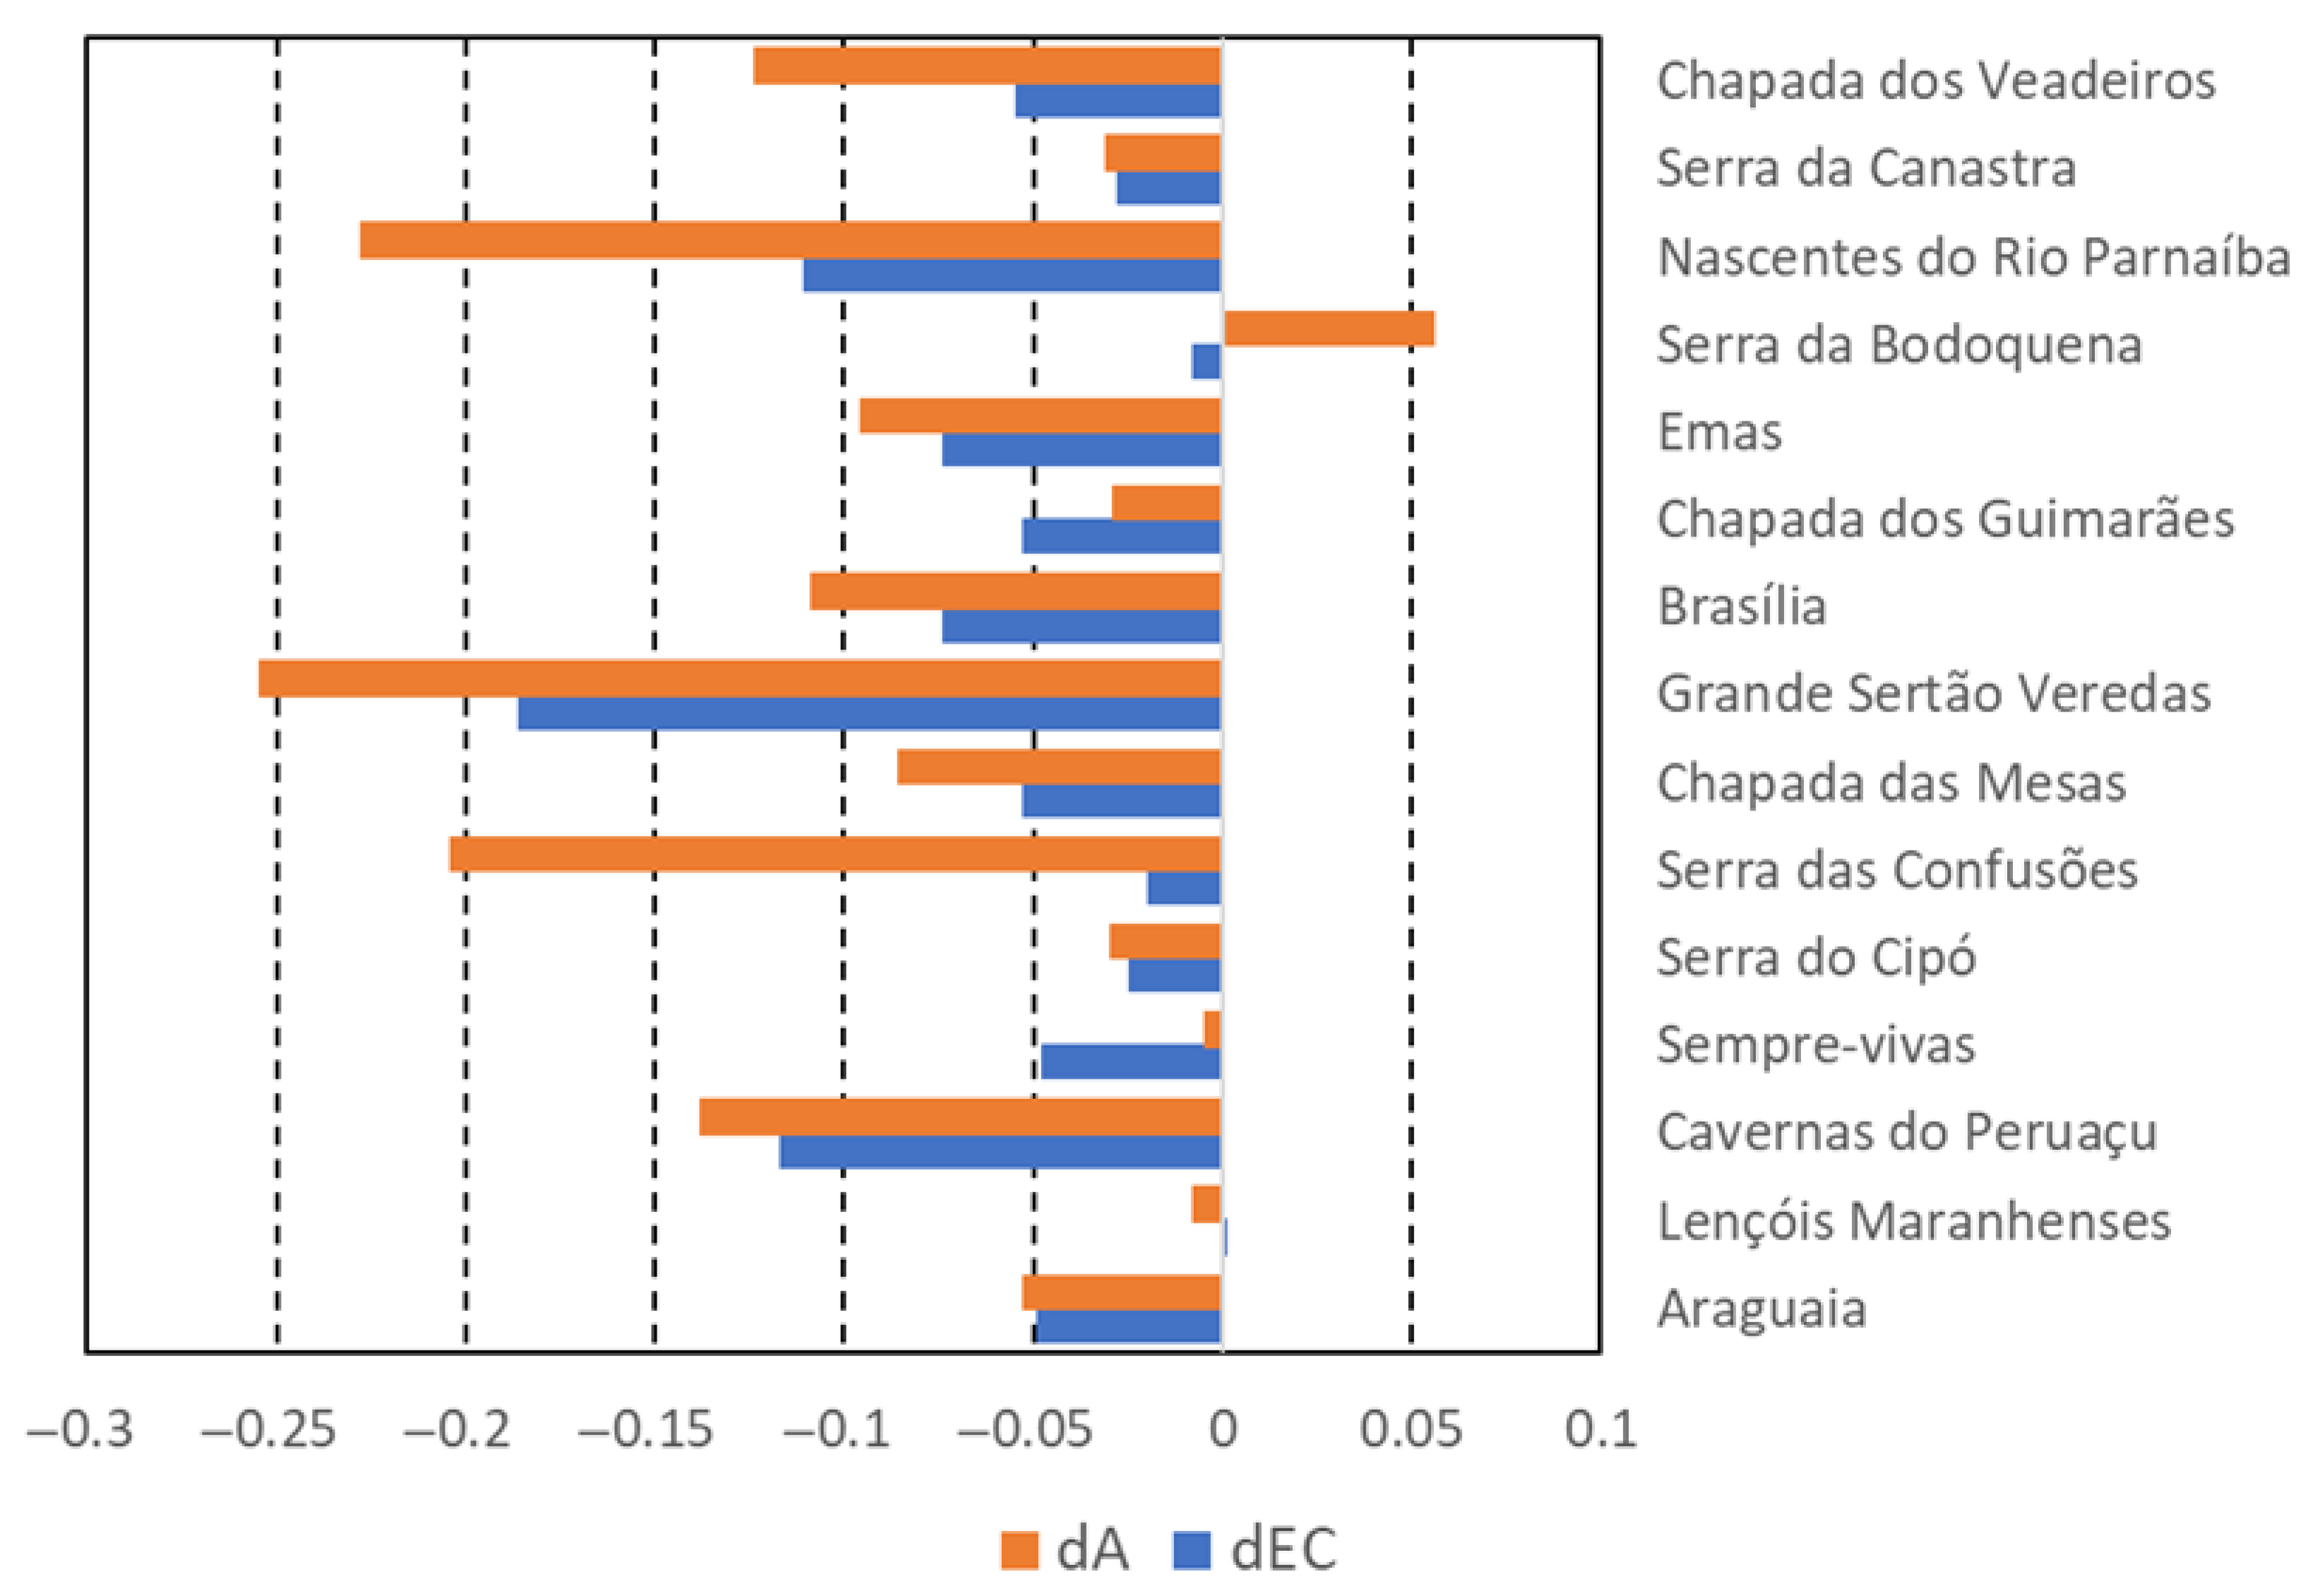
3.3. Functional Connectivity of Landscape
3.4. Presence or Absence of Conservation Units
3.5. Drainage Network
3.6. Prioritization for Conservation and Sustainable Use
4. Discussion
4.1. Key Findings
4.2. Recommended Strategies for High-Priority Buffer Zones
4.3. Sustainable Land Use Opportunities in Highly Modified Areas
4.4. Limitations and Future Directions
5. Conclusions
Author Contributions
Funding
Institutional Review Board Statement
Informed Consent Statement
Data Availability Statement
Conflicts of Interest
References
- Sidorov, A.A.; Kudinova, G.E.; Kostina, N.V. Acessibility of protected areas of regional significance: A case study from Samara Oblast, Russia. IOP Conf. Ser. Earth. Environ. Sci. 2021, 818, 012050. [Google Scholar] [CrossRef]
- Bhola, N.; Klimmek, H.; Kingston, N.; Burgess, N.D.; van Soesbergen, A.; Corrigan, C.; Harrison, J.; Kok, M.T.J. Perspectives on area-based conservation and its meaning for future biodiversity policy. Conserv. Biol. 2021, 35, 168–178. [Google Scholar] [CrossRef]
- Brasil. Lei no. 9.985, de 18 de Julho de 2000, Institui o Sistema Nacional de Unidades de Conservação da Natureza e dá Outras Providências; Diário Oficial da União: Brasília, Brazil, 2000. [Google Scholar]
- Oliveira, B.R.; Carvalho-Ribeiro, S.M.; Maia-Barbosa, P.M. A multiscale analysis of land use dynamics in the buffer zone of Rio Doce State Park, Minas Gerais, Brazil. J. Environ. Plan. Manag. 2020, 63, 935–957. [Google Scholar] [CrossRef]
- Rodrigues, A.A.; Bustamante, M.M.C.; Sano, E.E. As far as the eye can see: Scenic view of Cerrado National Parks. Perspect. Ecol. Conserv. 2018, 16, 31–37. [Google Scholar] [CrossRef]
- Wang, Y.; Yang, H.; Qi, D.; Songer, M.A.; Bai, W.; Zhou, C.; Zhang, J.; Huang, Q. Efficacy and management challenges of the zoning designations of China’s national parks. Biol. Conserv. 2021, 254, 108962. [Google Scholar] [CrossRef]
- Nadhira, S.; Basuni, S. Implementation of the concept of conservation area buffer zone in Indonesia. J. Trop. For. Manag. 2021, 27, 32–41. [Google Scholar] [CrossRef]
- Zamaletdinov, R.I.; Mingaliev, R.R.; Kiseleva, A.A. The terrestrial vertebrate fauna of valuable natural areas in Kazan. Res. J. Pharm. Biol. Chem. Sci. 2016, 7, 2850–2855. [Google Scholar]
- Torgeski, M.R.; Carvalho, E.M.; Santos, A.M.; Lemke, A.P.; Fioratti, C.A.G.; Stefanes, M.; Silva, S.M.; Mussary, R.M. Spatiotemporal analysis of land use and cover dynamics in protected areas of the Brazilian Cerrado. Scientifica 2024, 2025, 7984448. [Google Scholar] [CrossRef]
- Du, W.; Penabaz-Wiley, S.M.; Njeru, A.M.; Kinoshita, I. Models and approaches for integrating protected areas with their surroundings: A review of the literature. Sustainability 2015, 7, 8151–8177. [Google Scholar] [CrossRef]
- Rodrigues, A.A.; Macedo, M.N.; Silvério, D.V.; Maracahipes, L.; Coe, M.T.; Brando, P.M.; Shimbo, J.Z.; Rajão, R.; Soares-Filho, B.; Bustamante, M.M. Cerrado deforestation threatens regional climate and water availability for agriculture and ecosystems. Global Change Biol. 2022, 28, 6807–6822. [Google Scholar] [CrossRef] [PubMed]
- MapBiomas. MapBiomas, version 6.0; MapBiomas: São Paulo, Brazil, 2021. Available online: https://brasil.mapbiomas.org/ (accessed on 15 March 2022).
- Brock, R.C.; Arnell, A.; Simonson, W.; Soterroni, A.C.; Mosnier, A.; Ramos, F.; Carvalho, A.X.Y.; Camara, G.; Pirker, J.; Obersteiner, M.; et al. Implementing Brazil’s Forest Code: A vital contribution to securing forests and conserving biodiversity. Biodivers. Conserv. 2021, 30, 1621–1635. [Google Scholar] [CrossRef]
- Luiz, C.H.P.; Steinke, V.A. Recent environmental legislation in Brazil and the impact on Cerrado deforestation rates. Sustainability 2022, 14, 8096. [Google Scholar] [CrossRef]
- Colman, C.B.; Guerra, A.; Almagro, A.; Roque, F.O.; Rosa, I.M.D.; Fernandes, G.W.; Oliveira, P.T.S. Modeling the Brazilian Cerrado land use change highlights the need to account for private property sizes for biodiversity conservation. Sci. Rep. 2024, 14, 4559. [Google Scholar] [CrossRef] [PubMed]
- Klink, C.A.; Machado, R.B. A conservação do Cerrado brasileiro. Megadiversidade 2005, 1, 148–155. [Google Scholar]
- Pompeu, J.; Assis, T.O.; Ometto, J.P. Landscape changes in the Cerrado: Challenges of land clearing, fragmentation and land tenure for biological conservation. Sci. Total Environ. 2024, 906, 167581. [Google Scholar] [CrossRef] [PubMed]
- Soares Filho, B.S.; Oliveira, U.; Ferreira, M.N.; Marques, F.F.C.; Oliveira, A.R.; Silva, F.R.; Börner, J. Contribution of the Amazon protected areas program to forest conservation. Biol. Conserv. 2023, 279, 109928. [Google Scholar] [CrossRef]
- Vieira, R.R.S.; Pressey, R.L.; Loyola, R. The residual nature of protected areas in Brazil. Biol. Conserv. 2019, 233, 152–161. [Google Scholar] [CrossRef]
- Brasil. Áreas Prioritárias Para a Conservação, Utilização Sustentável e Repartição dos Benefícios da Biodiversidade; Ministério do Meio Ambiente e Mudança do Clima: Brasília, Brazil, 2023. [Google Scholar]
- Bellón, B.; Blanco, J.; Vos, A.; Roque, F.; Pays, O.; Renaud, P.C. Integrated landscape change analysis of protected areas and their surrounding landscapes: Application in the Brazilian Cerrado. Remote Sens. 2020, 12, 1413. [Google Scholar] [CrossRef]
- Carranza, T.; Balmford, A.; Kapos, V.; Manica, A. Protected area effectiveness in reducing conversion in a rapidly vanishing ecosystem: The Brazilian Cerrado. Conserv. Lett. 2014, 7, 216–223. [Google Scholar] [CrossRef]
- Françoso, R.D.; Brandão, R.; Nogueira, C.C.; Salmona, Y.B.; Machado, R.B.; Colli, G.R. Habitat loss and the effectiveness of protected areas in the Cerrado biodiversity hotspot. Nat. Conserv. 2015, 13, 35–40. [Google Scholar] [CrossRef]
- Forero-Medina, G.; Vieira, M.V. Conectividade funcional e a importância da interação organismo-paisagem. Oecol. Bras. 2007, 11, 493–502. [Google Scholar] [CrossRef]
- Diniz-Filho, J.A.F.; Bini, L.M.; Oliveira, G.; Barreto, B.S.; Silva, M.M.F.P.; Terribile, L.C.; Rangel, T.F.L.V.B.; Pinto, M.P.; Sousa, N.P.R.D. Macroecologia, biogeografia e áreas prioritárias para conservação no Cerrado. Oecol. Bras. 2009, 13, 470–497. [Google Scholar] [CrossRef]
- Rudnick, D.A.; Ryan, S.J.; Beier, P.; Cushman, S.A.; Dieffenbach, F.; Epps, C.W.; Gerber, L.R.; Hartter, J.; Jenness, J.S.; Kintsch, J.; et al. The role of landscape connectivity in planning and implementing conservation and restoration priorities. Issues Ecol. 2012, 16, 1–20. [Google Scholar]
- Manes, S.; Rocha, D.S.B.; Oliveira, L.; Liévano-Latorre, L.F.; Almeida-Rocha, J.M.; Capellão, R.; Cordeiro, C.L.; Dib, V.; Lacerda, E.; Latawiec, A.; et al. Planning for the Restoration of Functional Connectivity in Brazil. J. Biogeogr. 2025, 52, e15090. [Google Scholar] [CrossRef]
- Pascual-Hortal, L.; Saura, S. Comparison and development of new graph-based landscape connectivity indices: Towards the priorization of habitat patches and corridors for conservation. Landsc. Ecol. 2006, 21, 959–967. [Google Scholar] [CrossRef]
- Chagas, R.L.; Martines, M.R.; Toppa, R.H. Analyzing the role of public policies in landscape connectivity. Environ. Dev. Sustain. 2024, 26, 29379–29399. [Google Scholar] [CrossRef]
- Chen, X.; Kang, B.; Li, M.; Du, Z.; Zhang, L.; Li, H. Identification of priority areas for territorial ecological conservation and restoration based on ecological networks: A case study of Tianjin City, China. Ecol. Indic. 2023, 146, 109809. [Google Scholar] [CrossRef]
- Schwaida, S.F.; Cicerelli, R.E.; Almeida, T.; Sano, E.E.; Pires, C.H.; Ramos, A.P.M. Defining priorities areas for biodiversity conservation and trading forest certificates in the Cerrado biome in Brazil. Biodivers. Conserv. 2023, 32, 1807–1820. [Google Scholar] [CrossRef]
- Esmail, B.A.; Geneletti, D. Multi-criteria decision analysis for nature conservation: A review of 20 years of applications. Methods Ecol. Evol. 2018, 9, 42–53. [Google Scholar] [CrossRef]
- Niemeyer, J.; Barros, F.S.M.; Silva, D.S.; Crouzeilles, R.; Vale, M.M. Planning forest restoration within private land holdings with conservation co-benefits at the landscape scale. Sci. Total Environ. 2020, 717, 135262. [Google Scholar] [CrossRef]
- Schüler, J.; Bustamante, M.M.C. Spatial planning for restoration in Cerrado: Balancing the trade-offs between conservation and agriculture. J. Appl. Ecol. 2022, 59, 2616–2626. [Google Scholar] [CrossRef]
- Chandio, I.A.; Matori, A.N.; Yusof, K.B.; Talpur, M.A.H.; Balogun, A.L.; Lawal, D.U. GIS-based analytic hierarchy process as a multicriteria decision analysis instrument: A review. Arab. J. Geosci. 2013, 6, 3059–3066. [Google Scholar] [CrossRef]
- Morandi, D.T.; França, L.C.J.; Menezes, E.S.; Machado, E.L.M.; Silva, M.D.; Mucida, D.P. Delimitation of ecological corridors between conservation units in the Brazilian Cerrado using a GIS and AHP approach. Ecol. Indic. 2020, 115, 106440. [Google Scholar] [CrossRef]
- Christofoletti, A. A análise da densidade de drenagem e suas implicações geomorfológicas. Geografia 1979, 4, 23–42. [Google Scholar]
- Collares, E.G. Avaliação de Alterações em Redes de Drenagem de Microbacias Como Subsídio ao Zoneamento Geoambiental de Bacias Hidrográficas: Aplicação na Bacia Hidrográfica do Rio Capivari—SP. Ph.D. Dissertation, University of São Paulo, São Paulo, Brazil, 2000. [Google Scholar]
- Horton, R.E. Erosional development of streams and their drainage basins: Hydrophysical approach to quantitative morphology. Geol. Soc. Am. Bull. 1945, 56, 275–370. [Google Scholar] [CrossRef]
- IBGE. Instituto Brasileiro de Geografia e Estatística. Biomas. Rio de Janeiro. 2004. Available online: https://www.ibge.gov.br/geociencias/informacoes-ambientais/vegetacao/15842-biomas.html?=&t=downloads (accessed on 10 March 2022).
- ICMBio. Dados Geoespaciais de Referência da Cartografia Nacional e Dados Temáticos Produzidos no ICMBio; Instituto Chico Mendes de Conservação da Biodiversidade, Brasília, Brazil, 2024. Available online: https://www.gov.br/icmbio/pt-br/assuntos/dados_geoespaciais/mapa-tematico-e-dados-geoestatisticos-das-unidades-de-conservacao-federais (accessed on 10 March 2022).
- ANA. Sistema Nacional de Informações sobre Recursos Hídricos (SNIRH). Agência Nacional de Águas e Saneamento Básico: Brasília, Brazil, 2024. Available online: https://www.snirh.gov.br/ (accessed on 10 March 2022).
- Congedo, L. Semi-automatic classification plugin: A Python tool for the download and processing of remote sensing images in QGIS. J. Open Source Softw. 2021, 6, 3172. [Google Scholar] [CrossRef]
- Saura, S.; Torné, J. Conefor Sensinode 2.2: A software package for quantifying the importance of habitat patches for landscape connectivity. Environ Model. Softw. 2009, 24, 135–139. [Google Scholar] [CrossRef]
- Saura, S.; Pascual-Hortal, L. A new habitat availability index to integrate connectivity in landscape conservation planning: Comparison with existing indices and application to a case study. Landsc. Urban. Plan. 2007, 83, 91–103. [Google Scholar] [CrossRef]
- Saura, S.; Rubio, L. A common currency for the different ways in which patches and links can contribute to habitat availability and connectivity in the landscape. Ecography 2010, 33, 523–537. [Google Scholar] [CrossRef]
- Saura, S.; Torné, J. Conefor 2.6 User Manual; Universidad Politécnica de Madrid: Madri, Spain, 2012; p. 19. [Google Scholar]
- Bertassoni, A. Avaliação da Relação Entre Distância Média Diária Percorrida, Área de Vida e Disponibilidade de Energia Para Tamanduás-Bandeira (Myrmecophaga tridactyla) em Savanas Neotropicais. Master’s Thesis, Universidade Federal de Mato Grosso do Sul, Campo Grande, Brazil, 2010. [Google Scholar]
- Diniz, M.F.; Machado, R.B.; Bispo, A.A.; Marco Júnior, P. Can we face different types of storms under the same umbrella? Efficiency and consistency of connectivity umbrellas across different patchy landscape patterns. Landsc. Ecol. 2018, 33, 1911–1923. [Google Scholar] [CrossRef]
- Rodrigues, F.H.G. Biologia e Conservação do Lobo-Guará na Estação Ecológica de Águas Emendadas, DF. Ph.D. Dissertation, University of Campinas, Campinas, Brazil, 2002. [Google Scholar]
- Silveira, L.; Sollmann, R.; Jácomo, A.T.A.; Diniz Filho, J.A.F.; Tôrres, N.M. The potential for large-scale wildlife corridors between protected areas in Brazil using the jaguar as a model species. Landsc. Ecol. 2014, 29, 1213–1223. [Google Scholar] [CrossRef]
- IUCN. The IUCN Red List of Threatened Species. Version 2025-1. Available online: https://www.iucnredlist.org/resources/categories-and-criteria (accessed on 15 March 2025).
- Saura, S.; Estreguil, C.; Mouton, C.; Rodríguez-Freire, M. Network analysis to assess landscape connectivity trends: Application to European forests (1990–2000). Ecol. Indic. 2011, 11, 407–416. [Google Scholar] [CrossRef]
- Razali, N.M.; Wah, Y.B. Power comparisons of Shapiro-Wilk, Kolmogorov-Smirnov, Lilliefors and Anderson-Darling tests. J. Stat. Model Analyt. 2011, 2, 21–33. [Google Scholar]
- R Core Team. R: A Language and Environment for Statistical Computing; R Foundation for Statistical Computing: Vienna, Switzerland, 2017. [Google Scholar]
- Saaty, T.L. A scaling method for priorities in hierarchical structures. J. Math. Psychol. 1977, 15, 234–281. [Google Scholar] [CrossRef]
- Tarboton, D.G.; Bras, R.L.; Rodriguez-Iturbe, I. A physical basis for drainage density. Geomorphology 1992, 5, 59–76. [Google Scholar] [CrossRef]
- Lacerda, H.C.; Macedo, D.R.; Pompeu, P.S.; Cherem, L.F.S.; Hughes, R.M. Key landscape factors influencing stream physical habitats across the Brazilian neotropical savanna. Ecohydrology 2025, 18, e70037. [Google Scholar] [CrossRef]
- Villela, S.M.; Mattos, A. Bacia hidrográfica. In Hidrologia Aplicada; Villela, S.M., Mattos, A., Eds.; McGraw-Hill: São Paulo, Brazil, 1975. [Google Scholar]
- Jenks, G.F. The data model concept in statistical mapping. Int. Yearbook Cartogr. 1967, 7, 186–190. [Google Scholar]
- Araújo, M.L.S.; Rufino, I.A.A.; Silva, F.B.; Brito, H.C.; Santos, J.R.N. The relationship between climate, agriculture and land cover in Matopiba, Brazil (1985–2020). Sustainability 2024, 16, 2670. [Google Scholar] [CrossRef]
- Agostinho, F.; Costa, M.; Almeida, C.M.V.B.; Maceno, M.M.C.; Giannetti, B.F. Sustainability dynamics of the Brazilian MATOPIBA region between 1990—2018: Impacts of agribusiness expansion. Appl. Geogr. 2023, 159, 103080. [Google Scholar] [CrossRef]
- Souza, C.M., Jr.; Shimbo, J.Z.; Rosa, M.R.; Parente, L.L.; Alencar, A.A.; Rudorff, B.F.T.; Hasenack, H.; Matsumoto, M.; Ferreira, L.G.; Souza-Filho, P.W.M.; et al. Reconstructing three decades of land use and land cover changes in Brazilian biomes with Landsat archive and Earth Engine. Remote Sens. 2020, 12, 2735. [Google Scholar] [CrossRef]
- Vieira-Alencar, J.P.S.; Bolochio, B.E.; Carmignotto, A.P.; Sawaya, R.J.; Silveira, L.F.; Valdujo, P.H.; Nogueira, C.C.; Nori, J. How habitat loss and fragmentation are reducing conservation opportunities for vertebrates in the most threatened savanna of the World. Perspect. Ecol. Conserv. 2023, 21, 121–127. [Google Scholar] [CrossRef]
- Soterroni, A.C.; Ramos, F.M.; Mosnier, A.; Fargione, J.; Andrade, P.R.; Baumgarten, L.; Pirker, J.; Obersteiner, M.; Kraxner, F.; Câmara, G.; et al. Expanding the soy moratorium to Brazil’s Cerrado. Sci. Adv. 2019, 5, eaav7336. [Google Scholar] [CrossRef] [PubMed]
- Aragão, R.B.A.; Lima, M.G.B.; Burns, G.L.; Ross, H. To clear or not to clear: Unpacking soy farmers’ decision-making on deforestation in Brazil’s Cerrado. Front. Sustain. Food Syst. 2022, 6, 942207. [Google Scholar] [CrossRef]
- Zhou, R.; Du, Y.; Gao, Y.; Xie, Y. Strategies for coordinated development between local comunnities and the Northeast China Tiger and Leopard National Park: Case study of the Hunchun area. Diversity 2025, 17, 336. [Google Scholar] [CrossRef]
- Bolfe, É.L.; Victoria, D.C.; Sano, E.E.; Bayma, G.; Massruhá, S.M.F.S.; Oliveira, A.F. Potential for agricultural expansion in degraded pasture lands in Brazil based on geospatial databases. Land 2024, 13, 200. [Google Scholar] [CrossRef]
- Freitas, I.C.; Alves, M.A.; Pena, A.N.L.; Ferreira, E.A.; Frazão, L.A. Changing the land use from degraded pasture into integrated farming systems enhance soil carbon stocks in the Cerrado biome. Acta Sci. Agron. 2023, 46, e63601. [Google Scholar] [CrossRef]
- Grande, T.O.; Aguiar, L.M.S.; Machado, R.B. Heating a biodiversity hotspot: Connectivity is more important than remaining habitat. Landsc. Ecol. 2020, 35, 639–657. [Google Scholar] [CrossRef]
- Ceballos, G.; Torre, J.A.; Zarza, H.; Huerta, M.; Lazcano-Barrero, M.A.; Barcenas, H.; Cassaigne, I.; Chávez, C.; Carreón, C.; Caso, C.; et al. Jaguar distribution, biological corridors and protected areas in Mexico: From science to public policies. Landscape Ecol. 2021, 36, 3287–3309. [Google Scholar] [CrossRef]
- Silva, J.P.; Alves, G.B.; Ross, J.L.S.; Oliveira, F.; Nascimento, M.A.L.; Felini, M.G.; Manosso, F.C.; Pereira, D.I. The geodiversity of Brazil: Quantification, distribution, and implications for conservation areas. Geoheritage 2021, 13, 75. [Google Scholar] [CrossRef]
- Resende, F.M.; Cimon-Morin, J.; Poulin, M.; Meyer, L.; Joner, D.C.; Loyola, R. The importance of protected areas and indigenous lands in securing ecosystem services and biodiversity in the Cerrado. Ecosyst. Serv. 2021, 49, 101282. [Google Scholar] [CrossRef]


| Matrix Order | Random Index |
|---|---|
| 3 | 0.52 |
| 4 | 0.89 |
| 5 | 1.11 |
| 6 | 1.25 |
| 7 | 1.35 |
| 8 | 1.41 |
| 9 | 1.45 |
| 10 | 1.49 |
| Land Use and Land Cover | Functional Connectivity | Presence/Absence of Conservation Units | Drainage Density | |
|---|---|---|---|---|
| Land use and land cover | 1 | 3 | 7 | 8 |
| Functional connectivity | 1/3 | 1 | 5 | 7 |
| Presence/absence of conservation units | 1/7 | 1/5 | 1 | 2 |
| Drainage density | 1/8 | 1/5 | 1/2 | 1 |
| Criteria | Order of Importance | Weight | Sub-Criteria | Weight | Combined Weight |
|---|---|---|---|---|---|
| Land use and land cover | 1st | 0.58 | Agriculture | 1 | 0.58 |
| Functional connectivity | 2nd | 0.28 | Non-vegetated area | 0.75 | 0.21 |
| Presence/absence of conservation unit | 3rd | 0.08 | Natural vegetation | 0.25 | 0.02 |
| Drainage density | 4th | 0.06 | Water body | 0.01 | 0.0006 |
| National Park | dIIC | dIICconnector | dIICintra | dIICflux | ||||
|---|---|---|---|---|---|---|---|---|
| W | p-Value | W | p-Value | W | p-Value | W | p-Value | |
| Araguaia | 19,841,069 | 0.0242 | 18,982,208 | 1.5 × 10⁻⁵ | 19,099,633 | 0.1404 | 19,834,339 | 0.02637 |
| Lençóis Maranhenses | 6,103,413 | 0.4547 | 6,257,432 | 0.009721 | 6,084,750 | 0.3312 | 6,102,670 | 0.4494 |
| Cavernas do Peruaçu | 745,836 | 0.0436 | 753,373 | 0.00601 | 747,336 | 0.04837 | 749,238 | 0.06722 |
| Sempre Vivas | 5,583,801 | 0.1928 | 5,684,262 | 0.9306 | 5,640,191 | 0.5486 | 5,580,780 | 0.1802 |
| Serra do Cipó | 1,697,709 | 0.1254 | 1,795,463 | 0.5319 | 1,710,410 | 0.2504 | 1,697,818 | 0.1262 |
| Chapada das Mesas | 8,619,933 | 0.0007 | 8,930,303 | 0.03826 | 8,621,465 | 0.0006068 | 8,619,933 | 0.0007397 |
| Grande Sertão Veredas | 4,520,132 | 1.0 × 10⁻¹³ | 494,265 | 1.8 × 10⁻⁶ | 4,159,017 | 2.2 × 10⁻¹⁶ | 452,981 | 2.8 × 10⁻¹⁰ |
| Brasília | 6,103,639 | 2.5 × 10⁻⁵ | 625,416 | 0.01416 | 5,841,984 | 6.6 × 10⁻¹⁰ | 6,110,781 | 3.5 × 10⁻² |
| Chapada dos Guimarães | 350,726 | 0.1452 | 35,491 | 0.1236 | 357,530 | 0.4278 | 350,647 | 0.1431 |
| Emas | 604,985 | 0.5628 | 188,494 | 2.2 × 10⁻¹⁶ | 570,818 | 0.08201 | 603,622 | 0.6268 |
| Serra da Bodoquena | 4,540,018 | 6.0 × 10⁻⁹ | 419,277 | 0.6014 | 4,436,806 | 2.6 × 10⁻¹⁰ | 4,547,414 | 3.0 × 10⁻⁶ |
| Nascentes do rio Parnaíba | 20,800,790 | 2.2 × 10⁻¹⁶ | 22,951,246 | 0.001226 | 21,341,104 | 2.2 × 10⁻¹⁶ | 20,827,769 | 2.2 × 10⁻¹⁶ |
| Serra da Canastra | 2,938,685 | 0.1389 | 29,957,057 | 0.1205 | 29,649,651 | 0.01208 | 29,955,653 | 0.1557 |
| Chapada dos Veadeiros | 25,308,696 | 0.0012 | 25,442,450 | 2.2 × 10⁻¹⁶ | 24,201,660 | 1.0 × 10⁻¹⁵ | 25,327,896 | 0.001623 |
| National Parks | Drainage Density (km km−2) | Classification |
|---|---|---|
| Araguaia | 0.329 | Poor |
| Lençóis Maranhenses | 0.409 | Poor |
| Cavernas do Peruaçu | 0.397 | Poor |
| Sempre-Vivas | 0.713 | Regular |
| Serra do Cipó | 0.803 | Regular |
| Serra das Confusões | 0.327 | Poor |
| Chapada das Mesas | 0.494 | Poor |
| Grande Sertão Veredas | 0.377 | Poor |
| Brasília | 0.397 | Poor |
| Chapada dos Guimarães | 0.735 | Regular |
| Emas | 0.234 | Poor |
| Serra da Bodoquena | 0.404 | Poor |
| Nascentes do Rio Parnaíba | 0.369 | Poor |
| Serra da Canastra | 0.705 | Regular |
| Chapada dos Veadeiros | 0.635 | Regular |
| Priority Level | National Park | Area (%) | Area (ha) | Ranking |
|---|---|---|---|---|
| Very high | Serra da Bodoquena | 88.46 | 159,890 | 1 |
| Emas | 77.68 | 105,785 | 2 | |
| Serra da Canastra | 66.26 | 162,016 | 3 | |
| Brasília | 54.06 | 59,949 | 4 | |
| High | Serra das Confusões | 82.42 | 468,871 | 1 |
| Chapada das Mesas | 74.36 | 176,732 | 2 | |
| Cavernas do Peruaçu | 73.86 | 96,085 | 3 | |
| Nascentes do Rio Parnaíba | 64.88 | 379,018 | 4 | |
| Grande Sertão Veredas | 58.70 | 125,221 | 5 | |
| Sempre-vivas | 57.06 | 77,525 | 6 | |
| Araguaia | 55.28 | 188,867 | 7 | |
| Moderate | Lençóis Maranhenses | 80.33 | 93,322 | 1 |
| Serra do Cipó | 73.89 | 583,780 | 2 | |
| Chapada dos Veadeiros | 67.37 | 213,768 | 3 | |
| Chapada dos Guimarães | 66.26 | 56,400 | 4 |
Disclaimer/Publisher’s Note: The statements, opinions and data contained in all publications are solely those of the individual author(s) and contributor(s) and not of MDPI and/or the editor(s). MDPI and/or the editor(s) disclaim responsibility for any injury to people or property resulting from any ideas, methods, instructions or products referred to in the content. |
© 2025 by the authors. Licensee MDPI, Basel, Switzerland. This article is an open access article distributed under the terms and conditions of the Creative Commons Attribution (CC BY) license (https://creativecommons.org/licenses/by/4.0/).
Share and Cite
Soares, A.C.d.S.; Sano, E.E.; Aquino, F.d.G.; Almeida, T.d. Threats and Opportunities for Biodiversity Conservation and Sustainable Use in the Buffer Zones of National Parks in the Brazilian Cerrado. Sustainability 2025, 17, 6597. https://doi.org/10.3390/su17146597
Soares ACdS, Sano EE, Aquino FdG, Almeida Td. Threats and Opportunities for Biodiversity Conservation and Sustainable Use in the Buffer Zones of National Parks in the Brazilian Cerrado. Sustainability. 2025; 17(14):6597. https://doi.org/10.3390/su17146597
Chicago/Turabian StyleSoares, Ana Cristina da Silva, Edson Eyji Sano, Fabiana de Góis Aquino, and Tati de Almeida. 2025. "Threats and Opportunities for Biodiversity Conservation and Sustainable Use in the Buffer Zones of National Parks in the Brazilian Cerrado" Sustainability 17, no. 14: 6597. https://doi.org/10.3390/su17146597
APA StyleSoares, A. C. d. S., Sano, E. E., Aquino, F. d. G., & Almeida, T. d. (2025). Threats and Opportunities for Biodiversity Conservation and Sustainable Use in the Buffer Zones of National Parks in the Brazilian Cerrado. Sustainability, 17(14), 6597. https://doi.org/10.3390/su17146597