Article

Empirical Investigation of the Motivation and Perceptions of Tourists Visiting Spa Resorts in the Vâlcea Subcarpathians, Romania

by
Amalia Niță
1,* and
Ionuț-Adrian Drăguleasa
2
1
Geography Department, Faculty of Sciences, University of Craiova, 13 A. I. Cuza Street, 200585 Craiova, Romania
2
Doctoral School of Sciences, Faculty of Sciences, University of Craiova, 13 A. I. Cuza Street, 200585 Craiova, Romania
*
Author to whom correspondence should be addressed.
Sustainability 2025, 17(14), 6590; https://doi.org/10.3390/su17146590
Submission received: 18 June 2025 / Revised: 14 July 2025 / Accepted: 16 July 2025 / Published: 18 July 2025

Abstract

The Vâlcea Subcarpathians, known for their wealth of natural resources and their spa tradition, are distinguished by renowned spa resorts such as Băile Olănești, Călimănești, Ocnele Mari and Băile Govora. These destinations provide tourists with a variety of treatment, relaxation, and recreational options. This research aims to explore the factors influencing tourist behavior at spa resorts in the Vâlcea Subcarpathians, Romania. Specifically, the relationships between tourists’ residential environment and frequency of visits, the influence of participation in cultural activities on the average duration of trips, and the impact of information sources and vacation planning methods on why tourists choose to visit spa resorts in the Vâlcea Subcarpathians, Romania, will be examined. As part of this study, a questionnaire was developed to collect relevant data on the perceptions and behaviors of visitors to spa resorts in the Vâlcea Subcarpathians, Romania. To analyze the collected data and test the research hypotheses, the following statistical methods were used: Chi-Square Test, Independent Samples t-Test and Analysis of Variance (ANOVA). The results obtained from the statistical tests largely confirmed the proposed hypotheses. There is a significant relationship between the age range of tourists and the frequency of visits, suggesting that different age groups have distinct visiting behaviors. Also, the perception of service quality varies by the gender of tourists, indicating that men and women have different experiences and expectations.

1. Introduction

1.1. Research Background

From a scientific perspective, the following research gaps can be identified in the background literature: (1) Most studies focus on a single theoretical framework—namely, the Theory of Planned Behavior (TPB) [1]—even though tourists’ intentions to revisit spa resorts are too complex to be fully explained by one theory alone. (2) Incorporating multiple behavioral theories into empirical research could yield a deeper understanding [2] of tourists’ motivations and preferences related to choosing and revisiting spa resorts. (3) Tourism geography research often overlooks important contextual factors—such as cultural and sociopolitical influences [3]—which are essential for the sustainable development of spa resorts and health and wellness centers. (4) Romania and its development regions are underrepresented in sustainable tourism research, as the majority of studies tend to focus on Western destinations [4].
Therefore, investigating tourists’ intentions to revisit spa resorts in the Vâlcea Subcarpathians region of Romania—such as Băile Olănești, Călimănești, Băile Govora, and Ocnele Mari—can provide valuable insights for sustainable tourism development, particularly in terms of promoting and valorizing natural resources such as mineral, thermal, and salt waters.
The structure of this study is as follows: Section 1 presents the purpose and objectives of the research, emphasizing the novelty of the subject. It continues with a review of key contributions concerning the role and importance of spa and health tourism, the profile and motivation of spa tourists, and an overview of the Theory of Planned Behavior (TPB) along with its extension—the Theory of Reasoned Action (TRA). Section 2 presents the literature review. Section 3 details the research methodology, including the study area, data sources, analysis of the research questions, variables, and the formulation of research hypotheses in correlation with the specialized literature. Section 4 discusses the results and provides a detailed analysis.
Finally, Section 5 presents the conclusions, highlighting the study’s contributions, limitations, and potential directions for future research.

1.2. The Existing Problems to Be Solved (Aim and Objectives)

The purpose of this research is to explore in detail the factors that influence tourist behavior in the spa resorts of the Vâlcea Subcarpathians, Romania.
The objectives of the study are as follows: (1) to examine the relationship between tourists’ residential environment and the frequency of their visits; (2) to assess the influence of participation in cultural activities on the average duration of trips; and (3) to analyze the impact of information sources and vacation planning methods on tourists’ decisions to visit the spa resorts of the Vâlcea Subcarpathians.

1.3. The Solution of the Problems

As part of existing problems to be solved, a questionnaire was developed to collect relevant data on the perceptions and behaviors of visitors to spa resorts in the Vâlcea Subcarpathians, Romania. The questionnaire consisted of two sections: the first was dedicated to the collection of sociodemographic data on the tourists, and the second was for the collection of data on the main research objectives. The questionnaire collected several types of data: dichotomous, semantic scale, closed, demographic (sex, age and profession), semi-open and opinion.

1.4. Our Proposed Method and Related Theory

To analyze the collected data and test the research hypotheses, the following statistical methods were used: (1) Chi-Square Test, (2) Independent Samples t-Test and (3) Analysis of Variance (ANOVA). The statistical methods employed in this study offer several advantages for analyzing the collected data and testing the research hypotheses [5]. The Chi-Square Test is particularly effective for identifying associations between categorical variables, providing a simple yet powerful tool for assessing relationships in non-parametric data. The Independent Samples t-Test enables the comparison of means between two distinct groups, making it suitable for detecting significant differences in tourist behaviors across demographics. ANOVA extends this capability by allowing for comparisons among three or more groups, increasing the robustness of the analysis when exploring multiple conditions. Collectively, these methods enhance the study’s capacity to uncover statistically significant patterns and support evidence-based conclusions.
Despite their strengths, these statistical methods also have limitations that must be considered [5]. The Chi-Square Test is sensitive to small sample sizes and may yield misleading results if expected frequencies are too low. The t-test assumes normal distribution and homogeneity of variances between groups; violations of these assumptions can compromise the validity of the results. Similarly, while ANOVA is a powerful tool for comparing group means, it also relies on strict assumptions such as normality and equal variances across groups. Furthermore, ANOVA does not indicate which specific groups differ unless followed by post-hoc tests, adding complexity to the interpretation. These methodological constraints highlight the importance of careful data preparation and the need for supplementary analyses to ensure accurate interpretation.
The use of the Chi-Square Test, Independent Samples t-Test, and ANOVA provided a solid statistical foundation for analyzing relationships, group differences, and patterns within the collected data. While each method brings distinct strengths—such as identifying associations or comparing means—they also require careful attention to assumptions and sample characteristics. Overall, these methods proved effective in supporting the research objectives and drawing meaningful conclusions about tourist behavior in the Vâlcea Subcarpathian spa resorts.

1.4.1. The Role and the Importance of Spa and Health Tourism

The spectacular landscapes, the favorable climate, and the numerous natural resources (mineral waters, thermal waters, salt waters) of Romania have contributed favorably to the national and international recognition of the spa and health destinations in this country [6]. Spa and health resorts play an extremely important role in the identity of the local community [7], in preventive medical care with balneoclimatic cure, in the welfare system and health, first of all, for the local population and secondly, for tourists/visitors of these resorts [8]. On the other hand, they also have an important role in terms of collaboration between stakeholders and various organizations at a global level, for example, the creation of international networks for the exchange of information and personalized experiences for tourists can substantially facilitate the development of spa and health tourism [9].
Specialized studies identify several aspects regarding the importance of spa and health tourism: the increasing importance of medical tourism as a tool for regional and national socio-economic development; the value of sustainable practices in the management of spa and medical tourism, especially in light of climate change and the challenges of conserving and valorizing natural resources [10] and increasing the awareness of tourists/visitors regarding the medical services and medical assistance available in spa resorts and conducting appropriate advertising can contribute to attracting an extremely large number of health tourists [11,12].

1.4.2. The Profile and Motivation of Spa and Health Tourism

Knowing the profiles that determine the choices, desires and preferences of tourists from the Vâlcea Subcarpathians is very important in a highly competitive spa market at regional, national and international levels. Tourists can be well-informed and demanding when choosing a spa resort. In the tourism literature, there has been research analyzing the typical profile of tourists at spa resorts [13,14,15,16,17,18,19]. Unlike other tourist profile research, the study conducted by Dryglas and Różycki (2017) included research variables such as the use of sociodemographic characteristics in health tourism segmentation studies, tourist behavior within spa resorts and psychographic characteristics [20].

1.4.3. Theory of Planned Behavior (TPB)

The most popular theory in the field of tourism is the Theory of Planned Behavior (TPB) founded by Ajzen, as a basic principle it assumes that visiting a destination, in this case we are talking about the spa resorts in the Vâlcea Subcarpathians, requires well-calculated decisions based on observations of tourists and comparisons of expectations with real experiences in the field [21]. According to the author Ajzen (1991), the behavioral intention of tourists or visitors is shaped by the following three psychological aspects on which the TPB Theory is based: (1) attitude towards behavior, (2) subjective norms and (3) perceived behavioral control [22,23]. For example, in the research conducted by Chu and Chu (2013), TPB theory is applicable to predicting population (tourist) behavior, which claims that individuals tend to act by changing their attitude, in this case changing their attitude regarding visiting spa resorts [24]. Ulker-Demirel and Ciftci (2020) stated that TPB theory represents an extension of the Theory of Rational Action (TRA), being one of the most frequently researched prediction models for tourist behavior [25].

1.5. The Innovation of the Proposed Work

The novelty of this study lies primarily in its empirical approach to spa tourism research, integrating both tourism-specific indicators—such as the number of tourists visiting the spa resorts in the Vâlcea Subcarpathians, Romania—and the analysis of natural resources in the area, including relief, climate, hydrography, and protected areas or tourist attractions. Additionally, the study enhances traditional analytical frameworks by incorporating data processing using the Statistical Package for the Social Sciences (SPSS), version 12.0. While the study is informed by behavioral theories such as the Theory of Planned Behavior (TPB) and the Theory of Reasoned Action (TRA), which highlight the complexity of tourist decision-making, the focus here remains on empirical data analysis. By concentrating on the relatively underexplored Vâlcea Subcarpathians region, this research fills a significant gap in sustainable tourism studies and provides practical insights for the valorization and promotion of natural resources, supporting sustainable development in spa tourism.

2. Literature Review

Based on the latest Global Wellness Economy Monitor 2023 (GWI) data report, there are approximately 31,290 hot/mineral spa facilities operating in 130 countries [26]. The COVID-19 pandemic disrupted economic activity across the globe, but hot/mineral spas were among the wellness sectors most severely impacted by this 21st-century epidemic. Border closures, business closures and stay-at-home orders [27,28,29,30,31] decimated business revenue in many regions for much of 2020 and 2021. After a 39% decline globally in 2020, business revenue gradually recovered in 2021 and 2022 (USD 46 billion in 2022, compared to USD 66 billion in 2019) [26]. According to GWI, it is estimated that revenues from thermal/mineral springs will have recovered beyond pre-SARS-CoV-2 levels in 2024 and will reach USD 90 billion by 2027. The thermal/mineral springs industry is concentrated in Asia-Pacific and Europe, which together accounted for 94% of industry revenues and 93% of units in 2022 [26].
In the post-pandemic context, visits to thermal springs, mineral springs and spa resorts are increasingly common, and studies indicate that tourists visiting spa resorts are primarily looking for a better quality of life and, secondly, are fleeing more crowded tourist destinations [32]. Tourism agencies now specialize in health and wellness tourism as part of their medium- and long-term corporate strategy [33]. Thus, according to Medina-Muñoz and Medina-Muñoz (2013), for some spa resorts, health tourism represents a possibility to counteract seasonality and diversify tourism [34]. Also, spa tourism has contributed to the sustainable regional development of rural destinations and cultural heritage [35,36,37,38,39]. A spa resort offers tourists or visitors the following services: accommodation and food, entertainment, relaxation, recreational activities and, last but not least, medical health services [40,41,42].
Researchers have observed that clean water, fresh air and natural landscapes are considered specific environmental elements of a spa destination that provides tourists with the best health and medical care services, and thus, spas are often accompanied by natural and heritage attractions or tourist sites [43,44]. Some spa destinations are endowed with natural resources, such as national parks and reserves or protected areas [45], wildlife habitats, coral reefs and sandy beaches. These have a remarkable potential to offer unforgettable tourism experiences and entertainment while ensuring environmental care [46]. According to Zhang et al. (2015), domestic and foreign tourists are more likely to seek the most modern medical treatments for physical and mental health care that may be based on natural healing phenomena [47]. As a result, a clean natural environment and sustainable tourism are two key aspects in the development of spa resorts [48]. In addition, medical and first aid infrastructure, comfortable transportation to spa resorts, and qualified/professional personnel in the medical and tourism fields can positively promote the development of competitiveness among spa resorts/destinations that provide health and medical care services [49].
Mota et al. (2023) defined thermal resorts as poles of development at a local [50], regional and even national scale, because they generate economic growth for the host population by creating jobs in the spa resorts in the Vâlcea Subcarpathians [51,52]. Thus, spa tourist resorts contribute “to enriching the quality of life of local communities” [53], contributing to a form of sustainable tourism, namely spa tourism.
According to Lopes and Rodríguez-López (2022), in the last two decades, there have been several factors, such as economic, political, and changing tourist trends in choosing spa resorts, that led to the decline of spa resorts, but at the same time, to a decrease in the number of foreign tourists [54]. Even so, the qualification of employees within spa resorts, international certifications, tradition and craftsmanship, natural curative resources, rehabilitation of the infrastructure and equipment of spa and health centers, accommodation, food and curative treatment facilities, development of virtual tour platforms for the sustainable development of spa resorts [55], promotion of digital marketing in health tourism [56] and a lower level of tariffs can represent real opportunities or advantages in the revitalization and growth of this sector in the regional and national economy of Romania. At the same time, there is an increasing concern for changing the way the population takes care of their physical and mental health, and the development of spa, health and wellness tourism in Romania, but also on the European continent, determines the adaptation and reevaluation of the positioning and promotion strategies of spa resorts and health spa centers, by enriching the spa tourism offer with innovative [57], and, on the other hand, sustainable [58] services, to which we can also add participation in international tourism fairs.
According to Godlewska et al. (2023), the most important reason for choosing spa tourism is tourists’ concern for their health [59]; in this setting, they are less anxious about their medical care and feel they can trust the services provided [60,61]. Other motivations for choosing spa tourism may include a desire for pleasure or leisure, a search for spaces with a very low density of visitors, more restricted contact with the environment [62,63,64] and a growing appreciation for body care [65]. In the study conducted by Meng et al. (2023), the research results clearly supported the positive influence of health resorts on the expectations, but also on the behavioral intentions of tourists, these results being based on the two theories, namely: Expectation Confirmation Theory (ECT), and TPB Theory [66].

3. Materials and Methodology

3.1. Study Area

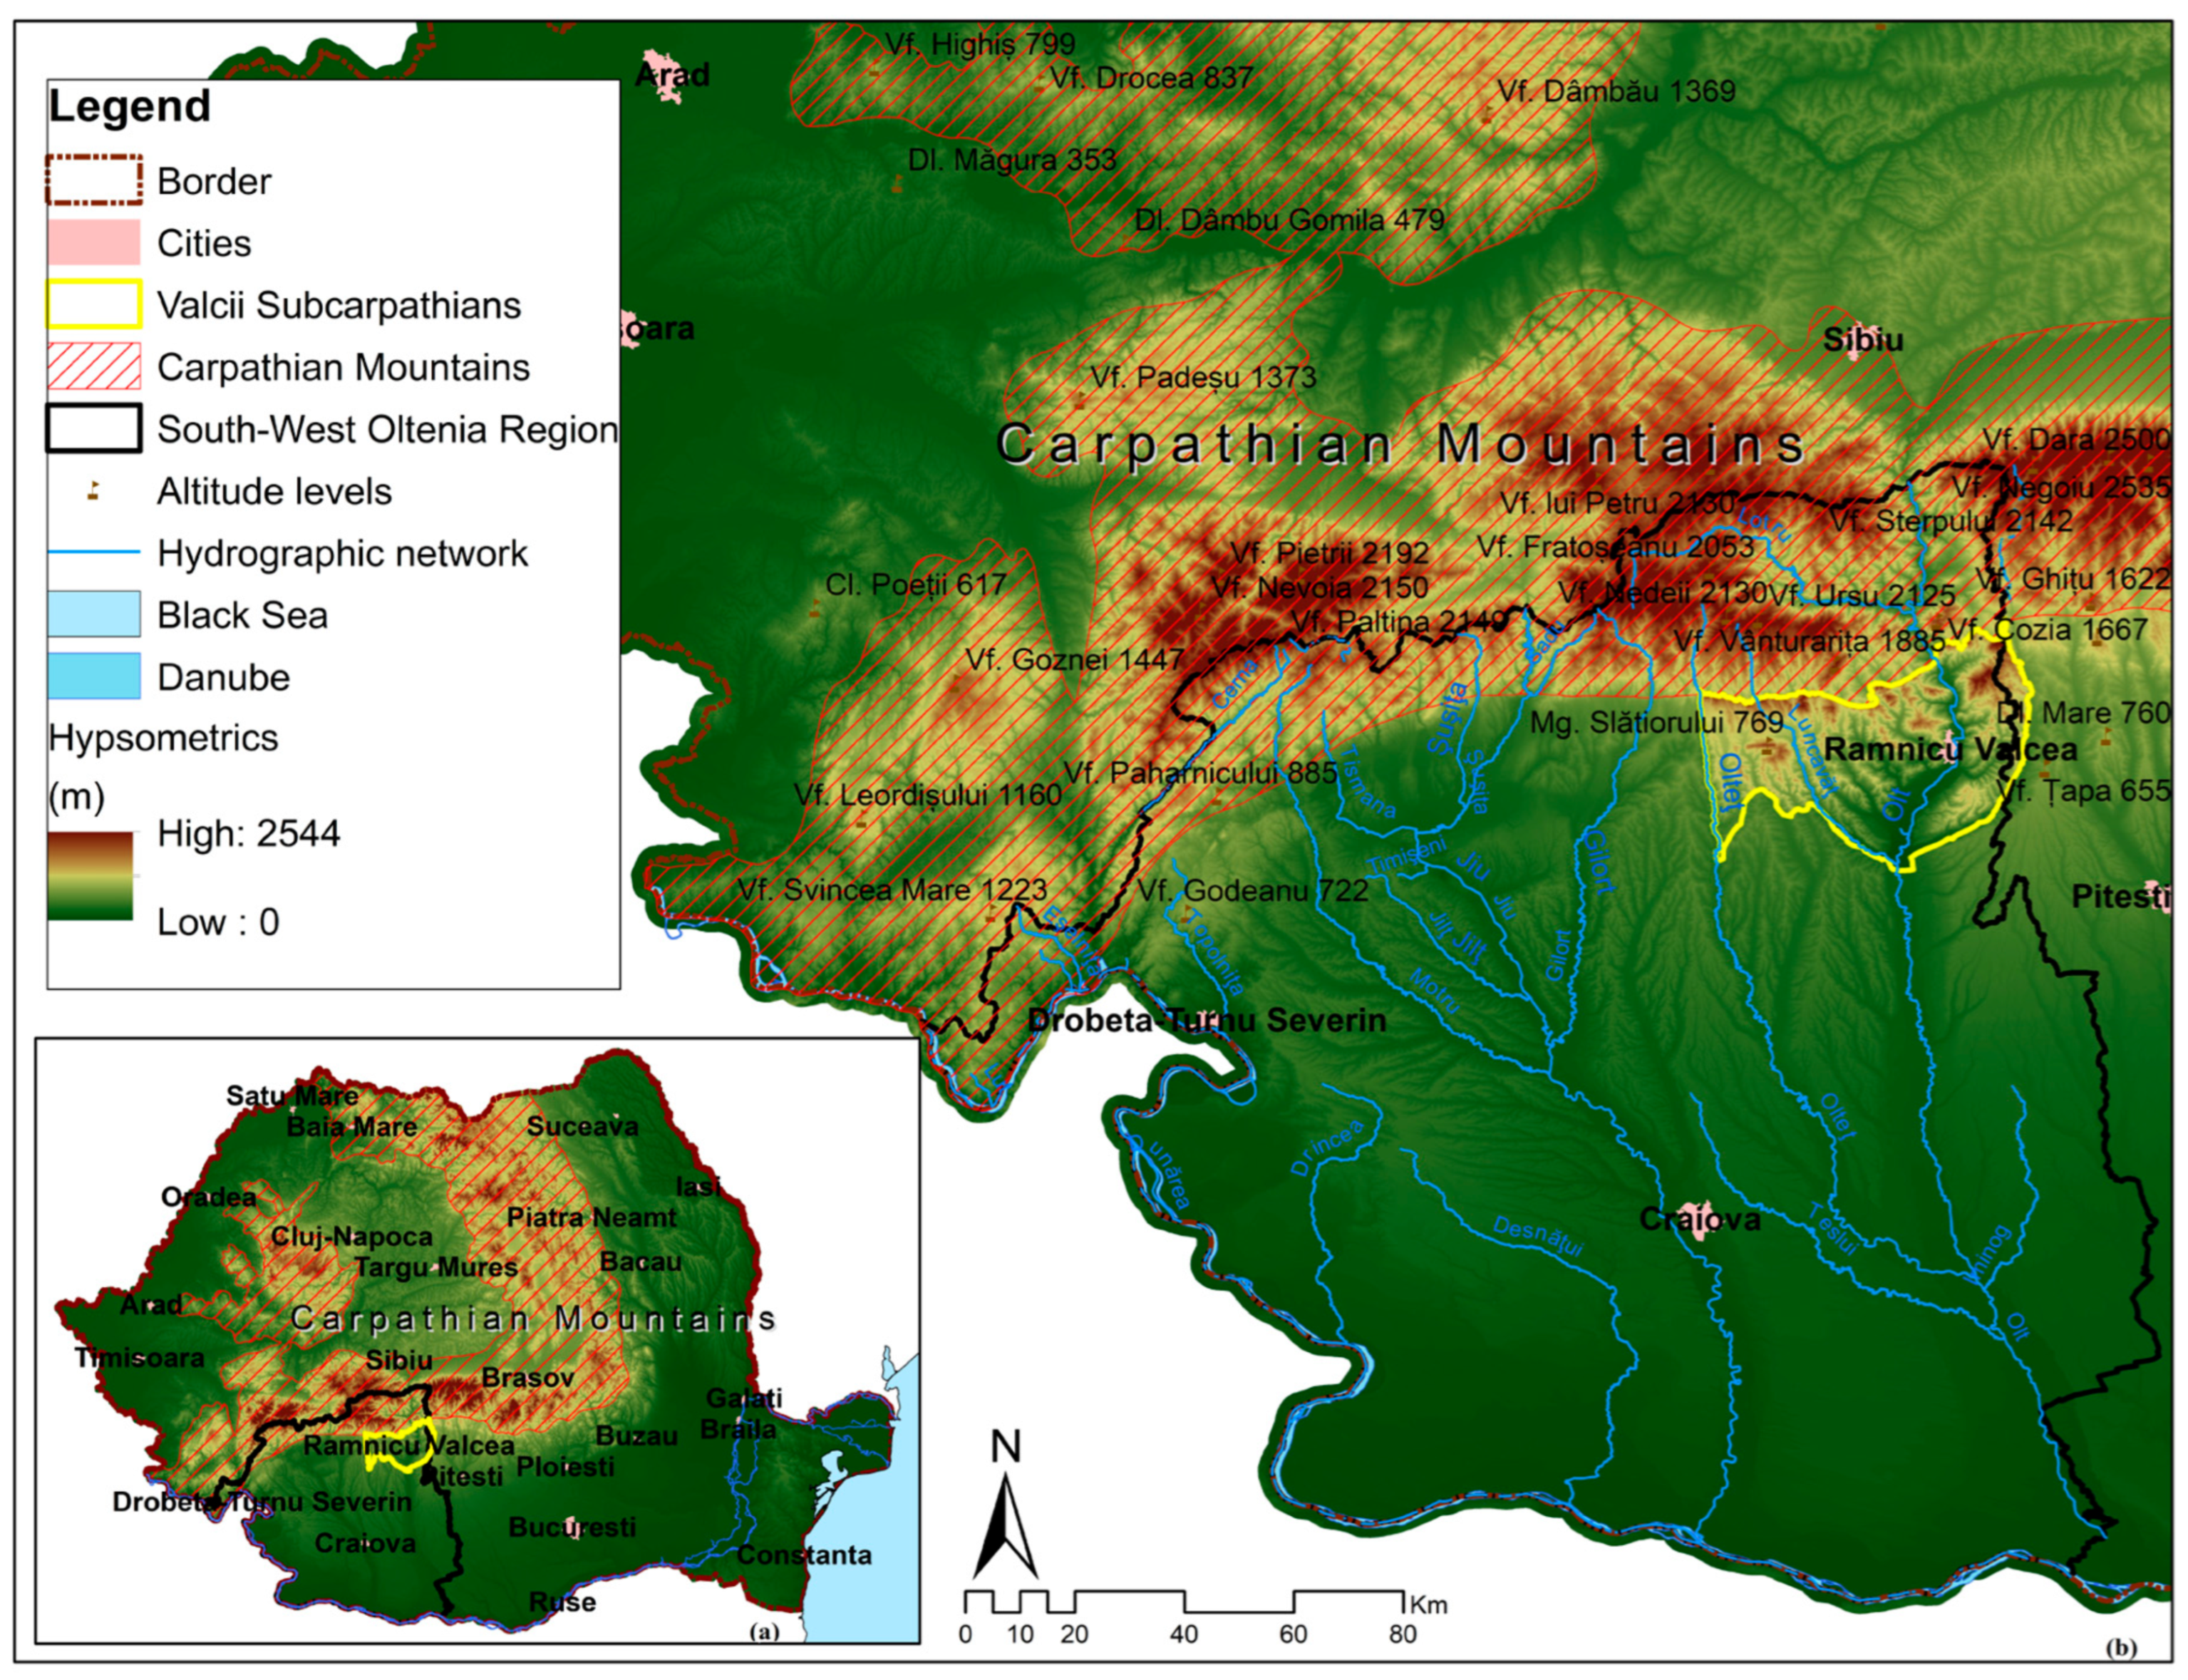
A subdivision of the Getic Subcarpathians, the Vâlcea Subcarpathians are located in the southern part of the country, on both sides of the Olt River, and constitute one of the oldest settlements in Romania. Thus, in Figure 1, the study area is mapped, with the location of the Vâlcea Subcarpathians in regional (Figure 1a and national contexts (Figure 1b. Mentioned in documents written as early as January 1392, in a charter of Mircea the Elder, the Vâlcea study area appears as a relief step between the mountains and the lowlands outside them, being made up of an association of hilly peaks separated by valleys or depressions ([67], p. 51).
According to Roșu (1980) ([68], pp. 389–390), the Vâlcea Subcarpathians are located “between Bistrița Vâlcii and Gilort, corresponding to the area of the subcarpathian folds. They are made up of a single subcarpathian corridor: Hurez-Polovragi-Novaci and a single row of subcarpathian hills: Măgura Slătioarei (267 m), Dealul Grecilor (594 m), Dealul Muierii (561 m), Dealul Cîrligeilor (536 m), Dealul Seciului (597 m). The subcarpathian contact with the Getic Plateau in the south is achieved through a depressional erosion corridor: Matești-Becheni-Zorlești, with the exception of the tectonic Zorlești Depression, which is located at the beginning of the external subcarpathian depressional corridor in the west of Gilort, Cărbunești-Târgu Jiu” [68].
According to Ielenicz et al. (2003) ([69], p. 214), the Vâlcea Subcarpathians “extend from Topolog to Bistrița, east of Olt, under the steeps of the Cozia Mountains, there is a wider Jiblea depression through which connections are made with Țara Loviștei, west of Olt, it continues with several depression basins (the most significant are Muereasca, Olănești, Bărbătești, etc.) in which there are villages specialized in animal husbandry. To the south, where the folded structure on several anticlines and synclines clearly appears, small depressions (Govora, Ocnele Mari) have developed in the soft rocks as a result of differential erosion (especially at the contact with the Getic Plateau)” [69].
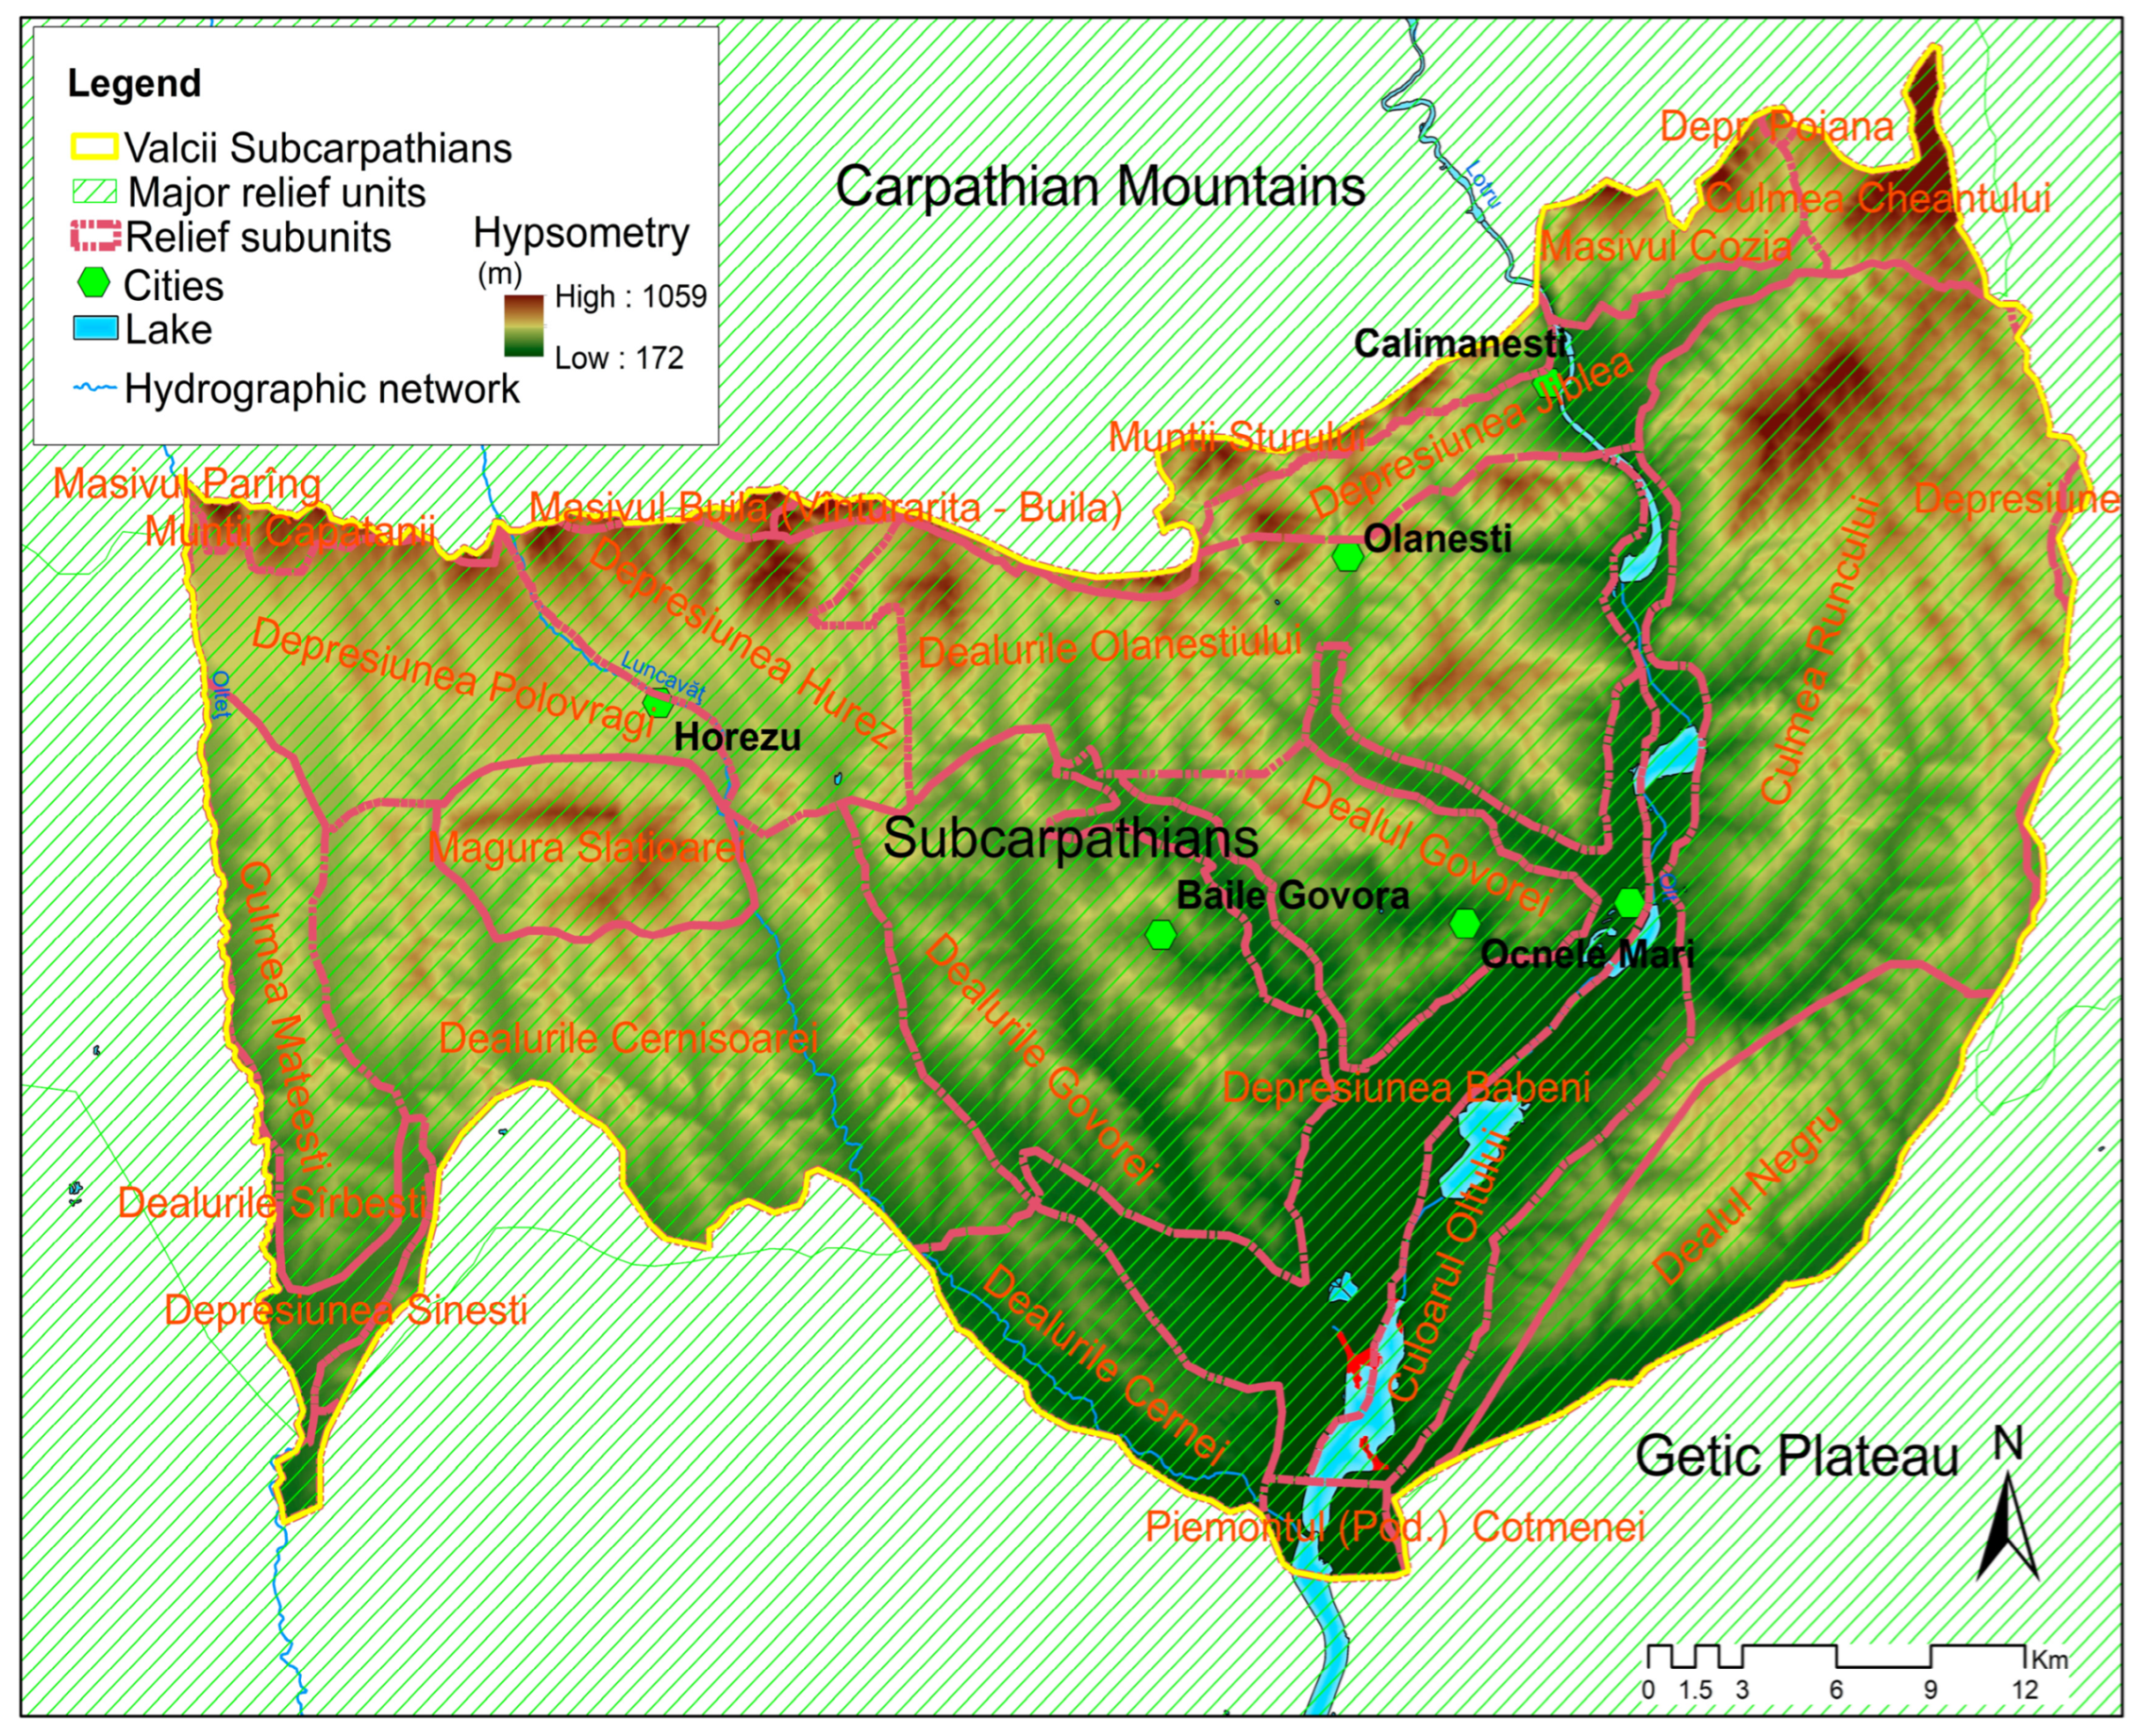
In addition to the specific limits of the natural environment [70], such as relief steps, hypsometry, and hydrographic network (Figure 2), we encounter in the Vâlcea Subcarpathians the anthropogenic limits resulting from the administrative–territorial division (Figure 3), which mainly includes Vâlcea County and a small part of Argeș and Gorj Counties ([67] p. 53). Thus, the study area includes 1 municipality, 7 towns, and 45 communes.
The climate of the Vâlcea Subcarpathians is also greatly influenced by their position, by their location under the shelter of the Southern Carpathians, and implicitly by the forested mountains from which fresh waves of cold air descend in the summer, as well as by the Olt valley, which carries cold, snowy air in the winter. It is also under the influence of the depressions located on both sides of the river, which provide mild shade against both the winter frost and summer heat. Therefore, the area has a temperate continental climate influenced by the difference in the 300–500 m height level in the south and the valley corridors in the north–south direction ([67], p. 69).
The current hydrographic network draining the Vâlcea Subcarpathians belongs to the Olt basin. The rivers in the west are oriented north–south; however, due to a slight tectonic depression, the rivers in the Vâlcea area are diverted to the southeast near the Olt. This inclination is also highlighted by a gradual and general decrease in altitude from west to east.
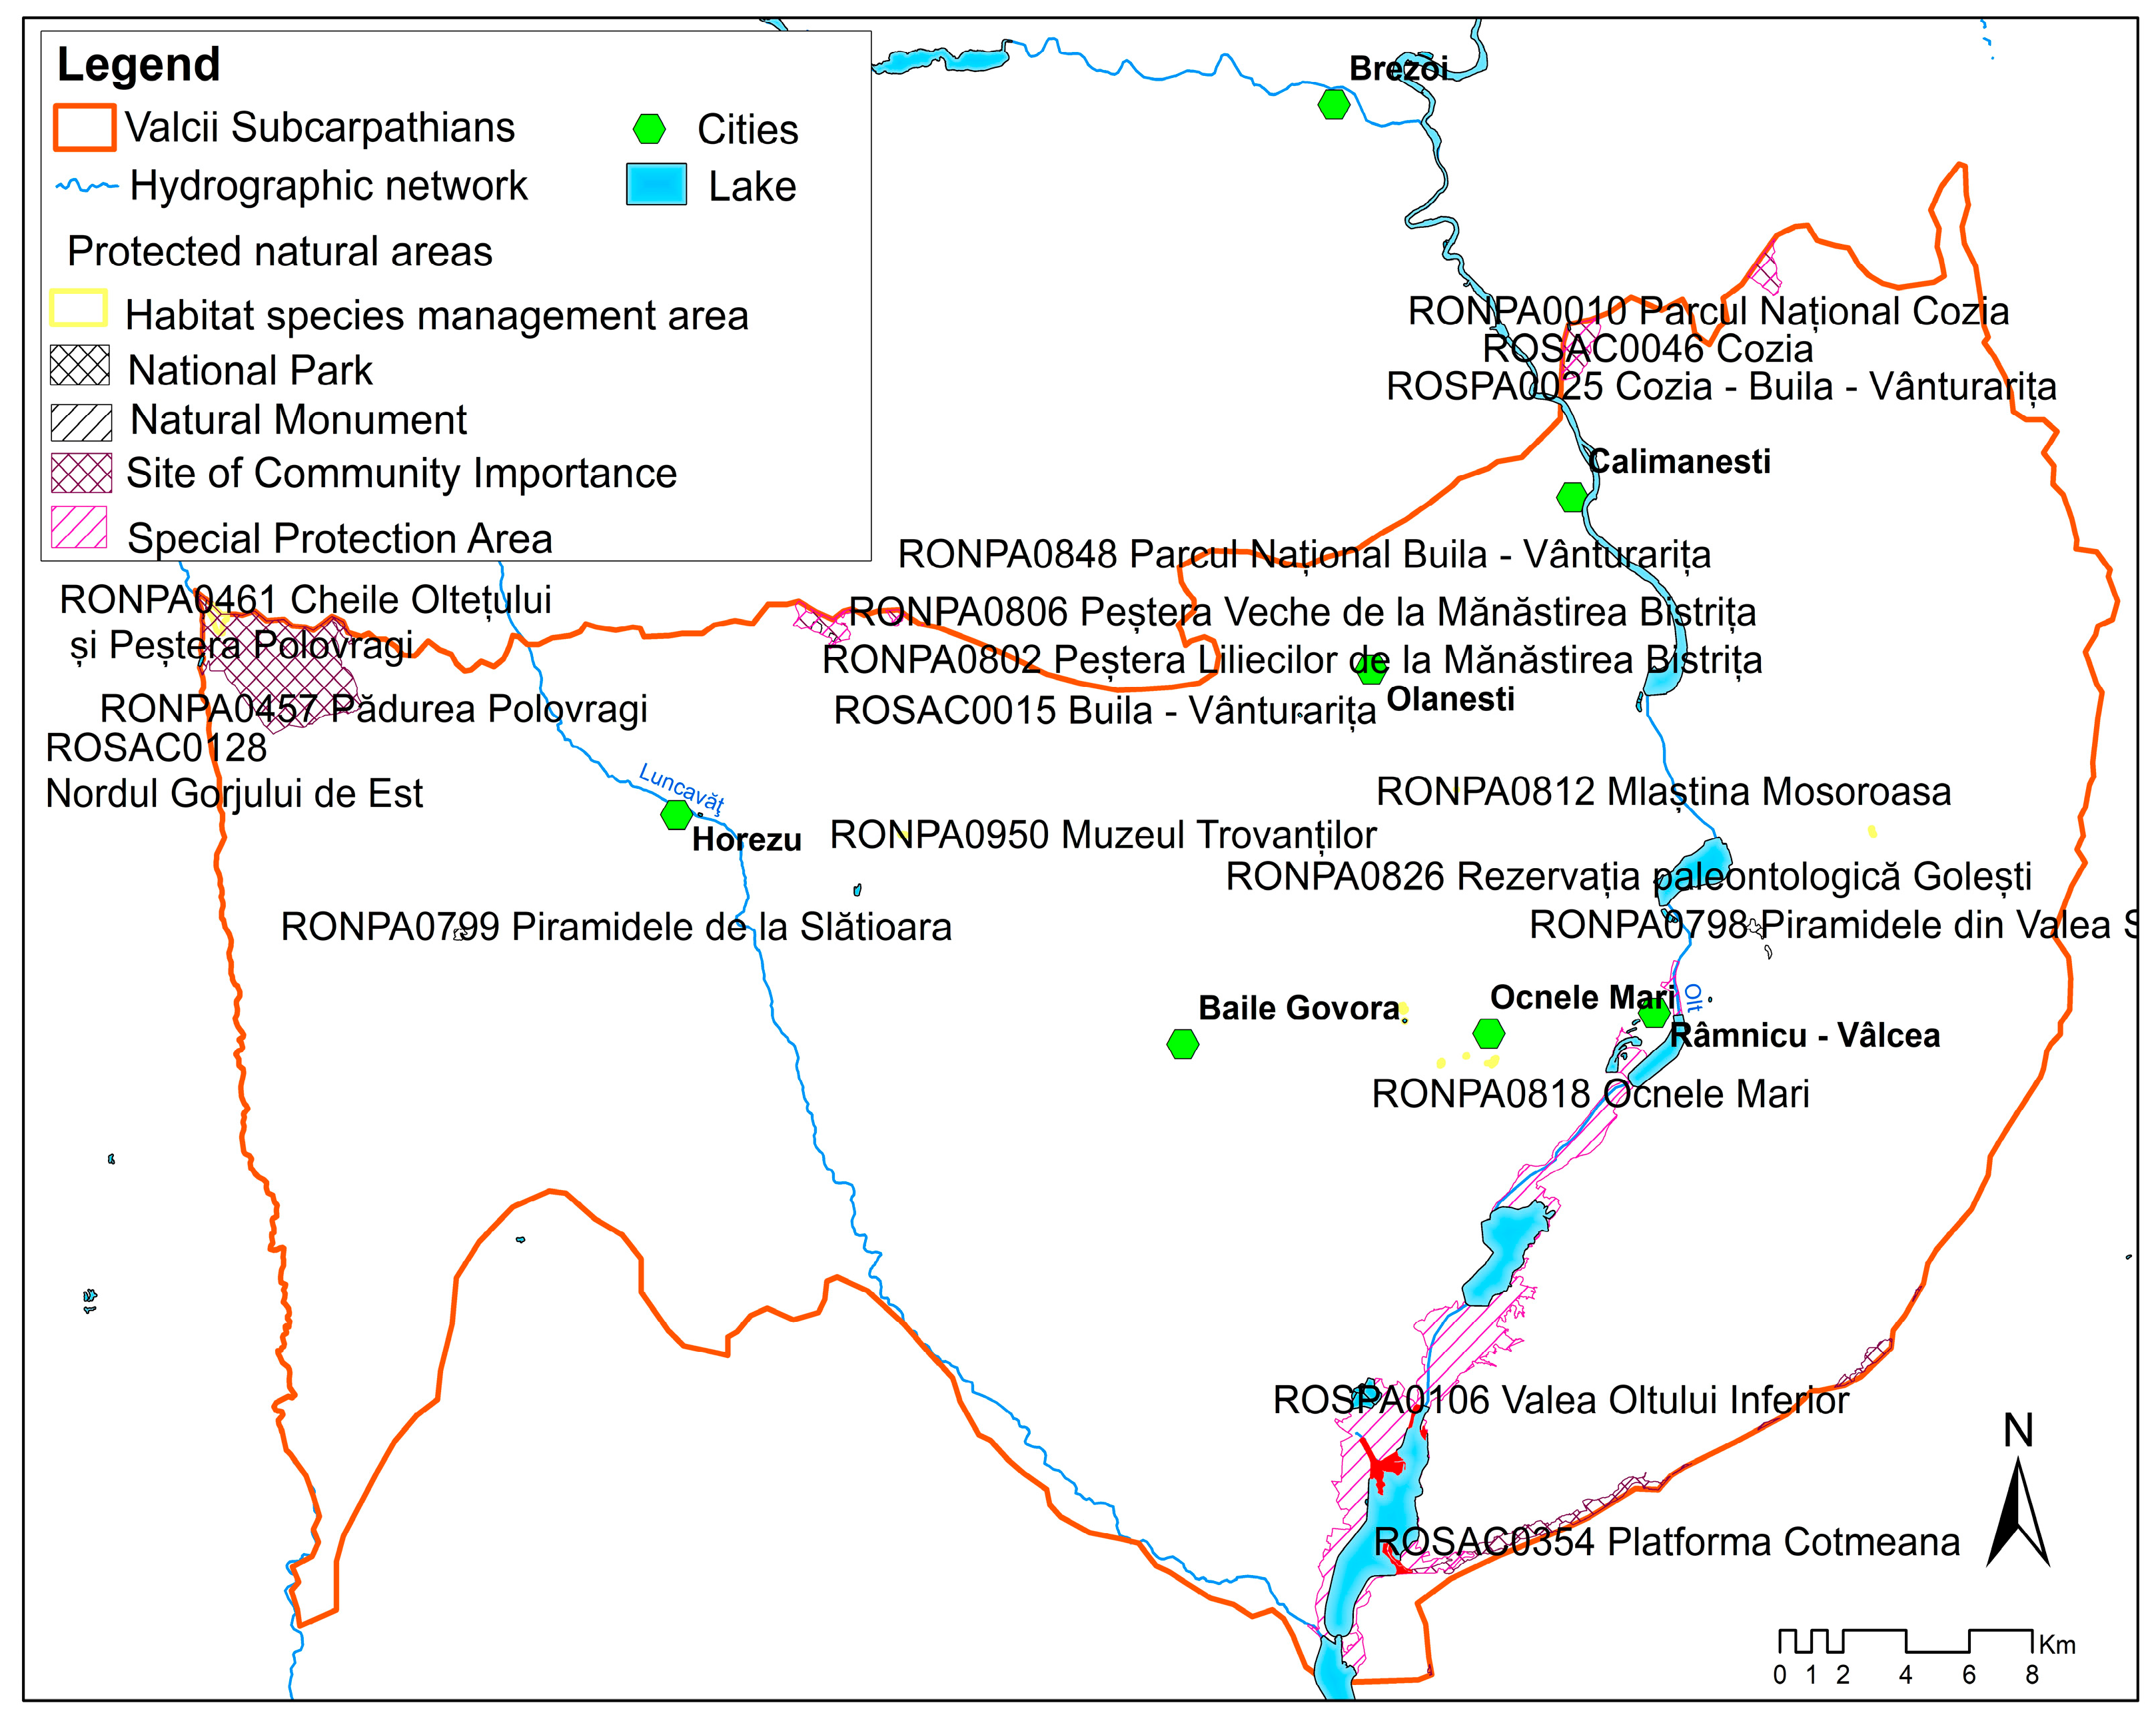
Nature reserves represent a determining point in clarifying the biopedogeographic conditions that characterize the Vâlcea Subcarpathians, constituting a point of attraction for visitors and foreign tourists. These include the Pyramids on Valea Stăncioiului Geomorphological Reserve, the Mosoroasa Swamp Nature Reserve, the Golești Paleontological Reserve, the Trovanții from Costești, Cozia National Park, Buila-Vânturarița National Park, Olteț Gorges, Ocnele Mari Reserve, Liliecilor Cave, etc. (Figure 4).
Enhancing tourist attractions, i.e., protected areas/natural reserves in the Vâlcea Subcarpathians (Figure 4), would increase interest in spa tourism, rural tourism, agrotourism, ecotourism, and geotourism, and offer an opportunity for economic activity through the development of new jobs, thus decreasing unemployment in the study area.
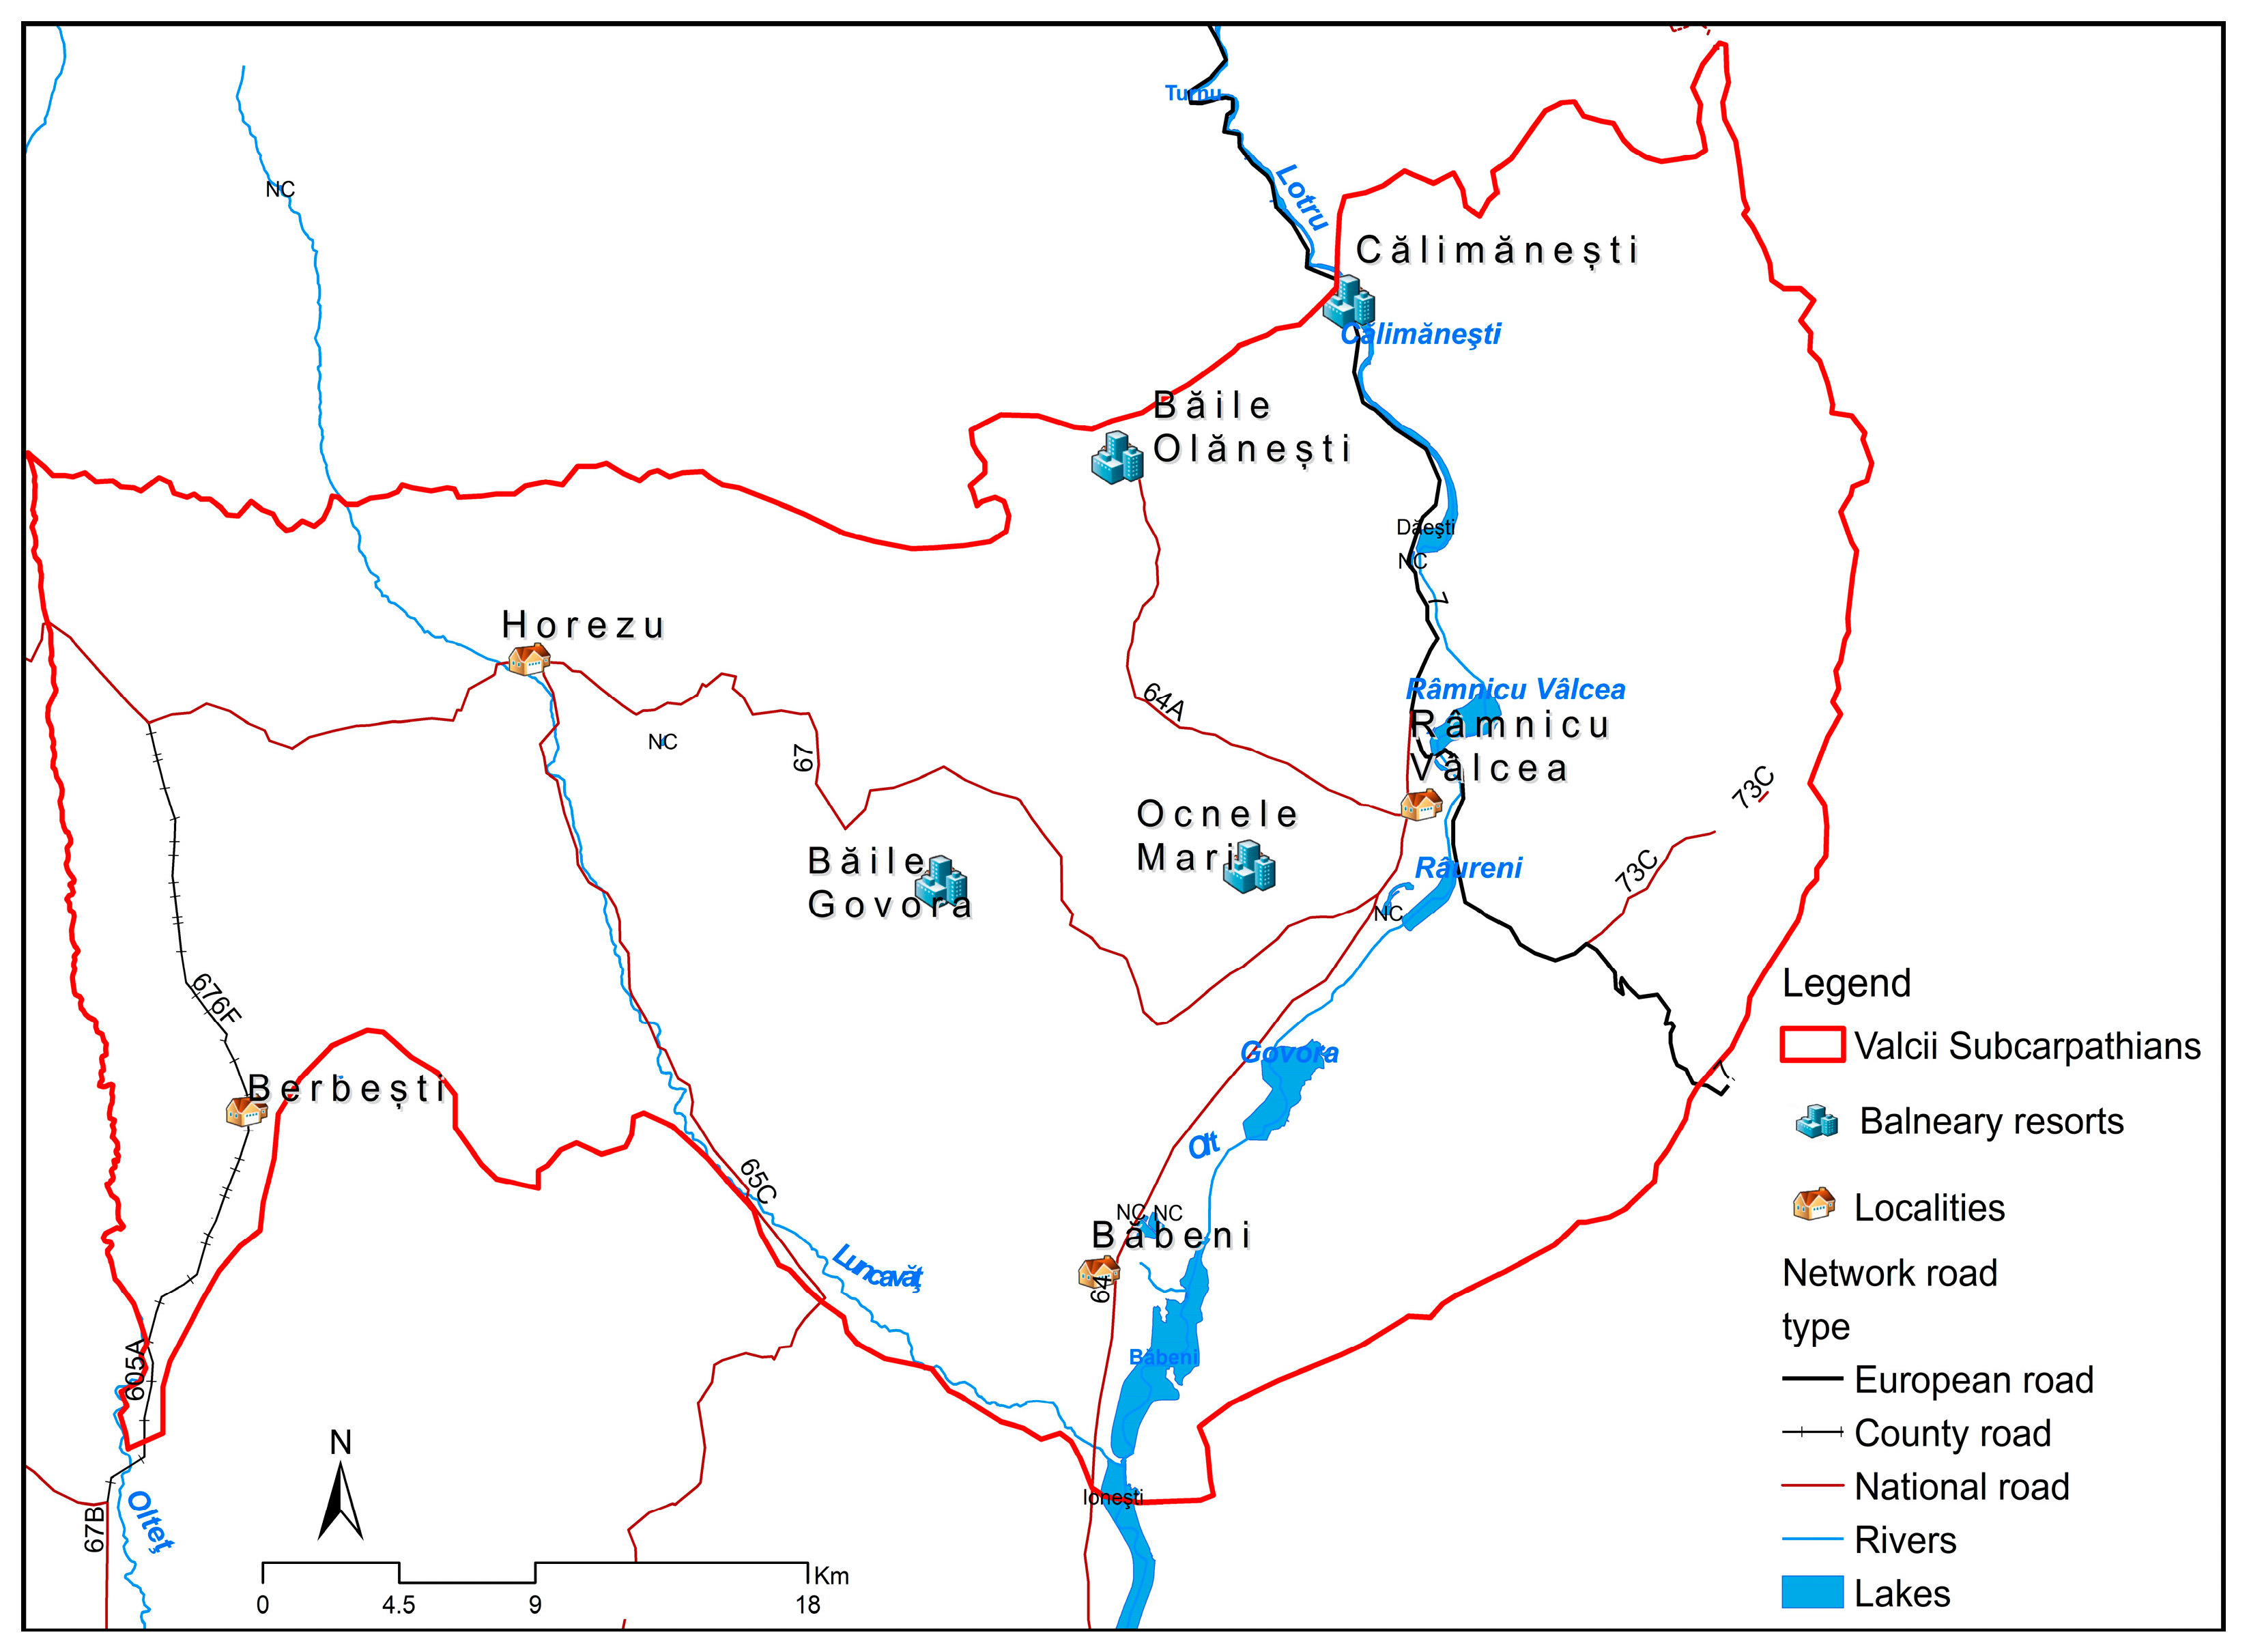
The spa resorts included in the research are shown in Figure 5: Băile Olănești, Călimănești, Băile Govora, and Ocnele Mari.
Analyzing statistical data from the National Institute of Statistics (NIS) for 2020–2024 [71], we observe increases in the number of tourists arriving at the spa resorts in the Vâlcea Subcarpathians (Figure 6). Thus, despite the pandemic caused by SARS-CoV-2 (COVID-19), tourists chose in quite large numbers to spend their holidays at these spa resorts, and at the same time, to benefit from health care treatments that were considered to be possible prevention against COVID-19.
The Călimănești spa resort recorded 107,120 tourists in 2020, followed by an upward trend in subsequent years, reaching 280,697 tourists in 2024—more than double the initial figure (Figure 6). A similar trend can be observed at the Băile Olănești resort, which registered 32,161 tourists in 2020; by 2024, this number had more than doubled, exceeding 69,000 visitors. Among the four spa resorts in the Vâlcea Subcarpathians, Ocnele Mari reported the lowest total number of tourists during the 2020–2024 period, with only 29,067 visitors.

3.2. Data Sources

To locate the study area, the specific boundaries of the natural environment: relief units and subunits, hypsometry, hydrography, spa resorts and reserves/protected areas in the Vâlcea Subcarpathians, the authors used the Geographic Information System (GIS) which allowed them to process, store, manipulate, analyze and visualize the data, and in the final phase they produced physical-geographic maps based on this data.
A questionnaire was used to assess the motivation of tourists visiting spa resorts in the Vâlcea Subcarpathians.
To ensure the survey data were accurate and reliable, the respondents recruited for this research were all Vâlcea Subcarpathian tourists. The questionnaire consisted of two sections: the first was dedicated to the collection of sociodemographic data on the tourists, and the second was for the collection of data on the main research objectives. The questionnaire collected several types of data: dichotomous, semantic scale, closed, demographic (sex, age and profession), semi-open and opinion.
The data collection phase took place between February and June 2024. The data were collected by administering the questionnaire through social media networks. In total, 556 questionnaires were completed, and 522 valid questionnaires remained after cleaning up the data. The selected sample size was considered statistically adequate to produce reliable results and to rigorously evaluate the associations among the study variables. Random sampling was employed to mitigate selection bias, thereby enhancing the objectivity and representativeness of the collected data. The following preamble was included in the questionnaire: “All data collected are confidential and will be used strictly for academic purposes.”
The data cleaning process involved removing questionnaires that were partially completed, contained inconsistent or uniform responses (indicating low engagement) or were submitted by individuals not belonging to the target population (e.g., those under the age of 18). All tourists were invited to participate voluntarily, and only adults (18 years and older) were included in the final sample.
The data were organized and presented using Microsoft Office 2010, facilitating the creation of the tables and graphs necessary to clearly illustrate the results. To analyze the data collected and test the hypotheses formulated in this research, the following statistical methods were used: Chi-Square Test, Independent Samples t-Test, and Analysis of Variance (ANOVA). These methods are described in detail below, along with the associated formulas and relevant bibliographic sources.

3.2.1. Chi-Square Test

The Chi-Square Test is used to test the association between two nominal or ordinal variables, and is an essential tool in the analysis of categorical data. In the present research, this test was applied to analyze the relationships between variables such as frequency of visits and perception of main attractions [72].
The formula for the Chi-Square test is [73]:
X 2 = ( O i E i ) 2 E i
where
O i represents the observed frequencies;
E i represents the expected frequencies calculated based on the assumption of independence [74].
The Chi-square test assesses whether the distribution of responses to one variable is independent of the distribution of responses to the other variable. A significant Chi-square test indicates an association between the two variables, suggesting that the distributions are not independent [75].

3.2.2. Independent Samples t-Test

The Independent Samples t-Test is a statistical method used to determine whether there is a significant difference between the means of two independent groups. This test is useful in situations where we want to compare two sets of data to see if the observed differences are due to chance or if they are statistically significant.
The test assumes that the data from both groups are normally distributed and that the variances of the two groups are equal. The test compares the means of two groups to see if the difference between them is large enough not to be attributed to chance [76,77,78].
The basic formula for calculating the t-value of independent samples is [79]:
t = X 1 X 2 s 1 2 n 1 s 2 2 n 2
where
X 1 and X 2 are the means of the two groups;
s 1 2 and s 2 2 are the sample variances;
n 1 and  n 2 are the sample sizes.
To determine whether the values of the variable have equal variances or not, the Levene test can be used. If the variances are not equal, an adjusted variant of the t-test known as the Welch’s t-test is used.

3.2.3. Analysis of Variance (ANOVA)

Analysis of Variance (ANOVA) is a statistical technique used to compare the means of three or more groups to see if there are significant differences between them. ANOVA is essential in statistical analyses involving multiple groups, providing a robust method for assessing variability and identifying factors that may influence the results [80,81].
ANOVA tests the null hypothesis that all groups have equal means. If the null hypothesis is rejected, it is concluded that at least one of the groups has a different mean from the others. ANOVA can be used in a variety of contexts, such as controlled experiments, observational studies and market research.
The basic formula for one-way ANOVA is [82]:
F = ( M e a n   S q u a r e   B e t w e e n M S B ) ( M e a n   S q u a r e   W i t h i n M S W )
where
MSB is the mean of squares between groups, calculated as the sum of squares between groups (SSB) divided by the degrees of freedom between groups ( d f b e t w e e n );
MSW is the mean of squares within groups, calculated as the sum of squares within groups (SSW) divided by the degrees of freedom within groups ( d f w i t h i n ).

3.3. Analyzing Research Questions and Formulating Research Hypotheses

The formulation of hypotheses is based on the literature and previous observations, providing a theoretical framework to guide subsequent statistical analysis.
This approach aims to establish a clear link between the research questions and the hypotheses tested, thus ensuring their validity and relevance. Each hypothesis is developed in the specific context of spa resorts, taking into account the particularities and preferences of tourists, as well as the factors that may influence their behavior. Thus, a deeper understanding of the phenomena investigated is facilitated, and the necessary foundation is provided for the interpretation of the results obtained in the research.
RQ1: How does the age range of tourists influence the frequency of visits to the spa resorts of the Vâlcea Subcarpathians?
Previous studies suggest that different age groups have distinct tourist behaviors. For example, young people may have a higher frequency of visits due to greater flexibility and availability of free time, while older people may prefer less frequent but longer visits. Pearce (1988) highlighted that age is a significant factor in tourist behavior, with young people tending to travel more frequently for recreation, and older people seeking more relaxing and longer experiences [83]. These observations led to the formulation of the hypothesis that the age of tourists influences the frequency of visits.
H1. 
There is a significant relationship between the age of tourists and the frequency of visits to the spa resorts in the Vâlcea Subcarpathians.
This hypothesis is adapted from the research of Pearce (1988), which uses scales to measure tourist behavior according to age [83]. Pearce developed a hierarchical model of tourist needs that shows that tourist motivations and behaviors evolve with age and experience.
This reasoning is based on the idea that demographic variables, such as age, significantly influence tourist behaviors and preferences, thus justifying hypothesis H1.
The formulation of hypotheses is based on the literature and previous observations, providing a theoretical framework to guide subsequent statistical analysis.
This approach aims to establish a clear link between the research questions and the hypotheses tested, thus ensuring their validity and relevance. Each hypothesis is developed in the specific context of the spa resorts, taking into account the particularities and preferences of tourists, as well as the factors that may influence their behavior. Thus, a deeper understanding of the phenomena investigated is facilitated, and the necessary foundation is provided for the interpretation of the results obtained in the research.
RQ2: Are there significant differences in the perception of service quality at the spa resorts of the Vâlcea Subcarpathians between men and women?
The specialized literature indicates that there are differences in perception between men and women regarding the quality of tourist services. Women may pay more attention to details related to cleanliness and comfort. Mattila (1999) highlighted these differences, emphasizing that the gender of tourists influences the perception of service quality [84]. These observations led to the formulation of the hypothesis that the gender of tourists influences the perception of service quality.
H2. 
The perception of service quality at spa resorts differs significantly according to the gender of tourists.
The hypothesis is inspired by validated scales measuring service satisfaction, such as SERVQUAL [85], adapted to include the gender variable. SERVQUAL is a recognized tool for assessing service quality by measuring five main dimensions: tangibility, reliability, responsiveness, assurance and empathy. The application of this gender-adapted model allows for a detailed analysis of how men’s and women’s perceptions of service quality may differ, thus justifying hypothesis H2.
This hypothesis is based on the idea that demographic variables, such as gender, can significantly influence the way in which tourism services are perceived, thus providing a solid theoretical framework for the statistical analysis.
RQ3: How does the level of education of tourists influence the information sources used to plan visits to the spa resorts of the Vâlcea Subcarpathians?
Studies show that tourists with a higher level of education tend to use more diverse and reliable information sources, such as academic articles or detailed online reviews. These tourists are more likely to seek out information from multiple sources to plan their trips, which represents more sophisticated information behavior [86]. Existing observations and research emphasize the importance of the level of education in determining the information behavior of tourists, suggesting that they adopt different information search strategies depending on their education.
H3. 
The level of education of tourists significantly influences the information sources used to plan visits to spa resorts.
The hypothesis is formulated based on research investigating information behavior in tourism, using validated scales measuring information sources [87]. Studies by Buhalis and Law have demonstrated that tourists with a higher level of education are more inclined to use complex and varied information sources to plan their trips. This is due to their ability to evaluate and critically analyze the available information, ensuring that it is reliable and relevant to their specific needs.
This hypothesis emphasizes the importance of the level of education in shaping tourists’ information behavior and suggests that education may play a crucial role in how they access and use information to plan their visits to spa resorts in the Vâlcea Subcarpathians.
RQ4: How is the labor market status of tourists associated with the average duration of trips to the Vâlcea Subcarpathian spa resorts?
People with different labor market status (e.g., employees vs. retirees) have different patterns of tourism behavior. Employees may make shorter trips due to time constraints, while retirees with more free time may book longer trips. Studies by Oppermann (1995) have shown that there is a significant correlation between labor market status and tourism behavior, highlighting that professional status influences the duration and frequency of trips [88].
H4. 
Tourists’ labor market status is associated with the average duration of trips to the spa resorts of the Vâlcea Subcarpathians.
The hypothesis is based on studies of travel behavior related to labor market status [88], adapted to the spa context. Oppermann demonstrated that people with different labor market statuses, such as employees and retirees, show significant differences in their travel behavior. Employees, due to constraints related to their job and work schedule, tend to plan shorter and more frequent trips compared to retirees, who have more free time and can opt for longer stays.
These observations were measured using validated scales to assess the duration and frequency of trips according to the professional status of tourists. Oppermann’s research has highlighted the importance of understanding how professional status influences tourist preferences and behaviors, thus providing a theoretical framework to investigate these differences in the context of spa resorts in the Vâlcea Subcarpathians.
RQ5: How does the frequency of visits to spa resorts vary depending on the residential environment of tourists in the Vâlcea Subcarpathians?
Studies and observations in tourism suggest that the residential environment (urban or rural) of tourists can influence the frequency of visits to spa resorts. Tourists from urban areas may tend to visit spa resorts more frequently due to greater accessibility and a desire to escape the crowded urban environment. In contrast, tourists from rural areas may have other priorities or constraints that influence their frequency of visits.
H5. 
There is a significant difference between the area of residence of tourists and the frequency of visits to spa resorts.
People from urban and rural areas have different patterns of tourist behavior. Urban residents may visit spa resorts more frequently due to easier access to information and greater financial resources, while rural residents may make less frequent visits due to financial constraints and limited access.
A study by Smith and Puczkó (2009) highlights the fact that the area of residence influences the frequency of travel [89]. These authors demonstrated that urban residents are more likely to travel frequently for recreation and relaxation, due to the stress associated with urban life and easier access to tourist infrastructure [89]. In contrast, rural residents may have economic and access constraints that limit the frequency of their travel.
This hypothesis is based on studies of travel behavior related to the environment of residence [89], adapted to the spa context. These studies used validated scales to measure the frequency of travel according to the environment of residence of tourists, highlighting the significant influence of this factor on tourist behavior.
RQ6: Are there differences in the frequency of visits to the spa resorts in the Vâlcea Subcarpathians between tourists who have previously visited and those who are visiting for the first time?
The literature indicates that previous visiting experience can influence tourist behavior and the frequency of visits. Tourists who have previously visited spa resorts may be more inclined to visit them again, due to satisfaction and familiarity with the services offered.
H6. 
There is a significant difference in the frequency of visits to the spa resorts in the Vâlcea Subcarpathians between tourists who have previously visited these resorts and those who are visiting them for the first time.
Tourists who have previously visited spa resorts are more likely to return due to familiarity with the location and satisfaction with previous visits. On the other hand, tourists who are visiting for the first time may have a lower frequency of visits due to a lack of knowledge and experience.
A study by Kozak (2001) highlighted the fact that previous experience influences the decision to return [90]. Kozak emphasized that tourists satisfied with previous visits tend to repeat the experience, while those who have not visited the destination before are influenced by perceptions and recommendations.
The hypothesis is based on studies of travel behavior related to previous experience [90], adapted to the spa context. These studies used validated scales to measure visit frequency and highlighted the significant impact of previous experience on the decision to return to the same tourist destination.
RQ7: How does the residential environment of tourists influence why they choose to visit the Vâlcea Subcarpathians?
The specialist literature and previous studies show that the residential environment (urban or rural) can influence tourist behaviors and motivations.
For example, tourists from urban areas may be motivated to visit the Subcarpathians to escape the city crowds and enjoy the tranquility and natural beauty of the spa resorts.
On the other hand, tourists from rural areas could be attracted by the modern facilities and the diversified tourist services available in these resorts.
H7. 
Tourists’ residential environment influences their reasons for choosing to visit the Vâlcea Subcarpathians.
Urban and rural tourists may have different reasons for visiting the spa resorts in the Vâlcea Subcarpathians. For example, urban tourists may seek relaxation and escape from the hustle and bustle of the city, while rural tourists may be more interested in spa treatments and recovery.
A study by Bieger and Laesser (2002) highlighted that the residential environment influences tourist preferences and behaviors [91].
The hypothesis is based on studies of tourist behavior related to residential environment [91], adapted for the spa context. These studies used validated scales to measure travel motives according to tourists’ residential environment.
RQ8: Is there an association between the frequency of visits to spa resorts and participation in cultural activities?
Studies indicate that participation in cultural activities can increase the frequency of visits because they add value to the tourist experience. These observations have led to the hypothesis that the frequency of visits is associated with participation in cultural activities.
H8. 
The frequency of visits to spa resorts in the Vâlcea Subcarpathians is associated with participation in cultural activities.
Studies indicate that participation in cultural activities can increase the frequency of visits, as they add value to the tourist experience. Richards (1996) emphasized that cultural activities are an important factor in attracting tourists and improving their satisfaction [92]. Cultural activities can diversify the tourist offerings and create additional reasons for repeat visits, thus contributing to a higher frequency of visits.
The hypothesis is based on research measuring the impact of cultural activities on travel behavior, using validated scales [93]. This research has demonstrated that involvement in cultural activities is associated with more active tourist behavior and with an increased frequency of visits.
RQ9: How does the average travel time in spa resorts vary depending on the means of transport used?
The means of transport can influence the duration of trips. For example, tourists who use public transport may have shorter trips compared to those who use private transport. These observations led to the hypothesis that the average travel time differs depending on the means of transport used.
H9. 
The average duration of trips to the spa resorts in the Vâlcea Subcarpathians differs significantly depending on the means of transport used.
The means of transport can influence the duration of trips. For example, tourists using public transport may have shorter trips compared to those using private transport. Lohmann and Duval (2011) highlighted that the accessibility and comfort of the means of transport can determine the length of stay of tourists at the destination [94]. Private transport, such as personal cars, can offer more flexibility and comfort, encouraging longer stays, while public transport, which may have constraints related to schedule and comfort, can lead to shorter stays.
The hypothesis is formulated based on research on the impact of means of transport on tourist behavior [94]. This research used validated scales to assess the influence of means of transport on the duration and frequency of trips, highlighting significant differences determined by the type of transport used.
RQ10: How do the information sources used influence why tourists choose to visit the Vâlcea Subcarpathians?
Information sources play a crucial role in the decision-making process of tourists. Various studies show that information accessed via the Internet, recommendations from friends and family, tourist guides and advertising materials can significantly influence tourists’ choice to visit certain destinations. For example, tourists who use online information sources, such as reviews and travel blogs, may be motivated by aspects such as innovation and the unique experiences offered by Vâlcea Subcarpathians. On the other hand, those who rely on personal recommendations or traditional guides may seek relaxation and comfort.
H10. 
The information sources used influence why tourists choose to visit the Vâlcea Subcarpathians.
The information sources used by tourists may play a crucial role in determining why they choose to visit the Vâlcea Subcarpathians. For example, tourists who use travel guides or specialized websites may be motivated by an interest in cultural activities and tourist attractions, while those who rely on personal recommendations may seek more relaxation and spa treatments.
Studies conducted by Gursoy and McCleary (2004) have shown that there is a significant correlation between information sources and travel decisions, highlighting that the type of information accessed influences tourist decisions and preferences [95].
This hypothesis is based on studies of tourist behavior related to information sources used [95], adapted for the spa context. These studies used validated scales to measure travel motives based on the information sources accessed by tourists.
RQ11: How does the method of vacation planning influence the reasons why tourists choose to visit the Vâlcea Subcarpathians?
The method of vacation planning (self-guided or through travel agencies) can significantly influence why tourists choose to visit a particular destination. Studies show that tourists who plan their vacations on their own tend to be more adventurous and seek personalized experiences, while those who use travel agencies may prefer convenience and all-inclusive packages.
In the Vâlcea Subcarpathians, these differences in planning methods may reflect varied reasons for visiting, from the desire to explore local nature and culture to the search for spa treatments and well-organized relaxation services.
H11. 
The vacation planning method influences why tourists choose to visit the Vâlcea Subcarpathians.
The vacation planning method can significantly influence why tourists choose to visit the Vâlcea Subcarpathians. For example, tourists who plan their vacations through travel agencies may be more oriented towards comfort and all-inclusive facilities, while those who plan on their own might be motivated by exploration and adventure.
Studies by Seabra et al. (2007) have demonstrated that there is a correlation between the vacation planning method and travel motives [96]. They showed that tourists who use travel agencies tend to seek security and comfort, while independent tourists are often motivated by the freedom and flexibility of their own planning.
This hypothesis is based on research related to tourist behavior and vacation planning methods [96], adapted for the spa context. These studies used validated scales to measure travel motives according to the vacation planning method.
RQ12: How does the reason for visiting influence the frequency of visits to spa resorts in the Vâlcea Subcarpathians?
The reason for visiting can have a significant impact on the frequency of visits to spa resorts. Tourists visiting for medical or spa treatments may have a higher frequency of visits due to the need for ongoing treatment.
On the other hand, tourists visiting for relaxation or recreation may make less frequent but longer visits. In the Vâlcea Subcarpathians, these differences in reasons for visiting may reflect different tourist behaviors and preferences, thus influencing the frequency with which they return to spa resorts.
H12. 
The reason for visiting spa resorts in the Vâlcea Subcarpathians influences the frequency of visits.
The reason why tourists choose to visit spa resorts can have a significant impact on the frequency of these visits. For example, tourists who come for medical treatments or for relaxation and recovery may make more frequent visits compared to those who visit occasionally for special events or exploration.
Studies by Kozak (2002) have shown that there is a correlation between travel reasons and frequency of visits [97]. These studies have demonstrated that tourists motivated by health and wellness tend to make more regular and frequent visits to spa destinations, while recreation and exploration are associated with more sporadic visits.
This hypothesis is based on research related to tourist behavior and travel reasons [97], adapted to the spa context. These studies used validated scales to measure the frequency of visits according to travel reasons.
RQ13: Is there an association between participation in cultural activities and the average trip duration to spa resorts in the Vâlcea Subcarpathians?
Participation in cultural activities, such as festivals, local events, museum visits and traditional crafts, can influence the average duration of tourists’ trips. Tourists who are attracted by these cultural activities tend to stay longer in a destination to explore the cultural offerings in detail.
In the Vâlcea Subcarpathians, where spa resorts are surrounded by a rich cultural heritage, participation in such activities can extend the length of tourists’ stay, providing them with a more complete and diversified experience.
H13. 
Participation in cultural activities at spa resorts influences the average duration of trips.
Participation in cultural activities can significantly influence the length of stay of tourists at spa resorts. Tourists who are attracted by cultural events, festivals or other similar activities tend to spend more time at the resort in order to fully enjoy these experiences.
Studies by McKercher and du Cros (2002) have shown that there is a correlation between participation in cultural activities and length of stay [93]. These studies have demonstrated that cultural tourists are willing to spend longer periods at tourist destinations in order to have enough time to explore and participate in various cultural activities.
This hypothesis is based on research related to cultural tourism and tourist behavior [93], adapted for the spa context. These studies used validated scales to measure the length of stay according to participation in cultural activities.
3.4. Research Variables

A research variable is any characteristic, measurable entity that exhibits variability, differing in level among members of a particular group, and thus possesses more than one level or value. In order to answer the research objectives, each question in the questionnaire was associated with a specific variable used in the analysis to test the formulated hypotheses (Table 1).
Table 2 assigns the statistical methods used to test each research hypothesis. A Chi-Square Test was used for most of the hypotheses (H1, H3, H5, H17–H18, H11); in the case of hypotheses H2 and H6, the Independent Samples t-Test, and for hypotheses H4, H9–10, and H12–H13, the Analysis of Variance (ANOVA).

4. Results and Discussion

4.1. Sociodemographic Characteristics

The majority of respondents, 68%, were female, while the remaining 32% were male. This indicates either more active participation in the survey or a greater preference for spa resorts on the part of women. The largest number of respondents fell into the 41–60 age range (254 respondents). Other age ranges represented were 26–40 (133 respondents), 18–25 (84 respondents) and over 60 (51 respondents).
Of the 522 respondents, 379 people had received higher education (Bachelor’s, Master’s or doctorate), while a smaller number of respondents had post-secondary (91) or high school (52) education. Most respondents were well educated, having completed some level of higher education. This may indicate a tendency for people with a higher level of education to be more interested in spa resorts or to participate in surveys more often.
The majority of respondents were salaried (346). Other categories included students (89), retirees (68), self-employed (11) and unemployed (8). The fact that most respondents were employed reflects a certain financial stability that allows them to travel and visit spa resorts. There was also significant representation of students and retirees, indicating an interest in spa resorts among these groups.
In terms of the residential environment, 64% of respondents live in urban areas, while the remaining 36% live in rural areas. The data may reflect a greater tendency to participate in surveys or travel to health resorts among the urban population.

4.2. Questionnaire Results

Hypothesis 1.
There is a significant relationship between the age range of tourists and the frequency of visits to the spa resorts in the Vâlcea Subcarpathians.
Table 3 shows the distribution of respondents by age range and frequency of visits to the spa resorts in the Vâlcea Subcarpathians. In the age range 18–25 years, the majority (75) visited once, 7 visited twice and 2 visited three times, totaling 84 respondents. In the age range 26–40 years, 97 visited once, 30 twice and 6 three times, totaling 133 respondents. In the age range 41–60 years, 158 visited once, 84 twice and 12 three times, totaling 254 respondents.
In the over-60 age bracket, 30 respondents had visited once, 20 twice, and 1 visited three times, totaling 51 respondents. In total, 360 respondents visited once, 141 twice and 21 three times, totaling 522 respondents. These data show a general trend for the frequency of visits to be higher in the higher age ranges.
Table 4 presents the results of the Chi-Square test to determine the relationship between the age range of tourists and the frequency of visits to the spa resorts in the Vâlcea Subcarpathians. The Pearson Chi-Square value was 27.360 with 6 degrees of freedom and an asymptotic significance of 0.000.
The asymptotic significance (p-value) was 0.000 for all tests, which is much lower than the threshold of 0.05. This indicates a statistically significant relationship between the age range of tourists and the frequency of visits to the spa resorts in the Vâlcea Subcarpathians. Thus, hypothesis H1 was supported by the data.
Hypothesis 2.
The perception of the quality of services at spa resorts differs significantly depending on the gender of tourists.
Table 5 presents group statistics for the information sources used for planning visits to spa resorts, depending on the gender of the tourists.
For the male gender (coded as 1), the number of respondents was 166, with a mean of 2.82, a standard deviation of 1.889 and a standard error of the mean of 0.147.
For the female gender (coded as 2), the number of respondents was 356, with a mean of 2.41, a standard deviation of 1.668 and a standard error of the mean of 0.088.
This suggests that there is a difference in the sources of information used for planning visits according to the gender of tourists, with a higher mean for men compared to women.
Table 6 presents the results of the t-test for independent samples, assessing whether the perception of the quality of services at spa resorts differs significantly according to the gender of tourists.
The Levene test indicated that the variances were not equal, which suggests the use of the row “Equal variances not assumed.” The t value (2.407) and significance (Sig. = 0.017) showed that there is a statistically significant difference between the perception of service quality according to the gender of tourists.
This supports hypothesis H2, according to which the perception of service quality at spa resorts differs significantly according to the gender of tourists.
Hypothesis 3.
The level of education of tourists significantly influences the information sources used to plan visits to spa resorts.
Table 7 presents the distribution of respondents by education level and the sources of information used to plan visits to spa resorts. The level of education is coded as follows: high school (1), post-high school (2) and higher education (3). The sources of information are coded as follows: Internet/specialized and profile websites (1), magazines/brochures/radio (2), travel agencies (3), recommendations from friends and/or family (4), tourist information centers (5), I do not visit (6), I have not visited (7).
Respondents with a high school education used various sources of information: 28 used the Internet (1), 8 used recommendations from friends and/or family (4), 3 used tourist information centers (5) and 11 stated that they do not visit (6), totaling 52 respondents.
Respondents with post-secondary education used the following sources of information: 43 Internet (1), 4 magazines/brochures/radio (2), 4 travel agencies (3), 18 recommendations from friends and/or family (4), 16 tourist information centers (5) and 6 stated that they do not visit (6), totaling 91 respondents.
Respondents with higher education used the following sources of information: 198 Internet (1), 17 magazines/brochures/radio (2), 35 travel agencies (3), 59 recommendations from friends and/or family (4), 70 tourist information centers (5), 17 stated that they do not visit (6) and 1 stated that they did not visit (7), totaling 379 respondents.
Table 8 presents the results of the Chi-Square test to determine whether the level of education of tourists significantly influences the sources of information used for planning visits to spa resorts. The Pearson Chi-Square value was 88.274 with 12 degrees of freedom and an asymptotic significance of 0.000.
The asymptotic significance (p-value) was 0.000 for the Pearson Chi-Square and Likelihood Ratio values, and 0.027 for the Linear-by-Linear Association, all of which are lower than the 0.05 threshold. This indicates that there is a statistically significant relationship between the level of education of tourists and the information sources used for planning visits to spa resorts. Thus, hypothesis H3 was supported by the data.
Hypothesis 4.
The labor market status of tourists is associated with the average duration of trips to the spa resorts in the Vâlcea Subcarpathians.
Table 9 presents the results of the ANOVA analysis to assess whether the average duration of trips to spa resorts in Vâlcea Subcarpathians differs significantly depending on the labor market status of tourists.
The F value was 12.385, and the significance (Sig.) was 0.000. This indicates that there is a statistically significant difference between the groups. In this context, the results suggest that the labor market status of tourists is associated with the average duration of trips to the spa resorts in the Vâlcea Subcarpathians.
Hypothesis 5.
There is a significant difference between the residential environment of tourists and the frequency of visits to spa resorts.
Table 10 presents the distribution of respondents according to their area of residence and the frequency of visits to the spa resorts in the Vâlcea Subcarpathians.
Respondents from urban areas (1) visited once (224), twice (92) or three times (17), totaling 333 respondents.
Respondents from rural areas (2) visited once (136), twice (49) or three times (4), totaling 189 respondents.
In total, 360 respondents visited once, 141 respondents visited twice and 21 respondents visited three times, totaling 522 respondents. These data show that the majority of visitors come from urban areas and that their frequency of visits is higher compared to those from rural areas.
Table 11 presents the results of the Chi-Square test to determine whether there is a significant difference between the residential environment of tourists and the frequency of visits to spa resorts.
The Pearson Chi-Square value was 3.191 with 2 degrees of freedom and an asymptotic significance of 0.203. The Likelihood Ratio value was 3.473 with 2 degrees of freedom and an asymptotic significance of 0.176. The linear-by-linear association had a value of 2.303 with 1 degree of freedom and an asymptotic significance of 0.129. The total number of valid cases was 522.
The asymptotic significance (p-value) for all tests was greater than the threshold of 0.05 (Pearson Chi-Square: 0.203, Likelihood Ratio: 0.176, Linear-by-Linear Association: 0.129). This indicates that there is no statistically significant relationship between the residential environment of tourists and the frequency of visits to spa resorts. Thus, hypothesis H5 was not supported by the data.
Hypothesis 6.
There is a significant difference in the frequency of visits to the spa resorts in the Vâlcea Subcarpathians between tourists who have previously visited these resorts and those who are visiting them for the first time.
Table 12 presents the mean values and standard deviations of the frequency of visits for two groups: tourists with previous visit experience (N = 496) and tourists without previous visit experience (N = 26).
For tourists with previous visit experience, the average frequency of visits was 1.37 with a standard deviation of 0.564 and a standard error of the mean of 0.025.
For tourists without previous visit experience, the average frequency of visits was 1.00 with a standard deviation of 0.000 and a standard error of the mean of 0.000. These data suggest that there is a difference in the frequency of visits between those who have previously visited spa resorts and those who have not.
In Table 13, it can be seen that the p-value (Sig. 2-tailed) is 0.001 for the variant in which the variances are equal and 0.000 for the variant in which the variances are not equal. Both values are lower than the significance threshold of 0.05, which indicates that there is a statistically significant difference between the frequency of visits to the spa resorts in the Vâlcea Subcarpathians between tourists who have previously visited these resorts and those who are visiting them for the first time. Thus, hypothesis H6 was supported by the data from this test.
Hypothesis 7.
The residential environment of tourists influences why they choose to visit the Vâlcea Subcarpathians.
Table 14 presents the relationship between the tourists’ area of residence and the reasons for visiting spa resorts. Most urban and rural tourists visit resorts for health recovery and improvement, relaxation/stress reduction and medical treatment.
Of those tourists from urban areas, 114 mentioned health recovery and 79 mentioned relaxation; of those tourists from rural areas, 68 mentioned health recovery and 49 mentioned relaxation.
The reasons for visiting were similar between urban and rural tourists, with differences in the number of respondents for each reason.
Hypothesis H7 was confirmed. The Chi-square test had a value of 12.762 with a significance level (p-value) of 0.047, which is below the threshold of 0.05 (Table 15). A significant correlation was observed between the residential environment of tourists and why they chose to visit the Vâlcea Subcarpathians.
Hypothesis 8.
The frequency of visits to spa resorts in the Vâlcea Subcarpathians is associated with participation in cultural activities.
Table 16 presents the distribution of respondents according to the frequency of visits to the spa resorts in the Vâlcea Subcarpathians and participation in cultural activities in these resorts. Those who visited the spa resorts only once participated in cultural activities as follows: 214 did not participate, 48 participated in one activity, 26 in two activities, 11 in three activities, 15 in four activities, 16 in five activities, 12 in six activities and 18 in seven activities, totaling 360 respondents.
Respondents who visited the resorts twice had the following profile of participation in cultural activities: 91 did not participate, 13 participated in one activity, 16 in two activities, 6 in three activities, 2 in four activities, 5 in five activities and 8 in six activities, totaling 141 respondents
Of those who visited the resorts three times, 10 did not participate, 2 participated in one activity, 4 in two activities and 5 in three activities, totaling 21 respondents.
In total, 315 respondents did not participate in cultural activities, 63 participated in one activity, 46 in two activities, 17 in three activities, 17 in four activities, 21 in five activities, 25 in six activities and 18 in seven activities, totaling 522 respondents.
These data suggest that most respondents did not participate in cultural activities, and those who did tend to participate did so in one or two cultural activities, regardless of the frequency of visits to spa resorts.
Table 17 presents the results of the Chi-Square test to determine whether there is a significant association between the frequency of visits to spa resorts in the Vâlcea Subcarpathians and participation in cultural activities. The Pearson Chi-Square value was 38.211 with 14 degrees of freedom and an asymptotic significance of 0.000.
The asymptotic significance (p-value) was 0.000 for the Chi-Square Pearson and 0.001 for the Likelihood Ratio, both of which are lower than the threshold of 0.05, indicating a statistically significant relationship between the frequency of visits and participation in cultural activities. However, the Linear-by-Linear Association had a significance of 0.827, suggesting that there is no significant linear relationship.
In conclusion, the results indicate a statistically significant relationship between the frequency of visits to the spa resorts in the Vâlcea Subcarpathians and participation in cultural activities, supporting hypothesis H8.
Hypothesis 9.
The average duration of trips to the spa resorts in the Vâlcea Subcarpathians differs significantly depending on the means of transport used.
Table 18 presents the results of the ANOVA to determine whether the average duration of trips to the spa resorts in the Vâlcea Subcarpathians differs significantly depending on the means of transport used.
The F value (9.991) and significance (Sig. = 0.000) indicated that there is a statistically significant difference between the groups. This suggests that the average travel time differs significantly depending on the mode of transport used, supporting hypothesis H9.
Hypothesis 10.
The information sources used influence why tourists choose to visit the Vâlcea Subcarpathians.
Table 19 presents the results of the ANOVA analysis to determine whether the information sources used influence why tourists choose to visit the Vâlcea Subcarpathians.
The F value (31.555) and significance (Sig. = 0.000) indicated that there is a statistically significant difference between the groups. This suggests that the information sources used influence why tourists choose to visit the Vâlcea Subcarpathians, supporting hypothesis H10.
Hypothesis 11.
The vacation planning method influences why tourists choose to visit the Vâlcea Subcarpathians.
Table 20 presents the distribution of respondents according to the method of vacation planning and the reason for visiting spa resorts.
Respondents who planned their vacation on their own (460) had the following main reasons: recovery and improvement of health (160), relaxation/rest/stress reduction (123) and learning something new about a tourist area, culture or history (78).
Respondents who used travel agents (44) had similar reasons, but in smaller numbers: recovery and improvement of health (22), relaxation/rest/stress reduction (5) and learning something new (4).
Respondents who had not been to spas (18) were coded under reason 7.
Overall, the most common reasons for visiting spas were recovery and improvement of health (182), relaxation/rest/stress reduction (128) and learning something new (82). The total number of respondents was 522. These data suggest that most respondents prefer to plan their vacation on their own, and the main reasons for visiting spas are related to health and relaxation.
Table 21 presents the results of the Chi-Square test to determine whether the vacation planning method influences why tourists choose to visit the Vâlcea Subcarpathians.
The Pearson Chi-Square value was 531.519 with 12 degrees of freedom and an asymptotic significance of 0.000. The Likelihood Ratio value was 166.552 with 12 degrees of freedom and an asymptotic significance of 0.000. The linear-by-linear association had a value of 89.090 with 1 degree of freedom and an asymptotic significance of 0.000. The total number of valid cases was 522.
The asymptotic significance (p-value) was 0.000 for all tests, which is much lower than the threshold of 0.05. This indicates that there is a statistically significant relationship between the vacation planning method and the reasons why tourists choose to visit the Vâlcea Subcarpathians. Thus, hypothesis H11 was supported by the data.
Hypothesis 12.
The reason for visiting spa resorts in the Vâlcea Subcarpathians influences the frequency of visits.
Table 22 presents the results of the ANOVA analysis to determine whether the reason for visiting the spa resorts in the Vâlcea Subcarpathians influences the frequency of visits.
The F value (5.389) and the significance (Sig. = 0.000) indicate that there is a statistically significant difference between the groups. This suggests that the reason for visiting influences the frequency of visits to the spa resorts in the Vâlcea Subcarpathians.
Hypothesis 13.
Participation in cultural activities at spa resorts influences the average duration of trips.
Table 23 presents the results of the ANOVA analysis to determine whether participation in cultural activities influences the average duration of trips to spa resorts in the Vâlcea Subcarpathians.
The F value (6.632) and significance (Sig. = 0.000) indicate that there is a statistically significant difference between the groups. This suggests that participation in cultural activities does indeed influence the average duration of trips to spa resorts.

4.3. Analysis and Conclusion of the Experimental Results

This study provides an empirical examination of spa tourism behavior in the Vâlcea Subcarpathians by analyzing the relationships between visit frequency, cultural participation, travel duration, motivation, information sources, and planning behavior. The results confirm a set of statistically significant associations that offer insights into tourist decision-making processes.
First, the Chi-Square test confirmed a significant association between the frequency of visits and participation in cultural activities (χ2 (14) = 38.211, p < 0.001), suggesting that cultural engagement is more common among repeat visitors. However, the lack of a linear relationship (Linear-by-Linear Association, p = 0.827) implies that while these variables are linked, the pattern is not strictly progressive. Furthermore, trip duration was shown to differ significantly based on the mode of transportation used (F (3518) = 9.991, p < 0.001), highlighting the impact of logistical accessibility on travel behavior.
Additionally, the source of information significantly influenced the reasons for visiting the region (F (6515) = 31.555, p < 0.001), as did the method of vacation planning, where independent planners more frequently cited health, relaxation, and educational motives (χ2 (12) = 531.519, p < 0.001). Importantly, the ANOVA results also revealed that the reason for visiting significantly impacts the frequency of visits (F (6515) = 5.389, p < 0.001), and participation in cultural activities significantly influences the average duration of trips (F (7514) = 6.632, p < 0.001), reinforcing the interdependence of motivational and behavioral dimensions in spa tourism.
These findings can be meaningfully interpreted using Expectation Confirmation Theory (ECT), which posits that satisfaction results when post-consumption experiences confirm or exceed initial expectations [98]. The statistical associations found suggest that visitors’ expectations—particularly regarding cultural experiences, transport accessibility, and wellness benefits—are largely met or surpassed, leading to repeat visitation and longer stays. For example, the stronger cultural engagement among repeat visitors indicates that initial expectations about local experiences were confirmed, thereby enhancing satisfaction and reinforcing loyalty.
Complementarily, the Theory of Planned Behavior (TPB) offers a framework to understand the psychological precursors of these behaviors. According to TPB [22], behavioral intention is shaped by attitudes toward the behavior, subjective norms, and perceived behavioral control. The study’s results reflect this model: tourists’ attitudes (e.g., valuing wellness or cultural enrichment), norms (e.g., planning via travel agents vs. independently), and control factors (e.g., available transport modes, access to information) significantly influenced their visit motivations, frequency, and duration. The significant role of vacation planning method and information source as predictors of tourist behavior supports the notion that both intention and perceived control mechanisms play a crucial role in shaping actual tourist behavior in spa contexts.
In combining ECT and TPB, this study not only confirms that satisfaction and behavioral intention are based on a match between expectation and experience but also highlights how planned decision-making structures (attitudes, norms, and control beliefs) influence these outcomes. The integration of these two theories provides a holistic explanation for spa tourist behavior, offering a robust foundation for destination management strategies.
Practical implications include the need for spa resorts and tourism marketers to ensure clear communication of cultural and wellness offerings, facilitate diverse transport options, and support personalized trip planning tools. Enhancing these aspects is likely to align with tourists’ expectations and behavioral intentions, thereby encouraging repeat visitation and longer stays.

5. Conclusions

5.1. Theoretical Implications

In conclusion, this paper analyzed various factors influencing tourist behavior in the spa resorts of the Vâlcea Subcarpathians. The results obtained from the statistical tests largely confirmed the proposed hypotheses. There is a significant relationship between the age range of tourists and the frequency of visits, suggesting that different age groups have distinct behaviors in terms of the number of visits. Also, the perception of service quality varies depending on the gender of tourists, indicating that men and women have different experiences and expectations.
Tourists with different levels of education prefer different information sources for planning visits. Labor market status is associated with the average duration of trips, highlighting that people with different occupations or social statuses plan trips of different durations. The residential environment does not have a significant influence on the frequency of visits, contrary to initial expectations.
Previous visit experience plays a significant role in determining the frequency of subsequent visits, suggesting that tourists who have had positive experiences are more likely to visit again. Residential environment influences the reasons for visits, demonstrating that urban and rural tourists have different motivations for visiting spa resorts. Visit frequency is associated with participation in cultural activities, indicating that those who visit more often are also more interested in local activities.
The average duration of trips differs significantly depending on the means of transport used, suggesting that the accessibility and convenience of transport influence the length of tourists’ stay. Information sources and vacation planning methods influenced the reasons for visits, showing that access to information and the way of organizing trips are essential factors in the choice of destination and activities. Finally, participation in cultural activities influences the average duration of trips, demonstrating that cultural events and attractions can lead tourists to extend their stays.
The findings align with the Theory of Planned Behavior (TPB), illustrating how tourists’ attitudes (such as health and relaxation motivations), subjective norms (reflected by participation in cultural activities), and perceived behavioral control (influenced by transport accessibility) collectively shape their intentions and actual visiting behaviors. Moreover, the significance of prior visit experience supports the Expectation Confirmation Theory (ECT), emphasizing that confirmation of tourists’ expectations through satisfactory experiences strongly influences their likelihood of repeat visits to the spa resorts.

5.2. Managerial Implications

The results of the empirical study clearly contribute to the research of demand in spa and health tourism for the four spa resorts in the Vâlcea Subcarpathians. Knowing the motivations of tourists to visit spa resorts will provide new practical perspectives for the development of Destination Management Organizations (DMOs), but also for hotel managers and small entrepreneurs operating in the field of spa and health tourism to increase the competitiveness of the spa resorts in the Vâlcea Subcarpathians: Băile Olănești, Călimănești, Băile Govora, and Ocnele Mari, allowing them, and those who already carry out tourism activities, to adapt their offer of tourist products in the medium and long term, to carry out more efficient marketing and communication campaigns and, at the same time, oriented towards satisfying the needs of foreign tourists, and not local ones. In the context of the post-COVID-19 pandemic and the travel restrictions that were applied in the tourism and hospitality sector during 2020–2022, knowing tourists’ motivations for visiting spa resorts is very important, as competition for tourists/visitors has had an upward trend due to the diminished flow of foreign tourists [99].
At the same time, the study contributes to the specialized literature by developing hypotheses and research variables through the Theory of Planned Behavior (TPB). Regarding the management of spa resorts in the Vâlcea Subcarpathians, there are also a number of factors that limit the number of tourists: mineral water reserves and productivity, mud reserves, transport infrastructure capacity and spa resort capacity. Efficient spa resort management can be used to counterbalance economic opportunities with the natural and cultural impressionability of spa resorts and health resorts [100]. Successes or losses in spa resort management most often depend on stakeholders; and these stakeholders in spa resorts and health tourism are: (1) internal: spa resort staff, investors, entrepreneurs and owners of hotel and catering units and (2) external: tourists or visitors, local residents, tourism service providers and intermediaries [100].
Visiting spa resorts influences the economic development of local tourism by generating additional income from the sale of traditional gastronomic products, organizing local festivals and summer camps to promote crafts, expanding the number of hotel and catering establishments, and last but not least, increasing the average length of tourist stay. To all this, one can add the purchase of souvenirs from local traders. Souvenirs are an extremely important part of improving the tourist experience [101,102] and stimulating memories after visiting spa resorts [103]. Therefore, all these commercial activities within spa resorts should take into account not only profits, but also the social side of spa resorts and their health and sustainable development [104]. As a result of the tourist activities that can be carried out within the health and spa resorts, there are multiple risks that can affect tourists, namely: potential risks in planning trips and visiting spa resorts and economic or commercial risks arising from the activities of travel agencies [105].
Integrating the Theory of Planned Behavior (TPB) and Expectation Confirmation Theory (ECT) into the analysis not only advances theoretical understanding but also provides practical guidance for spa resort management. By recognizing how tourists’ attitudes, social influences, and perceived control affect their visit intentions, managers can tailor marketing and infrastructure improvements—such as enhancing transport accessibility—to positively influence behavior. Additionally, confirming tourists’ expectations through high-quality services is essential to encourage repeat visits, particularly in the post-COVID-19 context where traveler confidence and preferences have evolved. This multidimensional approach highlights the complex nature of tourist decision-making and underscores the value of behavioral frameworks in developing effective strategies for sustainable growth and recovery in spa tourism.

5.3. Limitations and Future Research Directions

This research is subject to limitations. First, there is a need for future research that integrates qualitative methods and explores tourism motivations and experiences in depth. Secondly, since the sample is based only on tourists from Romania, the geographical area represents a limitation. Future research should focus on investigating the intentions of spa resort tourists in other countries of the European continent [106,107]. Third, the study was limited to the sample of respondents who chose to answer the survey.
This study provides basic statistical data for future studies to be carried out by the author’s team. To obtain more exhaustive findings, the scope of research and investigation of future studies could be expanded to include more areas in Romania that have the potential for spa resorts in natural settings. Another direction of research would be a comparative analysis between spa resorts in Romania and those elsewhere in Europe, Asia, or the Americas in order to come up with development strategies and policies that are adapted to the specific characteristics of spa resorts in each location. Finally, future research could use partial least squares structural equation modeling (PLS-SEM) to create path analysis diagrams or a conceptual modeling framework to explicitly link demographic variables, tourist perceptions, and the different factors influencing spa resorts, thus increasing the clarity and comprehensiveness of the spa resorts development model. In future research studies, the author would also like to calculate the Tourist Climate Index (TCI) to assess the favorability/unfavorability of the climate for tourist activities at spa destinations [108,109,110,111,112,113,114].

Author Contributions

Conceptualization, A.N. and I.-A.D.; methodology, A.N. and I.-A.D.; software, A.N. and I.-A.D.; validation, A.N. and I.-A.D.; formal analysis, A.N. and I.-A.D.; investigation, A.N. and I.-A.D.; resources, I.-A.D. and A.N.; data curation, A.N. and. I.-A.D.; writing—original draft preparation, A.N. and I.-A.D.; writing—review and editing, A.N. and I.-A.D.; visualization, I.-A.D. and A.N.; supervision, A.N. and I.-A.D.; project administration, A.N. and I.-A.D. All authors have read and agreed to the published version of the manuscript.

Funding

This study was supported by the research fund of the University of Craiova, Romania.

Institutional Review Board Statement

Institutional Review Board (IRB) approval was not required for this study, in accordance with the University of Craiova’s institutional guidelines. The research involved an anonymous, minimal-risk survey, which does not fall under the category of studies requiring review by the university’s Ethics Committee.

Informed Consent Statement

The study involved voluntary participation in an anonymous online survey. Participants were informed about the purpose of the study, and consent was implied through their completion of the survey. No personal or identifiable information was collected.

Data Availability Statement

Data are contained within the article.

Acknowledgments

The authors would like to thank the guest editors and academic editors for their constant support during the various stages of writing this article, as well as the anonymous reviewers for their constructive comments and helpful suggestions, which greatly contributed to improving its quality over the several review rounds.

Conflicts of Interest

The authors declare no conflicts of interest. The funders had no role in the design of the study; in the collection, analysis, or interpretation of data; in the writing of the manuscript; or in the decision to publish.

Abbreviations

The following abbreviations have been used throughout this paper:
GWIThe Global Wellness Institute
SPSSStatistical Package for the Social Sciences (Software)
TPBTheory of Planned Behavior
TRATheory of Rational Action
ECTExpectation Confirmation Theory
GISGeographic Information System (Software)
NISNational Institute of Statistics
DMODestination Marketing Organization
PLS-SEMPartial least squares structural equation modeling
TCITourist Climate Index

References

  1. Manosuthi, N.; Lee, J.S.; Han, H. Predicting the revisit intention of volunteer tourists using the merged model between the theory of planned behavior and norm activation model. J. Travel Tour. Mark. 2020, 37, 510–532. [Google Scholar] [CrossRef]
  2. Chi, C.G.-Q.; Qu, H. Examining the structural relationships of destination image, tourist satisfaction and destination loyalty: An integrated approach. Tour. Manag. 2008, 29, 624–636. [Google Scholar] [CrossRef]
  3. Talaee Malmiri, A.R.; Norouzi Isfahani, R.; BahooToroody, A.; Abaei, M.M. A systematic approach for predicting loyalty behavior of tourist destinations. J. Tour. Futures, 2021; ahead-of-print. [Google Scholar] [CrossRef]
  4. Nöhammer, E.; Haid, M.; Corradini, P.; Attenbrunner, S.; Heimerl, P.; Schorn, R. Contextual Factors of Resilient Tourism Destinations in a Pandemic Situation: Selected Cases from North and South Tyrol during the SARS-CoV-2 Pandemic. Sustainability 2022, 14, 13820. [Google Scholar] [CrossRef]
  5. Naskar, S.; Das, P. Application of Different Statistical Tests in Educational Research: An Overview. J. Emerg. Technol. Innov. Res. 2018, 5, 129–137. [Google Scholar]
  6. Teleki, N.; Munteanu, L. Spa Tourism in Romania Balneo-Turistică/Spa Tourism in Romania; Royal Company Publishing: Bucharest, Romania, 2012. [Google Scholar]
  7. Light, D.; Creţan, R.; Voiculescu, S.; Jucu, I.S. Introduction: Changing tourism in the cities of post-communist central and eastern Europe. J. Balk. Near East. Stud. 2020, 22, 465–477. [Google Scholar] [CrossRef]
  8. Smith, M.K. Health tourism in Hungary: Future challenges for thermal spas. Worldw. Hosp. Tour. Themes 2025, 17, 187–199. [Google Scholar] [CrossRef]
  9. Jalali, M.; Haghgoshayie, E.; Janati, A.; Yoshari, P.; Khodayari-Zarnaq, R. Health tourism: A global perspective on the barriers and facilitators. Discov. Public Health 2025, 22, 157. [Google Scholar] [CrossRef]
  10. Dryglas, D.; Smith, M.K. Conclusions and reflections: The development of health tourism in challenging times—A focus on the Visegrád countries. Worldw. Hosp. Tour. Themes 2025, 17, 282–286. [Google Scholar] [CrossRef]
  11. Raoofi, S.; Khodayari-Zarnaq, R.; Ghasemyani, S.; Hamidi, H.; Vatankhah, S. Barriers of medical tourism development in Iran. Anatolia Int. J. Tour. Hosp. Res. 2022, 33, 91–103. [Google Scholar] [CrossRef]
  12. Bagheri, A.; Rousta, A.; Forozandeh, L.; Asayesh, F. Marketing Model of Health Tourism (Case Study: The City of Tehran). Tour. Cult. 2023, 4, 46–61. [Google Scholar] [CrossRef]
  13. Azman, I.; Chan, K.L.J. Health and spa tourism business: Tourists’ profiles and motivational factors. Health Wellness Tour. Healthy Tour. Healthy Bus. 2010, 9, 1–17. [Google Scholar]
  14. Kucukusta, D.; Guillet, B.D. Measuring spa-goers’ preferences: A conjoint analysis approach. Int. J. Hosp. Manag. 2014, 41, 115–124. [Google Scholar] [CrossRef]
  15. Vetitnev, A.; Kopyirin, A.; Kiseleva, A. System dynamics modelling and forecasting health tourism demand: The case of Russian resorts. Curr. Issues Tour. 2016, 19, 618–623. [Google Scholar] [CrossRef]
  16. Dryglas, D.; Salamaga, M. Applying destination attribute segmentation to health tourists: A case study of Polish spa resorts. J. Travel Tour. Mark. 2017, 34, 503–514. [Google Scholar] [CrossRef]
  17. Chrobak, A.; Ugolini, F.; Pearlmutter, D.; Raschi, A. Thermal Tourism and Geoheritage: Examining Visitor Motivations and Perceptions. Resources 2020, 9, 58. [Google Scholar] [CrossRef]
  18. Suban, S.A. Spa tourism: Understanding the relationship of tourists emotional experience, destination image, satisfaction, and intention to recommend using an integrated model. Int. J. Spa Wellness 2024, 7, 1–22. [Google Scholar] [CrossRef]
  19. Murad, A.; Zain, N.A.M.; Hanafiah, M.H.; Asyraff, M.A.; Ismail, H. Dimension of perception and behaviour of hotel-based wellness and spa travellers: Application of stimulus-organism-response model. Int. J. Spa Wellness 2025, 8, 23–41. [Google Scholar] [CrossRef]
  20. Dryglas, D.; Różycki, P. Profile of tourists visiting European spa resorts: A case study of Poland. J. Policy Res. Tour. Leis. Events 2017, 9, 298–317. [Google Scholar] [CrossRef]
  21. Yaghi, A.; Yaghi, H.A.; Bayrak, M. Sustainable Tourism: Factors Influencing Arab Tourists’ Intention to Revisit Turkish Destinations. Sustainability 2025, 17, 5194. [Google Scholar] [CrossRef]
  22. Ajzen, I. The theory of planned behavior. Organ. Behav. Hum. Decis. Process. 1991, 50, 179–211. [Google Scholar] [CrossRef]
  23. Zhao, Y.; Wang, P.; Lai, Y. Route Generation and Built Environment Behavioral Mechanisms of Generation Z Tourists: A Case Study of Macau. Buildings 2025, 15, 1947. [Google Scholar] [CrossRef]
  24. Chu, A.Z.; Chu, R.J. Service willingness and senior tourists: Knowledge about aging, attitudes toward the elderly, and work values. Serv. Ind. J. 2013, 33, 1148–1164. [Google Scholar] [CrossRef]
  25. Ulker-Demirel, E.; Ciftci, G. A systematic literature review of the theory of planned behavior in tourism, leisure and hospitality management research. J. Hosp. Tour. Manag. 2020, 43, 209–219. [Google Scholar] [CrossRef]
  26. Global Wellness Institute. 2023. Available online: https://globalwellnessinstitute.org/ (accessed on 15 April 2025).
  27. Gostin, L.O.; Wiley, L.F. Governmental public health powers during the COVID-19 pandemic: Stay-at-home orders, business closures, and travel restrictions. JAMA 2020, 323, 2137–2138. [Google Scholar] [CrossRef] [PubMed]
  28. Bendavid, E.; Oh, C.; Bhattacharya, J.; Ioannidis, J.P. Assessing mandatory stay-at-home and business closure effects on the spread of COVID-19. Eur. J. Clin. Investig. 2021, 51, e13484. [Google Scholar] [CrossRef] [PubMed]
  29. Matei, E.; Ilovan, O.R.; Sandu, C.B.; Dumitrache, L.; Istrate, M.; Jucu, I.S.; Gavrilidis, A.A. Early COVID-19 Pandemic Impacts on Society and Environment in Romania. Perception Among Population With Higher Education. Environ. Eng. Manag. J. (EEMJ) 2021, 20, 319–330. [Google Scholar] [CrossRef]
  30. Mazilu, M.; Niță, A.; Băbăț, A.; Drăguleasa, I.A.; Grigore, M. Risk and Sustainable tourism resilience in the Post Economic Crisis and COVID-19 pandemic period. Present Environ. Sustain. Dev. 2024, 18, 235–254. [Google Scholar] [CrossRef]
  31. Jupîneanţ, A.C.; Creţan, R.; Voiculescu, S.; Doiciar, C. COVID-19 crisis, Romanian Roma migrant women, and the temporary geographies of lockdown in the Spanish home. Area 2024, 56, e12910. [Google Scholar] [CrossRef]
  32. Lopes Brenner, E. La motivación turística: El caso de la región de las aguas termales de Goiás, Brasil. Boletín Asoc. Geόgrafos Españoles 2006, 42, 303–314. Available online: https://www.researchgate.net/publication/28155454_La_motivacion_turistica_el_caso_de_la_region_de_las_aguas_termales_de_Goias_Brasil (accessed on 15 April 2025).
  33. Anaya-Aguilar, R.; Gemar, G.; Anaya-Aguilar, C. Factors Associated with Spa Tourists’ Satisfaction. Mathematics 2021, 9, 332. [Google Scholar] [CrossRef]
  34. Medina-Muñoz, D.R.; Medina-Muñoz, R.D. Critical issues in health and wellness tourism: An exploratory study of visitors to wellness centres on Gran Canaria. Curr. Issues Tour. 2013, 16, 415–435. [Google Scholar] [CrossRef]
  35. Romão, J.; Machino, K.; Nijkamp, P. Integrative diversification of wellness tourism services in rural areas–an operational framework model applied to east Hokkaido (Japan). Asia Pac. J. Tour. Res. 2018, 23, 734–746. [Google Scholar] [CrossRef]
  36. Ekonomou, G.; Kallioras, D.; Menegaki, A.N.; Alvarez, S. Tourist Preferences for Revitalizing Wellness Products and Reversing Depopulation in Rural Destinations. Sustainability 2023, 15, 16736. [Google Scholar] [CrossRef]
  37. Dragan, A.; Crețan, R.; Terian, M.I. Landscapes of Watermills: A Rural Cultural Heritage Perspective in an East-Central European Context. Heritage 2024, 7, 4790–4813. [Google Scholar] [CrossRef]
  38. Dragan, A.; Creţan, R.; Jucu, I.S.; Oancea, O.A. Rural Landscapes as Cultural Heritage and Identity along a Romanian River. Heritage 2024, 7, 4354–4373. [Google Scholar] [CrossRef]
  39. Mijatov Ladičorbić, M.; Dragin, A.S.; Surla, T.; Tešin, A.; Amezcua-Ogáyar, J.M.; Calahorro-López, A.; Stojanović, V.; Zadel, Z.; Košić, K.; Ivanović, O.M.; et al. Towards Healthy and Sustainable Human Settlement: Understanding How Local Communities Perceive and Engage with Spa Tourism Development Initiatives in Rural Areas. Land 2024, 13, 1817. [Google Scholar] [CrossRef]
  40. Jankovic, S.; Persic, M. Reporting standards for health resort—Assumption for successful benchmarking. In Proceedings of the 7th International Scientific Conference on Economic and Social Development, New York, NY, USA, 24 October 2014; pp. 334–365. [Google Scholar]
  41. Gutenbrunner, C.; Bender, T.; Cantista, P.; Karagülle, Z. A proposal for a worldwide definition of health resort medicine, balneology, medical hydrology and climatology. Int. J. Biometeorol. 2010, 54, 495–507. [Google Scholar] [CrossRef] [PubMed]
  42. Konu, H.; Tuohino, A.; Björk, P. Well-being tourism in Finland. In Health, Tourism and Hospitality: Spas, Wellness and Medical Travel; Smith, M.K., Puczkó, L., Eds.; Routledge: London, UK, 2013; pp. 345–349. [Google Scholar]
  43. Heung, V.C.; Kucukusta, D. Wellness Tourism in China: Resources, Development and Marketing. Int. J. Tour. Res. 2013, 15, 346–359. [Google Scholar] [CrossRef]
  44. Drăguleasa, I.-A.; Niță, A.; Mazilu, M.; Constantinescu, E. Religious Tourism and Pilgrimage in Vâlcea County, South-West Oltenia Region: Motivations, Belief and Tourists’ Perceptions. Religions 2024, 15, 294. [Google Scholar] [CrossRef]
  45. Drăguleasa, I.-A.; Niță, A.; Mazilu, M. Capitalization of Tourist Resources in the Post-COVID-19 Period—Developing the Chorematic Method for Oltenia Tourist Destination, Romania. Sustainability 2023, 15, 2018. [Google Scholar] [CrossRef]
  46. Han, J.H.; Lee, M.J.; Hwang, Y.-S. Tourists’ Environmentally Responsible Behavior in Response to Climate Change and Tourist Experiences in Nature-Based Tourism. Sustainability 2016, 8, 644. [Google Scholar] [CrossRef]
  47. Zhang, A.; Zhong, L.; Xu, Y.; Wang, H.; Dang, L. Tourists’ Perception of Haze Pollution and the Potential Impacts on Travel: Reshaping the Features of Tourism Seasonality in Beijing, China. Sustainability 2015, 7, 2397–2414. [Google Scholar] [CrossRef]
  48. Majeed, S.; Lu, C.; Majeed, M.; Shahid, M.N. Health Resorts and Multi-Textured Perceptions of International Health Tourists. Sustainability 2018, 10, 1063. [Google Scholar] [CrossRef]
  49. Sultana, S.; Haque, A.; Momen, A.; Yasmin, F. Factors Affecting the Attractiveness of Medical Tourism Destination: An Empirical Study on India. Iran. J. Public Health 2014, 43, 867–876. [Google Scholar]
  50. Mota, M.; Nossa, P.; Oliveira Moreira, C. The Impact of Health and Wellness Tourism in the Regional Economy of Estrela UNESCO Global Geopark, Portugal. Sustainability 2023, 15, 15151. [Google Scholar] [CrossRef]
  51. Trip, D.-T.; Simut, R.; Badulescu, D. Do Size and Ownership Determine the Willingness for Sustainable Innovations in Spa and Health Tourism? A Case Study on Baile Felix Spa Resort, Romania. Sustainability 2023, 15, 14501. [Google Scholar] [CrossRef]
  52. Badulescu, D.; Saveanu, T.; Trip, D.-T.; Badulescu, A. Business Opportunities and Drivers for Health and Spa Tourism: A Qualitative Research on Baile Felix Spa Resort, Romania. Sustainability 2024, 16, 1807. [Google Scholar] [CrossRef]
  53. Figueiredo, N.; Abrantes, J.L.; Costa, S. Mapping the Sustainable Development in Health Tourism: A Systematic Literature Review. Sustainability 2024, 16, 1901. [Google Scholar] [CrossRef]
  54. Lopes, A.P.; Rodríguez-López, N. Application of a Decision-Making Tool for Ranking Wellness Tourism Destinations. Sustainability 2022, 14, 15498. [Google Scholar] [CrossRef]
  55. Stelmach, P.; Jurasiński, D.; Błotnicka, A.; Górski, Z. Developing Virtual Tour Platforms for Creating Sustainable Development of Spa Resorts: An Example from Poland. Tour. Cases 2025, tourism202500021. [Google Scholar] [CrossRef]
  56. Cristobal-Fransi, E.; Daries, N.; del Río-Rama, M.D.L.C.; Fuentes-Tierno, M.G. The challenge of digital marketing in health tourism: The case of Spanish health resorts. Qual. Quant. 2023, 1–29. [Google Scholar] [CrossRef]
  57. Szromek, A.R.; Polok, G. A Business Model for Spa Tourism Enterprises: Transformation in a Period of Sustainable Change and Humanitarian Crisis. J. Open Innov. Technol. Mark. Complex. 2022, 8, 72. [Google Scholar] [CrossRef]
  58. Könnyid, L.; Váradi, Z.; Nagy, Z.; Ilyés, N.; Horváth, O.H. The Changes in the Demographic Characteristics and Spatial Structure of Tourism Demand in the West Balaton Region’s Spa Cities. Sustainability 2022, 14, 10531. [Google Scholar] [CrossRef]
  59. Godlewska, A.; Mazurek-Kusiak, A.; Soroka, A. Push and pull factors influencing the choice of a health resort by Polish treatment-seekers. BMC Public Health 2023, 23, 2192. [Google Scholar] [CrossRef] [PubMed]
  60. Suess, C.; Mody, M. Hospitality healthscapes: A conjoint analysis approach to understanding patient responses to hotel-like hospital rooms. Int. J. Hosp. Manag. 2017, 61, 59–72. [Google Scholar] [CrossRef]
  61. Dryglas, D.; Smith, M.K. A critical analysis of how central European spas create health tourism experiencescapes. Tour. Plan. Dev. 2024, 21, 570–593. [Google Scholar] [CrossRef]
  62. Damijanić, A.T.; Šergo, Z. Determining travel motivations of wellness tourism. Ekon. Misao Praksa 2013, 22, 3–20. [Google Scholar]
  63. Pesonen, J.; Komppula, R. Rural wellbeing tourism: Motivations and expectations. J. Hosp. Tour. Manag. 2010, 17, 150–157. [Google Scholar] [CrossRef]
  64. Damijanić, A.T. Travel motivations as criteria in the wellness tourism market segmentation process. Acad. Tur.-Tour. Innov. J. 2020, 13, 201–213. [Google Scholar] [CrossRef]
  65. Dimitrovski, D.; Todorović, A. Clustering wellness tourists in spa environment. Tour. Manag. Perspect. 2015, 16, 259–265. [Google Scholar] [CrossRef]
  66. Meng, C.K.; Piaralal, S.K.; Islam, M.A.; Yusof, M.F.B.; Chowdhury, R.S. International medical Tourists’ expectations and behavioral intention towards health resorts in Malaysia. Heliyon 2023, 9, e19721. [Google Scholar] [CrossRef] [PubMed]
  67. Roangheș-Mureanu, A.-M. Turismul balnear și climateric. In Subcarpații Vâlcii; Editura Universității din București: București, Romania, 2012. [Google Scholar]
  68. Roșu, A. Geografia Fizică a României; Editura Didactică și Pedagogică: București, Romania, 1980. [Google Scholar]
  69. Ielenicz, M.; Pătru, I.G.; Ghincea, M. Subcarpații României; Editura Universitară: București, Romania, 2003. [Google Scholar]
  70. Niță, A. Rethinking Lynch’s “The Image of the City” Model in the Context of Urban Fabric Dynamics. Case Study: Craiova, Romania. J. Settl. Spat. Plan. 2021, 7, 5–14. [Google Scholar] [CrossRef]
  71. National Institute of Statistics. TEMPO Online. Available online: http://statistici.insse.ro:8077/tempo-online/#/pages/tables/insse-table (accessed on 15 April 2025).
  72. McHugh, M.L. The Chi-square Test of Independence. Biochem. Medica 2013, 23, 143–149. [Google Scholar] [CrossRef] [PubMed]
  73. Franke, T.M.; Ho, T.; Christie, C.A. The chi-square test: Often used and more often misinterpreted. Am. J. Eval. 2012, 33, 448–458. [Google Scholar] [CrossRef]
  74. Agresti, A. Categorical Data Analysis, 3rd ed.; John Wiley Sons: Hoboken, NJ, USA, 2013. [Google Scholar]
  75. Siegel, S.; Castellan, N.J., Jr. Nonparametric Statistics for the Behavioral Sciences, 2nd ed.; Mcgraw-Hill Book Company: New York, NY, USA, 1988. [Google Scholar]
  76. Field, A. Discovering Statistics Using SPSS; SAGE Publications: Thousand Oaks, CA, USA, 2009. [Google Scholar]
  77. Howell, D.C. Statistical Methods for Psychology, 8th ed.; Cengage Learning: Wadsworth, OH, USA, 2012. [Google Scholar]
  78. Pallant, J. SPSS Survival Manual, 6th ed.; McGraw-Hill Education: New York, NY, USA, 2016. [Google Scholar]
  79. Kim, H.Y. Statistical notes for clinical researchers: The independent samples t-test. Restor. Dent. Endod. 2019, 44, e26. [Google Scholar] [CrossRef] [PubMed]
  80. Tabachnick, B.G.; Fidell, L.S. Using Multivariate Statistics, 6th ed.; Pearson Education: London, UK, 2013. [Google Scholar]
  81. Keppel, G.; Wickens, T.D. Design and Analysis: A Researcher’s Handbook, 4th ed.; Pearson Prentice Hall: Englewood Cliffs, NJ, USA, 2004. [Google Scholar]
  82. Panoram, P. The Optimization of Logistics Management of The Rubber Within Buriram of Thailand for Asean. Int. J. Econ. Financ. Stud. 2022, 14, 280–292. [Google Scholar]
  83. Pearce, P.L. The Ulysses Factor: Evaluating Visitors in Tourist Settings; Springer: Berlin, Germany, 1988. [Google Scholar]
  84. Mattila, A.S. The Role of Culture and Purchase Motivation in Service Encounter Evaluations. J. Serv. Mark. 1999, 13, 376–389. [Google Scholar] [CrossRef]
  85. Parasuraman, A.; Zeithaml, V.A.; Berry, L.L. SERVQUAL: A Multiple-Item Scale for Measuring Consumer Perceptions of Service Quality. J. Retail. 1988, 64, 12–40. [Google Scholar]
  86. Chen, J.S.; Gursoy, D. Cross-Cultural Comparison of the Information Sources Used by First-Time and Repeat Travelers and Its Marketing Implications. Int. J. Hosp. Manag. 2000, 19, 191–203. [Google Scholar] [CrossRef]
  87. Buhalis, D.; Law, R. Progress in Information Technology and Tourism Management: 20 Years On and 10 Years After the Internet—The State of eTourism Research. Tour. Manag. 2008, 29, 609–623. [Google Scholar] [CrossRef]
  88. Oppermann, M. Travel Life Cycle. Ann. Tour. Res. 1995, 22, 535–552. [Google Scholar] [CrossRef]
  89. Smith, M.; Puczkó, L. Health and Wellness Tourism; Routledge: London, UK, 2008. [Google Scholar]
  90. Kozak, M. Repeaters’ behavior at two distinct destinations. Ann. Tour. Res. 2001, 28, 784–807. [Google Scholar] [CrossRef]
  91. Bieger, T.; Laesser, C. Market segmentation by motivation: The case of Switzerland. J. Travel Res. 2002, 41, 68–76. [Google Scholar] [CrossRef]
  92. Richards, G. Production and Consumption of European Cultural Tourism. Ann. Tour. Res. 1996, 23, 261–283. [Google Scholar] [CrossRef]
  93. McKercher, B.; du Cros, H. Cultural Tourism: The Partnership Between Tourism and Cultural Heritage Management; Haworth Press: Philadelphia, PA, USA, 2002. [Google Scholar]
  94. Lohmann, G.; Duval, D.T. Critical Aspects of the Transportation-Tourism Relationship. In Tourism and Transport: Modes, Networks and Flows; Lohmann, G., Duval, D.T., Eds.; Channel View Publications: Bristol, UK, 2011; pp. 2–11. [Google Scholar]
  95. Gursoy, D.; McCleary, K.W. An Integrative Model of Tourist’Information Search Behavior. Ann. Tour. Res. 2004, 31, 353–373. [Google Scholar] [CrossRef]
  96. Seabra, C.; Abrantes, J.L.; Lages, L.F. The impact of using non-media information sources on the future use of mass media information sources: The mediating role of expectations fulfillment. Tour. Manag. 2007, 28, 1541–1554. [Google Scholar] [CrossRef]
  97. Kozak, M. Comparative analysis of tourist motivations by nationality and destinations. Tour. Manag. 2002, 23, 221–232. [Google Scholar] [CrossRef]
  98. Oliver, R.L. A cognitive model of the antecedents and consequences of satisfaction decisions. J. Mark. Res. 1980, 17, 460–469. [Google Scholar] [CrossRef]
  99. Gössling, S.; Scott, D.; Hall, C.M. Pandemics, tourism and global change: A rapid assessment of COVID-19. J. Sustain. Tour. 2020, 29, 1–20. [Google Scholar] [CrossRef]
  100. Romanova, G.; Vetitnev, A.; Dimanche, F. Health and wellness tourism. In Tourism in Russia: A Management Handbook; Routledge: London, UK, 2015; pp. 231–287. [Google Scholar]
  101. Light, D.; Lupu, C.; Creţan, R.; Chapman, A. Unconventional entrepreneurs: The non-economic motives of souvenir sellers. Tour. Rev. 2024, 79, 1442–1456. [Google Scholar] [CrossRef]
  102. Cimpoca, A.-L.; Voiculescu, M.; Creţan, R.; Voiculescu, S.; Ianăş, A.-N. Living with Bears in Prahova Valley, Romania: An Integrative Analysis. Animals 2024, 14, 587. [Google Scholar] [CrossRef] [PubMed]
  103. Lupu, C.; Light, D.; Creţan, R.; Voiculescu, S. Souvenir practices of domestic tourists. Curr. Issues Tour. 2024, 1–12. [Google Scholar] [CrossRef]
  104. Szromek, A.R.; Naramski, M. A Business Model in Spa Tourism Enterprises: Case Study from Poland. Sustainability 2019, 11, 2880. [Google Scholar] [CrossRef]
  105. Ovcharov, A. Russia’s Tourism Industry: Trends and Risks. Probl. Econ. Transit. 2008, 51, 56–67. [Google Scholar] [CrossRef]
  106. Nistoreanu, P.; Aluculesei, A.-C. Can Spa Tourism Enhance Water Resources and Turn Them into a National Brand? A Theoretical Review about the Romanian Case. Information 2021, 12, 270. [Google Scholar] [CrossRef]
  107. Aluculesei, A.-C.; Nistoreanu, P.; Avram, D.; Nistoreanu, B.G. Past and Future Trends in Medical Spas: A Co-Word Analysis. Sustainability 2021, 13, 9646. [Google Scholar] [CrossRef]
  108. Mihăilă, D.; Piticar, A.; Briciu, A.E.; Bistricean, P.I.; Lazurca, L.G.; Puţuntică, A. Changs in bioclimatic indices in the Republic of Moldova (1960–2012): Consequences for tourism. Boletín Asoc. Geógrafos Españoles 2018, 77, 521–548. [Google Scholar] [CrossRef]
  109. Mihăilă, D.; Bistricean, P.I. The suitability of Moldova climate for balneary-climatic tourism and outdoor activities-a study based on the Tourism Climate Index. Present Environ. Sustain. Dev. 2018, 12, 263–282. [Google Scholar] [CrossRef]
  110. Mihăilă, D.; Bistricean, P.I.; Briciu, A.E. Assessment of the climate potential for tourism. Case study: The North-East Development Region of Romania. Theor. Appl. Climatol. 2019, 137, 601–622. [Google Scholar] [CrossRef]
  111. Roșu, C.; Mihăilă, D.; Bistricean, P.I. Evaluation of the bioclimate of submontane resorts located between Sucevița and Slănic Moldova based on the THI index. Geo Rev. 2022, 32, 14–28. [Google Scholar]
  112. Marić Stanković, A.; Radonjić, I.; Petković, M.; Divnić, D. Climatic Elements as Development Factors of Health Tourism in South Serbia. Sustainability 2022, 14, 15757. [Google Scholar] [CrossRef]
  113. Mihăilă, D.; Bistricean, P.I.; Gaceu, R.O.; Emandi, E.M.; Mihăilă, E.V.; Horodnic, V.D. A bioclimatic evaluation of sustainable tourist activities in western Romania. Heliyon 2024, 10, e29510. [Google Scholar] [CrossRef] [PubMed]
  114. Kovács, A.; Molnár, G.; Megyeri-Korotaj, O.A. Projected climate suitability for Hungarian tourism in the 21st century: Application of the Holiday Climate Index and modified Tourism Climate Index. Int. J. Biometeorol. 2025, 69, 1429–1442. [Google Scholar] [CrossRef] [PubMed]
Figure 1. Geographical location of the Vâlcea Subcarpathians. (a) The geographical position of the Vâlcea Subcarpathians in regional context; (b) the geographical position of the Vâlcea Subcarpathians within Romania. Source: author-processed data using ArcGIS 10.7.2.
Sustainability 17 06590 g001
Figure 2. Map of relief units and subunits. Source: author-processed data using ArcGIS 10.7.2.
Sustainability 17 06590 g002
Figure 3. Administrative–territorial units in the Vâlcea Subcarpathians. Source: author-processed data using ArcGIS 10.7.2.
Sustainability 17 06590 g003
Figure 4. Map of reserves/protected areas of the Vâlcea Subcarpathians. Source: author-processed data using ArcGIS 10.7.2.
Sustainability 17 06590 g004
Figure 5. Locations of spa tourist resorts in the Vâlcea Subcarpathians. Source: author-processed data using ArcGIS 10.7.2.
Sustainability 17 06590 g005
Figure 6. Tourist arrivals in the spa resorts of the Vâlcea Subcarpathians. Source: author-processed data using NIS [71].
Sustainability 17 06590 g006
Table 1. Hypotheses, research questions and variables used.
HypothesisResearch QuestionVariables Used
H1. There is a significant relationship between the age range of tourists and the frequency of visits to spa resorts in the Vâlcea Subcarpathians.How does the age range of tourists influence the frequency of visits to the spa resorts in the Vâlcea Subcarpathians?Age range of tourists
Frequency of visits to spa resorts
H2. The perception of the quality of services at spa resorts differs significantly depending on the gender of tourists.Are there significant differences in the perception of the quality of services in the spa resorts in the Vâlcea Subcarpathians between men and women?Tourist gender
Perception of service quality
H3. The level of education of tourists significantly influences the information sources used to plan visits to spa resorts.How does the level of education of tourists influence the information sources used to plan visits to the spa resorts in the Vâlcea Subcarpathians?Tourists’ education level
Sources of information used
H4. The labor market status of tourists is associated with the average duration of trips to the spa resorts in the Vâlcea Subcarpathians.How is the labor market status of tourists associated with the average duration of trips to the spa resorts in the Vâlcea Subcarpathians?Tourists’ labor market status
Average trip duration
H5. There is a significant difference between the residential environment of tourists and the frequency of visits to spa resorts.How does the frequency of visits to spa resorts vary depending on the tourists’ area of residence in the Vâlcea Subcarpathians?Tourists’ residential environment
Frequency of visits to spa resorts in the Vâlcea Subcarpathians
H6. There is a significant difference in the frequency of visits to the spa resorts in the Vâlcea Subcarpathians between tourists who have previously visited these resorts and those who are visiting them for the first time.Are there differences in the frequency of visits to the spa resorts in the Vâlcea Subcarpathians between tourists who have visited previously and those visiting them for the first time?Previous visiting experience (yes/no)
Frequency of visits to spa resorts in the Vâlcea Subcarpathians
H7. The residential environment of tourists influences why they choose to visit the Vâlcea Subcarpathians.How does the residential environment of tourists influence why they choose to visit the Vâlcea Subcarpathians?Tourists’ living environment
Reasons for visiting spa resorts
H8. The frequency of visits to spa resorts in the Vâlcea Subcarpathians is associated with participation in cultural activities.Is there an association between the frequency of visits to spa resorts and participation in cultural activities?Frequency of visits to spa resorts
Participation in cultural activities (yes/no)
H9. The average travel time to the spa resorts in the Vâlcea Subcarpathians differs significantly depending on the means of transport used.How does the average travel time to spa resorts vary depending on the means of transport used?Means of transport used
Average journey time
H10. The information sources used influence why tourists choose to visit the Vâlcea Subcarpathians.How do the information sources used influence why tourists choose to visit the Vâlcea Subcarpathians?Sources of information used
Reasons for visiting spa resorts
H11. The vacation planning method influences why tourists choose to visit the Vâlcea Subcarpathians.How does the vacation planning method influence why tourists choose to visit the Vâlcea Subcarpathians?Vacation planning method
Reasons for visiting spa resorts
H12. The reason for visiting the spa resorts in the Vâlcea Subcarpathians influences the frequency of visits.How does the reason for visits influence the frequency of visits to spa resorts in the Vâlcea Subcarpathians?Reason for visits
Frequency of visits
H13. Participation in cultural activities at spa resorts influences the average duration of trips.Is there an association between participation in cultural activities and the average duration of trips to spa resorts in the Vâlcea Subcarpathians?Participation in cultural activities (yes/no)
Average duration of trips
Source: author-processed data using Microsoft Excel.
Table 2. Assigning a statistical method for testing each hypothesis.
HypothesisStatistical Method Used
H1. There is a significant relationship between the age range of tourists and the frequency of visits to the spa resorts in the Vâlcea Subcarpathians.Chi-Square Test
H2. The perception of the quality of services at spa resorts differs significantly depending on the gender of tourists.Independent Samples t-Test
H3. The level of education of tourists significantly influences the information sources used to plan visits to spa resorts.Chi-Square Test
H4. The labor market status of tourists is associated with the average duration of trips to the spa resorts in the Vâlcea Subcarpathians.Analysis of Variance (ANOVA)
H5. There is a significant difference between the residential environment of tourists and the frequency of visits to spa resorts.Chi-Square Test
H6. There is a significant difference in the frequency of visits to the spa resorts in the Vâlcea Subcarpathians between tourists who have previously visited these resorts and those who are visiting them for the first time.Independent Samples t-Test
H7. The residential environment of tourists influences why they choose to visit the Vâlcea Subcarpathians.Chi-Square Test
H8. The frequency of visits to spa resorts in the Vâlcea Subcarpathians is associated with participation in cultural activities.Chi-Square Test
H9. The average duration of trips to the spa resorts in the Vâlcea Subcarpathians differs significantly depending on the means of transport used.Analysis of Variance (ANOVA)
H10. The information sources used influence why tourists choose to visit the Vâlcea Subcarpathians.Analysis of Variance (ANOVA)
H11. The vacation planning method influences why tourists choose to visit the Vâlcea Subcarpathians.Chi-Square Test
H12. The reason for visiting the spa resorts in the Vâlcea Subcarpathians influences the frequency of visits.Analysis of Variance (ANOVA)
H13. Participation in cultural activities at spa resorts influences the average duration of trips.Analysis of Variance (ANOVA)
Source: author-processed data using Microsoft Excel.
Table 3. Distribution of frequency of visits to spa resorts in the Vâlcea Subcarpathians according to the age range of tourists.
Frequency of Visits to Spa Resorts in the Vâlcea SubcarpathiansTotal
123
Age range of tourists1757284
297306133
31588412254
43020151
Total36014121522
Source: author-processed data using SPSS.
Table 4. Chi-Square test for the relationship between the age range of tourists and the frequency of visits to the spa resorts in the Vâlcea Subcarpathians.
ValuedfAsymp. Sig. (2-Sided)
Pearson Chi-Square27.360 (a)60.000
Likelihood Ratio30.76960.000
Linear-by-Linear Association16.85910.000
N of Valid Cases522
(a) Two cells (16.7%) had an expected count of less than 5. The minimum expected count was 2.05. Source: author-processed data using SPSS.
Table 5. Descriptive statistics for information sources used for planning visits to spa resorts according to tourist gender.
Tourist GenderNMeanStd. DeviationStd. Error Mean
Information sources used for planning visits to spa resorts11662.821.8890.147
23562.411.6680.088
Source: author-processed data using SPSS.
Table 6. Independent samples t-test on information sources used for planning visits to spa resorts according to tourists’ gender.
Levene’s Test for Equality of Variancest-Test for Equality of Means
FSig.tdfSig. (2-Tailed)Mean DifferenceStd. Error Difference95% Confidence Interval of the Difference
LowerUpper
Information sources used for planning visits to spa resortsEqual variances assumed13.7330.0002.5175200.0120.4120.1640.0900.733
Equal variances not assumed 2.407289.1010.0170.4120.1710.0750.749
Source: author-processed data using SPSS.
Table 7. Distribution of information sources used for planning visits to spa resorts in the Vâlcea Subcarpathians, depending on the level of education of tourists.
Information Sources Used for Planning
Visits to Spa Resorts
Total
1234567
Tourists’ education level128018311152
2434418166091
31981735597000379
Total26921408589171522
Source: author-processed data using SPSS.
Table 8. Chi-Square test for the relationship between tourists’ education level and information sources used for planning visits to spa resorts.
ValuedfAsymp. Sig. (2-Sided)
Pearson Chi-Square88.274 (a)120.000
Likelihood Ratio71.392120.000
Linear-by-Linear Association4.86110.027
N of Valid Cases522
(a) Eight cells (38.1%) had an expected count of less than 5. The minimum expected count was 0.10. Source: author-processed data using SPSS.
Table 9. ANOVA analysis of the average duration of trips to spa resorts in the Vâlcea Subcarpathians depending on labor market status.
Sum of SquaresdfMean SquareFSig.
Between Groups19.16244.79012.3850.000
Within Groups199.9745170.387
Total219.136521
Source: author-processed data using SPSS.
Table 10. Distribution of frequency of visits to spa resorts in the Vâlcea Subcarpathians depending on the tourists’ area of residence.
Frequency of Visits to Spa Resorts in the Vâlcea SubcarpathiansTotal
1231
Tourists’ living environment12249217333
2136494189
Total36014121522
Source: author-processed data using SPSS.
Table 11. Chi-Square test for the relationship between the residential environment of tourists and the frequency of visits to the spa resorts in the Vâlcea Subcarpathians.
ValuedfAsymp. Sig. (2-Sided)
Pearson Chi-Square3.191 (a)20.203
Likelihood Ratio3.47320.176
Linear-by-Linear Association2.30310.129
N of Valid Cases522
(a) No cells (0.0%) had an expected count of less than 5. The minimum expected count was 7.60. Source: author-processed data using SPSS.
Table 12. Group statistics on the frequency of visits to spa resorts in the Vâlcea Subcarpathians according to previous visit experience.
Previous Experience Visiting Spa Resorts in the Vâlcea SubcarpathiansNMeanStd. DeviationStd. Error Mean
Frequency of visits to spa resorts in the Vâlcea Subcarpathians14961.370.5640.025
2261.000.0000.000
Source: author-processed data using SPSS.
Table 13. Independent samples test for frequency of visits to spa resorts in the Vâlcea Subcarpathians according to previous visit experience.
Levene’s Test for Equality of Variancest-Test for Equality of Means
FSig.tdfSig. (2-Tailed)Mean DifferenceStd. Error Difference95% Confidence Interval of the Difference
LowerUpper
Frequency of visits to spa resorts in the Vâlcea SubcarpathiansEqual variances assumed90.5800.0003.3325200.0010.3690.1110.1510.586
Equal variances not assumed 14.568495.0000.0000.3690.0250.3190.419
Source: author-processed data using SPSS.
Table 14. Reasons for visiting spa resorts depend on the tourists’ area of residence.
Reasons for Visits to Spa ResortsTotal
1234567
Tourists’ residential environment157114792331209333
2256849162119189
Total8218212839522118522
Source: author-processed data using SPSS.
Table 15. Chi-Square test for the influence of the residential environment on the reasons for visiting spa resorts.
ValuedfAsymp. Sig. (2-Sided)
Pearson Chi-Square12.762 (a)60.047
Likelihood Ratio15.70260.015
Linear-by-Linear Association0.04610.830
N of Valid Cases522
(a) No cells (0.0%) had an expected count of less than 5. The minimum expected count was 6.52. Source: author-processed data using SPSS.
Table 16. Distribution of participation in cultural activities in the spa resorts of the Vâlcea Subcarpathians according to the frequency of visits.
Participation in Cultural Activities at Spa ResortsTotal
12345678
Frequency of visits to spa resorts in the Vâlcea Subcarpathians121448261115161218360
291131662580141
310240005021
Total31563461717212518522
Source: author-processed data using SPSS.
Table 17. Chi-Square test for the relationship between the frequency of visits to spa resorts in the Vâlcea Subcarpathians and participation in cultural activities.
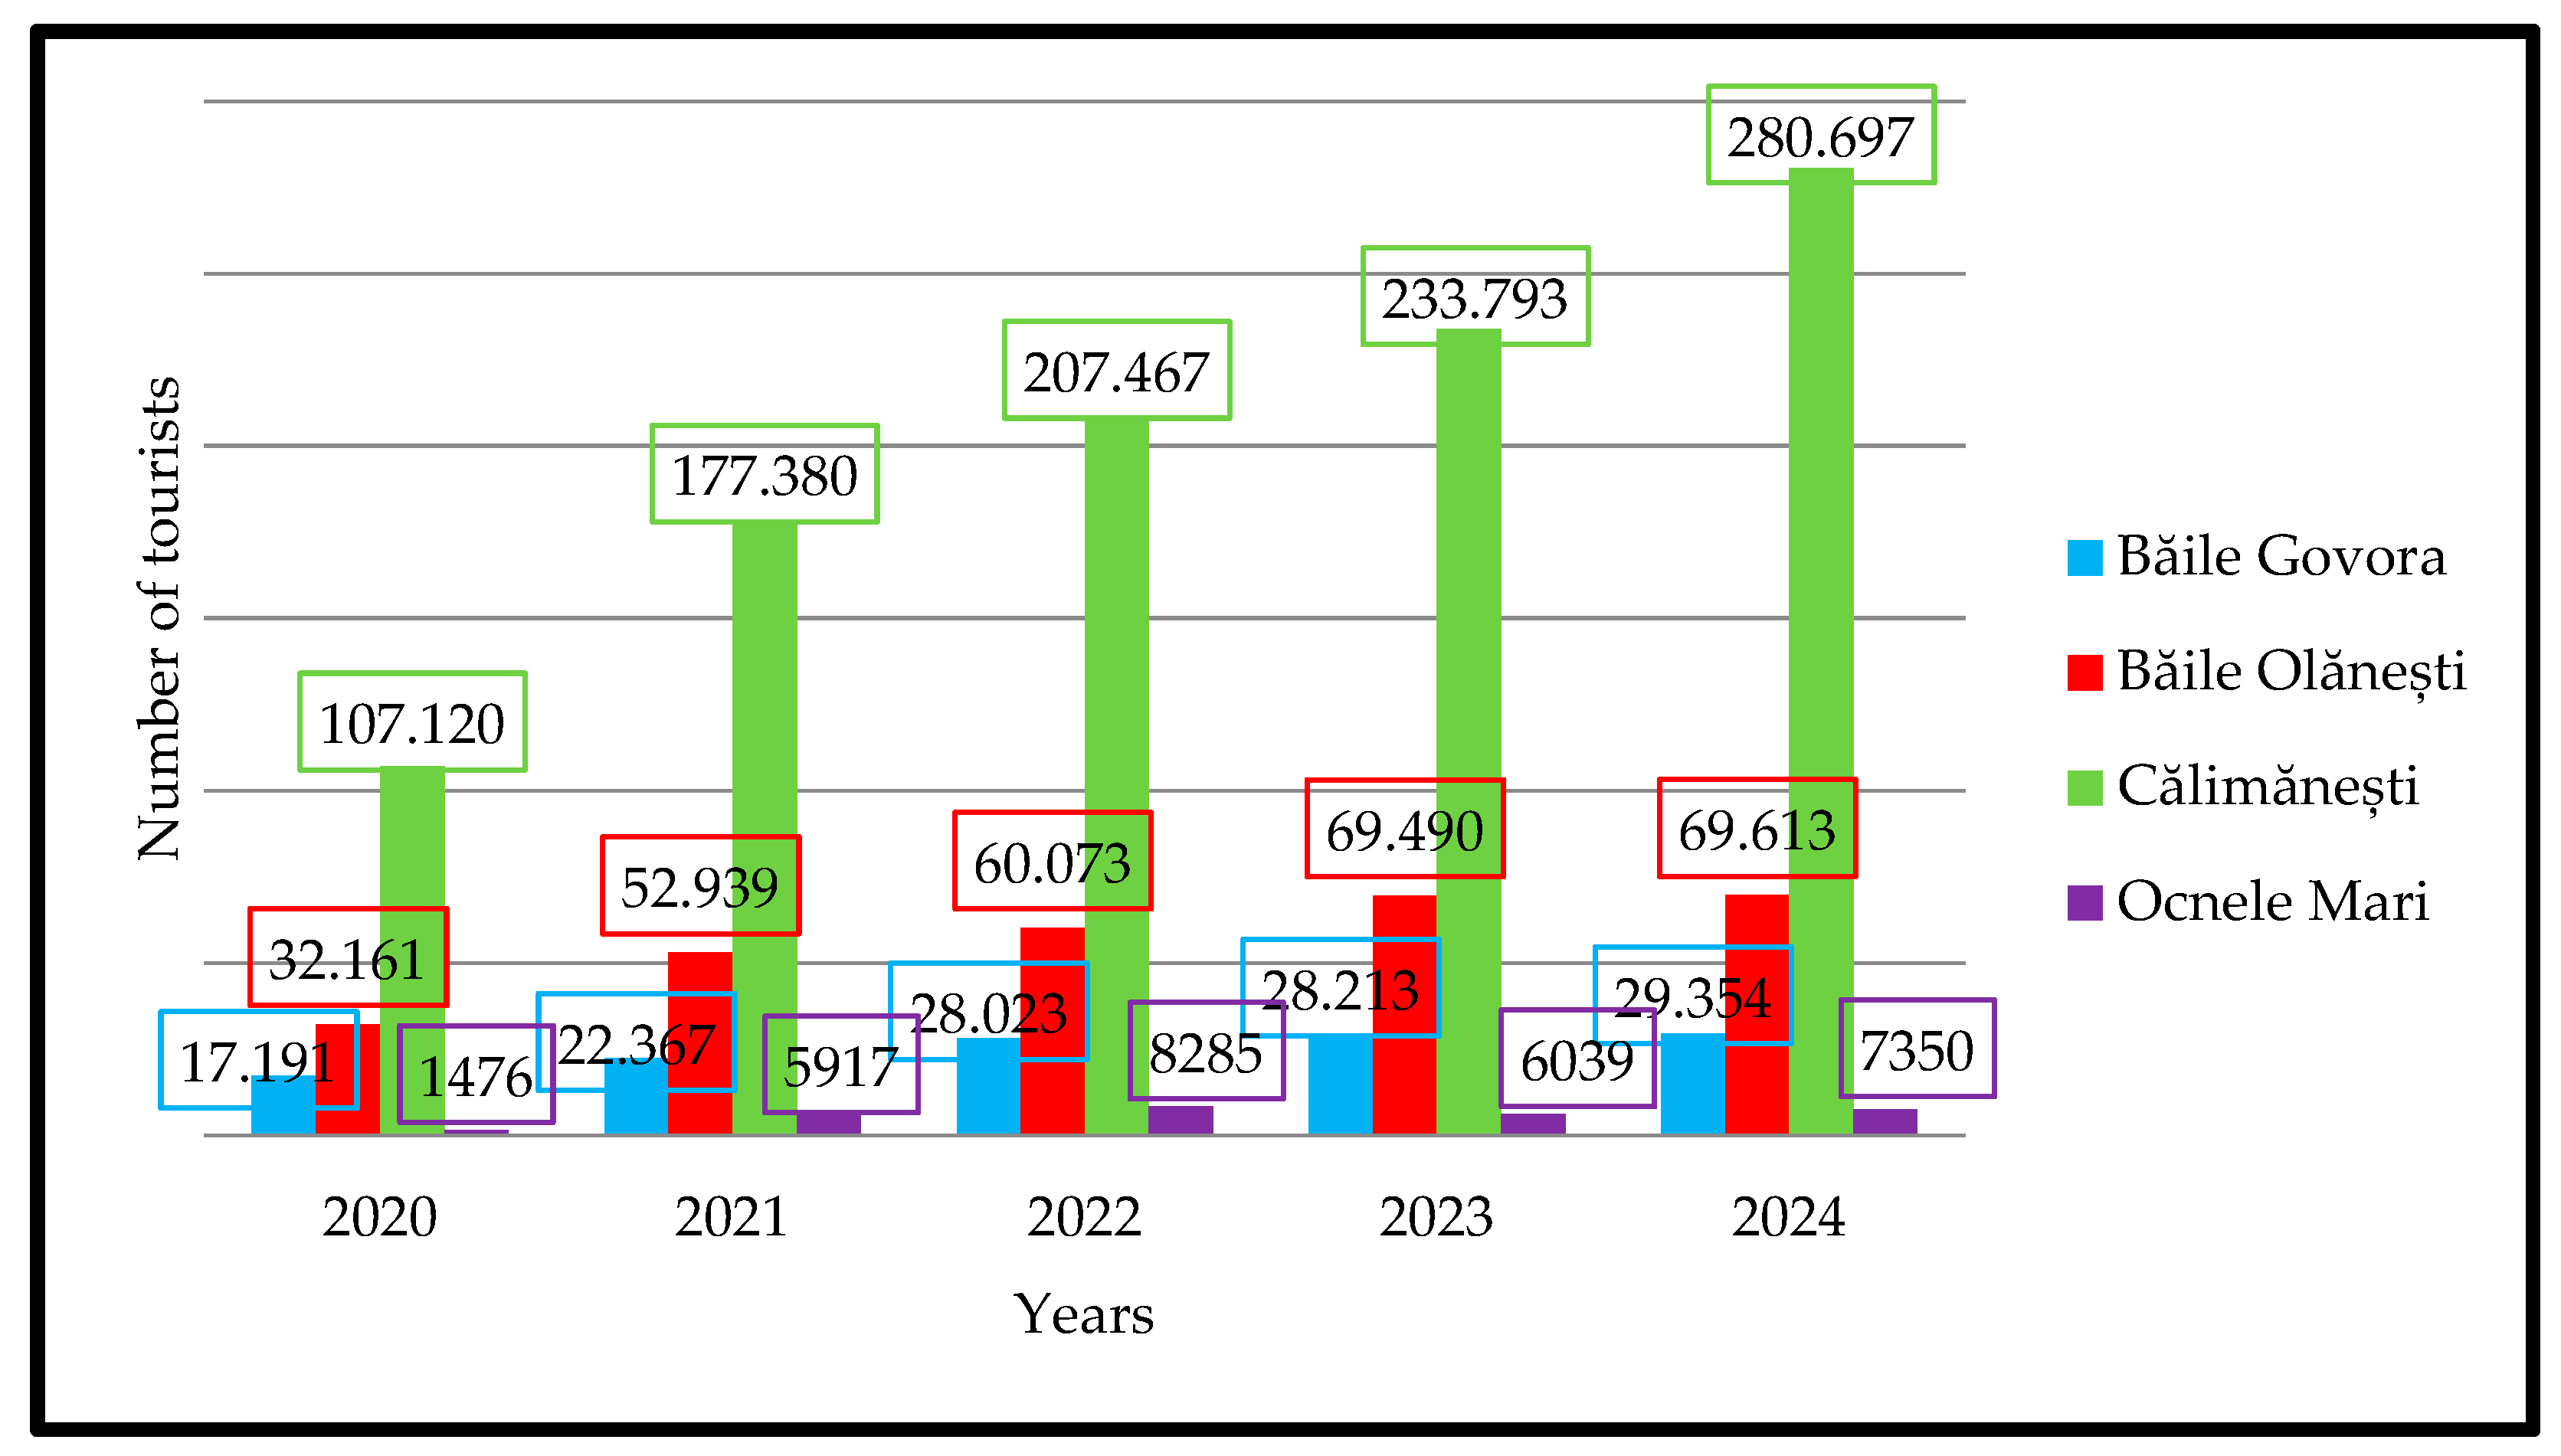
ValuedfAsymp. Sig. (2-Sided)
Pearson Chi-Square38.211 (a)140.000
Likelihood Ratio37.813140.001
Linear-by-Linear Association0.04810.827
N of Valid Cases522
(a) Ten cells (41.7%) had an expected count of less than 5. The minimum expected count was 0.68. Source: author-processed data using SPSS.
Table 18. ANOVA of the average duration of trips to the spa resorts in the Vâlcea Subcarpathians depending on the means of transport used.
Sum of SquaresdfMean SquareFSig.
Between Groups11.98733.9969.9910.000
Within Groups207.1495180.400
Total219.136521
Source: author-processed data using SPSS.
Table 19. ANOVA analysis of the reason for visits to spa resorts.
Sum of SquaresdfMean SquareFSig.
Between Groups329.330654.88831.5550.000
Within Groups895.8125151.739
Total1225.142521
Source: author-processed data using SPSS.
Table 20. Distribution of reasons for visits to spa resorts in the Vâlcea Subcarpathians depending on the vacation planning method.
Reasons for Visits to Spa ResortsTotal
1234567
The method of planning a vacation to a spa resort1781601233446190460
24225562044
30000001818
Total8218212839522118522
Source: author-processed data using SPSS.
Table 21. Chi-Square test for the relationship between vacation planning method and reasons for visits to spa resorts in the Vâlcea Subcarpathians.
ValueDfAsymp. Sig. (2-Sided)
Pearson Chi-Square531.519 (a)120.000
Likelihood Ratio166.552120.000
Linear-by-Linear Association89.09010.000
N of Valid Cases522
(a) Ten cells (47.6%) had an expected count of less than 5. The minimum expected count was 0.62. Source: author-processed data using SPSS.
Table 22. ANOVA analysis of the frequency of visits to spa resorts in the Vâlcea Subcarpathians.
Sum of SquaresdfMean SquareFSig.
Between Groups9.50261.5845.3890.000
Within Groups151.3435150.294
Total160.845521
Source: author-processed data using SPSS.
Table 23. ANOVA analysis of the average duration of trips to the spa resorts in the Vâlcea Subcarpathians.
Sum of SquaresdfMean SquareFSig.
Between Groups18.15372.5936.6320.000
Within Groups200.9835140.391
Total219.136521
Source: author-processed data using SPSS.
Disclaimer/Publisher’s Note: The statements, opinions and data contained in all publications are solely those of the individual author(s) and contributor(s) and not of MDPI and/or the editor(s). MDPI and/or the editor(s) disclaim responsibility for any injury to people or property resulting from any ideas, methods, instructions or products referred to in the content.