1. Introduction
The transport industry in the modern world is considered by many researchers from different points of view—at both regional and city levels, scientists are interested in issues related to logistics, population mobility, ecology, digitalization, and safety.
In 2025, the national project “Infrastructure for Life” appeared in Russia, one of the initiatives of which is road safety. The goal of this initiative is to reduce the number of road accidents and deaths because of road accidents by 1.5 times by 2030, which indicates the relevance of considering transport safety as a subject area of research.
Automated transport management systems are used to ensure monitoring and control of the traffic situation. At the same time, in the field of road safety, the construction of models focused not on operational, but on strategic planning is not sufficiently developed—in some studies, econometric models and machine learning models are considered, but they are not brought together into a general system.
This suggests that the creation of a model that will be the basis for the development of recommendations for improving road safety at the regional level is an urgent task.
Thus, the purpose of this study is to create a comprehensive model of road safety in the regions of the Russian Federation for the development of recommendations for the formation of a strategy for improving safety.
To achieve this goal, the following tasks were carried out:
Building a rating of the regions of the Russian Federation in terms of road safety.
Formation of a system of indicators that affect the level of road safety, based on econometric modeling.
Assessment of the significance of indicators and construction of a predictive model of the level of road safety using machine learning methods.
Construction of a simulation model of road safety based on the model of system dynamics.
Development of a model for making management decisions to improve the transport safety of the regions of the Russian Federation.
Development of recommendations for the formation of a strategy for improving safety based on the scenario approach.
The object of the research is the road safety of the regions of the Russian Federation, and the subject is the models and methods of modeling road safety.
Road safety is an important area in the study of regional economy. Many researchers use characteristics reflecting road safety as indicators of sustainable socio-economic development of regions, since a reliable transport system allows you to ensure the accessibility of markets and the mobility of labor and services, as well as to minimize the number of accidents and emergencies, which can lead to negative consequences, both in the economy and in the social sphere. The study will focus on road safety.
Ensuring a high level of road safety requires considering various factors that affect it. At the same time, for a more reliable analysis, it is important to consider the specifics of each region, related to their economic, social, and environmental development.
Road safety is an important aspect in the development of transport infrastructure. Emphasis is placed on the importance of an integrated approach to risk assessment and the introduction of modern technologies. Studies on this topic use statistical and econometric methods to analyze accident data. The accident rate is measured in the number of accidents per 1000 km of road and the number of victims in road accidents [
1,
2,
3,
4].
The key indicators of the effectiveness of the measures taken in this case are the number of prevented accidents and the response time to incidents [
5,
6,
7].
Another area of research is the evaluation of the use of autonomous cars on roads. Authors claim that such technologies can significantly reduce the number of accidents and improve overall road safety. Safety indicators include the frequency of accidents involving autonomous vehicles and comparison with traditional vehicles [
8,
9].
The territory of Russia is characterized by many regions and a wide geography, which has an impact on the transport sector. The clustering of Russian regions by their level of road safety and considering the development of transport infrastructure is a method that can group regions with similar characteristics for the subsequent development of comprehensive strategies to increase road safety [
10,
11].
Several studies have highlighted factors such as the availability of transport services, the quality of the road network, socio-economic development, and population density. These factors are the main criteria for clustering regions and create the basis for regional transport strategies [
12,
13,
14].
Studies show that regions with high population density and heavy traffic have a higher accident rate. This is due to many factors, including high competition for road space, insufficient attention to the state of infrastructure, and insufficient safety measures [
15,
16]. Several studies have analyzed data on transport accidents and economic indicators to identify “risk zones” in regional transport systems.
The most popular factors used in these studies are presented in
Table 1.
These factors formed the basis of the specification for this study.
In terms of research and modeling of regional road safety, several approaches can be distinguished.
Studies of the current state of road safety in the regions are most often carried out through cluster analysis.
The use of the cluster approach makes it possible to group regions with an increased level of accidents and high traffic congestion. This makes it possible to develop targeted measures for specific clusters; for example, the allocation of additional funds for road repairs in areas with a high accident rate or the development of safety improvement programs [
17,
18,
19].
Clustering also considers regional features that may affect road safety [
20,
21]. For example, in regions with high unemployment, there may be an increase in the number of road accidents related to inexperienced drivers or lack of funds for car maintenance. Therefore, an important aspect of clustering is the ability to integrate various factors, which contributes to a deeper risk assessment [
22,
23,
24]. At the same time, it should be borne in mind that road safety depends not only on the condition of the roads themselves, but also on the behavior of road users, the level of education and culture of drivers, and on the work of law enforcement agencies [
25,
26,
27].
Clustering can be used to investigate the impact of specific factors on the security posture in different regions. Thus, in regions with developed public transport, there is a lower accident rate compared to regions where road transport is the only available option for transportation [
28]. Studies have shown that an increase in the number of public transport routes can reduce the total number of vehicles on the road and, accordingly, the accident rate [
29,
30].
Speaking about the determination of relationships between indicators, researchers use classical methods of econometrics (in particular, regression) [
31].
Regression models make it possible to assess the impact of various factors on the overall level of road safety. These can be both linear and nonlinear regression models. However, since most studies use panel data, the most used models are those that allow for the spatial specificity of the data. Panel data models allow you to consider both temporal and inter-regional variations. These can be generalized models, or models of fixed and random effects.
In addition, the use of machine learning methods in building regression models has recently become especially popular.
The most well-known methods are decision trees (and random forest as an ensemble of decision trees) and gradient boosting.
The transport industry can be called a complex but, in the light of this study, rather abstract system. With such data, it is possible to understand its structure and dynamics with the help of system dynamics models [
32,
33].
System dynamics is a method of modeling complex systems by studying and analyzing their structure and dynamics of change. From the point of view of road safety, this method can be used to analyze the systemic relationships between the factors that make up the road safety of a region (the number of accidents, the state of infrastructure, the behavior of road users, weather conditions, etc.).
In addition to various methods of modeling road safety, the use of road safety indicators is popular in the scientific community. A comprehensive consideration of approaches to the formation of road safety indicators makes it obvious that most of the classical studies have focused on the development and verification of composite indices and rating methods, without going beyond the framework of operational monitoring. For example, the ETSC report proposed unified metrics for assessing the frequency of accidents, the severity of consequences, and economic losses, which made it possible to conduct a comparative analysis across countries, but without building long-term management scenarios [
34]. A number of studies have used the RSDI index, which combines infrastructural, behavioral, and institutional factors with a well-thought-out system of normalization and distribution of weights, but it does not contain tools for strategic forecasting [
35,
36,
37].
The article in [
38] described in detail min-max procedures for normalization and calculation of weights based on the analysis of principal components, which significantly increases the accuracy of comparisons between regions with different levels of development. However, the model was static and was used only for retrospective analysis, such as the speed of response of emergency services, increasing the information content of the index by 15–20%. However, these works do not offer mechanisms for translating these assessments into strategic management decisions.
The article in [
39] proposed a method for expanding multi-criteria benchmarking through the use of DEA methods, to assess the effectiveness of expenditures on road accident prevention, which made it possible to identify the most and least effective national practices, but this method does not include a predictive module for assessing the consequences of new strategies. At the regional level, using the example of the Netherlands, the study showed how clustering, considering the density of the road network and socio-economic characteristics, makes it possible to build targeted measures for road repair and educational campaigns, but their recommendations were designed mainly for the next 1–2 years [
40].
Several studies have emphasized the need to include qualitative indicators, such as the level of automation of speed control and the readiness of emergency services, for a more complete understanding of risks [
41]. Finally, the studies in [
42,
43] presented an updated set of Safety Performance Indicators, which consider telemetry data, information from “smart” traffic lights, and other digital sources. At the same time, the main emphasis was on the standardization of the collection and analysis of operational data, and there were no tools provided for building multi-scenario strategic models.
Automated transport management systems (APCS) are actively used in Russia. I&C systems and their specialized versions are being developed to improve the efficiency, safety, and sustainability of road infrastructure in the operational management of traffic flows. These systems combine information from a variety of sources, which allows you to quickly make management decisions and optimize transport processes.
Thus, despite a rich toolkit for retrospective and short-term analysis, in the field of transport security, the creation of strategic models that combine econometric, machine learning, and system dynamics models into a single system has not been sufficiently developed. This emphasizes the relevance of developing a comprehensive model that can not only describe the current state but also predict the consequences of management decisions over the horizon of several years, which is a key innovation of the proposed study.
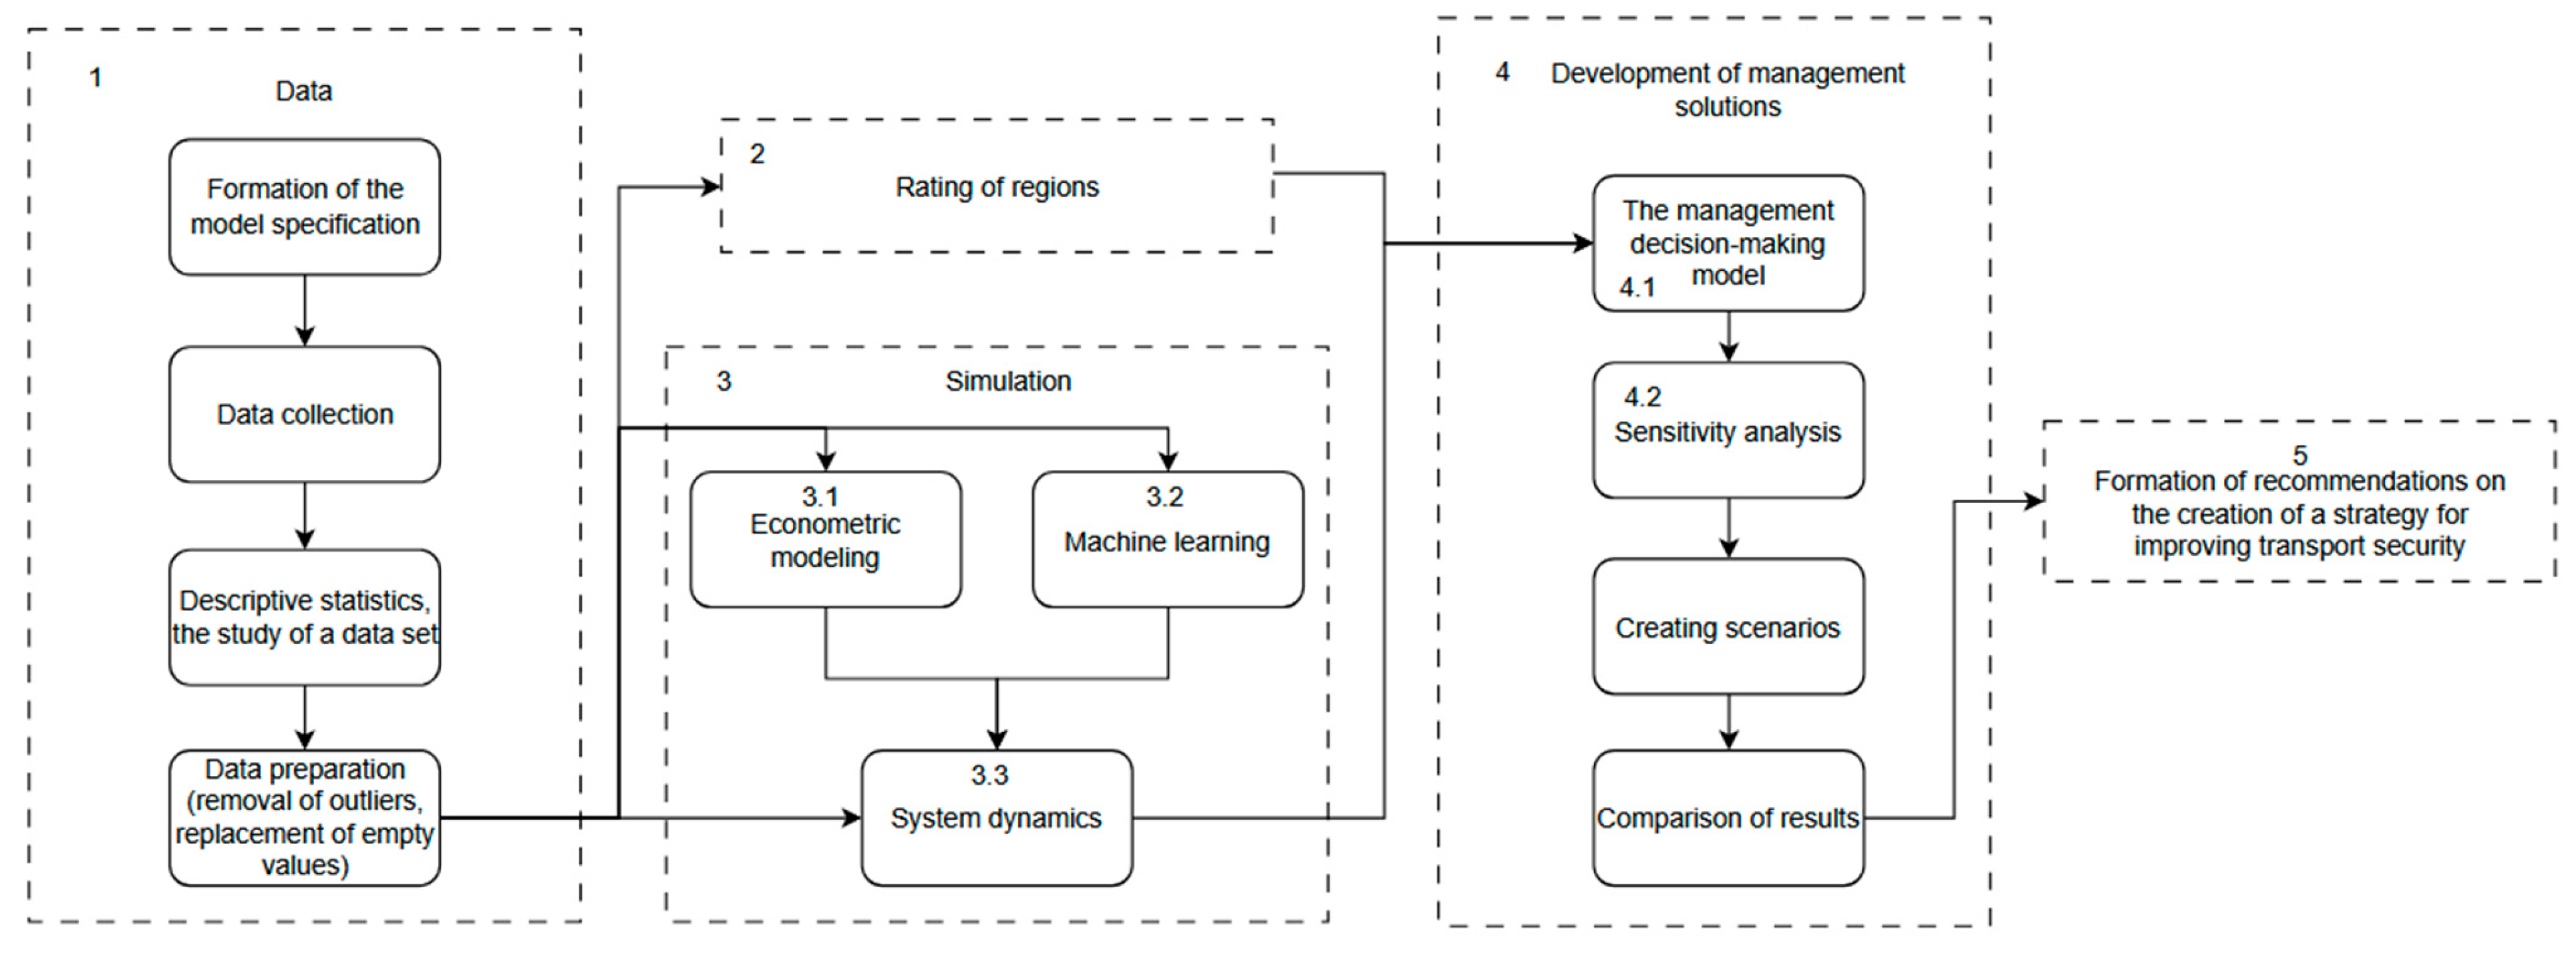
3. Results
3.1. Data
Based on the analysis of scientific sources, regulations, and specialized articles, a dataset was formed, which includes panel data. Information about these data is given in
Table 2.
The data were collected for 82 regions of Russia for the period from 2010 to 2023. Possible dependent variables in the study can be considered the “Accident rate” block—the number of road accidents, the number of deaths, and the number of injuries because of road accidents.
Independent factors were grouped into semantic blocks. The first block is the quality of road infrastructure. Two indicators are used here: the share of roads that meet regulatory requirements and the total length of roads in the region. These contribute to the improvement of transport connectivity, and on the other hand, create new risks, especially if there is insufficient control over the operation of roads in remote areas.
Demographic indicators cover the population, total fertility rate, and the size of the labor force. An increase in the population of a region, as a rule, leads to an increase in transport activity, which, in turn, can contribute to an increase in the number of accidents. Fertility and employment have an indirect impact on population movements: in regions with active population growth or a significant workload, the number of daily movements, including during peak hours, increases, which increases the risk of accidents.
Economic variables are represented by the level of the average per capita income of the population and the number of registered cars. It is assumed that income growth, on the one hand, stimulates motorization by increasing the density of vehicles on the roads, which can increase accident risks. On the other hand, growth in well-being can improve access to safer vehicles and develop a driving culture. However, the basic hypothesis is that a rapid growth in the number of cars, not accompanied by adequate development of road infrastructure, increases the accident rate.
The level of education is considered as a possible factor that can have a negative impact on the accident rate. The sample includes indicators of graduates with secondary vocational education, university graduates, and the number of postgraduate students.
The state of the health care system is considered through three indicators: the number of hospital beds, the capacity of outpatient clinics, and the workload of doctors (the number of population per specialist). These indicators reflect the availability and efficiency of medical care, on which the mortality rate in road accidents largely depends. In regions with a highly developed medical infrastructure, the chances of timely assistance to victims are higher, which reduces the mortality rate because of accidents.
The social activity and level of culture of the population is reflected in the number of visits to theaters, the availability of sports facilities, and tourist activity (the number of Russians who went on tours around the country). These variables characterize the degree of involvement of the population in cultural and leisure activities, which are also related to transport mobility. An increase in the number of trips on weekends and holidays, an increase in the flow of tourists, and an increase in leisure activity can increase the load on the transport network, especially with seasonal fluctuations. On the other hand, a high level of culture in everyday life should contribute to culture on the roads, which can lead to a decrease in accidents.
The level of technological development is estimated based on data on the number of advanced manufacturing technologies introduced, the number of fixed broadband users, and the number of connected mobile devices. These indicators can be considered, on the one hand, as a reflection of the potential for digitalization of the transport system and for increasing its manageability; on the other hand, as a possible source of distraction for road users (for example, the use of smartphones while driving), which can increase the likelihood of accidents.
Thus, the model includes both direct factors in accidents, such as the quality of roads and the number of vehicles, and indirect factors, such as demographic, social, educational, medical, and technological. This approach makes it possible to form a holistic picture and identify not only obvious, but also hidden dependencies between the state of various spheres of regional life and the level of road safety. As part of the model, several hypotheses were put forward about the positive and negative effects of the relevant factors, which were subject to subsequent empirical verification.
When modeling road safety using machine learning and econometrics, the number of accidents with victims was considered as the main dependent variable.
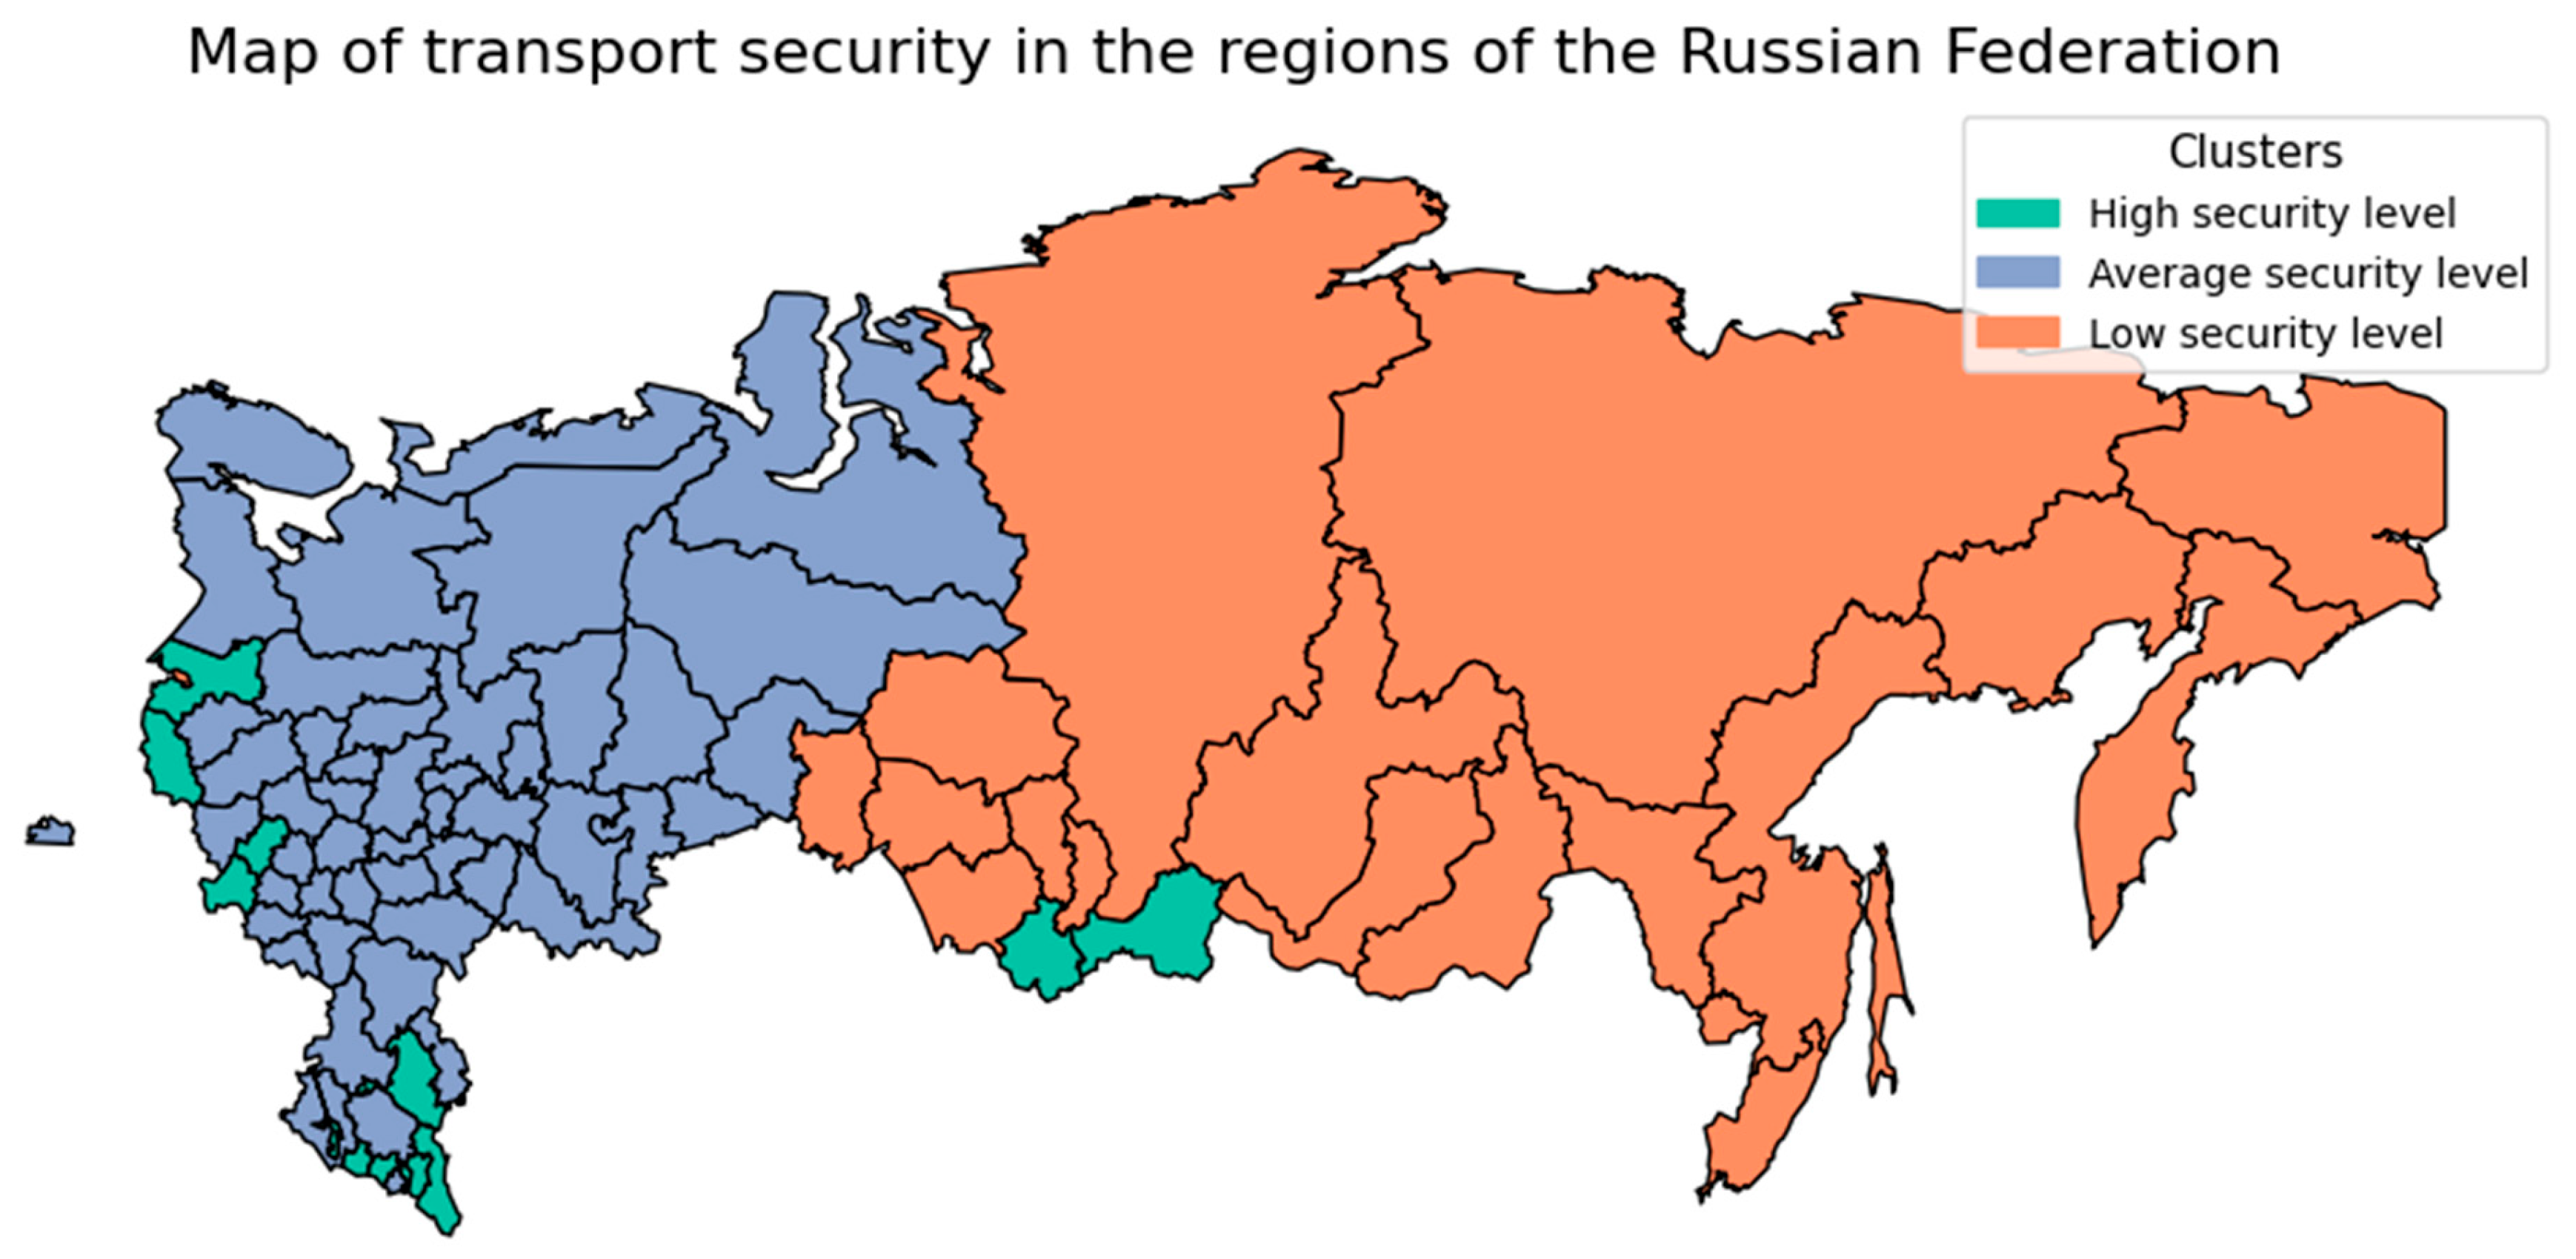
3.2. Rating of Regions
Based on the analysis, a rating of regions for road safety was created.
The ranked list was divided into three groups using clustering. The table shows the security index values and cluster labels for each region.
Based on the ranked values and cluster membership, the regions were grouped as follows:
- (1)
1–0.45—regions with a high level of road safety;
- (2)
0.44–0.24—regions with an average level of road safety;
- (3)
0.13–0—regions with a low level of road safety.
For clarity, the division of regions into groups was presented on a map (
Figure 2).
The analysis of the spatial distribution of the regions of Russia by the level of road safety, carried out based on cartographic data, allowed us to identify stable geographical patterns that reflect the specifics of the transport situation in the country.
Regions with a high level of road safety are mainly concentrated in the European part of Russia (North-West) and in the south of the country. These territories are distinguished by the sustainable development of transport infrastructure, high quality of the road surfaces, and modern technical equipment of traffic control systems. As a rule, a minimum number of road accidents are recorded here, and the work of control and security services is based on effective technologies and stable funding. Favorable economic and demographic conditions contribute to the improvement of the transport situation and the active implementation of innovative solutions in the field of security.
The regional group with a medium level of security covers the European part of the country. This group includes both subjects with signs of positive dynamics and those where systemic problems have not yet received due attention. This makes this group the most sensitive to management decisions and allows influencing the situation in a targeted manner.
The regions with the lowest road safety indicators are mainly located in the eastern part of the country—these are the subjects of Siberia, the Far East, and part of the republics of the North Caucasus. A common feature of these regions is a combination of difficult natural and climatic conditions, poor transport connectivity, and a lack of resources to maintain infrastructure in the proper condition. The high level of accidents here is often associated with the deterioration of the road network, a low level of automation, and difficulties in operational work to resolve the consequences of an accident. The unification of these regions into one cluster emphasizes the need for deeper integration of the eastern and southern territories into federal programs for the development of road safety.
It can be assumed that the distribution of regions in this way by levels of road safety is not accidental—it reflects a whole range of factors: from population density and the degree of automobilization to the state of road infrastructure and the level of regional management. Such a structure will make it possible to build more targeted and effective strategies: in some cases, it is necessary to modernize the road network, in others, an emphasis on prevention and education is required, and in some cases, support should be given to the results already achieved.
The visualization of data in the map highlights existing differences and serves as a basis for building clusters of regions with similar characteristics. This, in turn, opens opportunities for the formation of standard scenarios for improving safety, adapted to specific conditions. This approach makes it possible to move from a general assessment to targeted management of transport risks, forming strategic stability in the field of road safety throughout the country.
3.3. Econometric Modeling
To quantify the influence of exogenous factors on endogenous factors, econometric models were built that consider the structure of panel data.
The traffic_accidents variable was taken as the dependent variable.
Four econometric models were built for it:
It is worth noting that not all the variables identified at the beginning of the study are present in the models. After the first iteration of building models, it was found that some variables had little significance (too high p-value) and therefore using them in the model was impractical—they explained a very small part of the variance (or did not explain it at all) but made the model more cumbersome.
The remaining explanatory variables have a high level of significance—most are significant at the 1% level, as evidenced by three stars near the regression coefficient. The total p-value for all models is less than 0.05. This suggests that the null hypothesis that the coefficients are equal to zero in the case of independent variables can be rejected, there is a statistically significant relationship between the variables left, which means that the independent variables make a significant contribution to explaining the variability in the dependent variable.
Table 3 presents a comparison of the constructed models.
Although fixed-effects or random effects models are traditionally recommended for panel data analysis, this study decided to use the Pooled OLS model. This choice was due to both the specifics of the task and the results of empirical calculations.
Comparative analysis showed that the Pooled OLS model had the highest value of coefficient of determination (R2 = 0.8784), which indicates a high proportion of the explained variation in the dependent variable—the number of accidents in the Russian regions. For models with random and fixed effects, this indicator was significantly lower (R2 = 0.6463 and 0.6229, respectively, and when considering temporal and spatial effects—0.4160). Although R2 cannot be considered as the main criterion when choosing a model under the conditions of panel data, such a significant decrease in the explanatory power of alternative models made us think about the expediency of their use in this case.
The interpretability of the constant deserves special attention. In the Pooled OLS model, the constant was 582.97, which is in an adequate range of values, while in the fixed effects models, it reached extremely high values (4501.3 and 5187.6), which may have been due to the redistribution of part of the total variation into individual effects and indicate potential problems in the specification or the excessive rigidity of the model.
In addition, when using the Pooled OLS model, a larger number of statistically significant variables were preserved, including indicators of social infrastructure (“clinics”, “sport”), employment (“labor”), and income of the population (“income”). These variables lost their significance in the FE and RE models, which is probably because considering individual fixed effects “absorbs” part of the interregional variation, reducing the possibility of identifying stable patterns.
It is important to emphasize that the main goal of econometric modeling is not to build a predictive model, but to provide a meaningful analysis and interpretation of factors affecting the level of transport safety. From this point of view, the Pooled OLS model is more informative because it allows estimating the contribution of a wide range of variables, including those whose values are relatively stable over time but vary significantly between regions. It is these variables—reflecting infrastructural, social, and demographic features—that are of particular importance in the context of regional analysis.
One should also be aware of the limitations of panel methods. Fixed-effects models require a time series long enough to produce stable estimates. With limited data, this can lead to a decrease in statistical power and the loss of meaningful results. In this case, this was especially noticeable—when switching to the FE and RE models, entire blocks of variables that were critical from the point of view of the subject area lost their significance.
Thus, despite the known limitations of the Pooled OLS model, its use in this study was justified. It made it possible to obtain interpretable, logically justified coefficients, maintain the breadth of the analytical framework, and offer meaningful conclusions for the formation of regional transport policy. The Pooled OLS model was chosen as the main model precisely because, at this stage of the study, the priority was not to eliminate all possible sources of bias, but to identify and describe the key patterns underlying road safety in the Russian regions.
3.4. Machine Learning
As a machine learning method, a PDRF (Panel Data Random Forest) model was built, aimed at identifying patterns in the change in the number of road accidents under the influence of a combination of the socio-economic and infrastructural characteristics of the regions of the Russian Federation.
As in the construction of regressions in the econometric modeling block, a variable reflecting the number of registered accidents was chosen as the dependent variable. Independent variables are factors that characterize the socio-economic, demographic, cultural, and technological development of regions.
To assess the quality of the trained model, classical metrics were used: MSE, RMSE, MAE, and the coefficient of determination (R2).
The constructed model was characterized by sufficient accuracy and good quality.
The MSE was 30.44, which, given the specifics of the panel data and regional heterogeneity, can be regarded as an acceptable indicator. In the context of modelling quantitative social phenomena such as road traffic accidents, an MSE of less than 50 generally indicates a sufficient level of approximation.
The MAE was 4.20, which indicates a low level of prediction deviations in absolute terms. In situations where crash values are subject to seasonal fluctuations and random outliers, an MAE value below 5 indicates that the model is running steadily.
The R2 in the training sample was 0.970, indicating a high level of explained variance. More importantly, the R2 value in the test sample was 0.854, which indicates a good level of generalization and the model’s ability to work on previously unobserved data.
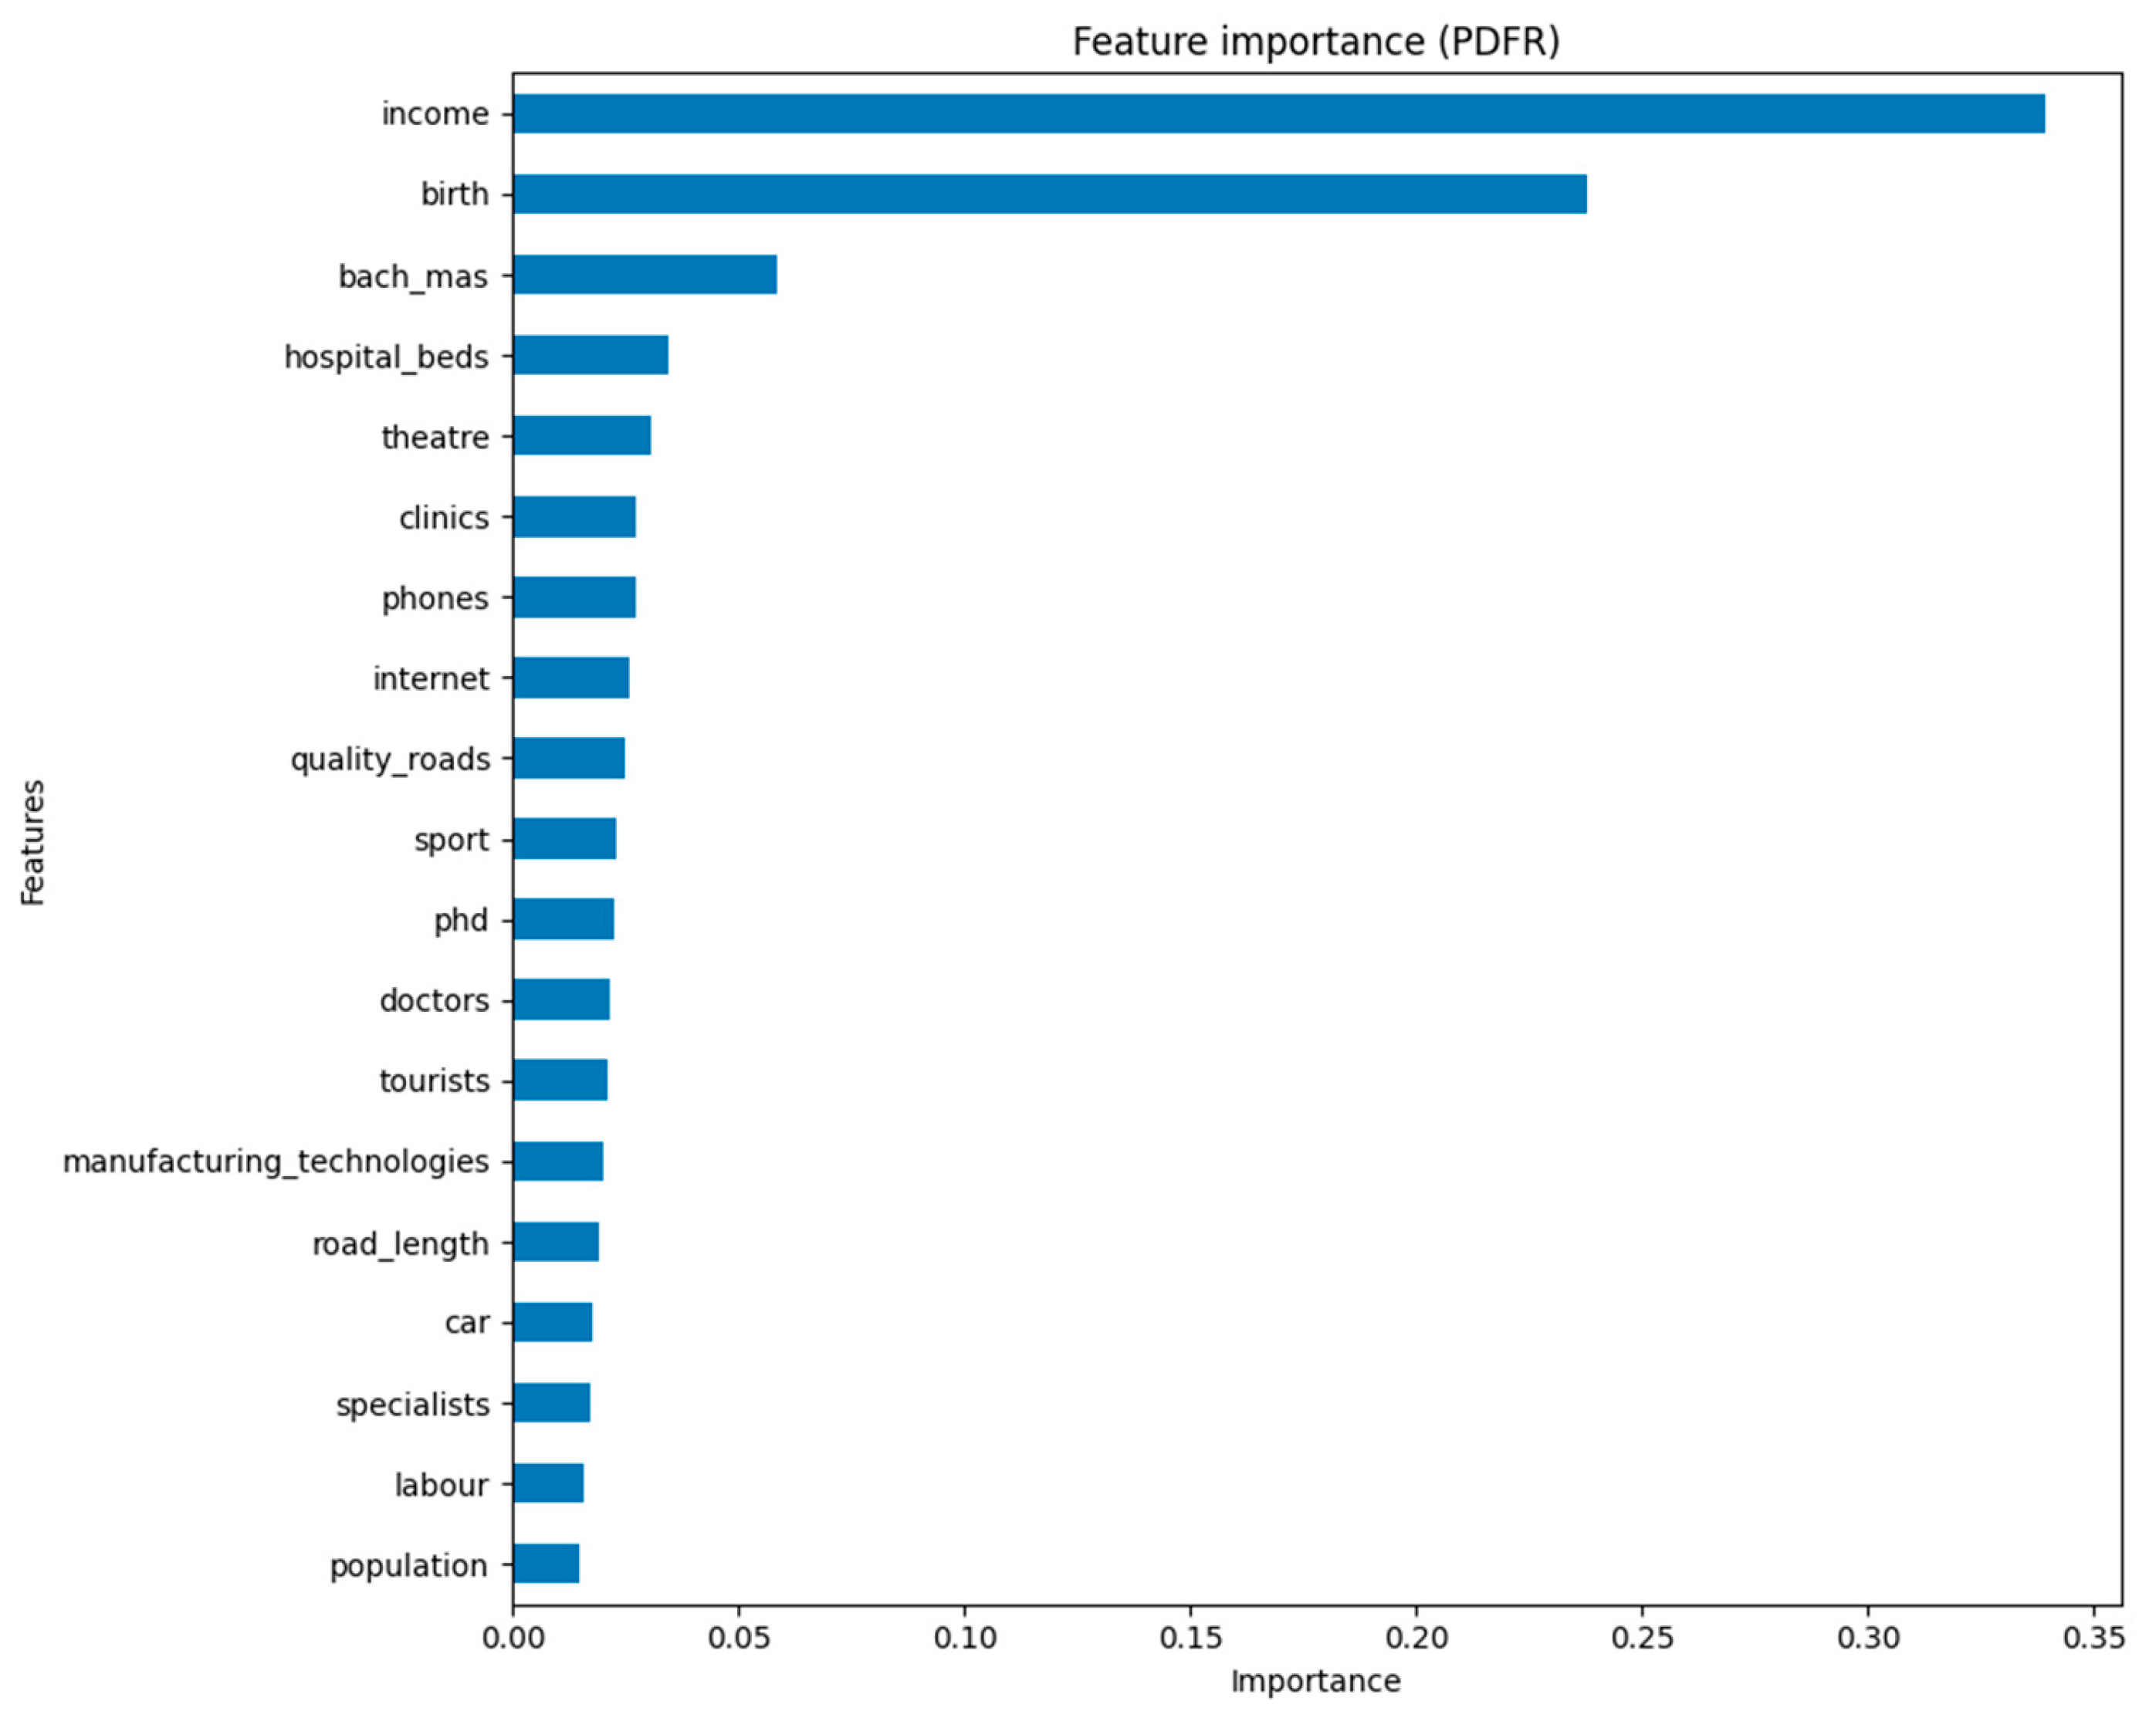
The analysis of the importance of features determined by the feature importance mechanism made it possible to identify the key factors that had the greatest impact on the number of accidents (
Figure 3).
The feature importance graph shows which factors play a key role in the formation of the number of road accidents in Russian regions. Such an analysis allows not only to identify statistical relationships, but also to assess the real significance of each feature within the framework of a predictive model.
In the first place in terms of the degree of influence was the income variable, which reflects the level of income of the population. Its value (0.339) was significantly higher than all the others, which indicates its decisive value. The increase in income can be associated with an increase in the number of cars, increased mobility, and, accordingly, an increase in the load on road infrastructure. But at the same time, higher revenues mean access to quality cars, the ability to service them in a timely manner, and potentially a higher level of responsibility behind the wheel.
The second most important factor was birth (birth rate, 0.238). This may indicate that in regions with active natural population growth, there is higher overall mobility, more families with children, and, as a result, more intensive transport activity. At the same time, growth in the birth rate is often characteristic of developing areas, where the level of infrastructure development may lag behind the needs of the population, which also increases the risks on the roads.
This was followed by the indicators related to education (the share of the population with higher education (bach_mas, 0.059) and the number of postgraduate students (Phd, 0.023).
Indicators characterizing the availability of medical and social services had some impact on the prediction of road accidents: the number of hospital beds (hospital_beds, 0.035), the number of clinics (0.027), and the number of doctors (0.022). These factors can be both indicators of the quality of emergency response to road accidents and indicators of the general level of social development of the region.
The presence of theaters (theatre, 0.031), sports infrastructure (sport, 0.023), and the influx of tourists (tourists, 0.021) indicated increased business and social activity in the region, increasing traffic flows, especially during rush hours and during public events.
The level of technological development, the length of roads, and the number of cars had an even smaller impact. These indicators directly or indirectly describe the availability and intensity of transport use, as well as the level of digital and transport infrastructure.
Thus, an analysis of the importance of signs demonstrated that road accidents are the result of a whole range of factors. Not only transport and road infrastructure, but also the socio-economic background, cultural life, demography, and level of education are significant variables. This emphasizes the need for an interdisciplinary approach to the analysis and management of road safety.
3.5. System Dynamics Model
The next step was to build a system dynamics model using iThink software (ver 9.1.3).
The basis for creating a system dynamics model is the relationship identified when building a regression model and a machine learning model. Modeling of road accidents requires an integrated approach that reflects the multifactorial nature of this phenomenon, and therefore the use of regression equations alone as a tool for developing recommendations and making decisions is insufficient.
The purpose of the model was to describe and predict the dynamics of the number of accidents in each region under the influence of other variables, which were combined into seven blocks. The main hypothesis was that the variables from each block affect the number of accidents, but at the same time, the value of the number of accidents affects the variables, forming feedback loops.
The hypothesis was partially confirmed at the stage of building a regression model, which showed the presence of stable relationships between the dependent variable and the independent variables.
In addition, the variables “Number of people killed in an accident” and “Number of people injured in an accident” were considered, which can also act as dependent variables. The construction of separate regression models for these factors seemed inappropriate, since they are strongly correlated with the number of accidents—the correlation coefficient of those killed in road accidents with the number of accidents was 0.88, and the correlation coefficient of those injured in road accidents with the number of accidents was 0.99.
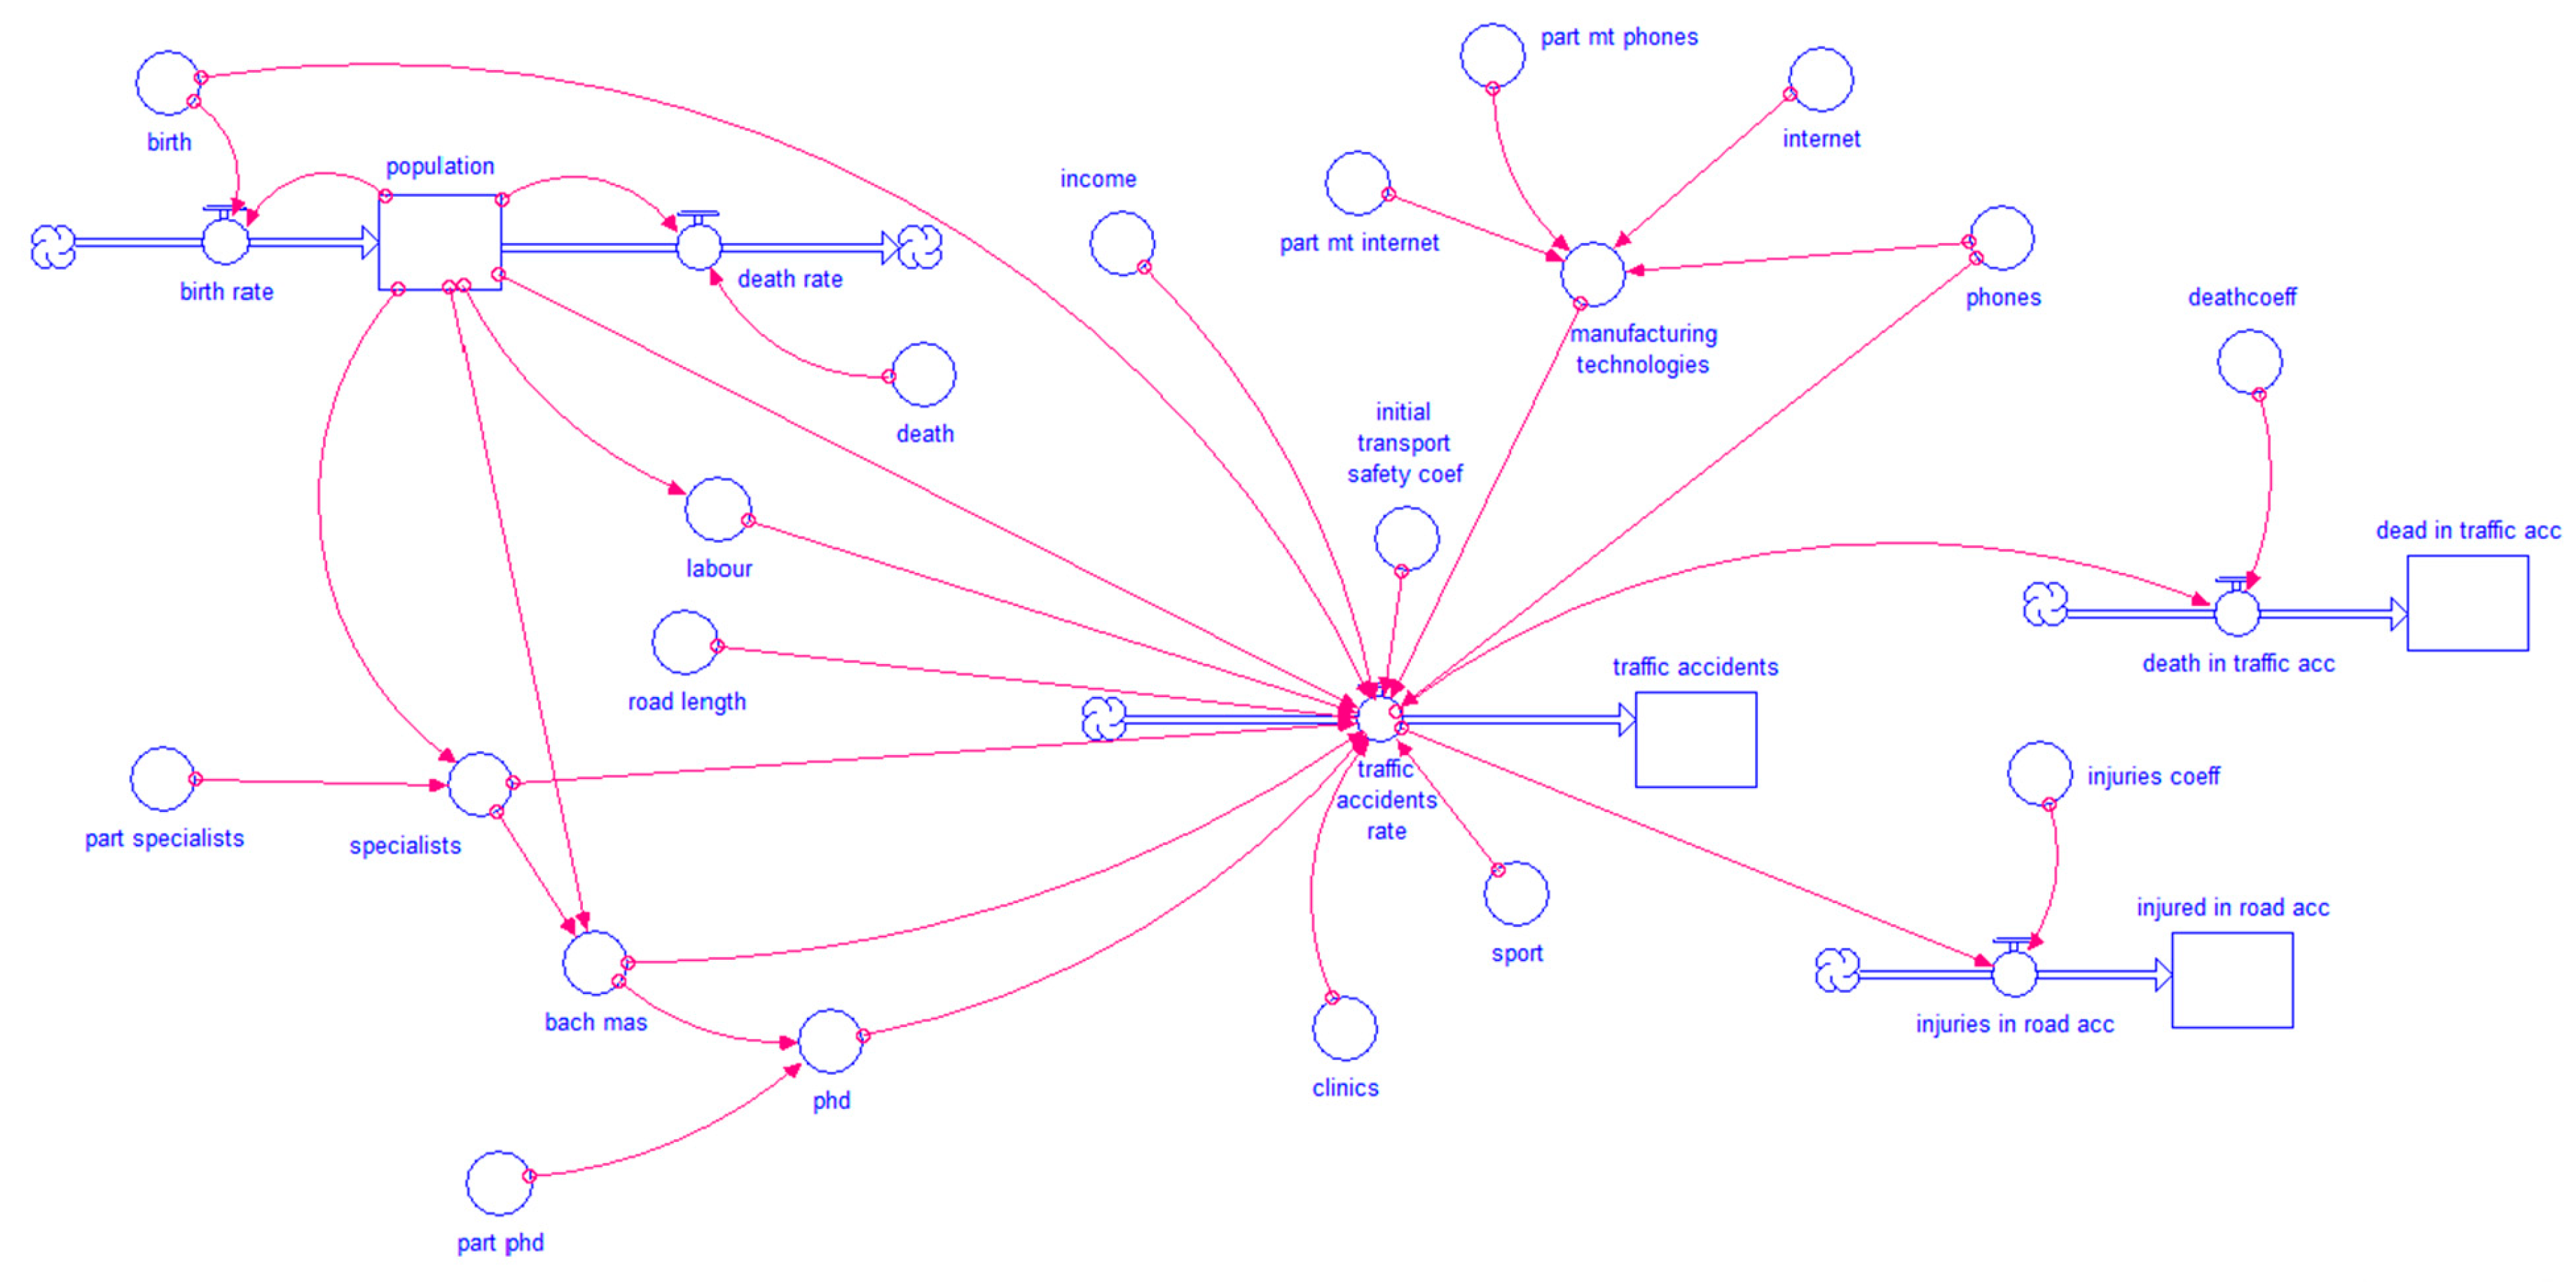
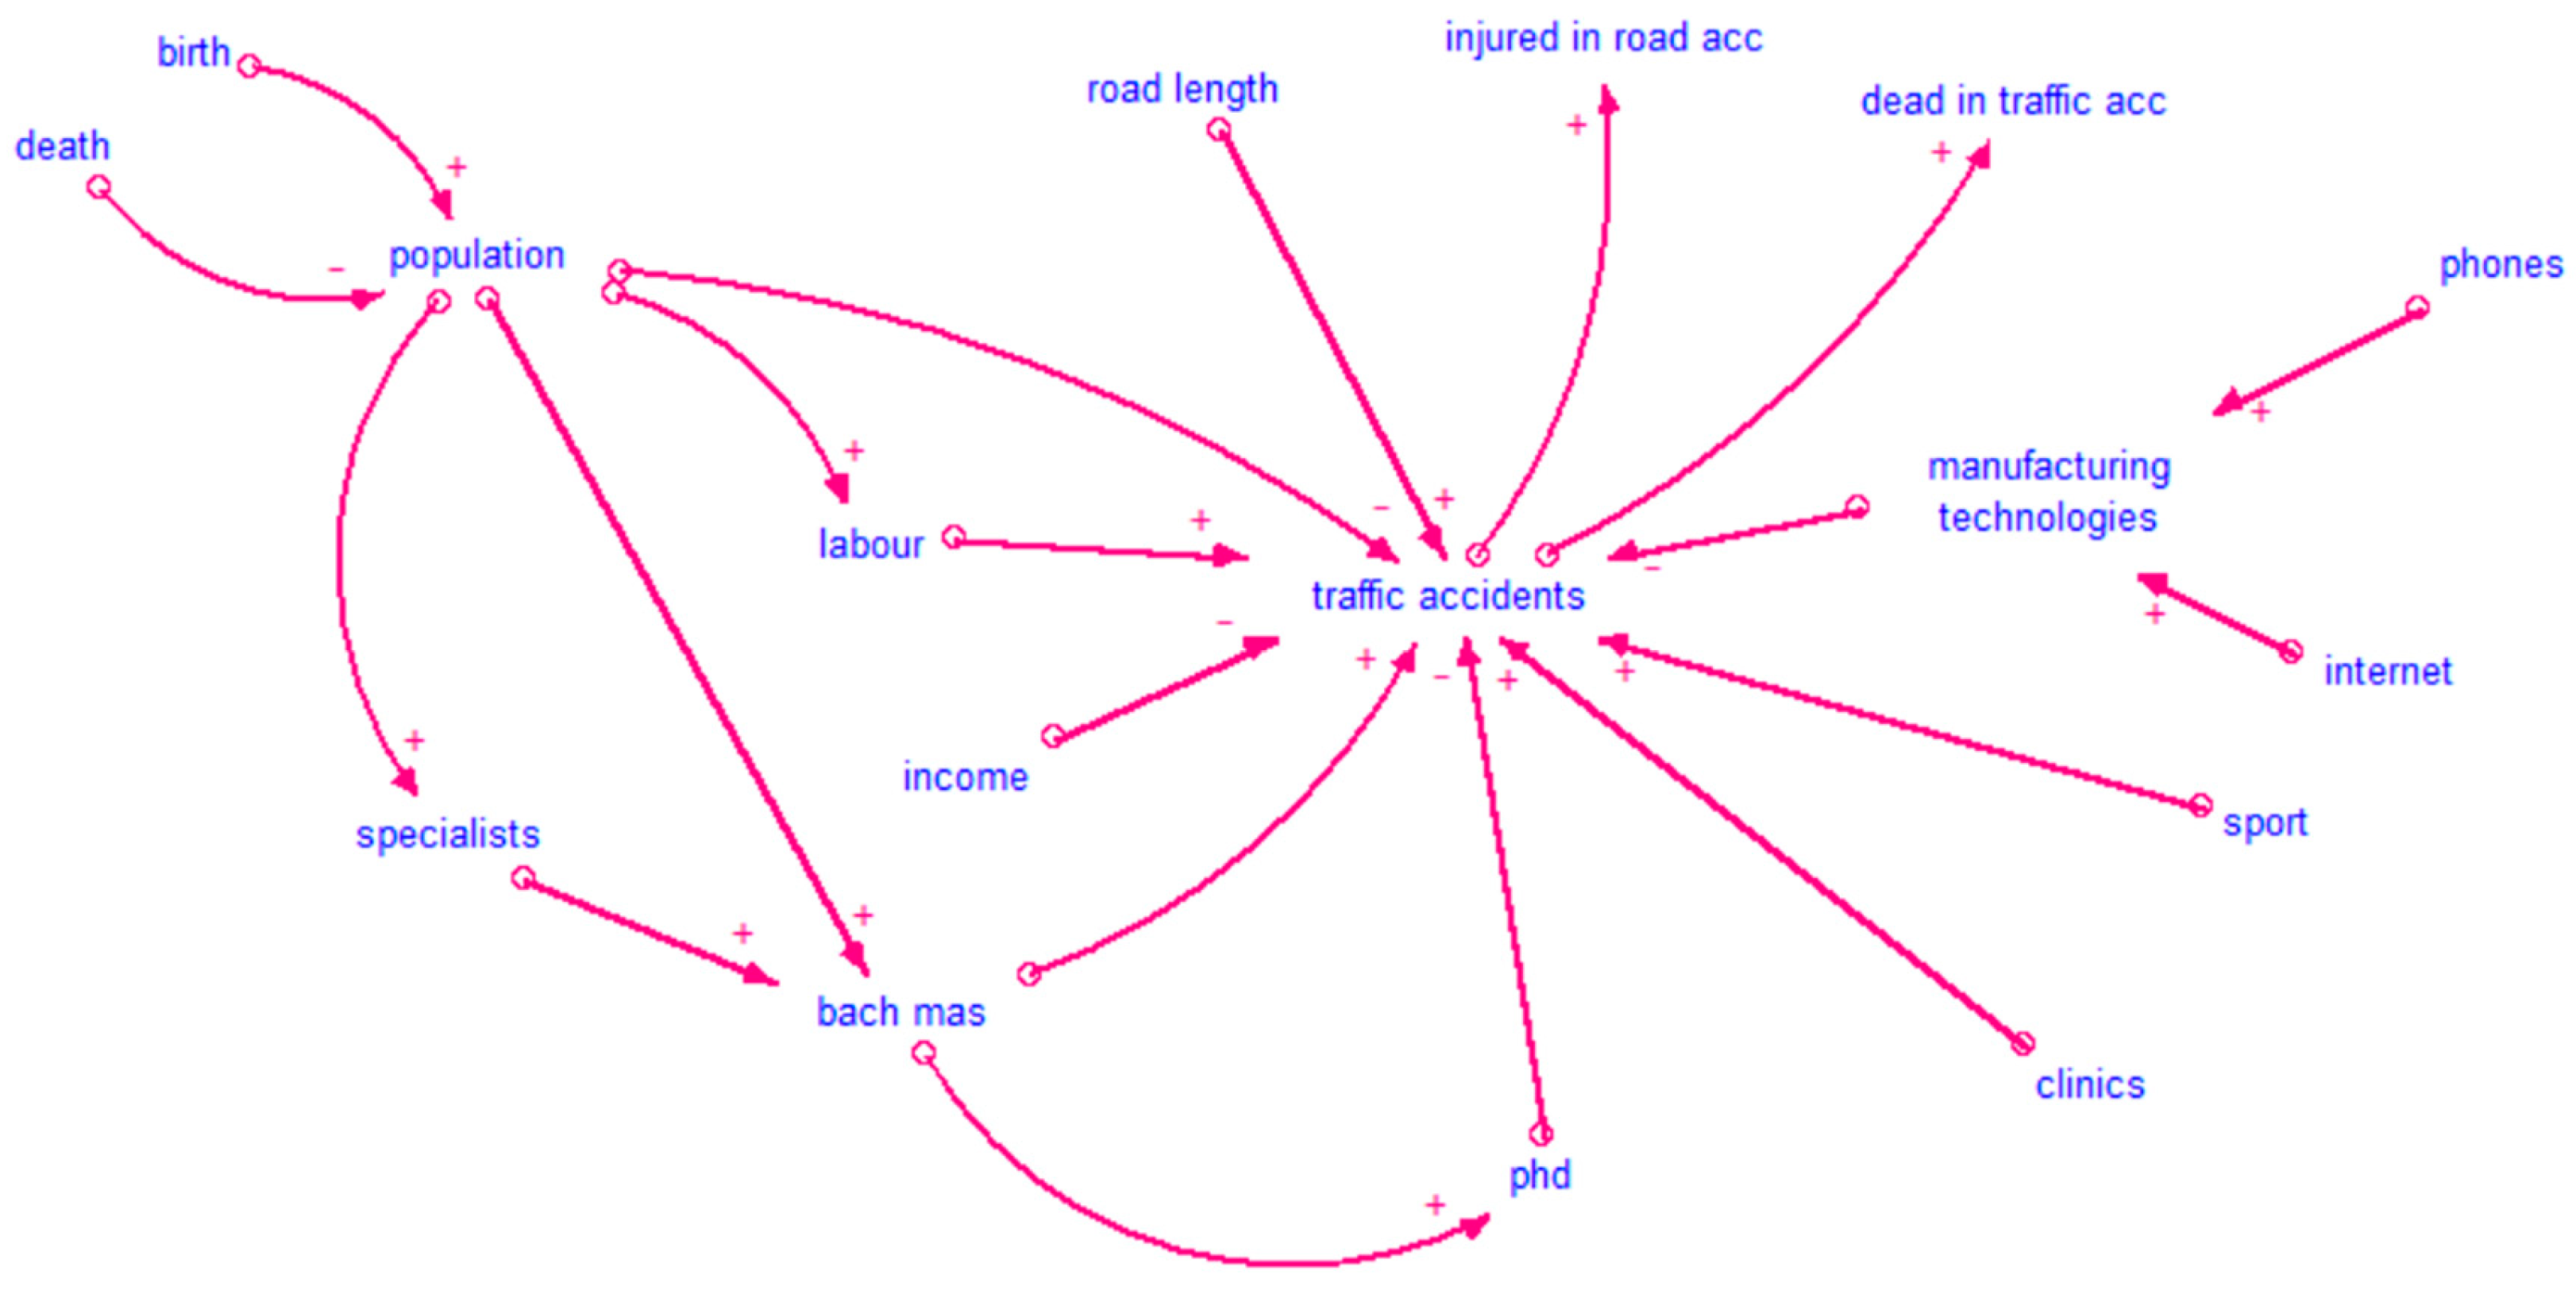
In the first stage of building a model of system dynamics, a cause-and-effect diagram was built (
Figure 4).
In addition to the relationships reflected in the regression equation, the model included the following:
- -
a variable reflecting the mortality rate (the number of deaths per 1000 population) for correct display of the population model and population dynamics when forecasting;
- -
the impact of population on the number of mid-level specialists; graduates of bachelor’s, master’s, and specialist’s degrees; the size of the labor force, since there is a strong positive correlation between the indicators according to the correlation matrix;
- -
the influence of mid-level specialists on the number of graduates of bachelor’s, master’s, and specialist programs, and the impact of graduates of higher education on the number of postgraduate students. These relationships are explained by both a strong correlation according to
Figure 5 and logical relationships—many graduates of secondary specialized educational institutions go on to receive higher education; all postgraduate students are graduates of a master’s/specialist’s program;
- -
the impact of the number of active subscribers of fixed broadband Internet access and the number of connected mobile subscriber devices per 1000 people of the population on the advanced production technologies used.
Based on the cause-and-effect diagram, a model was built in terms of system dynamics (
Figure 5).
Figure 5.
System dynamics model.
Figure 5.
System dynamics model.
The system dynamics model consisted of stocks (traffic_accidents; dead_in_traffic_acc; injured_in_road_acc; population), streams (birth_rate, death_rate; traffic_accidents_rate; death_in_traffic_acc; injuries_in_road_acc), and converters (birth, death; labour; road_length; part_specialists, specialists; bach_mas; part_phd, phd; clinics; sport; injuries_coeff; death_coeff; phones; internet; manufacturing_technologies, part_mt_internet, part_mt_phones; income; initial_transport_safety_coef). It was a simulation model used in modeling management impact scenarios.
3.6. Model of Managerial Decision-Making
Within the framework of this study, managerial decision-making was based on the model of managerial decision-making.
To formalize the model of managerial decision-making, it is necessary to understand the target indicators that must be achieved; controllable variables (factors that can be influenced); restrictions (factors that cannot change under the influence of decision-makers).
As a basis for the formation of target indicators, the targets defined in the National Project “Infrastructure for Life” adopted for implementation from 2025 were used, namely indicators related to the transport industry and coinciding with the goals of this study [
44].
The national project is designed up to 2030 and for the future up to 2036. A suitable target for consideration in this study was to reduce the death rate because of road accidents by 1.5 times (and 2 times by 2036) by 2030 compared to 2023.
At the same time, within the framework of the model built in this study, the mortality rate as a result of road accidents directly depends on the number of accidents—it is calculated as the number of accidents multiplied by a coefficient that is constant.
Thus, within the framework of this study, the target indicator was the number of accidents (traffic_accidents), which by 2030 must be reduced by 1.5 times from 2023. The modeling horizon in this case was 7 years.
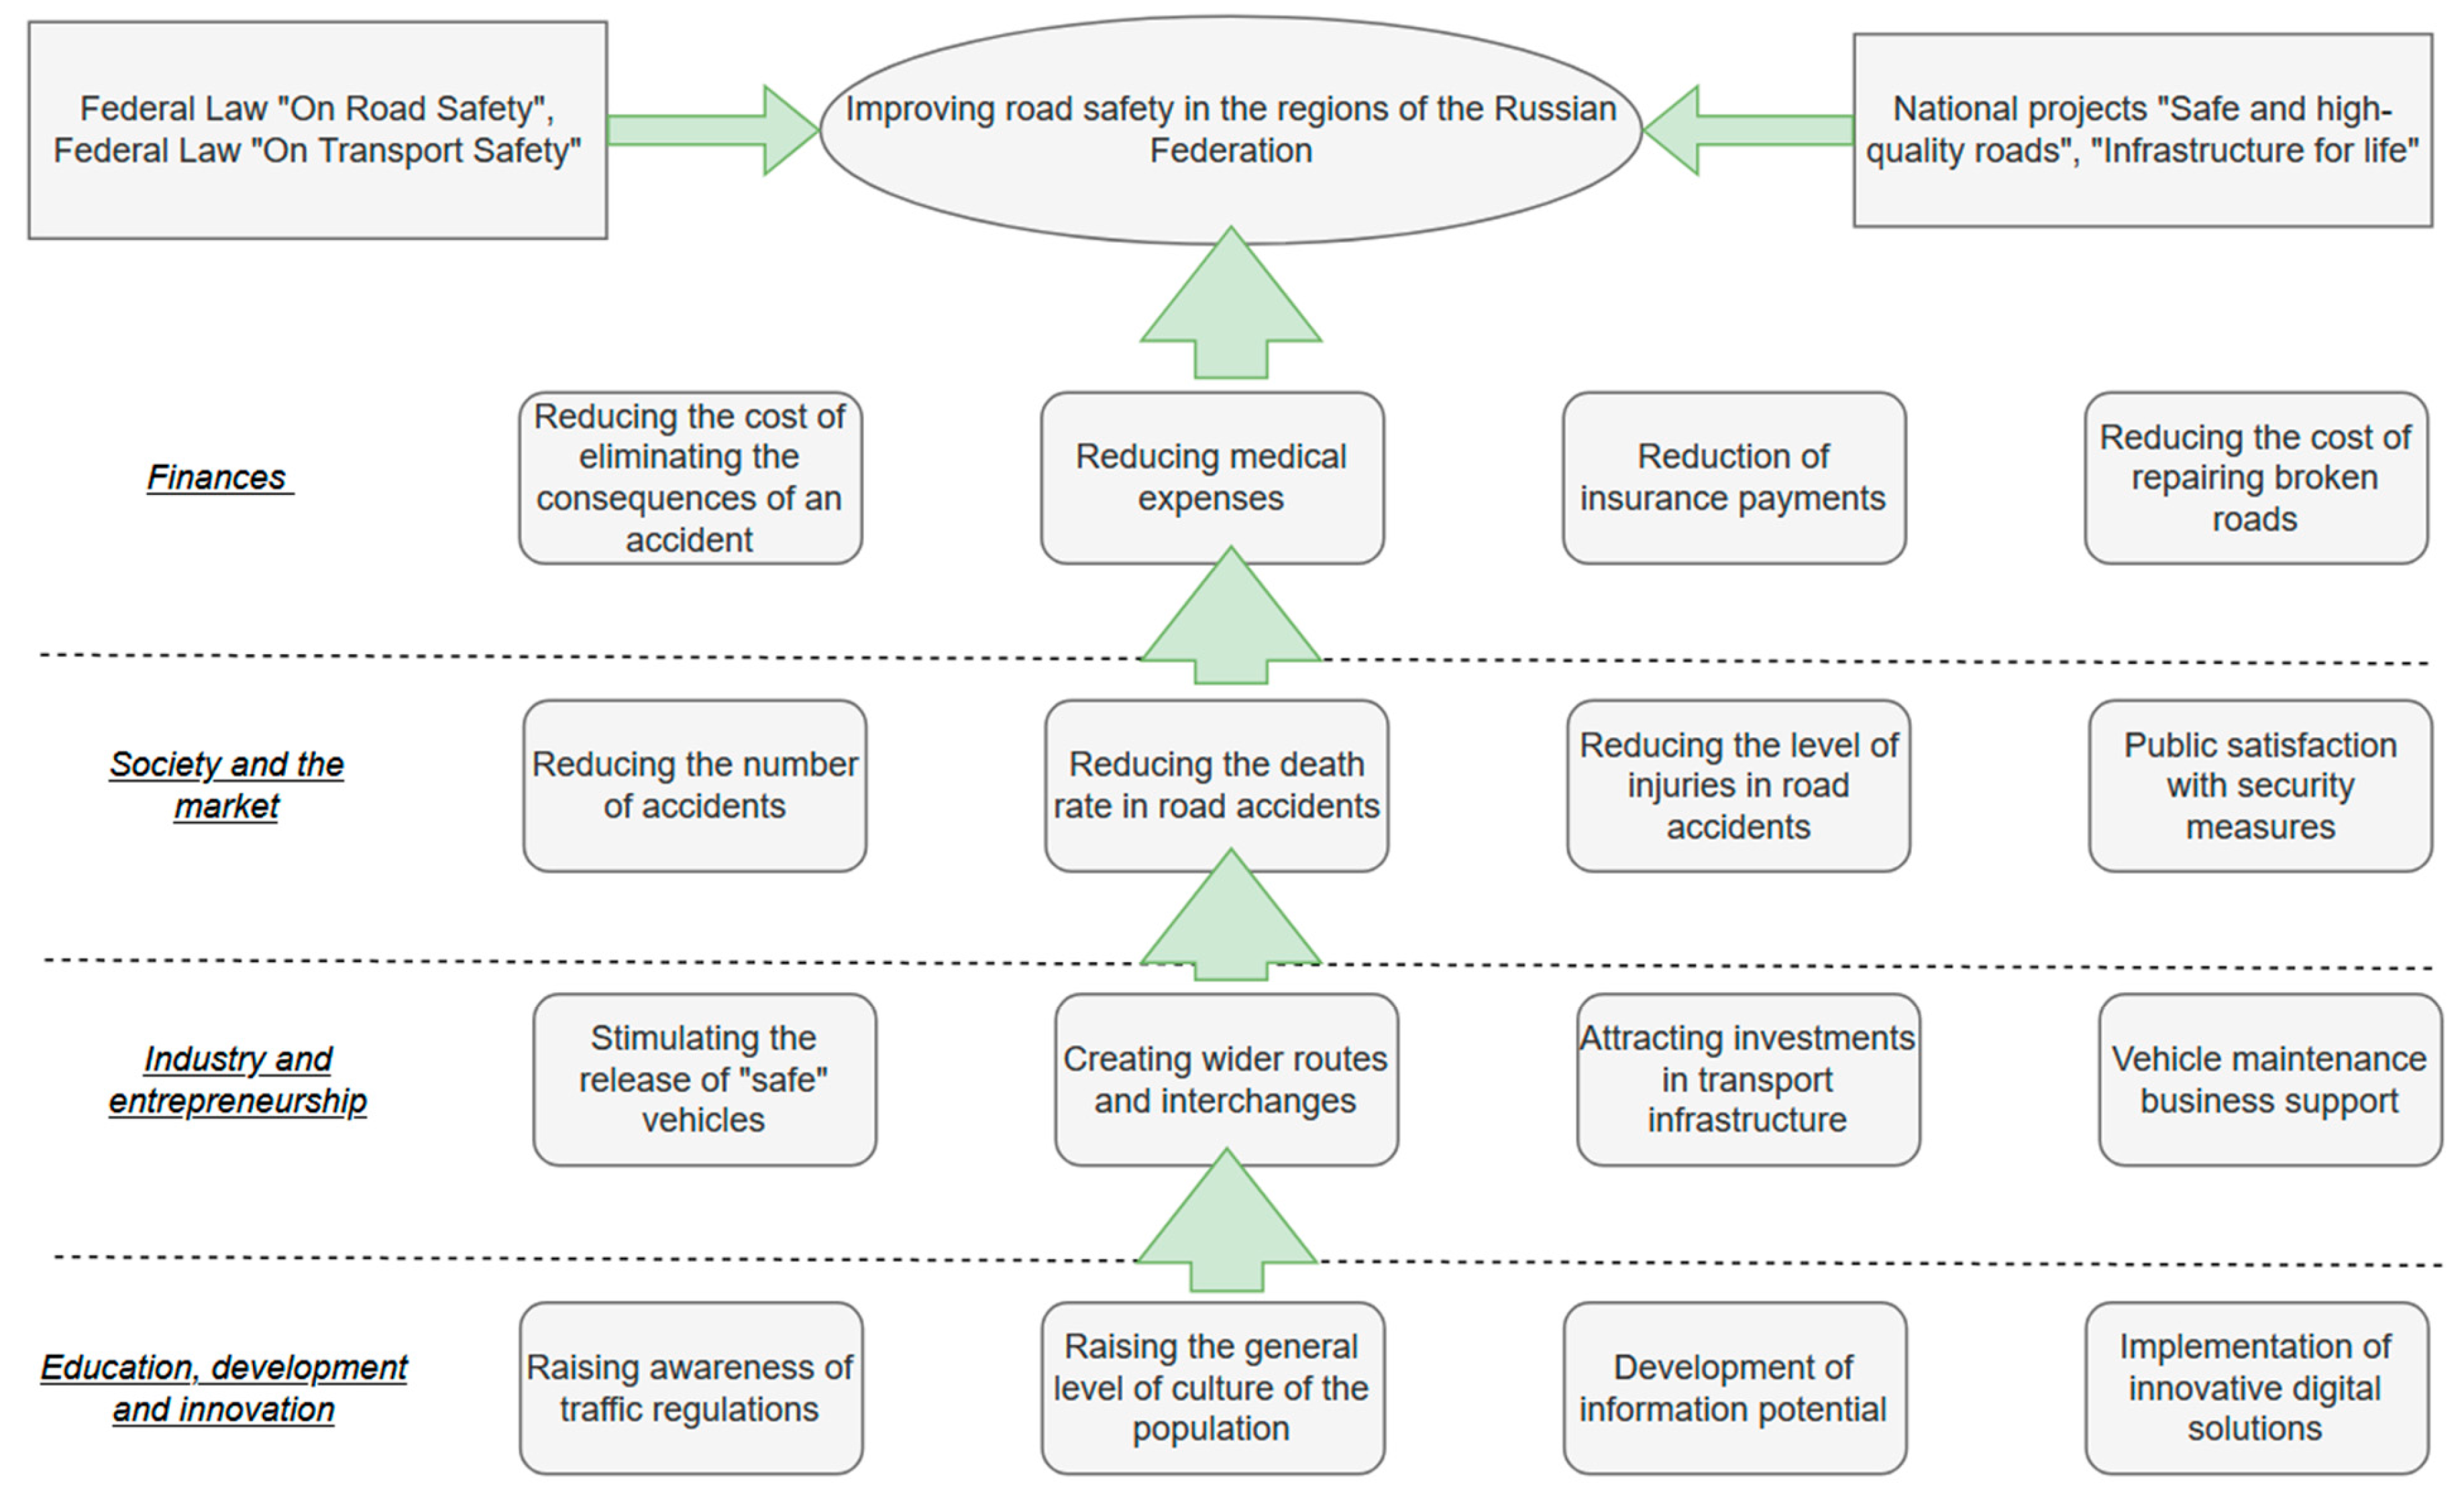
To determine the manageable indicators (and the subsequent formation of specific recommendations for improving the road safety of the regions of the Russian Federation), a strategic map for improving the road safety of the regions of the Russian Federation was developed (
Figure 6).
The strategic map is a multi-level analytical model aimed at reducing the accident rate of road transport and minimizing the consequences of road accidents. It was developed within the framework of the current legal framework—based on the federal laws “On Road Safety” and “On Transport Safety”, as well as within the context of the implementation of the national projects “Safe and High-Quality Roads” and “Infrastructure for Life”, which can be seen from the rectangular blocks in the header of the map. The main goal of the strategic map is to systematize the priority areas of regional policy in the field of road safety, considering socio-economic, infrastructural, and institutional conditions.
Conceptually, the map is built on four key blocks: training, development and innovation, industry and entrepreneurship, society and the market, and the region’s finances. These blocks are inextricably linked, cover a wide range of factors, and allow building a logically consistent model of causes and effects in the field of road safety.
The “Training, Development and Innovation” block contains targets for the formation of safe behavior on the roads and technological progress in the transport industry. The level of education of the population, the training of specialists, the development of research centers, and the prevalence of digital services are important here. In the prevention of road accidents, driver training, and monitoring of violations, it is necessary to introduce communication technologies, including mobile Internet, online platforms, and distance training courses. Cultural and sporting initiatives can shape more responsible road user behavior.
The “Industry and Entrepreneurship” block reflects economic and technological targets. It covers the renewal of the vehicle fleet, the development of business in the field of logistics and transport services, and the introduction of advanced technologies in the management of transport systems. Increasing the income of the population and enterprises should contribute to the growth in demand for modern cars equipped with intelligent accident prevention systems. The development of private–public partnerships should provide an additional inflow of investment into infrastructure modernization. Digital solutions play a special role—it is necessary to create and develop both intelligent traffic management systems and platforms for analyzing traffic flows and predictive analytics of road accidents.
The block “Society and Market” reflects the social aspects of road safety. The key targets are to reduce the accident rate, reduce the severity of the consequences of road accidents, improve the quality of the road surface, and increase public satisfaction with safety measures. An increase in the number of modern cars considered in the “Industry and Entrepreneurship” block requires the development of a road network. Deaths and injuries resulting from road accidents can be reduced through the development of the healthcare sector.
The targets considered in the three lower blocks should lead to a reduction in costs associated with accidents and a lessening of the consequences of accidents. This is influenced by both the overall decrease in accidents and the level of income of the population, the state of the healthcare system, as well as the length and quality of roads.
A decrease in the costs of these factors would indicate (simultaneously with a decrease in the number of accidents and the mortality rate in road accidents) a general increase in road safety in the regions of the Russian Federation.
Based on certain targets, the created strategic map, and the configuration of the model, controllable variables were determined: the share of the population receiving secondary specialized education, the share of higher education graduates entering graduate school, the number of connected mobile subscriber devices per 1000 people, and the number of active subscribers to fixed broadband Internet access.
Accordingly, the model constraints included all other measures used in the model.
3.7. Sensitivity Analysis
The SD model, based on which the sensitivity analysis was carried out, was intended for modeling for each region separately. Consideration of all 82 regions would be a time-consuming and inexpedient process, and therefore three regions were selected, which are typical representatives of their clusters identified when compiling the rating of road safety: the Kabardino-Balkarian Republic (high level of safety), the Penza region (medium level of security), the Republic of Sakha (Yakutia) (low level of safety). The security index in each region is the median value in the corresponding cluster.
To identify scenarios of managerial impact, a sensitivity analysis was carried out using the SD model.
To perform sensitivity analysis, the first step was to specify the initial data for the converters. As the target was to be achieved relative to the 2023 target, the historical data for 2023 were the initial values of the variables.
Next, modeling was carried out for the selected regions.
In the Kabardino-Balkarian Republic in 2023, the target value (number of accidents) was 693. Accordingly, by 2030, the number of accidents should be 426.
In the Penza region in 2023, 1555 accidents occurred. In accordance with the target, in 2030, the number of accidents should decrease to 1036.
In the Republic of Sakha (Yakutia), in 2023, 806 accidents occurred. The target for 2030 is 537 incidents.
For each region, a suitable scenario was found that leads to the achievement of the target. Changes in managed indicators that lead to the achievement of target indicators are presented in
Table 4.
Table 4 shows that to achieve the target values for the regions, a significant (5–9 times) increase in manageable indicators is required. At the same time, it is believed that the results obtained for the three regions considered can be extrapolated to other regions within the corresponding clusters.
The results of the sensitivity analysis demonstrate that achieving the targets for reducing the number of road accidents by 2030 will require a significant increase in manageable indicators. In the regions under consideration—the Kabardino-Balkarian Republic, the Penza Region, and the Republic of Sakha (Yakutia)—we are talking about multiple increases in such parameters as the number of Internet connections, mobile users, the share of specialists with academic degrees, and qualified personnel.
For example, for Kabardino-Balkaria, the model assumed an increase in the number of Internet users from 1.2 thousand to almost 8 thousand, and the share of employees with scientific degrees from 12% to almost 80%. Such transformations, especially in regions with limited access to infrastructure and a complex demographic structure, seem to be poorly implemented within each planning horizon. This calls into question the practical achievability of the targets set in the short term, unless there are significant institutional and technological shifts.
At the same time, the key goal of sensitivity analysis is not so much to accurately determine absolute values, but to identify the directions of influence that are most effective. These controllable variables make it possible to determine which factors most determine the level of road safety in specific socio-economic conditions.
The implementation of such transformations is possible only with an integrated approach. Recent studies have emphasized that the key element of the transition to an effective security management system is the development of the digital environment, the integration of infrastructure data, and the introduction of predictive management mechanisms [
45,
46,
47]. In resource-constrained settings, priority should be given to those areas that demonstrate the greatest sensitivity in the model and can potentially be implemented faster and more cheaply.
Thus, instead of trying to achieve the set values at once, it is advisable to implement a strategy of incremental changes, where each iteration is evaluated by effect and feasibility. It is particularly important to consider regional specificities, including the geographical, economic, and social factors that affect the ability of systems to respond to management pressures.
As for the applicability of the results to other constituent entities of the Russian Federation, this approach is justified within the clusters identified based on the road safety rating. The choice of typical regions with different levels of safety (high, medium, and low) makes it possible to extrapolate the scenarios to other territories with similar characteristics and unique factors not included in clustering, such as urban development, traffic seasonality, population density, and level of transport network development.
Thus, the results of the sensitivity analysis not only reveal the structure of the controlled factors but can also form the basis for sound strategic planning in the field of road safety at the regional level.
4. Discussion
Based on the results obtained and based on a review of sources, it can be said that, first, it is important to provide mass access to high-speed fixed Internet. This is especially true for areas with medium and low security, where the coverage of digital services is limited [
48,
49,
50]. The key role here is played by the state, which should take on the coordination of infrastructure projects—laying fiber-optic lines to remote settlements, subsidizing telecom operators, and supporting local digitalization initiatives. In such regions, it is advisable to introduce mechanisms of state co-financing, as well as to use the experience of pilot projects in other regions where a steady increase in the number of Internet users has been achieved [
51]. In more developed (from the point of view of road safety) regions, efforts should be focused on eliminating internal digital divides—between rural and urban areas, and different age and social groups, which is a prerequisite for equal access to information, online services, and educational platforms [
52].
Another strategy is to increase the number of mobile devices per capita. This indicator is closely related not only to the level of digitalization, but also to the possibility of quick access to information, including on the road situation, warnings about accidents, congestion, and weather conditions. In regions with a medium level of security, where a significant increase in this indicator is required, measures to support low-income families in the purchase of mobile devices, as well as the development of 4G and 5G networks in sparsely populated areas, can be considered. In regions with low road safety, the priority should be the coverage of highways, settlements, and suburban routes, which will increase the efficiency of response to emergencies and allow more effective use of intelligent transport management tools [
53,
54].
The task of increasing interest in obtaining secondary specialized education deserves special attention. Solving this problem requires an integrated approach: it is necessary not only to create new training programs, updating them to market conditions, but also to modernize existing ones, as well as actively introduce distance learning, especially in remote and rural areas. Along with this, it is necessary to develop evening and correspondence education programs, to create incentives for the return to education of those for who it was interrupted for various reasons. In regions with a higher level of security, emphasis should be placed on the quality of the educational process, updating curricula and developing mechanisms for professional orientation in the field of transport and engineering [
55,
56].
Finally, to create a stable base of professional personnel, it is necessary to increase the share of graduates who continue their studies in graduate school. This is especially important for regions where the scientific and educational environment is still poorly developed. In such regions, it is necessary to actively develop regional centers for training researchers focused on solving applied problems—from transport logistics to risk modeling and designing safe road infrastructure. This requires the coordination of the efforts of universities, scientific institutions and authorities. Financial support for graduate students, the availability of internships and practice-oriented training programs will be an important incentive for the influx of young specialists into the field of scientific research [
57,
58].
The comprehensive implementation of these measures requires clear coordination between federal and regional agencies, as well as the creation of effective mechanisms for interdepartmental cooperation. Regional road maps for the development of digital infrastructure and education should contain not only targets, but also specific deadlines, responsible departments, sources of funding, and mechanisms for assessing effectiveness. Only such an approach will make it possible to achieve real changes adapted to the specifics of each region, and in the long term ensure a sustainable reduction in the number of road accidents, improving the safety and quality of life of the population.
It should be noted that the improvement of key indicators should not be formal, but substantive. An increase in these indicators should not turn into a nominal statistical increase. For example, you cannot simply increase statistics by registering many subscriber numbers if there is no real use of the services behind them. Such an approach will not lead to noticeable results in terms of improving road safety.
Real progress is possible only in the case of systematic work with the population. This means not only increasing the number of Internet connections and mobile communications, but also ensuring real access for citizens to high-quality digital services. At the same time, it is necessary to motivate people to receive secondary education and subsequent vocational training. The most important point is that each of these steps affects real human factors: the level of knowledge, the ability to safely use transport infrastructure, and involvement in digital society. Only a meaningful change in the approach to these issues will make it possible to achieve noticeable improvements in road safety.
The developed approaches to improving road safety, based on the development of education and the introduction of technological solutions, are of certain value. However, in practice, their contribution to solving the problem is not so unambiguous. Quantitative assessments of such measures may show positive dynamics, but the qualitative effect is often limited. To stake efforts exclusively on educational initiatives and technological innovations, although logical from a theoretical point of view, does not always cover the entire range of factors affecting the level of safety on the roads. The calculations for scenarios based on the SD model and sensitivity analysis provide some guidance, but do not fully assess their application effectiveness, especially if we consider such elements as the state of infrastructure or the preparedness of the health system to respond to emergencies.
Indicators of the targets of the strategic development map were developed, which will serve as the basis for the formation of specific recommendations in terms of changing indicators not considered in the sensitivity analysis. It is worth remembering that, in practice, it is difficult to quantify the effect of the proposed measures, since they are not confirmed by experiments, but are based on qualitative analysis.
First, within the financial block, the implementation of targeted measures to reduce the total costs associated with the consequences of road accidents is of particular importance. This goal can be achieved by reducing the average loss per accident, reducing the volume of medical expenses and insurance payments. This requires the introduction of well-thought-out preventive mechanisms—from digital systems for informing drivers early, to improving insurance examination procedures and expanding the possibilities of emergency medical care through the integration of telemedicine.
Secondly, for the development of the socio-economic block, it is necessary to pay attention to the transition to sustainable mobility models, namely the development of public transport, infrastructure for bicycles, and pedestrian paths. In addition, an important area is the implementation of information and educational programs aimed at changing the daily behavior of road users.
Third, the renewal and development of transport infrastructure remains the foundation for improving safety. It is necessary to consistently improve the condition of the roadway, reduce the share of sections that do not meet the standards, and ensure the optimal development of the street and road network. An important tool is ITS, which allows analyzing the traffic situation in real time and to quickly respond to changes. An effective practice in this direction could be the compilation of maps of areas with an increased accident rate and the prioritization of their reconstruction.
Fourth, special attention should be paid to the interaction between healthcare structures and the transport industry. The development of effective interdepartmental coordination will increase the speed of helping victims, reduce the duration of treatment, and contribute to the formation of a system of sustainable post-traumatic rehabilitation. A promising area is the creation of regional coordination centers operating online, with the ability to constantly monitor the condition of victims and the effectiveness of medical response.
Fifth, it is necessary to modernize the management system in the field of road safety. In addition to strengthening control over compliance with traffic rules, it is necessary to more actively introduce systems for automatic recording of violations, update driver training programs, and build flexible traffic regulation, focusing on the current traffic situation and data obtained from monitoring and analytics.
Finally, in regulation and strategic management, institutional strengthening of coordination mechanisms is required. The creation of interdepartmental road safety management centers at the regional level, as well as the introduction of key performance indicators for municipalities in terms of reducing accidents and improving the quality of infrastructure, can contribute to the formation of a single vector of development. An important management practice is to ensure the transparency of processes through regular public reporting on the results achieved and the initiatives implemented.
The comprehensive implementation of all the proposed solutions will ensure a higher level of road safety, sustainable development of the transport system, and a reduction in the social and economic burden from road accidents.


