1. Introduction
Biodiversity is increasingly recognized as a systemic financial risk with implications for market stability, investment portfolios, and long-term sustainability. As [
1] emphasizes, biodiversity supports global ecological and economic resilience, yet it continues to erode under the pressures of climate change, habitat destruction, and unsustainable development. Recent studies [
2,
3,
4] have documented the financial materiality of biodiversity loss, highlighting its impact on firm-level risk, ESG performance [
5], and future stock market crash exposure. Despite its growing salience, biodiversity remains underexplored, mainly in empirical financial connectedness research [
6], particularly about other transition-aligned asset classes such as clean energy and green bonds.
Meanwhile, clean and renewable energy assets have received increasing academic attention due to their critical role in low-carbon transitions. Studies by [
7,
8,
9] indicate that the connectedness of clean energy and traditional energy assets is asymmetric and strongly time-varying, particularly during episodes of financial stress, such as the COVID-19 pandemic or geopolitical events. These dynamics have been further examined using spillover and wavelet coherence models [
10], showing heterogeneous interactions across sub-sectors such as solar, wind, and fossil fuels. Additionally, climate policy uncertainty has been found to exacerbate interconnectedness in clean and sustainable markets [
11], while green bonds are increasingly acknowledged as a financial channel for driving clean energy investments and achieving climate targets [
12]. This aligns with [
13], who find that energy efficiency improvements and green financing contribute positively to clean energy performance under ESG screening, suggesting that ESG integration may amplify interconnectedness among transition-aligned assets.
Despite the growing literature on clean energy and green finance, the intersection between biodiversity-related financial assets and transition finance instruments remains largely uncharted. Recent policy frameworks, such as the Kunming–Montreal Global Biodiversity Framework [
14] and green finance initiatives [
15], have attempted to bridge this gap. However, the financial market implications of biodiversity risk, particularly under extreme conditions, are poorly understood. Studies have shown that biodiversity concerns are beginning to influence firm behavior, eco-innovation [
16], and ESG disclosures [
17,
18], but these effects are rarely integrated into systemic risk modeling. Recent work by [
13] demonstrates that biodiversity finance and energy efficiency improvements can jointly enhance clean energy performance within ESG-focused portfolios. This highlights the role of firm-level sustainability actions in shaping cross-asset spillovers among green financial instruments.
Biodiversity constitutes a fundamental pillar of natural capital, and its degradation, especially when ecosystems approach tipping points, poses systemic risks to the global economy and financial system [
19]. Biodiversity-related financial risks can be systemic in several interrelated dimensions. First, they exhibit network-level contagion, whereby shocks to biodiversity-linked assets propagate to other green or traditional sectors due to correlated investor flows or shared environmental, social, and governance (ESG) mandates. Second, they introduce tail risks, with ecological degradation potentially leading to abrupt market repricing, especially when ecosystems cross tipping points. Third, they contribute to correlation breakdowns during crises, violating diversification assumptions and amplifying downside co-movements across asset classes. Finally, they affect macrofinancial stability, as biodiversity-related shocks increasingly intersect with regulatory, geopolitical, and climate-induced disruptions. By capturing these transmission channels, our study frames biodiversity loss not just as an environmental concern but as a latent source of systemic financial instability.
Ecosystem collapse can trigger abrupt and nonlinear losses in asset values, creating downside risks that are poorly captured by standard portfolio theory, which relies on stable correlations and normal distributions of returns [
20,
21]. During stress events, these systemic risks manifest through behavioral spillovers, tail dependence, and cross-asset contagion, undermining diversification and exposing portfolios to hidden vulnerabilities. Network-based climate stress testing approaches, such as those proposed by [
22], further demonstrate how environmental transition risks can propagate through complex financial linkages, affecting multiple sectors simultaneously. These perspectives justify the integration of biodiversity into systemic financial risk models and support our use of partial correlation networks to capture these nonlinear, quantile-specific spillovers.
This paper addresses this critical gap by examining the dynamic and asymmetric connectedness between biodiversity-related indices, clean and renewable energy assets, green bonds, and traditional energy benchmarks. We explore systemic co-movements across normal and tail market conditions using the novel partial correlation-based connectedness framework proposed and developed by [
23]. Unlike standard linear models, such as the Generalized Forecast Error Variance Decomposition (GFEVD), this method enables the capture dependencies and directional spillovers across quantiles, providing more profound insights into how financial systems behave during environmental and geopolitical stress. Our analysis focuses on eleven global financial indices across four asset groups, applying a rolling window estimation from June 2019 to March 2025. We investigate how connectedness evolves during critical episodes such as the COVID-19 vaccine rollout, the Russia–Ukraine war, and the 2023–24 El Niño climate event. In doing so, we advance the literature on clean energy and green finance spillovers and integrate biodiversity into the empirical network of financial interdependencies. While several indices are U.S.-listed ETFs or benchmarks (e.g., S&P 500 Biodiversity, Vanguard Energy Index), they reflect global firm exposures and capital flows, capturing cross-border sustainability risks and not solely U.S. market dynamics. Our scope is therefore global in orientation, consistent with the international nature of the indices used.
This study offers three main contributions. First, it is the first to incorporate biodiversity-related financial indices into a quantile-based connectedness framework, extending the scope of nature-related risk modeling. Second, it introduces a partial correlation-based methodology that captures systemic behavior during average and extreme market phases. Third, it generates practical insights for sustainable finance, policy design, and ESG integration, especially as biodiversity becomes a defining feature of future financial disclosures and risk assessments.
The rest of the paper proceeds as follows.
Section 2 provides data description and research methodology.
Section 3 presents empirical findings, while
Section 4 concludes with policy implications and directions for future research.
2. Data Description and Research Methodology
2.1. Data Description
This study utilizes daily closing prices of eleven representative financial indices spanning 21 June 2019, to 31 March 2025. The data are grouped into four thematically distinct categories: (1) biodiversity-related assets, (2) clean and renewable energy, (3) green fixed income instruments, and (4) traditional energy benchmarks. This classification captures a broad spectrum of the financial ecosystem relevant to ecological transition, sustainability investment, and carbon-intensive sectors. The index selection strikes a balance between coverage of low-carbon and high-carbon financial exposures, enabling us to examine systemic co-movements between nature-aligned assets and traditional sectors that significantly contribute to environmental degradation.
The biodiversity group includes the S&P 500 Biodiversity Index (BSP) and the MSCI ACWI IMI Natural Resources Stewardship Index (MSB), which track companies committed to biodiversity conservation, natural capital preservation, and sustainable resource management. The BSP is constructed by selecting and weighting a subset of equity securities from the S&P 500 in a way that collectively reduces ecosystem impact intensity, limits exposure to significant land ecosystem impacts, and enhances alignment with specific UN Sustainable Development Goals. It also aims to reduce the portfolio’s carbon footprint relative to the parent index. The MSB, on the other hand, comprises firms from both developed and emerging markets that contribute to natural resource protection through their products, services, or sustainability practices. This index places a strong emphasis on stewardship and circular economy principles, excluding companies that are misaligned with its environmental objectives. Both indices reflect the financial sector’s growing recognition of biodiversity as a material financial risk, while also encompassing broader ESG and sustainability dimensions in their selection criteria. The clean and renewable energy group comprises the S&P Global Clean Energy Index (CEN), Invesco Solar ETF (SOL), and iShares Global Clean Energy ETF (ICL). These assets represent firms advancing solar, wind, and broader renewable energy technologies, making them critical components of climate-aligned transition portfolios. The green fixed income group includes the S&P Green Bond Index (GBI) and VanEck Green Bond ETF (GRN), which track debt instruments to finance environmentally beneficial projects. Their inclusion captures the role of sustainable bonds in channeling capital toward climate mitigation and adaptation. Finally, the traditional energy group includes the United States Oil Fund (OIL), United States Natural Gas Fund (GAZ), Energy Select Sector SPDR ETF (XLE), and Vanguard Energy Index Fund (VDE). These indices provide broad exposure to fossil fuel extraction, energy infrastructure, and utility-heavy sectors, including oil and gas, power generation, and energy services. While sector-specific indices for mining, food processing, or retail were not included, the diversified nature of XLE and VDE ensures indirect exposure to these industries, allowing us to capture their systemic behavior within the broader fossil-fuel-dominated asset class. These indices reflect fossil fuel-based market benchmarks, offering a necessary contrast for understanding volatility transmission between high- and low-carbon assets.
Table 1 presents the full names, abbreviations, thematic groupings, and environmental relevance of the eleven financial indices used in the study.
The datasets in
Table 1 enable a comprehensive investigation of systemic connectedness across assets that differ in environmental exposure and transition sensitivity. Daily frequency allows for high-resolution analysis, particularly during episodes of elevated uncertainty, such as the COVID-19 pandemic, geopolitical shocks like the Russia–Ukraine war, and climate-linked disruptions including the 2023–2024 El Niño event. All price series are transformed into continuously compounded returns to ensure asset stationarity and comparability. These return series are then employed in the connectedness estimation framework to capture average and extreme volatility spillovers. The data are sourced from S&P Global, MSCI, and Investing.com.
Table 2 illustrates the descriptive statistics.
Table 2 indicates that the mean returns across all indices are close to zero, while the variances indicate higher volatility in traditional energy assets such as Oil (OIL) and Natural Gas (GAZ). Skewness is negative and statistically significant for most series, suggesting asymmetric return distributions with heavier left tails. All series exhibit excess kurtosis, indicating fat tails and leptokurtic behavior, especially OIL and BSP. The Jarque–Bera (JB) test strongly rejects normality for all series. Unit root tests (ADF and PP) confirm that all return series are stationary at the 1% level.
2.2. Research Methodology
This study adopts the novel connectedness framework developed by [
23], which integrates partial correlation networks with quantile-based tail dependence to examine systemic risk and directional spillovers across environmental and financial transition assets. This approach is especially suited for uncovering complex, asymmetric dependencies during extreme market conditions. We begin with the standard Pearson correlation coefficient, measuring the average linear co-movement between asset return series:
While informative under normal conditions, these metrics lack sensitivity to tail behavior. To address this, we follow the approach of [
23] that uses Extreme Downside Correlation (EDC) and Extreme Upside Correlation (EUC), computed at quantiles
and
, respectively. The EDC is given by (For
):
with the
-conditional returns defined as
An analogous formulation is used for EUC at the upper quantile ().
To examine more dependence structures, we incorporate first-order partial correlations to control for the influence of third variables. The partial correlation between assets
i and
j, conditional on asset
k, is defined as follows:
This isolates the direct influence between two assets by removing the mediating effect of a third. The difference between the Pearson and partial correlations reflects the contribution of asset
to the observed relationship:
To assess the systemic influence of each asset, we compute the average mediated influence of asset
on all pairwise dependencies involving asset
i:
From this dependence matrix , we extract directional spillovers:
Finally, total system-wide connectedness is computed as the average of all entries in the dependence matrix , summarizing global interaction dynamics across asset classes. This matrix is asymmetric and sparse, reflecting the directionality and nonlinearity of real-world financial spillovers. By avoiding model-based assumptions (e.g., VAR-GFEVD), this framework is robust to non-Gaussian distributions and especially informative during extreme market events. The rolling window estimation captures how systemic influence changes over time, offering valuable insights into shocks such as the COVID-19 vaccine rollout (2021), the Russia–Ukraine war (2022), and the 2023–2024 El Niño climate event.
This framework contributes to the separation of systemic from idiosyncratic risk by focusing on direct, partial correlations that control for third-party influences. Unlike full correlation or GFEVD-based spillovers that may reflect both systemic co-movements and coincidental (idiosyncratic) co-movements, the partial correlation network filters out indirect linkages and conditional dependencies, isolating the true structural interdependence across asset classes. Thus, idiosyncratic noises specific to individual asset behavior, which are not propagated through the network, are minimized. Moreover, the asymmetry observed in tail-based spillovers indicates that systemic shocks are not uniformly distributed but tend to cluster during extreme events, further distinguishing common systemic dynamics from asset-specific behavior.
While the partial correlation framework isolates the direct linear influence between two assets by controlling for a third, it does not fully capture nonlinear or higher-order interactions that may mediate spillovers in complex financial systems. For example, latent factors such as climate policy uncertainty, volatility indices (e.g., VIX), or investor sentiment may introduce nonlinear dependencies that are not fully addressed by this method. As such, our identification of ‘direct linkages’ reflects conditional linear associations and should be interpreted with this limitation in mind. Future research could extend this framework by incorporating nonlinear mediators or employing copula-based or machine learning-enhanced network models to uncover hidden channels of transmission further.
3. Empirical Findings and Discussion
3.1. Preliminary Check
Figure 1 presents scatter plots comparing alternative measures of dependence (Pearson correlation coefficients vs. partial correlation coefficients) across all possible pairs of the 11 asset returns spanning biodiversity, clean and renewable energy, green fixed income instruments, and traditional energy.
The left panel of
Figure 1 plots standard Pearson correlation coefficients against partial correlation coefficients, where the predominance of points below the 45-degree line suggests that unconditional correlations tend to overstate the degree of dependence between assets. This reflects the importance of accounting for the influence of other assets in the system when analyzing bilateral relationships, particularly in markets characterized by structural interlinkages across environmental and energy transitions. The right panel displays the lower-tail correlation coefficients at the 5th percentile against the upper-tail correlations at the 95th percentile. The consistent positioning of points below the diagonal line indicates a systematic asymmetry in dependence, with stronger co-movements during downside (lower-tail) market episodes than during extreme positive returns. This asymmetry can be attributed to market-wide deleveraging, investor herding behavior, and correlated ESG-related portfolio adjustments that typically intensify under systemic stress. In periods of crisis or uncertainty, such as geopolitical conflicts or climate shocks, investors tend to reduce exposure uniformly across sustainability-linked assets, leading to stronger interconnectedness in the downside regime. By contrast, during optimistic market phases, asset-specific factors such as innovation, policy support, or sectoral differentiation dominate performance, resulting in weaker and more dispersed upside co-movement. These observations align with the behavioral finance literature, as noted by [
24], which suggests that asymmetric investor reactions under uncertainty can lead to stronger co-movement during downturns. This is particularly relevant in ESG-linked assets, where systemic sentiment shifts often override idiosyncratic fundamentals during times of crisis. This behavioral and structural mechanism indicates the importance of distinguishing between upper- and lower-tail dependence when evaluating systemic risk and asset co-movements in sustainability-driven markets.
3.2. Static Dependence
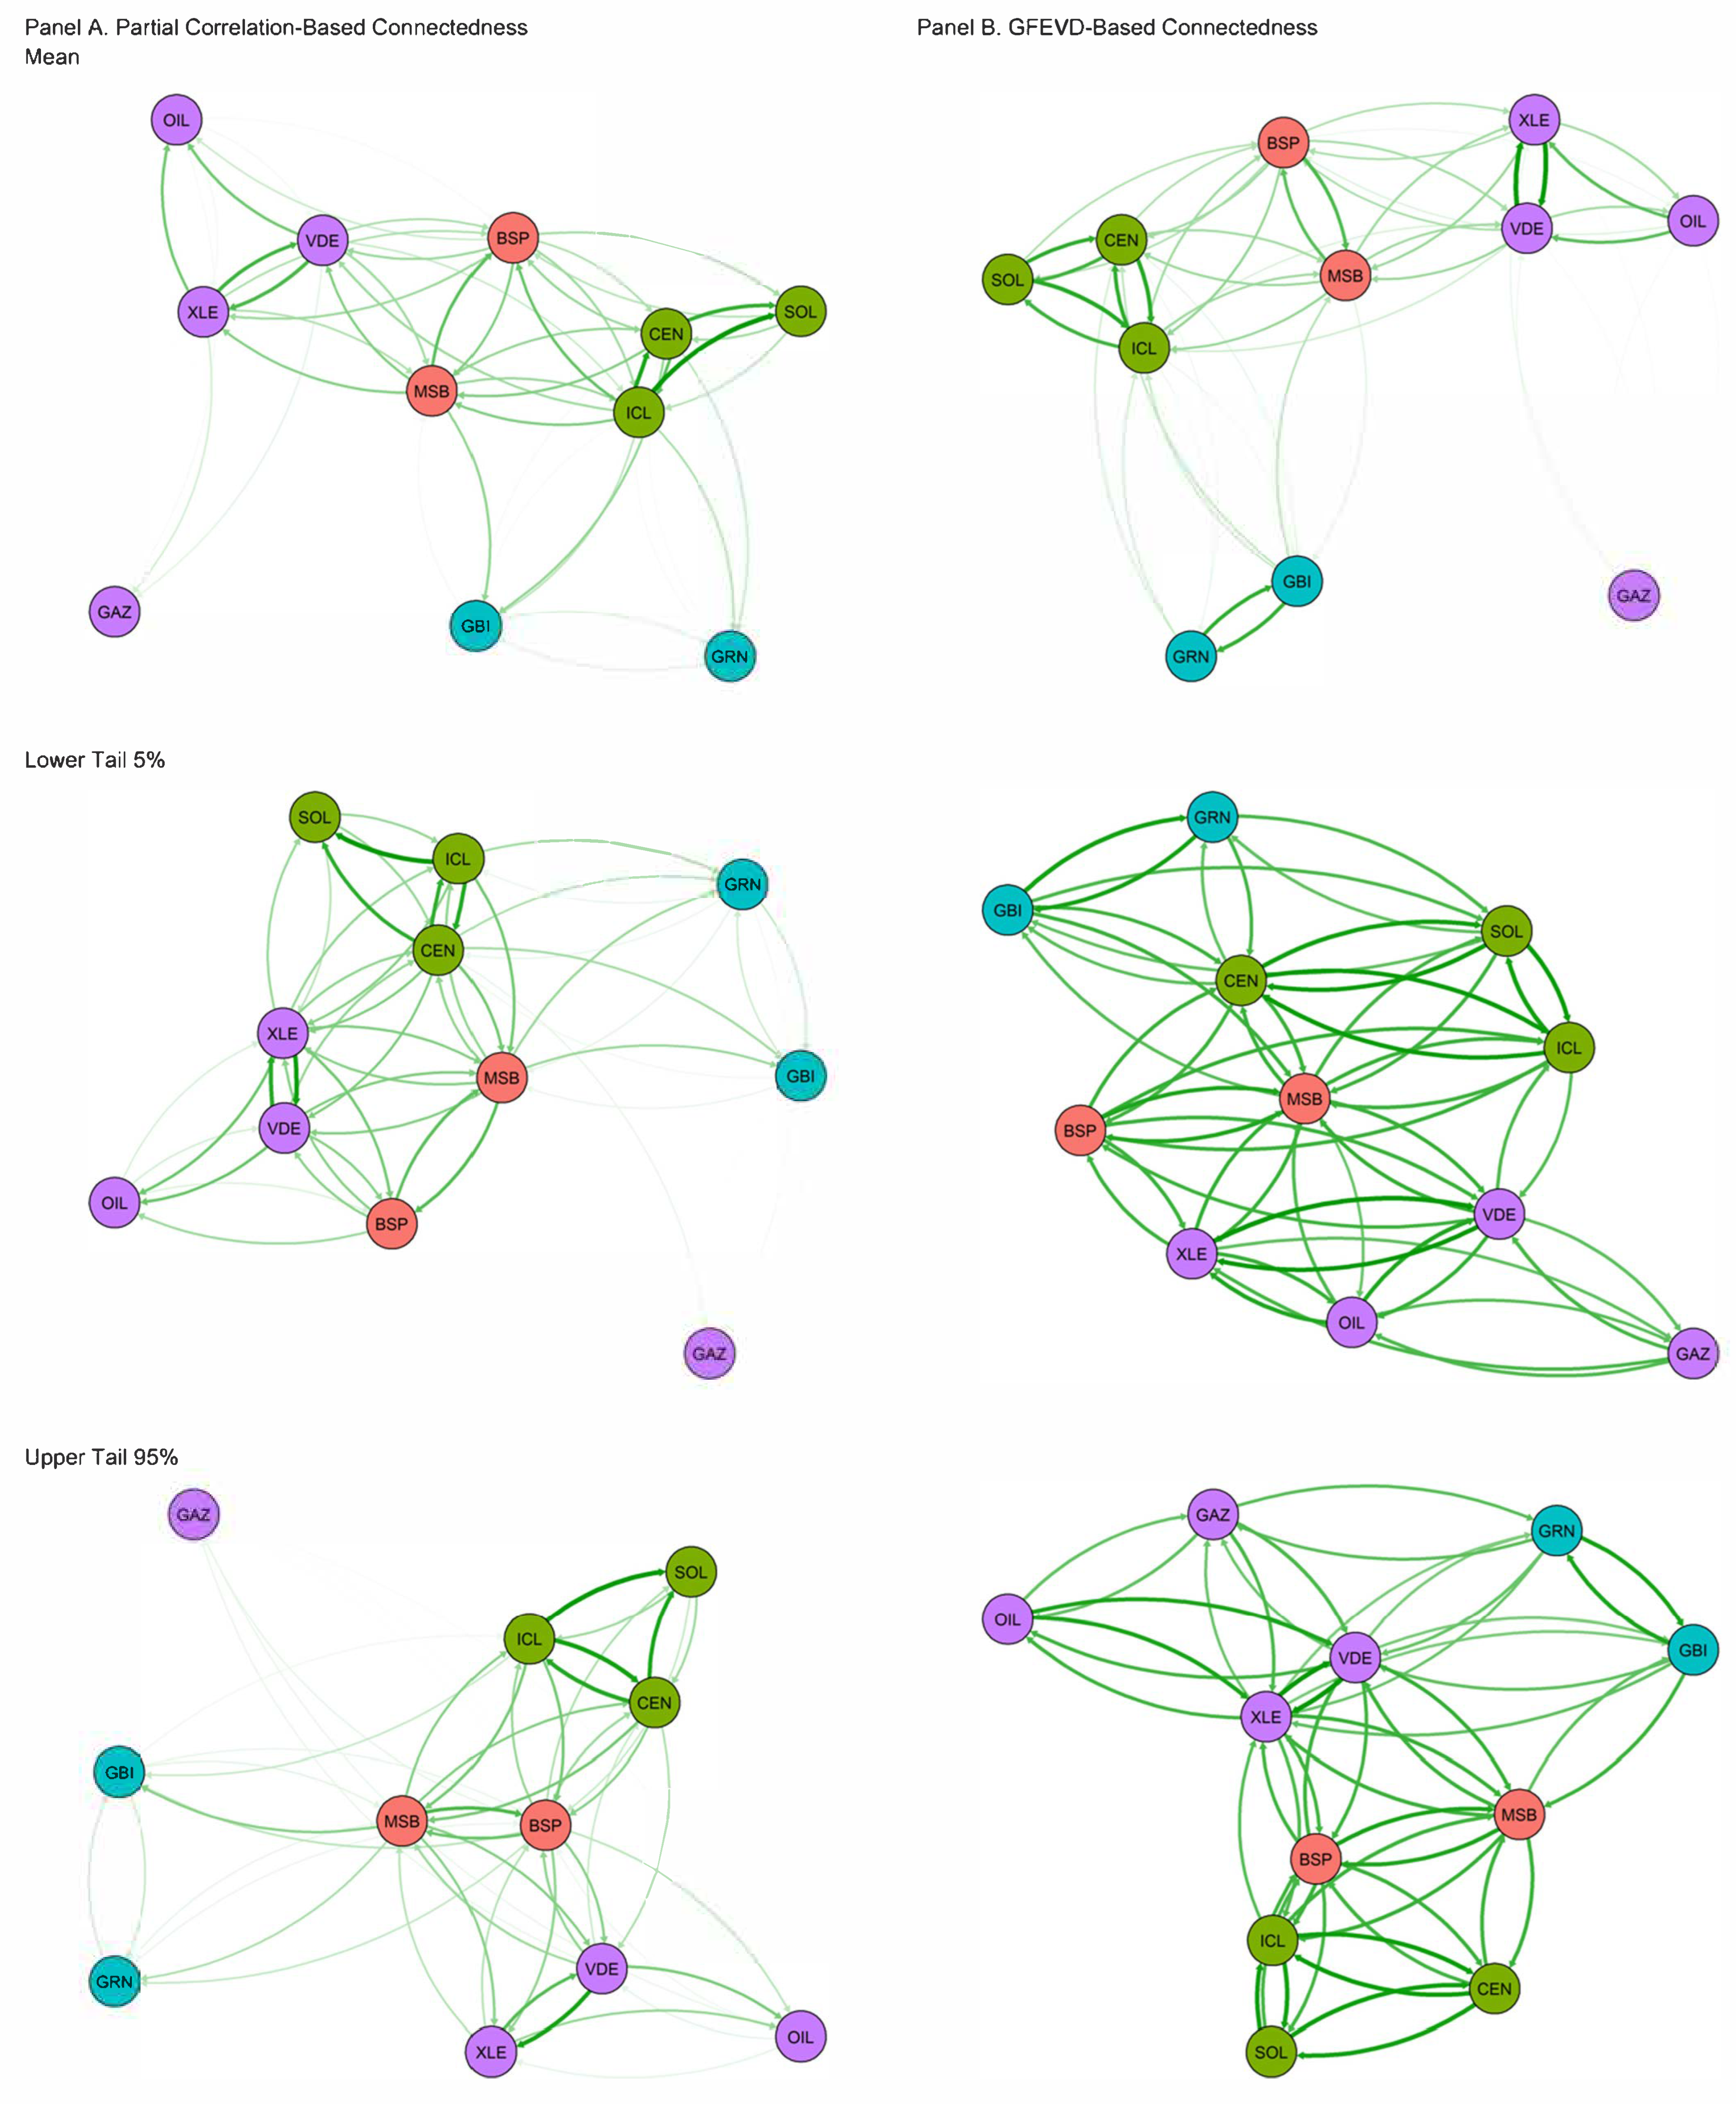
Figure 2 presents the networks of connectedness among 11 assets across four groups, biodiversity, clean and renewable energy, green fixed income instruments, and traditional energy, based on partial correlations (Panel A) and the GFEVD framework (Panel B). These networks are plotted for three states of the return distribution: the mean, lower tail (5%), and upper tail (95%). In line with [
23], we focus on the 5th and 95th percentiles to capture extreme downside and upside market conditions. This choice is further supported by the data characteristics presented in
Table 2, which show significant negative skewness and excess kurtosis across most series, confirming the presence of heavy-tailed and asymmetric distributions. The 5% and 95% thresholds offer an empirically grounded approach for analyzing tail dependence, as they isolate events of systemic importance while ensuring sufficient data coverage for reliable estimation.
The mean connectedness networks in
Figure 2 highlight significant differences between the partial correlation-based framework (Panel A) and the traditional GFEVD-based approach (Panel B). The partial correlation network is remarkably dense and exhibits a richer structure of direct linkages, indicating its strength in capturing more interdependencies among the eleven financial assets analyzed. By isolating the influence of third-party variables, the partial correlation method discovers direct spillover relationships often masked in variance decomposition-based models. This aligns with [
23], who argue that partial correlation methods better capture unstable but meaningful linkages during normal and turbulent periods, unlike GFEVD, which tends to inflate network density.
Clean and renewable energy assets, particularly CEN, SOL, and ICL, form the most tightly knit cluster in both models. However, their interconnections are stronger and more interpretable under the partial correlation approach. This reflects their synchronized market behavior and centrality in the low-carbon transition. Previous studies, such as [
7,
8], have similarly documented strong co-movement within clean energy markets, particularly during sharp investor focus on climate policy and technological innovation.
Biodiversity-related indices like BSP and MSB show stronger integration in the partial correlation network, suggesting their hidden systemic importance is better captured when indirect channels are filtered. This resonates with the findings of [
5,
15], which highlight the increasing financial materiality of biodiversity in sustainability-linked investment frameworks. Traditional energy assets such as GAZ remain largely peripheral across both models. However, the GFEVD-based network appears overly dense and dominated by exaggerated spillovers, likely due to its reliance on variance decompositions rather than conditional dependency structures. As [
10] suggest, the interaction between clean and dirty energy markets is heterogeneous and nonlinear, often requiring more granular tools to reflect underlying interdependencies accurately.
Under extreme negative market conditions (5% lower tail), the contrast between the two approaches becomes even more pronounced. The partial correlation network displays a highly clustered clean energy core (CEN, SOL, ICL) with dense and bidirectional spillovers, indicating strong internal contagion within this group during downturns. Biodiversity and traditional energy assets (XLE, VDE) also exhibit heightened connectivity to this clean energy cluster, suggesting tighter co-movement during distress, consistent with [
7], who report stronger connectedness at the tails of the return distribution. Moreover, this structure supports [
7]’s assertion that clean and dirty energy markets become more coupled during systemic stress. This finding is consistent with the SDG-aligned risk integration frameworks advocated by the NGFS in 2024, which emphasize the importance of accounting for sectoral convergence in climate-sensitive portfolios.
By contrast, the GFEVD-based network in the lower tail is almost entirely connected, with little differentiation in edge strength or spillover hierarchy. This “over-connectedness” masks key drivers of volatility and limits interpretability, particularly as green bond indices (GBI, GRN) appear more central in Panel B than justified by their actual influence, a misrepresentation also cautioned by [
11], who highlight the need to properly account for climate policy uncertainty when evaluating green market interconnectedness.
During extreme positive market conditions (95% upper tail), the partial correlation network again shows a strong and cohesive clean energy cluster. SOL, ICL, and CEN remain central, reflecting synchronized performance likely driven by bullish sentiment around green investment, policy incentives, and capital inflows. The alignment of biodiversity indices with clean energy under upside regimes suggests the growing perception of biodiversity-related assets as integral to the transition ecosystem—an observation supported by [
3,
14], who emphasize the investment relevance of nature-positive finance.
In contrast, the GFEVD-based network under the upper tail becomes densely tangled, with traditional energy assets (OIL, GAZ, XLE) appearing overly central. This contradicts observed patterns in the partial correlation approach and previous research (e.g., [
25]), which warns against overestimating the systemic role of conventional energy during green rallies. The failure of the GFEVD network to highlight the clean energy cluster’s internal cohesion further reinforces the methodological advantages of partial correlation networks in capturing meaningful interdependencies and avoiding spurious co-movements. Such overestimation by GFEVD models may lead to policy misinterpretations, particularly when allocating transition finance under regulatory frameworks such as the EU Taxonomy or the Corporate Sustainability Reporting Directive (CSRD).
3.3. Dynamic Dependence
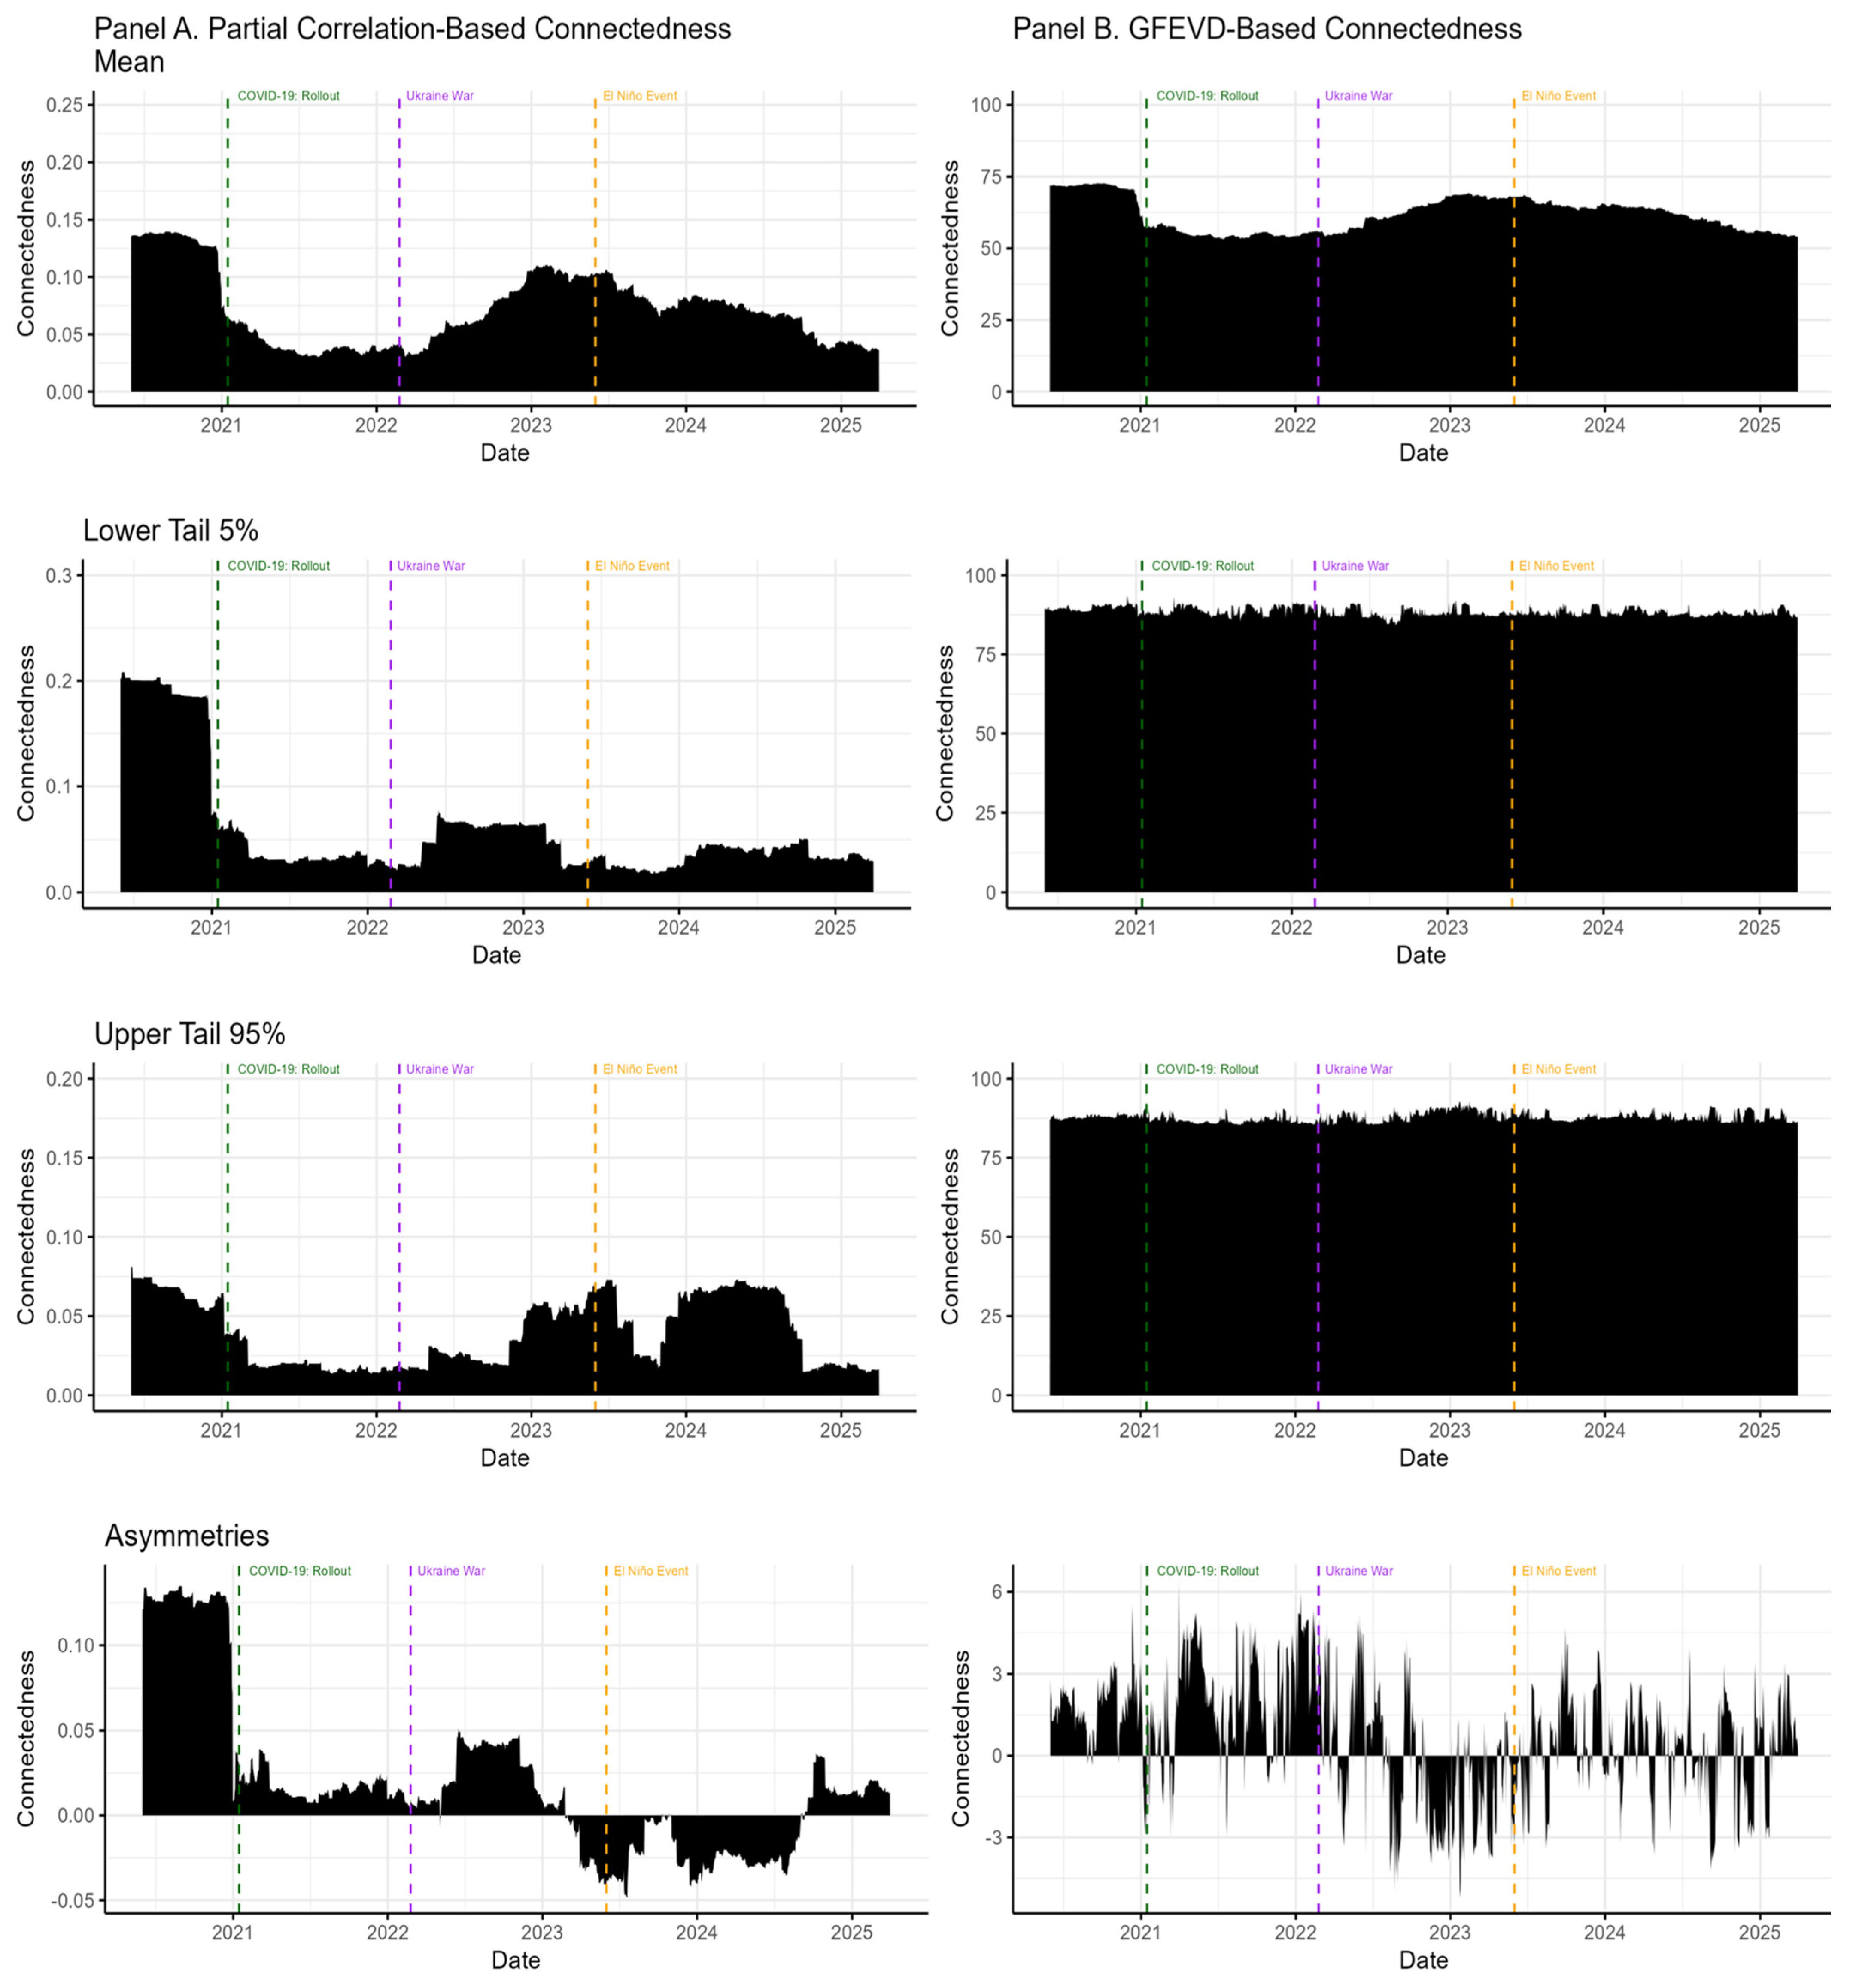
Figure 3 illustrates the time-varying total connectedness index (TCI) estimated using both the partial correlation-based connectedness (PCI) approach and the GFEVD method across the mean, lower (5%), and upper (95%) quantiles, along with asymmetry dynamics. The TCI is plotted from mid-2020 to 2025, with three major global events highlighted: the COVID-19 vaccine rollout in early 2021 (15 January 2021), the outbreak of the Russia–Ukraine war in 24 February 2022, and the onset of the 2023–2024 El Niño climate event (1 June 2023).
Figure 3 demonstrates that both models detect a sharp drop in connectedness immediately after the COVID-19 vaccine rollout in early 2021. This indicates a temporary decoupling of financial transition and biodiversity-linked assets as market uncertainty declined. This decline likely reflects the unwinding of ‘flight-to-safety’ behavior that had dominated ESG portfolios during the pandemic, as well as the normalization of fiscal and monetary policy responses across asset classes, reducing correlated risk exposure. However, the GFEVD-based TCI remains structurally higher and smoother throughout the sample, reflecting its tendency to overstate baseline interdependence due to its reliance on variance decomposition. In contrast, the partial correlation-based TCI displays more pronounced fluctuations, capturing shorter-term episodes of stress and resilience, such as the moderate spike around the Russia–Ukraine war and a notable surge during the El Niño event in early 2023. These dynamic changes are dampened or muted in the GFEVD panel.
In the lower tail (5%) of the return distribution,
Figure 3 highlights pronounced divergences between the partial correlation-based and GFEVD-based total connectedness indices. Panel A shows that during extreme downside market conditions, the PCI approach captures a substantial drop in connectedness following the COVID-19 vaccine rollout in early 2021, suggesting a disintegration of downside risk channels as investor uncertainty temporarily receded. However, connectedness begins to rise gradually after the Russia–Ukraine war outbreak and spikes more noticeably during the El Niño event, indicating that systemic downside dependencies intensify in response to geopolitical and environmental shocks. In contrast, Panel B reveals that the GFEVD-based TCI remains excessively high and almost flat across the entire period, close to 100%, offering limited insight into temporal variation. This static behavior implies overestimating risk transmission during downturns and undermines the ability to distinguish crisis-specific effects. Overall, the partial correlation method proves more effective in identifying periods of contagion versus decoupling in tail risk transmission, which aligns with findings from [
7,
8], who emphasize the asymmetric and event-sensitive nature of connectedness in extreme market states. These dynamic patterns also support the risk identification mandates set by international initiatives like the TNFD and the Sustainable Blue Economy Finance Principles [
26], which call for the quantification of nature-linked systemic vulnerabilities.
In the upper tail (95%) of the return distribution, the PCI-based total connectedness index (Panel A) demonstrates meaningful variation that reflects the dynamic nature of upside risk transmission. Initially, connectedness declines after the COVID-19 vaccine rollout, consistent with increased investor optimism and decoupling across asset classes. However, the index shows a sharp uptick during the 2023–2024 El Niño event, highlighting that climate-induced shocks amplify downside risks and drive synchronized rallies across transition-related assets. This pattern may be driven by policy-induced market expectations, where the El Niño’s environmental disruptions prompt urgent climate adaptation commitments, infrastructure investment, and regulatory support, fueling coordinated optimism in clean energy and biodiversity-linked instruments. This finding suggests that market optimism, perhaps linked to green policy announcements or climate adaptation measures, can also generate systemic co-movement during extreme positive conditions. In contrast, the GFEVD-based connectedness (Panel B) remains nearly constant at elevated levels, providing limited insight into how interdependencies evolve during bullish phases. These findings align with those of [
7], who emphasize the asymmetric connectedness across distributional extremes, and with [
11], who demonstrate that positive market sentiment tied to climate policy can significantly enhance interconnectedness among green and sustainable markets. These dynamic patterns confirm that the PCI approach isolates direct, systemic linkages that respond to common shocks, whereas idiosyncratic fluctuations, present in the GFEVD output, are filtered out. This makes the partial correlation-based connectedness a more targeted tool for identifying network-level contagion pathways rather than firm- or sector-specific noise.
The asymmetry plots in the final row of
Figure 3 provide valuable insights into how connectedness differs between extreme negative and positive return states. Panel A (partial correlation-based connectedness) indicates clear periods of asymmetry, particularly following major global events. For example, after the COVID-19 vaccine rollout in early 2021, the asymmetry index sharply drops, indicating that downside connectedness (lower tail) exceeded upside connectedness (upper tail). A noteworthy reversal occurs around the onset of the Ukraine war, where positive spillovers temporarily dominate, followed by strong downside dominance around the El Niño climate event. This fluctuation underscores systemic risk not evenly distributed across market phases, and biodiversity and clean energy assets respond more sensitively to shocks in one tail than the other.
These asymmetries may also reflect behavioral and policy-driven mechanisms. In the lower tail, heightened co-movement can be attributed to investor herding, panic selling, and synchronized de-risking in response to systemic shocks such as wars or climate disasters. During such periods, transition-linked assets, despite their long-term sustainability profile, may be treated as risk assets, intensifying spillovers. In contrast, upper-tail dependence may stem from coordinated investor optimism around green rallies, particularly when driven by policy announcements (e.g., subsidies, carbon pricing, or ESG mandates) that trigger the reallocation of capital into clean energy and biodiversity-linked instruments. These sentiment- and policy-induced dynamics are consistent with asymmetric connectedness patterns and further reinforce the relevance of quantile-based systemic risk modeling. Our results also highlight the suitability of tail-aware modeling frameworks for informing early warning systems and market stress testing in sustainability-driven capital markets.
In contrast, Panel B (GFEVD-Based Asymmetries) produces erratic and high-frequency noise with no clear patterns tied to specific events. The amplitude of fluctuations is also disproportionately large, making it challenging to extract meaningful tail-risk signals. This further supports the claim made by [
23] that GFEVD-based models fail to capture tail dynamics and often overstate noise as signal. The smoother and more interpretable asymmetry path generated by the PCI model aligns with the findings of [
7], who emphasize the importance of capturing tail-dependent spillovers in transition-linked markets.
3.4. Net Connectedness Analysis
To deepen the analysis of systemic risk transmission and absorption, we compute net connectedness measures for each asset under both the GFEVD and partial correlation (PC) frameworks across three regimes: mean, lower (5%), and upper (95%) quantiles. Net connectedness is defined as the difference between directional spillovers transmitted to others and received from others, as described in Equation (9). Positive values indicate that the asset is a net transmitter of shocks, while negative values signify a net receiver. This metric allows us to identify which assets act as systemic sources of risk and which act as buffers or sinks, a key distinction for policymakers and portfolio managers concerned with contagion and resilience in sustainability-linked financial markets.
Table 3 illustrates the net connectedness across distribution quantiles.
Under the GFEVD framework, most biodiversity and clean energy indices emerge as net receivers, particularly at the mean and lower tails. Traditional energy and green bond indices, especially OIL and GBI, act as consistent net transmitters across quantiles. This suggests that risk primarily originates from conventional and fixed-income transition assets, while biodiversity-linked assets absorb volatility.
By contrast, the partial correlation framework reveals a more different picture. At the mean, clean energy indices such as ICL and CEN, as well as biodiversity index MSB, are strong net transmitters, indicating that their influence is underrepresented in GFEVD. BSP also transmits modestly at the mean and intensifies its role during tail regimes. This suggests that biodiversity-linked indices do gain systemic relevance, particularly during downside (τ = 0.05) and upside (τ = 0.95) extremes.
Moreover, green bond indices (GBI, GRN) emerge as net receivers across all quantiles under PC, reinforcing the idea that fixed-income sustainability assets serve a stabilizing role rather than initiating systemic risk. This contrast between frameworks supports the argument that GFEVD may obscure structural influence due to indirect spillover inflation, while PC better isolates direct contagion pathways.
Finally, the fact that certain traditional energy assets (e.g., OIL) become net receivers under PC (especially in the upper tail) hints at regime-specific repositioning in investor portfolios during climate-related events or ESG-driven reallocations.
3.5. Robustness Check
To ensure the reliability of our results, we conduct two complementary robustness checks: (1) sensitivity to the choice of rolling window size, and (2) the stability of tail-connectedness dynamics across major systemic events.
3.5.1. Sensitivity to Rolling Window Size
To ensure the reliability of our results, we conducted a robustness check by estimating the total connectedness index (TCI) using multiple rolling window sizes (150, 200, and 250 days).
Figure 4 confirms the robustness of the dynamic evolution of systemic connectedness. Despite varying rolling window lengths, the general trend of the TCI remains consistent, particularly during structural shifts such as early 2021 and mid-2023. The narrow spread between the minimum and maximum connectedness values indicates high stability in the estimated patterns, while broader bands during volatile periods reflect expected short-term estimation sensitivity. This consistency demonstrates the reliability of the partial correlation-based TCI for detecting time-varying systemic interdependence across biodiversity, clean energy, and financial transition assets.
3.5.2. Event-Based Robustness Test of Tail Connectedness
To further validate the dynamic patterns observed in tail connectedness, we conduct an event-based robustness test focusing on three key global shocks: the COVID-19 vaccine rollout (15 January 2021), the onset of the Russia–Ukraine war (24 February 2022), and the El Niño climate event (1 June 2023). These events represent distinct episodes of geopolitical, health-related, and environmental stress, each with the potential to have systemic effects on sustainability-linked financial assets. For each event, we define three non-overlapping windows: (i) a pre-event window of 60 trading days before the event, (ii) an event window of 20 trading days centered on the event date (10 days before and after), and (iii) a post-event window of 60 trading days after the event.
We compute the average values of the total connectedness index (TCI) across each window using the partial correlation-based framework for (i) the full return distribution (mean connectedness), (ii) the lower tail (5%), and (iii) the upper tail (95%).
To formally assess abnormal fluctuation, we apply Welch’s
t-test for unequal variances to compare connectedness between pre-event and event periods, as well as between event and post-event periods. The results are summarized in
Table 4.
The results are largely consistent with the dynamic patterns observed in
Figure 3, reinforcing the view that systemic connectedness is highly sensitive to external shocks, especially in the tails. During the COVID-19 vaccine rollout, a statistically significant decline in total connectedness is observed across all quantiles (
p < 0.01), suggesting a broad-based decoupling effect as global uncertainty receded and market optimism improved. This finding aligns with the drop in both mean and tail connectedness shown in
Figure 3 during early 2021. The Russia–Ukraine war produces more modest changes, with the lower-tail and upper-tail connectedness showing significant shifts during the event window (
p < 0.01), while mean connectedness remains statistically stable. This confirms that the systemic effects of geopolitical shocks are more pronounced in the distributional extremes than at the center, as also indicated in the lower and upper panels of
Figure 3. The El Niño climate event exhibits a different profile: while the mean connectedness changes are relatively small, the upper-tail TCI increases significantly (
p < 0.01), indicating synchronized bullish responses, potentially reflecting green policy momentum or risk repricing around transition assets. These findings validate the interpretation of asymmetric dynamics highlighted in the asymmetry plots of
Figure 3 and demonstrate the importance of using tail-aware measures to detect crisis-induced systemic spillovers.
4. Conclusions
This study explored the dynamic and tail-dependent connectedness between biodiversity-linked assets, clean and renewable energy indices, green fixed-income instruments, and traditional energy markets. Using a novel partial correlation-based connectedness framework, we examined the evolution of systemic relationships across normal and extreme market conditions from 2019 to 2025, with particular attention to major global events including the COVID-19 vaccine rollout, the Russia–Ukraine war, and the El Niño climate episode.
Our findings reveal strong evidence of asymmetric dependence, with significantly higher connectedness observed in the tails of the return distribution compared to the mean. Clean and renewable energy assets consistently formed the connectedness network’s structural core, transmitting volatility during downturns and bullish periods. Biodiversity-related assets emerged as increasingly systemically relevant, particularly in times of environmental stress, suggesting their growing integration into broader financial risk channels. The comparison with the traditional GFEVD framework highlights the superior sensitivity of the partial correlation approach in detecting short-term shocks and filtering out indirect spillovers.
The policy implications of these findings are multifaceted. For regulators and financial supervisors, the results demonstrate the need to enhance systemic risk monitoring by incorporating nature-related financial risks, especially as biodiversity assets become more mainstream in ESG investing. These findings also contribute to the implementation of emerging global policy frameworks that aim to internalize financial risks related to nature. For instance, the increasing systemic relevance of biodiversity-linked assets observed in our analysis directly supports the objectives of the Task Force on Nature-related Financial Disclosures (TNFD), which calls for better risk identification, measurement, and disclosure of nature-related dependencies and impacts. Similarly, the EU Corporate Sustainability Reporting Directive (CSRD) emphasizes the need for double materiality assessments, particularly for biodiversity and ecosystem risks, areas where our quantile-based network approach can enhance transparency. Furthermore, our results align with the goals of the Kunming–Montreal Global Biodiversity Framework, notably Target 15, which encourages financial institutions to integrate biodiversity considerations into their decision-making and risk management processes. By revealing how biodiversity risks manifest systemically under tail events, this study offers a methodological foundation for aligning investment and policy strategies with nature-positive outcomes.
These findings also resonate with broader international efforts to mainstream nature-related risks into financial and regulatory frameworks. For example, the Network for Greening the Financial System (NGFS, 2024) encourages central banks and financial supervisors to integrate biodiversity loss into their risk assessments. The World Bank’s Blue Economy Finance Principles (2018), the EU Sustainable Blue Economy Strategy (2022), and the British Commonwealth’s Blue Charter Action Group (2020) collectively indicate the importance of financing marine biodiversity and ocean sustainability. By providing a quantile-based connectedness framework that captures systemic vulnerabilities across nature-linked asset classes, our study offers methodological support to these initiatives and enhances their implementation in capital markets.
From a portfolio perspective, our findings offer actionable insights for sustainable investment strategies. The evidence of strong tail dependence suggests that clean energy and biodiversity-linked assets play a dual role. While they contribute to long-term sustainability goals, they may also amplify systemic volatility during extreme conditions. As such, investors may consider dynamic allocation strategies that adjust exposure based on market regime signals, incorporate tail-risk metrics into ESG portfolio construction, and diversify across asset classes with differentiated exposure to environmental shocks. This approach may enhance portfolio resilience and align financial returns with ecological stability.
Future research could extend this framework to include emerging nature-related financial instruments such as biodiversity credits and nature-backed tokens or assess cross-border spillovers in biodiversity finance. As markets progress to price ecological sustainability, integrating tail-aware, nonlinear dependence frameworks will be increasingly vital for informed financial decision-making.


