Article

Integrated Assessment of Lake Degradation and Revitalization Pathways: A Case Study of Phewa Lake, Nepal

by
Avimanyu Lal Singh
*,
Bharat Raj Pahari
and
Narendra Man Shakya
Department of Civil Engineering, IOE, Pulchowk Campus, Tribhuvan University, Lalitpur 44700, Nepal
*
Author to whom correspondence should be addressed.
Sustainability 2025, 17(14), 6572; https://doi.org/10.3390/su17146572
Submission received: 12 June 2025 / Revised: 7 July 2025 / Accepted: 16 July 2025 / Published: 18 July 2025
(This article belongs to the Special Issue Innovations in Environment Protection and Sustainable Development)

Abstract

Phewa Lake, Nepal’s second-largest natural lake, is under increasing ecological stress due to sedimentation, shoreline encroachment, and water quality decline driven by rapid urban growth, fragile mountainous catchments, and changing climate patterns. This study employs an integrated approach combining sediment yield estimation from its catchment using RUSLE, shoreline encroachment analysis via satellite imagery and historical records, and identification of pollution sources and socio-economic factors through field surveys and community consultations. The results show that steep, sparsely vegetated slopes are the primary sediment sources, with Harpan Khola (a tributary of Phewa Lake) contributing over 80% of the estimated 339,118 tons of annual sediment inflow. From 1962 to 2024, the lake has lost approximately 5.62 sq. km of surface area, primarily due to a combination of sediment deposition and human encroachment. Pollution from untreated sewage, urban runoff, and invasive aquatic weeds further degrades water quality and threatens biodiversity. Based on the findings, this study proposes a way forward to mitigate sedimentation, encroachment, and pollution, along with a sustainable revitalization plan. The approach of this study, along with the proposed sustainability measures, can be replicated in other lake systems within Nepal and in similar watersheds elsewhere.

1. Introduction

Shallow lakes play a crucial role as ecosystems, offering significant socio-economic, environmental, and climatic benefits [1]. Nevertheless, in recent decades, their area, water quality, and ecological integrity have substantially declined across various parts of the world, largely as a result of extensive human activity and the impacts of climate change [2,3]. For instance, urbanization causes rapid land encroachment around shallow lakes [4]. Likewise, land use changes in catchments with sloping mountainous terrain contribute to excessive sedimentation [5,6]. Along with pollution from agriculture and industry and the accelerating effects of climate change, these pressures severely degrade habitats, reduce biodiversity, and deteriorate water quality, driving many shallow lakes toward ecological collapse [7,8,9]. Similarly, the Intergovernmental Panel on Climate Change (IPCC) projects that rising global temperatures will increase lake surface temperatures and alter mixing regimes, further stressing these ecosystems [10]. Nepal’s lake systems are equally vulnerable, facing the combined impacts of land use change, pollution, and climate-induced stressors, which urgently demand coordinated and multidisciplinary action to prevent irreversible ecological degradation.
Recent national surveys of Nepal have documented 5358 lakes across 74 of Nepal’s 77 districts, with over 50% located below 500 m and 42% above 3000 m, reflecting the country’s vast altitudinal range and ecological diversity [11]. These freshwater systems provide essential services including tourism, drinking water supply, irrigation as well as hydropower generation [12]. However, most of Nepal’s lakes are fed by streams originating in steep, mountainous catchments, making them particularly vulnerable to erosion and sedimentation [13]. The situation is exacerbated by climate change, which has intensified rainfall variability and increased the frequency of extreme weather events in recent years [14]. Unregulated road construction, widespread land use changes triggered by forest fires, and deforestation have further destabilized slopes, accelerating soil loss and contributing to unprecedented sediment outflows into downstream water bodies [15,16]. This sedimentation not only threatens the ecological balance and storage capacity of lakes but also shortens their functional lifespan [17].
Urbanization presents an additional, rapidly escalating threat to lake sustainability in Nepal [18,19]. As population centers expand, the lands surrounding lakes are increasingly encroached upon, often through informal settlements and infrastructure development. Simultaneously, inadequate sewage and sanitation networks lead to the discharge of untreated domestic and industrial effluents directly into lake waters, causing severe water quality degradation. Despite growing public awareness and policy-level acknowledgment of these challenges, conservation efforts remain underfunded, fragmented, and poorly implemented largely due to a lack of comprehensive data and understanding of the scale, nature, and drivers of lake degradation [20,21].
This study focuses on Phewa Lake, one of Nepal’s largest and most ecologically stressed due to its location within the rapidly growing city of Pokhara [11]. Its fragile catchment and intense anthropogenic pressures make Phewa Lake a representative case for understanding broader challenges in lake sustainability across Nepal. Phewa Lake plays a vital role in regional development supporting irrigation for over 320 hectares of farmland, powering the 500 kW Phewa Hydropower Station, and sustaining a vibrant tourism economy in Pokhara [22]. However, the lake is under severe threat from accelerated sedimentation, encroachment, pollution, and unplanned urban expansion [13,23,24,25]. This research adopts a multidisciplinary approach to assess the current condition of Phewa Lake and its watershed, and to propose evidence-based strategies for its sustainable management.
To assess sediment inflow from the catchment, the Revised Universal Soil Loss Equation (RUSLE) was applied, a modeling approach widely used for erosion assessment in Himalayan watersheds and effective for planning conservation interventions [26,27]. Satellite imagery across different time periods, along with historical reports and literature, was analyzed to detect and quantify patterns of lake area encroachment. Extensive field surveys, including bathymetric measurements, were conducted to assess lakebed conditions and physical changes. Community consultations were held to trace pollution sources, understand local perspectives, and evaluate the current socio-economic contributions of the lake. These combined methods provide a comprehensive understanding of the lake’s degradation and inform strategies for sustainable restoration.
Similar studies from outside Nepal demonstrate the importance and transferability of integrated watershed and sediment management approaches. For example, in the Hongfeng Reservoir of Southwest China, sedimentation was linked with catchment land use through RUSLE modeling and sediment core analysis, showing how deforestation and agricultural expansion accelerated siltation [28]. Likewise, in Lake Pamvotis, Greece, and the Three Gorges area of China, spatially distributed erosion modeling using RUSLE and bathymetric surveys revealed comparable sediment dynamics and the importance of land-based interventions in sediment control [29,30]. These cases reinforce the relevance of the methods and recommendations presented in this study to other mountainous and densely populated lake catchments worldwide.
Based on these findings, this study proposes a sediment-trapping dam with detailed geometric and locational specifications to mitigate further sediment inflow. Moreover, a SWOT-based strategy is developed to explore new revenue-generating opportunities aimed at enhancing the lake’s economic value while ensuring its ecological restoration. The ultimate goal is to develop a replicable model for lake sustainability that can be implemented across Nepal and in other regions with similar geographic and socio-economic contexts. By demonstrating that scientifically informed, community-supported interventions can reverse degradation trends and deliver tangible socio-economic returns, this research aspires to shift lake conservation from reactive crisis management to proactive sustainability planning.

2. Study Area

Phewa Lake, located in the Pokhara Valley of western Nepal, is the largest lake in the valley and the second largest in the country. Geographically, it lies between 28°11′39″ to 28°17′25″ N latitude and 83°47′51″ to 83°59′17″ E longitude (Figure 1). The lake spans approximately 4 km in length, with a variable width of 100 m to 2 km, and covers a catchment area of approximately 122.53 sq. km. It is a semi-natural, subtropical freshwater body regulated by a dam and fed by tributaries including Harpan, Phirke, and Adheri Khola.
Situated at an average elevation of 822 m, the Pokhara Valley hosts several glacial-origin lakes, including Begnas and Rupa. Among these, Phewa Lake holds national importance for its multifaceted functions, including irrigation, hydropower generation via the Phewa Hydropower Station, and as a major hub for tourism and recreation [13]. Pokhara valley, including the Phewa Lake watershed, has a humid subtropical climate with an average annual rainfall of about 3875 mm, 85% of which falls during the monsoon (June–September). Rainfall intensity has increased as the number of rainy days decreased, causing heavier precipitation over shorter periods. This intense, concentrated rainfall drives high surface runoff and erosion in the steep catchments around the lake, with monthly precipitation sometimes exceeding 1200 mm [31]. The lake’s watershed is ecologically sensitive, characterized by steep mountainous slopes and mixed vegetation, which contribute significantly to runoff and sediment inflow. The western zone functions as a silt trap, while the southern slopes remain forested with sparse settlement. In contrast, the northern and eastern shores experience intense anthropogenic pressure from dense urban development and agriculture [13,32]. These contrasting land uses intensify soil erosion, sediment transport, and nutrient loading, altering lake morphology and water quality. Similarly, the soils in the Phewa Lake watershed are predominantly classified as Cambisols and Regosols according to the World Reference Base (WRB), formed from weathered phyllite and quartzite bedrock. These soils mainly exhibit loam to sandy loam textures, which contribute to moderate to high erodibility values used in RUSLE’s K-factor calculations [33].

3. Methodology

This study adopts a multidisciplinary methodology to assess the degradation of Phewa Lake and propose sustainable restoration strategies (Figure 2). The analysis integrates geospatial modeling, hydrologic and hydraulic simulation, and field-based assessments. Soil erosion susceptibility in the Harpan Khola watershed, the primary sediment source for the lake, was estimated using the Revised Universal Soil Loss Equation (RUSLE), a model developed by [34]. To evaluate flood risks and design hydraulic interventions, design discharge was derived from multiple hydrologic methods and rainfall frequency analysis using long-term meteorological records. Hydraulic modeling was conducted to guide the design of sediment-trapping structures based on river geometry, discharge, and sediment characteristics. Additionally, shoreline encroachment was assessed through cadastral data and high-precision topographic surveys using the Differential Global Positioning System (DGPS), while pollution sources were identified through field surveys and stakeholder consultations. This integrated framework provides a robust foundation for understanding lake degradation processes and informing restoration planning.
The data required for RUSLE modeling were obtained from verified institutional and international sources. Precipitation data were collected from four stations (Panchase, Lumle, Pokhara Airport, and Lamachaur) through the Department of Hydrology and Meteorology (DHM) [35]. Soil property data for calculating the K factor were sourced from the Soil and Terrain Database (SOTER) for Nepal [36], while the land use/land cover (LULC) data used to derive the C factor were obtained from ICIMOD’s dataset [37]. The Digital Elevation Model (DEM) (30 m × 30 m resolution) used to compute LS and P factors was extracted from SRTM DEM.

3.1. Soil Erosion Susceptibility Analysis

Soil erosion susceptibility was assessed using the Revised Universal Soil Loss Equation (RUSLE), a well-established empirical model extensively applied in Nepal [38,39]. RUSLE estimates annual soil loss (A) through the product of five parameters: rainfall erosivity (R), soil erodibility (K), topographic factor (LS), cover management (C), and support practice (P), as mentioned in Equation (1) [40].
A = R × K × LS × C × P
where “A” is soil loss (t ha−1 yr−1), “R” is rainfall erosivity factor (MJ mm ha−1 h−1 yr−1), “K” is soil erodibility factor (t ha h ha−1 MJ−1 mm−1), “LS” is slope-length and slope steepness factor (dimensionless), “C” is land management factor (dimensionless), and “P” is conservation practice factor (dimensionless). The R factor was derived using long-term daily precipitation data from four meteorological stations (Panchase, Lumle, Pokhara Airport, Lamachaur), provided by the Department of Hydrology and Meteorology, Nepal. R value is calculated using the relation as mentioned in Equation (2) Thapa [41], whereas P in Equation (2) denotes mean annual rainfall in mm.
R = 38.5 + 0.35P
The soil erodibility factor (K) given by Equation (3) [42], quantifies the susceptibility of soil particles to detachment and transport by rainfall and runoff. It was estimated using soil texture (% sand, silt, and clay) and organic carbon content data obtained from the Soil and Terrain Database (SOTER) for Nepal [43].
K = Fcsand × F(si-cl) × Forg × Fhisand × 0.137
where
Fcsand = 0.2 + 0.3 × e (−0.0256 × SAN × (1 − SIL/100))
F(si-cl) = (SIL/(CLA + SIL))3
Forg = 1.0 − (0.25 × C)/(C + e (3.72 − 2.95 × C))
Fhisand = 1.0 − (0.7 × SN1)/(SN1 + e (−5.51 + 22.9 × SN1))
Here, SAN, SIL, and CLA are the percentages of sand, silt, and clay, respectively; C is the organic carbon content; and SN1 is the fraction of sand (1—sand%) expressed as a decimal. The LS factor was computed using a DEM, with sinks filled following [42] using QGIS. Zhang et al.’s [28] approach was then applied to derive the slope length and steepness components from the filled DEM. This factor captures the influence of terrain on overland flow transport capacity. The C factor was mapped from a land use/land cover (LULC) dataset by ICIMOD [37], assigning standard C values for each land use type (e.g., 0.03 for forest and 0.45 for barren land), following Panagos et al. [44]. The LULC map was reclassified using QGIS raster calculator. The P factor reflects conservation practices and was derived from slope percentage classes generated from the DEM. Values were assigned based on slope ranges [38,42], with lower P values for gentler slopes indicating higher conservation effectiveness. To account for sediment deposition before reaching the lake, a Sediment Delivery Ratio (SDR) was applied. The SDR was estimated using three established empirical methods: William and Berndt [45], Vanoni [46], and the USDA Curve method [47].

3.2. Hydrologic Analysis

3.2.1. Design Flood Analysis

To estimate the design flood discharge for the Harpan Khola catchment, multiple widely accepted hydrological methods were reviewed. These include the Water and Energy Commission Secretariat (WECS) method [47], the Modified Dicken’s method [48], and the Curve Number (CN) method [49]. Each of these approaches provides a different means of estimating flood peaks based on empirical or physically based relationships suited to Himalayan catchments. Among the resulting discharges from these methods, the highest value was selected for use in subsequent hydraulic and flood modeling to ensure a conservative and safe design approach. The details of each method and the corresponding calculations are presented hereafter.
1. The Water and Energy Commission Secretariat (WECS) Method: The WECS has developed an empirical relationship for analyzing flood of different frequencies for Nepali rivers. The detailed way of calculating the flood for different return as given by WECS is mentioned in Table 1.
2. Modified Dicken’s Method: According to Modified Dicken’s formula, T year discharge QT in m3/s is given as Q T = C T × A 0.75 , where A is the total catchment area in sq. km and CT given by Equation (4) is the modified Dicken’s constant proposed by the Irrigation Research Institute, Roorkee, India, based on frequency studies on Himalayan rivers. The constant is computed as given by Equations (8) and (9).
C T = 2.342 × l o g 0.6 × T × l o g 1185 p + 4
p = 100 × a + 6 A + a
where ‘a’ is perpetual snow area in sq. km which is 0 sq. km in the catchment, T is the return period in years, and A is catchment area which was 84.3599 sq. km [50].
3. Curve Number (CN) Method: The Curve Number (CN) method, developed by the United States Department of Agriculture, is commonly used to estimate surface runoff from rainfall events. As outlined by USDA NRC [51], the method follows a defined formula. For the Harpan Khola catchment, the Curve Number was calculated using the Curve Number Generator (Global) plugin, created by European Space Agency and Oak Ridge National Laboratory (USA), which is available in QGIS. The resulting CN value for the catchment was 58.314.
P o t e n t i a l m a x i m u m r e t e n t i o n , S = 1000 C N 10
I n i t i a l a b s t r a c t i o n , I a = 0.2 × S
D i r e c t R u n o f f , Q = P I a 2 P I a + S
where
CN = Curve Number (dimensionless), a value determined by land use, soil type, and hydrologic condition.
S = Potential maximum retention after runoff begins (in mm).
Ia = Initial abstraction (in mm), which includes water losses before runoff begins (e.g., infiltration and surface storage).
P = Total rainfall (in mm).
Q = Direct runoff (in mm).

3.2.2. Frequency Analysis

Frequency analysis was carried out to estimate the likelihood and magnitude of extreme rainfall events, which are critical inputs for hydrologic and hydraulic design. Daily rainfall data (1980–2020) from three meteorological stations Pokhara Airport, Lamachaur, and Lumle were used for analysis. Thiessen polygon weighting was used to compute a representative mean rainfall over the catchment area. Two statistical approaches were then applied to analyze annual maximum rainfall: (1) Weibull’s Plotting Position Method, which ranks observed events to estimate their return periods, and (2) Log-Pearson Type III Distribution, a probability-based method that uses log-transformed data, skewness, and frequency factors to estimate rainfall for different return intervals. As each method can yield slightly different rainfall estimates for a given return period, this study adopts a conservative approach by selecting the maximum rainfall estimate obtained from the methods for each return period. This ensures that subsequent analyses, such as flood estimation and infrastructure design, are based on a precautionary and risk-informed foundation.

3.3. Hydraulic Analysis

Hydraulic analysis was conducted for the 806 m long proposed siltation dam and associated marginal bunds upstream to Pame. This involved daily discharge data, sediment rating curves, particle size distributions (PSDs) of suspended and bed materials, and longitudinal and cross-sectional profiles of the river. Manning’s roughness coefficient was estimated using Yarahmadi et al. [52], based on moderate channel irregularity, firm soil, minor vegetation, and low sinuosity. The dam was modeled as a WES-standard spillway with a 3:3 upstream face. Daily discharge data (1984) was taken from JICA Nepal & SILT [53], and monthly sediment concentrations from Impat [54], showing 50–90% of annual erosion occurs pre-monsoon [55]. Since PSD data was unavailable, the Rosin–Rammler model Sitting [56] was used which is given by Equation (9).
Y = 1 e x p x / x 0 n
Parameters were derived from Ross [57], who reported average grain sizes of 20 μm for the silt trap and 6.27 μm for lakebed sediments. Two Rosin–Rammler curves were superimposed to estimate the PSD for use in Hydrologic Engineering Center—River Analysis System (HEC–RAS). The river longitudinal profile was extracted from DEM in QGIS Version 3.40 and is corrected for potential abnormal slope patterns likely from DEM resolution issues using Santillan and Makinano-Santillan [58]. Corrections included bump removal and linear extrapolation near the lake, justified by annual dredging. For sediment transport simulation in HEC–RAS, the Laursen (Copeland) method [59] was used as it best suits fine silt. The Thomas sorting method (Ex5) [60] was selected to reflect minimal erosion in deeper layers. The Soulsby fall velocity method [61] and Veneer method were applied for settling velocity estimation and distribution across the channel and floodplain, respectively.

3.4. Encroachment and Pollution Assessment

To assess the encroachment status of Phewa Lake, both secondary and primary data sources were employed. Secondary data comprised historical land use records and cadastral maps from the Department of Survey and the Department of Land Revenue. For primary data, a detailed topographical survey was conducted in April 2024 to accurately delineate the current lake boundary as officially defined in the Nepal Gazette (Part 5, Section 70). The survey utilized Differential Global Positioning System (DGPS) technology combined with the SW Maps mobile application and an external Global Navigation Satellite System (GNSS) receiver. Real-Time Kinematic (RTK) corrections were applied via Networked Transport of RTCM via Internet Protocol (NTRIP), significantly enhancing positional accuracy from standard GPS meter-level to sub-meter or centimeter-level precision. Field data collection involved systematic traversing along the lake perimeter, recording waypoints at high spatial density to capture boundary features precisely. The DGPS setup was calibrated prior to data collection using a known reference point, ensuring reliability of measurements. A bathymetric survey was also carried out using Sound Navigation and Ranging (SONAR) technology specifically the Garmin Echo Map Chirp 43 DV to generate high-resolution depth profiles of the lakebed, aiding in the physical characterization of the lake’s extent. The collected geospatial and bathymetric data were exported in GIS-compatible formats (e.g., shapefiles) for subsequent processing and analysis in GIS software. This high-precision surveying approach enabled reliable mapping of the official lake boundary and identification of encroached land parcels, supporting informed land management and conservation efforts.
To assess the pollution status of Phewa Lake, a series of field visits were conducted in 2024. Observations focused on visual indicators such as turbidity, sediment-laden runoff, floating debris, and aquatic weed presence. Photographic documentation was carried out at key lakefront sites including Dam Site, Gauri Ghat, and Barahi Ghat—locations identified as major entry points of stormwater and domestic sewage from Pokhara city. Field teams also recorded visible wastewater discharge points and runoff from nearby agricultural areas.

3.5. Development of the Lake Revitalization Plan

To develop a comprehensive revitalization plan for Phewa Lake, an integrated synthesis approach was adopted, drawing directly from the findings of hydrologic, hydraulic, sedimentation, pollution, and encroachment assessments. Key physical interventions such as the proposed siltation dam, diversion canals, and shoreline enhancements were formulated based on scenario modeling (e.g., sediment trap efficiency under various weir heights), flood frequency analysis, and field-based observations of pollution hotspots and encroached boundaries. International case studies were systematically reviewed to validate the applicability of ecosystem-based sediment and pollution control strategies in comparable lake environments. In addition, a SWOT (Strengths, Weaknesses, Opportunities, and Threats) framework was applied to contextualize socio-ecological, institutional, and infrastructural dynamics and to identify strategic priorities. The revitalization concept was further guided by multi-criteria planning, incorporating spatial data analysis, local governance structures, and stakeholder considerations. This evidence-based, interdisciplinary approach ensured that the proposed interventions were both technically feasible and aligned with sustainable lake management practices.

4. Result and Discussion

4.1. Sedimentation

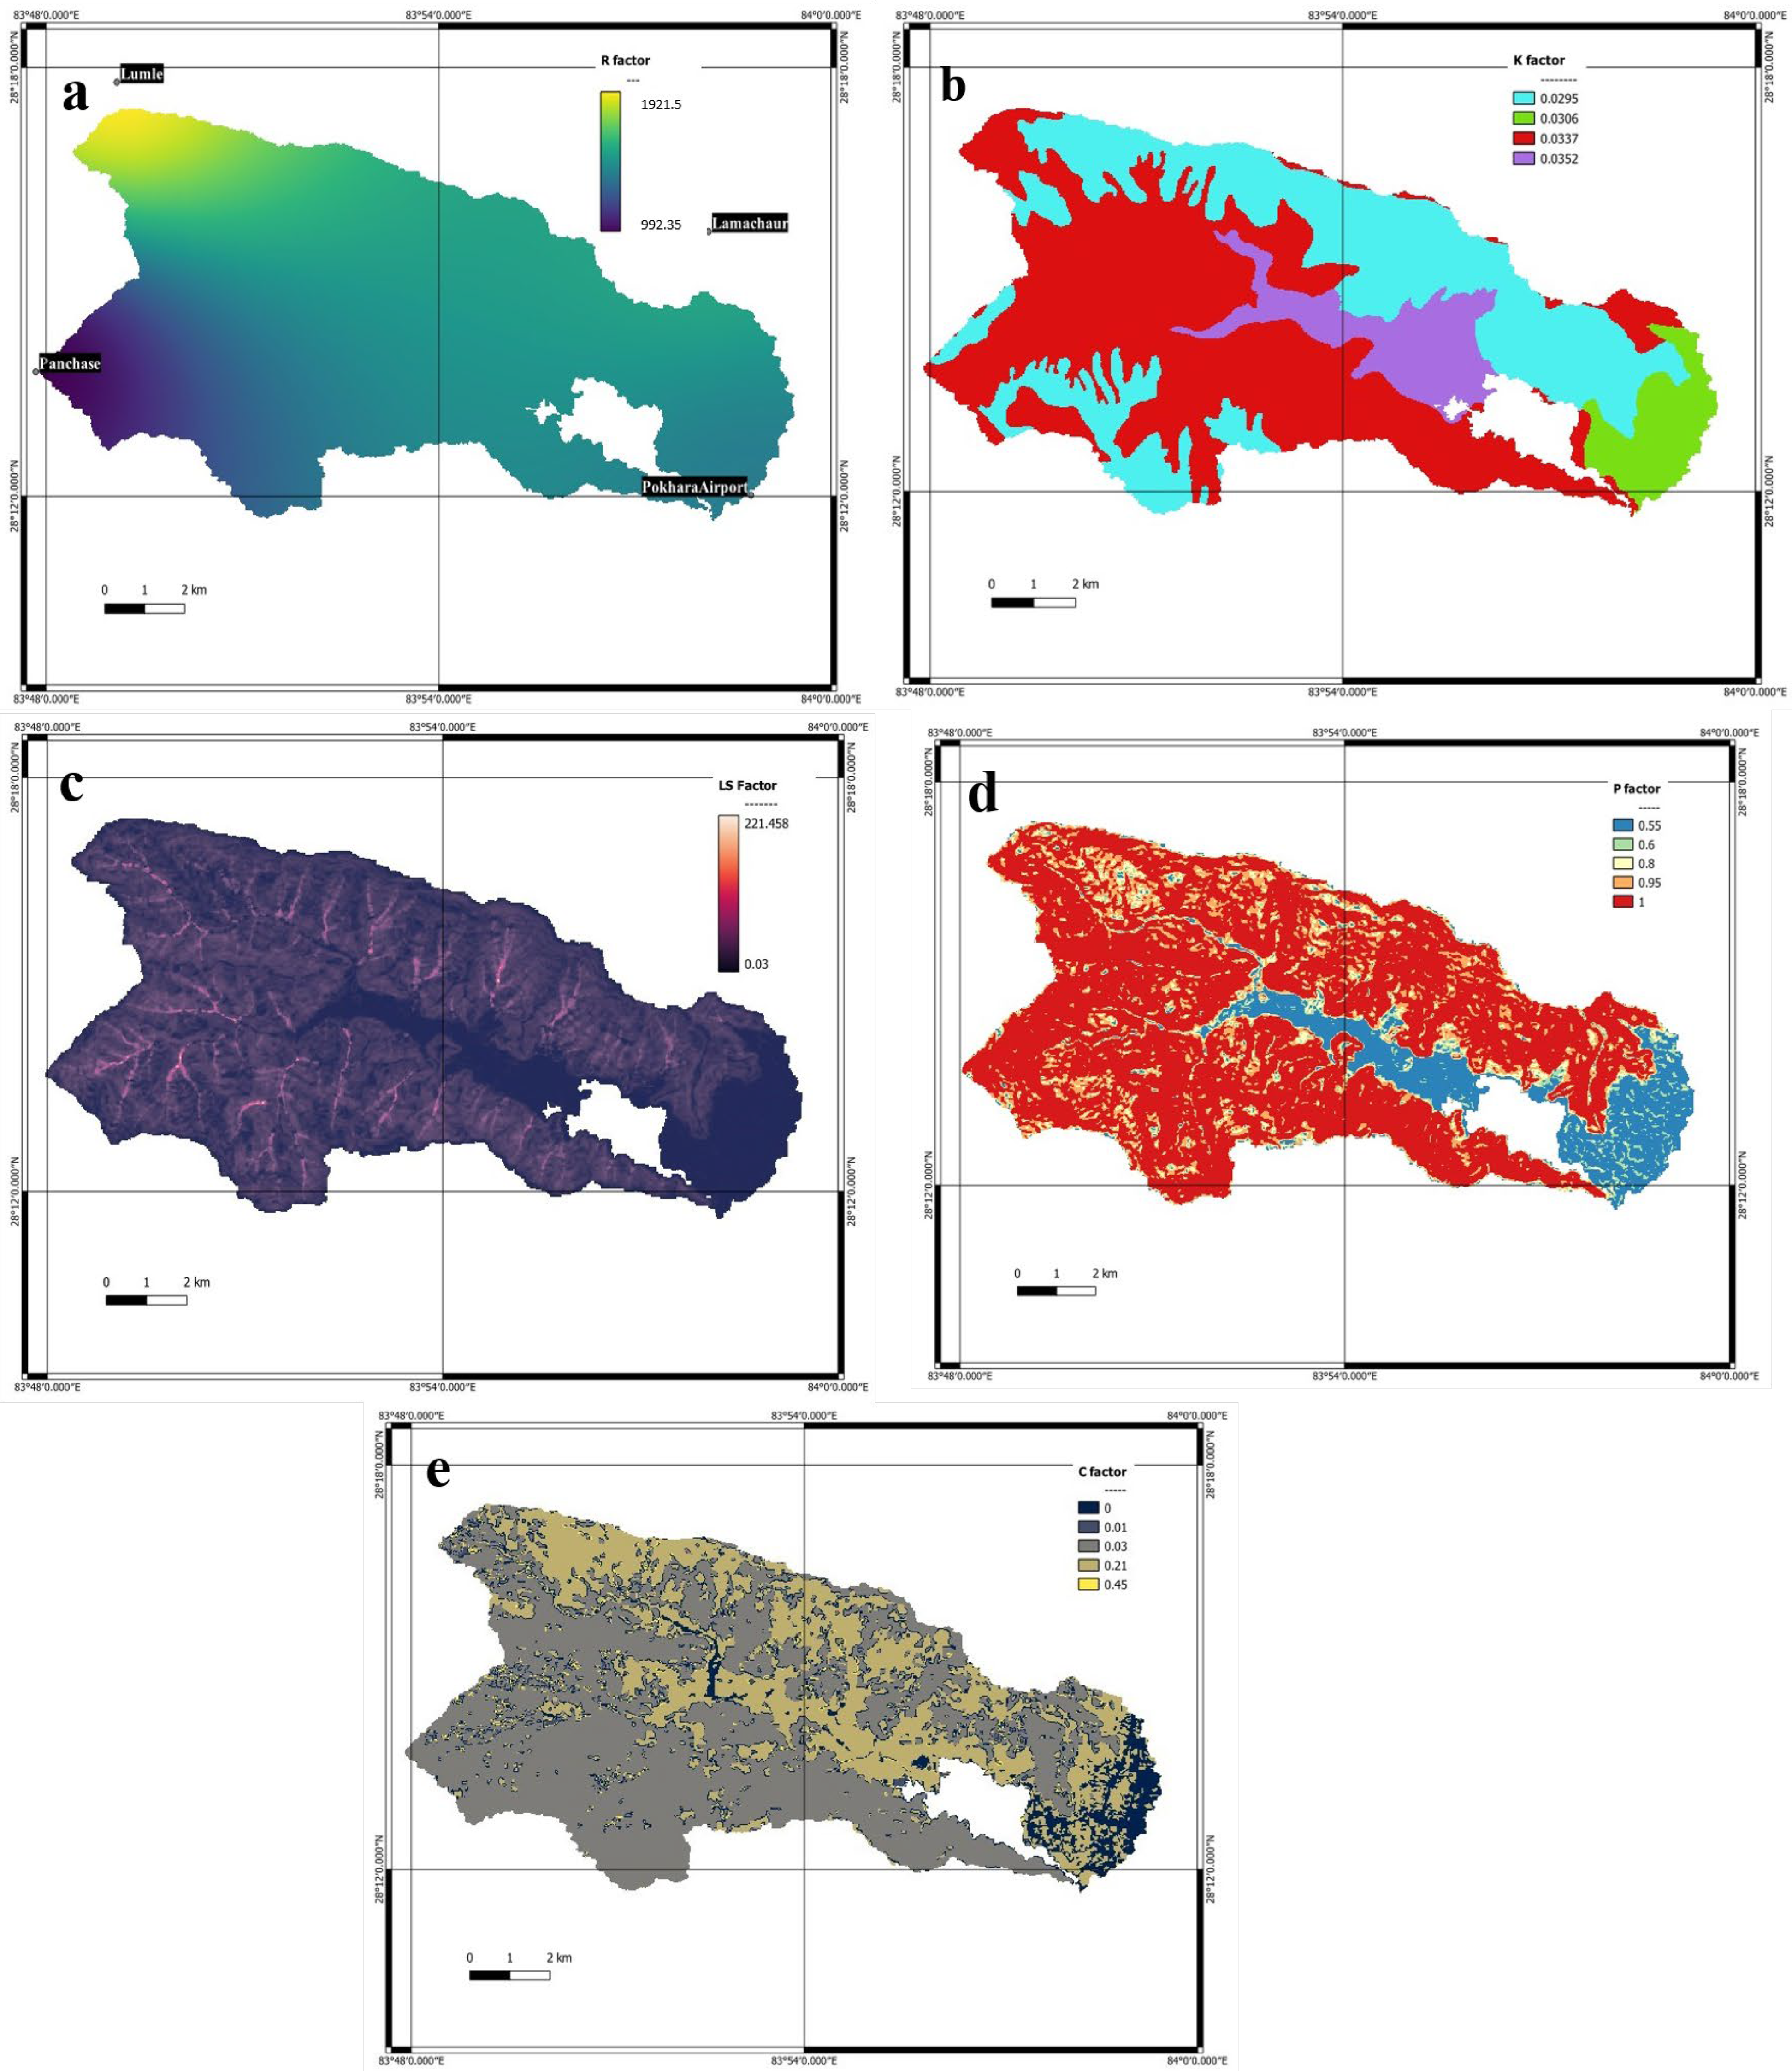
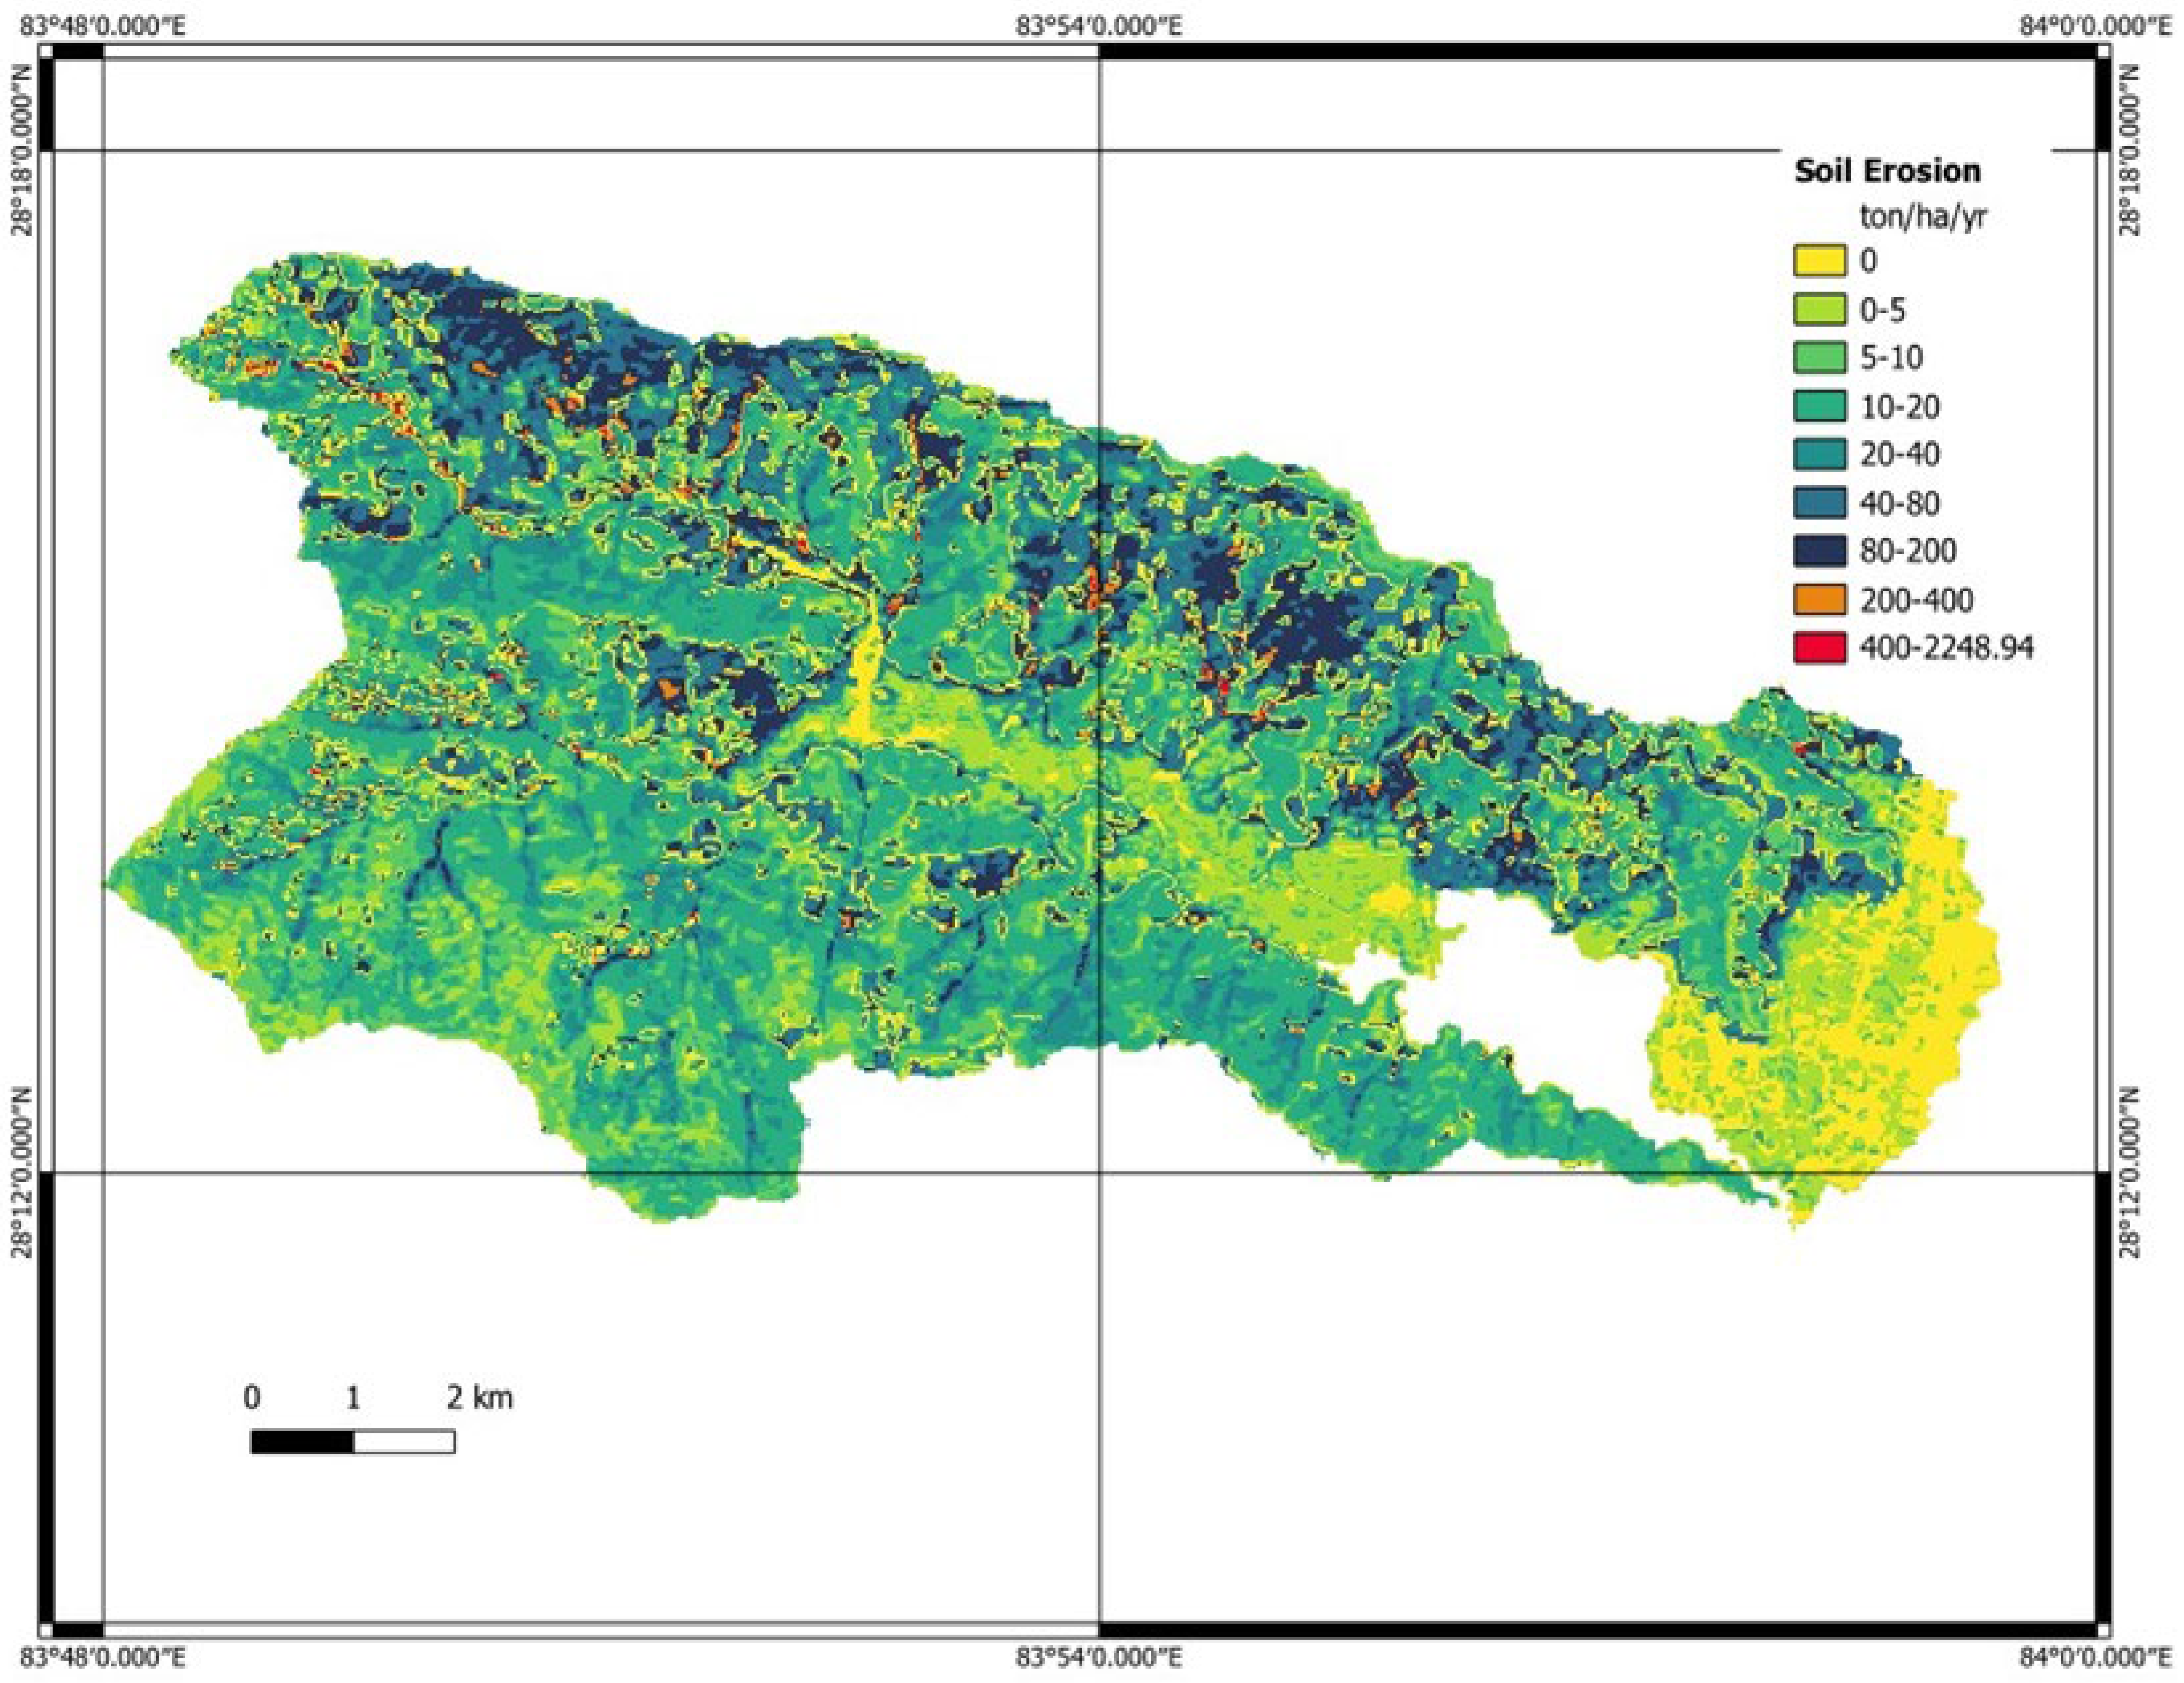
Sediment transport analysis for the Phewa catchment was conducted to identify the primary sources of sediment inflow into Phewa Lake and to support the design of a proposed sediment trapping dam on Harpan Khola near Morebagar. The analysis included hydrological assessment, soil erosion susceptibility using RUSLE (factor mapping mentioned in Figure 3), and one-dimensional hydraulic and sediment transport modeling. Hydrological analysis showed that the design discharge for a 100-year return period, as estimated using the WECS method, was 382.98 m3/s. This value was higher compared to the other methods, which is why it was selected for further calculations. Soil erosion susceptibility mapping (Figure 4) indicated high erosion rates, with particularly severe conditions observed on the south-facing agricultural slopes in the northern part of the catchment. The gross annual soil erosion for the entire Phewa catchment was calculated at 339,118 tons, with Harpan Khola alone contributing 272,583 tons (80.38% of the total), making it the dominant sediment source. This affirms that Harpan Khola is the major source of sedimentation in Phewa Lake.
Sediment Delivery Ratio and sediment yield at proposed siltation dam according to the three methods are given in Table 2 below:
The sediment yield given by Vanoni [46] formula gave an estimated sediment load of 74,142.65 tons per year, which is in agreement with the Impat estimate [54] of 88,000 tons per year performed using Universal Soil Loss Equation (USLE), and 92,000 tons by measuring suspended sediments in Harpan Khola at Chankhapur, near the proposed site of the siltation dam. The estimated sediment yield from RUSLE is in the form of rill, splash, or sheet erosion, which is fine grained and is mostly present as suspended sediments in the river. By assuming bed load as 20% of total sediment load, in accordance with Impat [54], a total annual sediment load of 92,678.31 tons is estimated.
The Vanoni [46] formula was again used to determine the Sediment Delivery Ratio for the entire catchment of the lake. An SDR of 25.94% gives a yield of 87,967.29 tons per year entering the lake. Adding bed load from Harpan Khola, a total sediment load of 106,502.95 tons per year was obtained. As most of the sediments comprising silts, the bulk density is taken as 1489 kg/m3, which gives a sediment volume entering to the lake as 71,406.68 m3 per year. With the current volume of lake from bathymetry as 34,968,838.46 m3, it will take 488.89 years for the lake to be rendered unusable, i.e., to reach 20% of its current volume, if the current rate of silting continues.
Sedimentation is a major threat to Phewa Lake, driven by both natural and anthropogenic factors, significantly reducing its area and storage capacity [13]. The lake accumulates sediment primarily from the Harpan River and other feeder streams, due to erosion in the catchment area exacerbated by heavy monsoon rains and landslides. Anthropogenic activities, including haphazard road construction and deforestation in the watershed, have intensified sediment influx, with rural road-building contributing to increased landslide occurrences [13]. A comparative study of sub-watersheds revealed that areas with intensive land use and poor soil conservation practices exhibit higher sediment loads, accelerating lake shrinkage.

4.2. Encroachment

A temporal analysis of the area of Phewa Lake from 1962 to 2024 (Table 3) reveals a fluctuating but overall declining trend. In 1962, the Nepal–India Cooperation Mission reported a maximum recorded lake area of 10.35 sq. km. However, by the late 1970s (1976–1977), cadastral mapping by First Fort Napi showed a drastic reduction to 4.43 sq. km, largely attributed to the dam failure in 1975 that led to significant drainage and land conversion [13]. The lake area partially recovered by 1982–83 to 5.80 sq. km, due to dam reconstruction and stabilization efforts. Over the next decades, estimates hovered between 4.25 sq. km and 5.08 sq. km, with discrepancies arising from differing survey methodologies, inclusion of seasonal wetlands, and the absence of a fixed legal boundary. Notably, in 2012, the area was recorded 6.5 sq. km, likely accounting for both water and encroached floodplain areas. The most recent 2024 topographic survey conducted by this study determined the total area of the lake as 5.987 sq. km, with the actual water-covered area being only 3.960 sq. km, indicating substantial land encroachment.
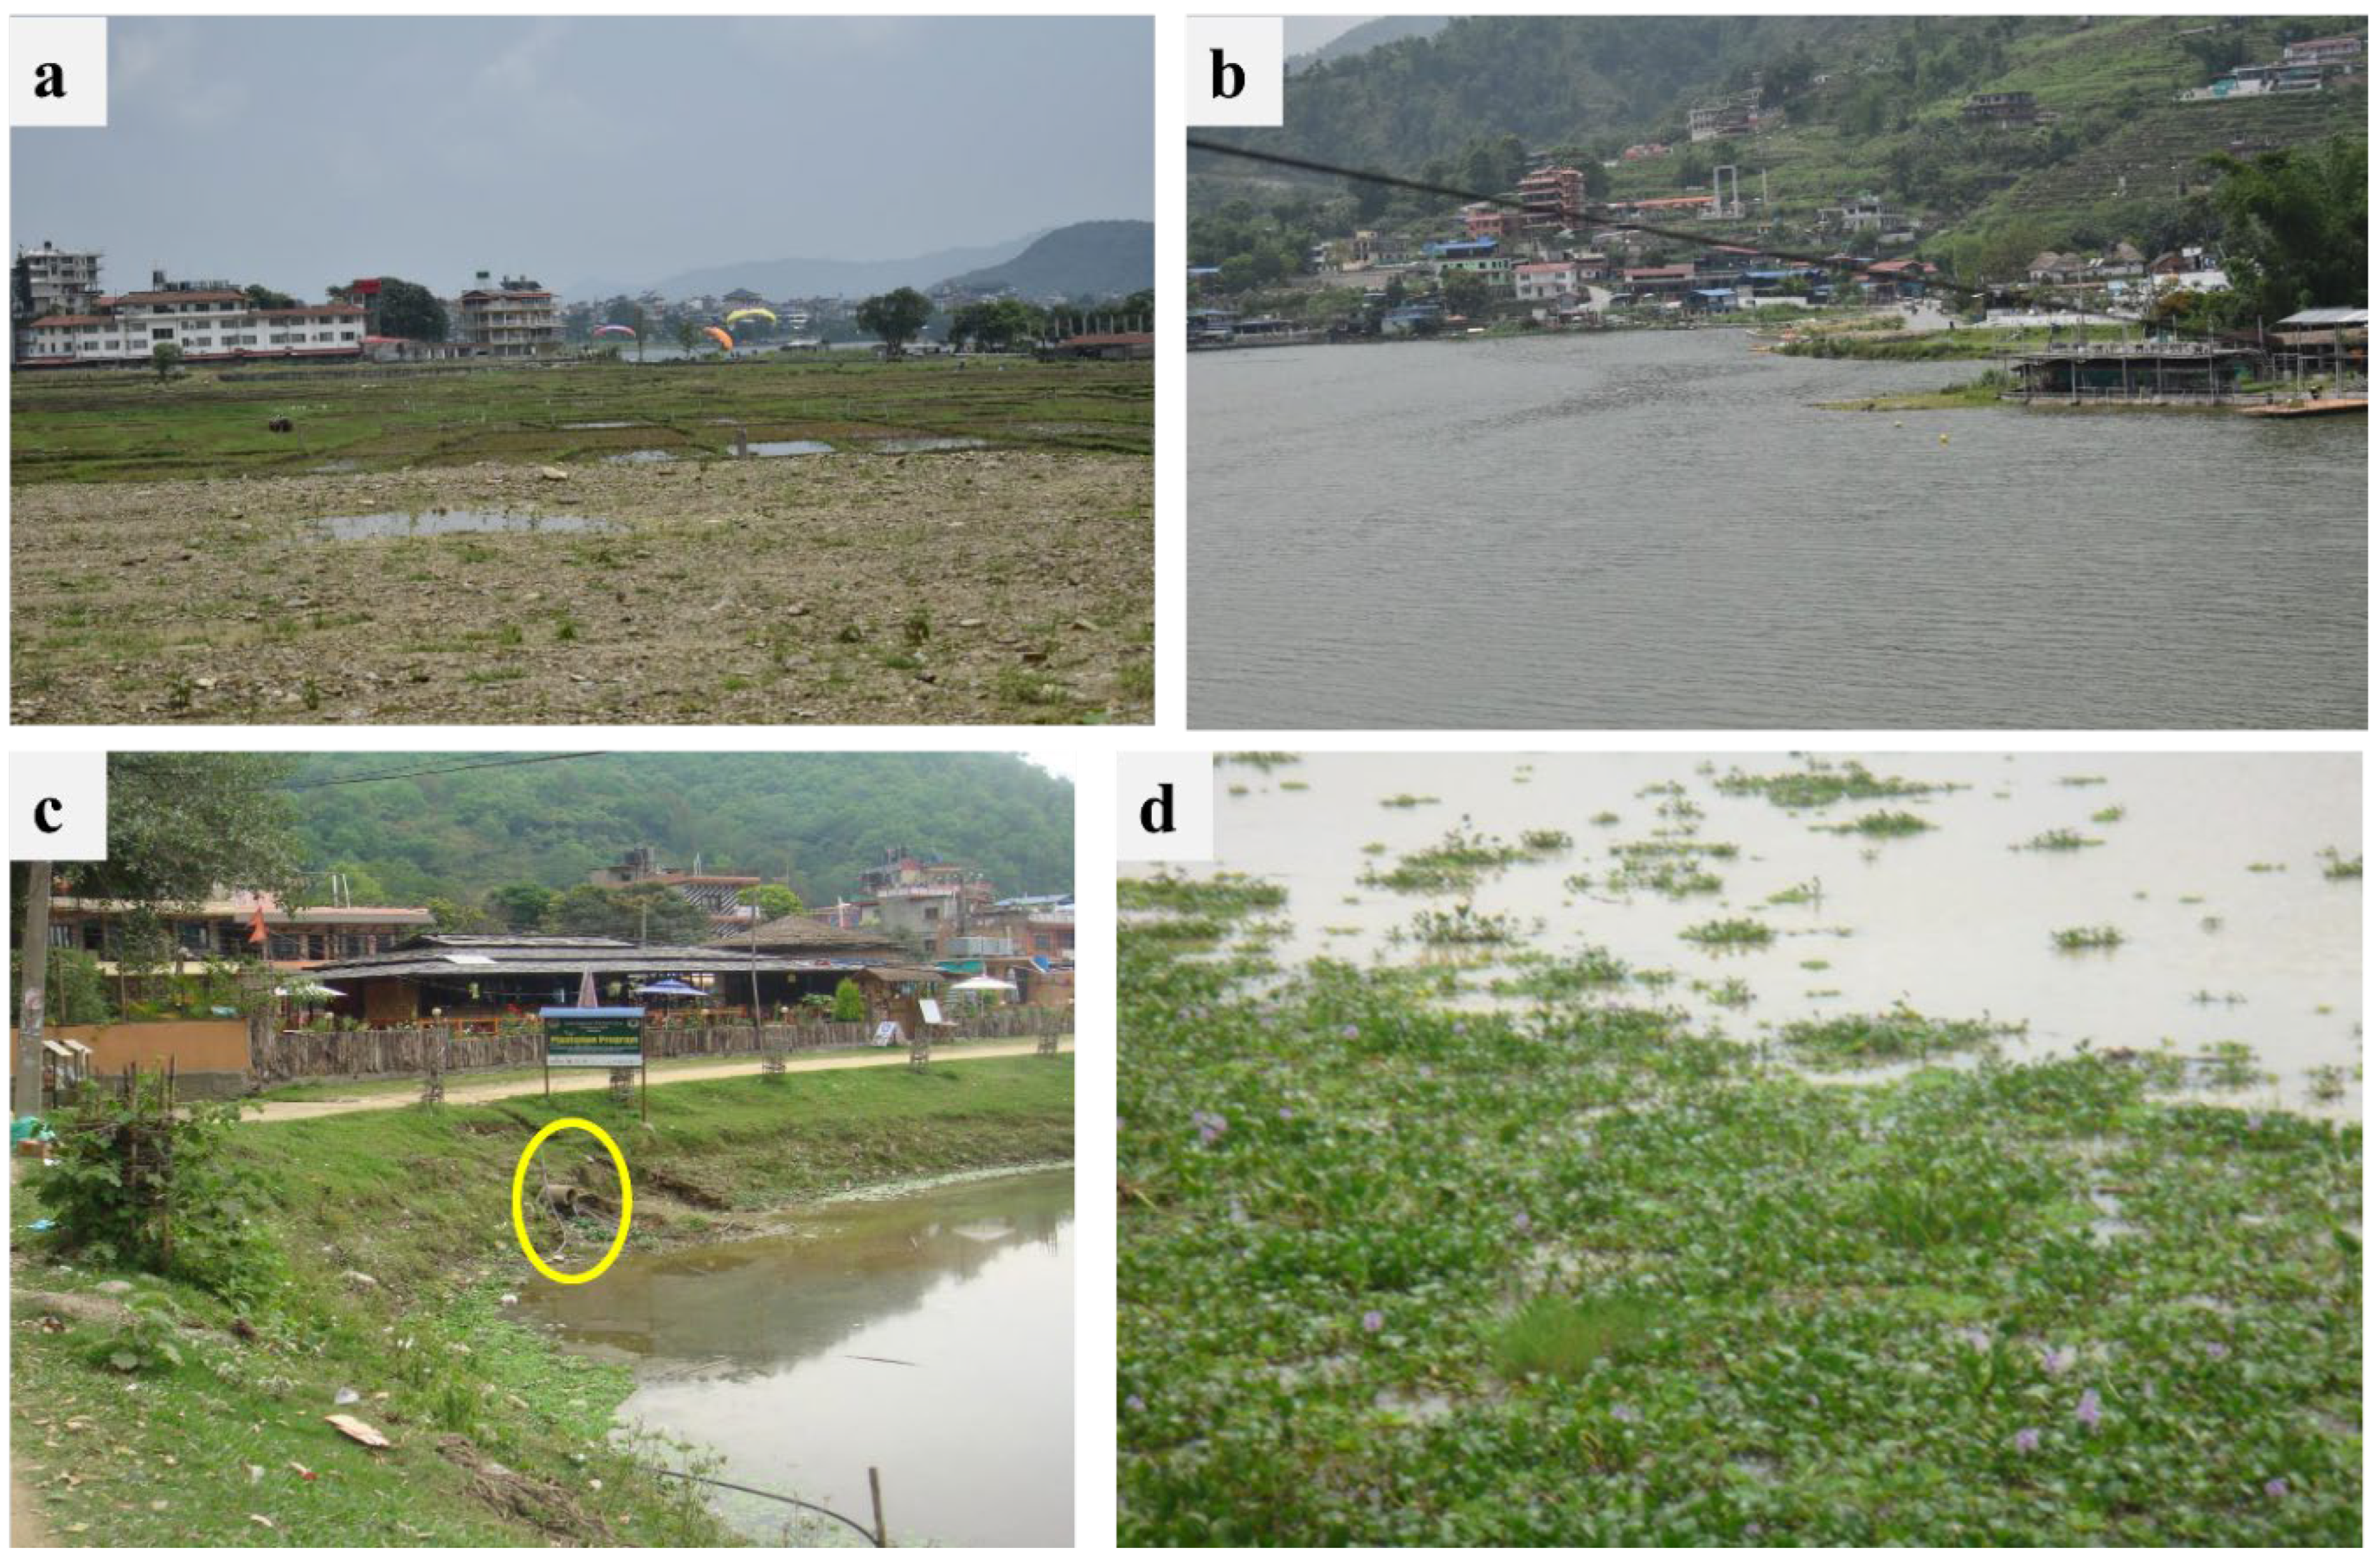
Phewa Lake has experienced both human-induced (Figure 5a–c) and natural encroachment (Figure 5d). Natural encroachment is primarily driven by sedimentation, with Harpan Khola contributing approximately 70–80% of the lake’s water inflow and more than 80% of sediment load. This has led to the formation of about 2.026 sq. km of new land, reducing the lake’s volume and surface area as found during the survey conducted by this study. Erosion from the catchment, deforestation, and landslides further accelerate this process, as sediment gradually accumulates and transforms water zones into land.
Human encroachment has been equally detrimental, driven by population growth, urbanization, and the rising commercial value of land around the lake [12,71]. In the absence of clearly demarcated and enforced boundaries, illegal land registration and construction have proliferated. Although a 65 m protected buffer zone was declared around the lake in 2007, implementation has been weak, with only a limited number of boundary pillars installed [13]. Additionally, policies to cancel illegal registrations or compensate rightful stakeholders have seen minimal enforcement [72]. As a result, the lake’s sustainable area has been progressively compromised. Without urgent legal enforcement, sediment control, and ecological restoration, the environmental and socio-economic integrity of Phewa Lake will continue to deteriorate.

4.3. Pollution

Significant eutrophication is evident, with the proliferation of aquatic weeds like Jalkumbhi (water hyacinth) and unwanted shrubs. Microplastic pollution has also been detected in surface waters, averaging 2.96 ± 1.83 particles/L in the dry season and 1.51 ± 0.62 particles/L in the wet season [73]. Water chemistry analysis shows the dominance of calcium and bicarbonate ions, a result of carbonate weathering within the catchment [74]. The impact of seasonal monsoons is visible in the form of increased turbidity and silt deposition, particularly near urban and agricultural zones. Despite several past restoration initiatives, the lake remains under persistent environmental pressure due to inadequate implementation of waste management and sanitation infrastructure.
Phewa Lake is increasingly polluted due to a combination of natural and human factors [23,75]. Untreated urban discharges such as sewage, kitchen waste, and urinal connections from nearby hotels and residences, along with recreational activities like bathing and washing, significantly degrade water quality [76]. Agricultural runoff containing fertilizers and pesticides, together with surface runoff from settlements, further adds nutrient and chemical loads to the lake as stakeholders submitted in an informal questionnaire. This pollution accelerates eutrophication, causing loss of aquatic biodiversity and promoting invasive aquatic plants like Jalkumbhi, which restrict lake usability [77]. Rapid urban expansion without adequate infrastructure or regulation has worsened the situation, exposing major gaps in environmental governance and land use planning. Additionally, natural sediment and silt inputs, especially during monsoon seasons, add to the challenges by increasing turbidity and altering hydrochemistry, which can affect aquatic habitats and ecosystem functions [78]. Despite Phewa Lake’s status as a Ramsar-listed wetland, ineffective restoration efforts and pollution control have allowed ongoing environmental degradation.

5. Way Forward

5.1. Sediment Management

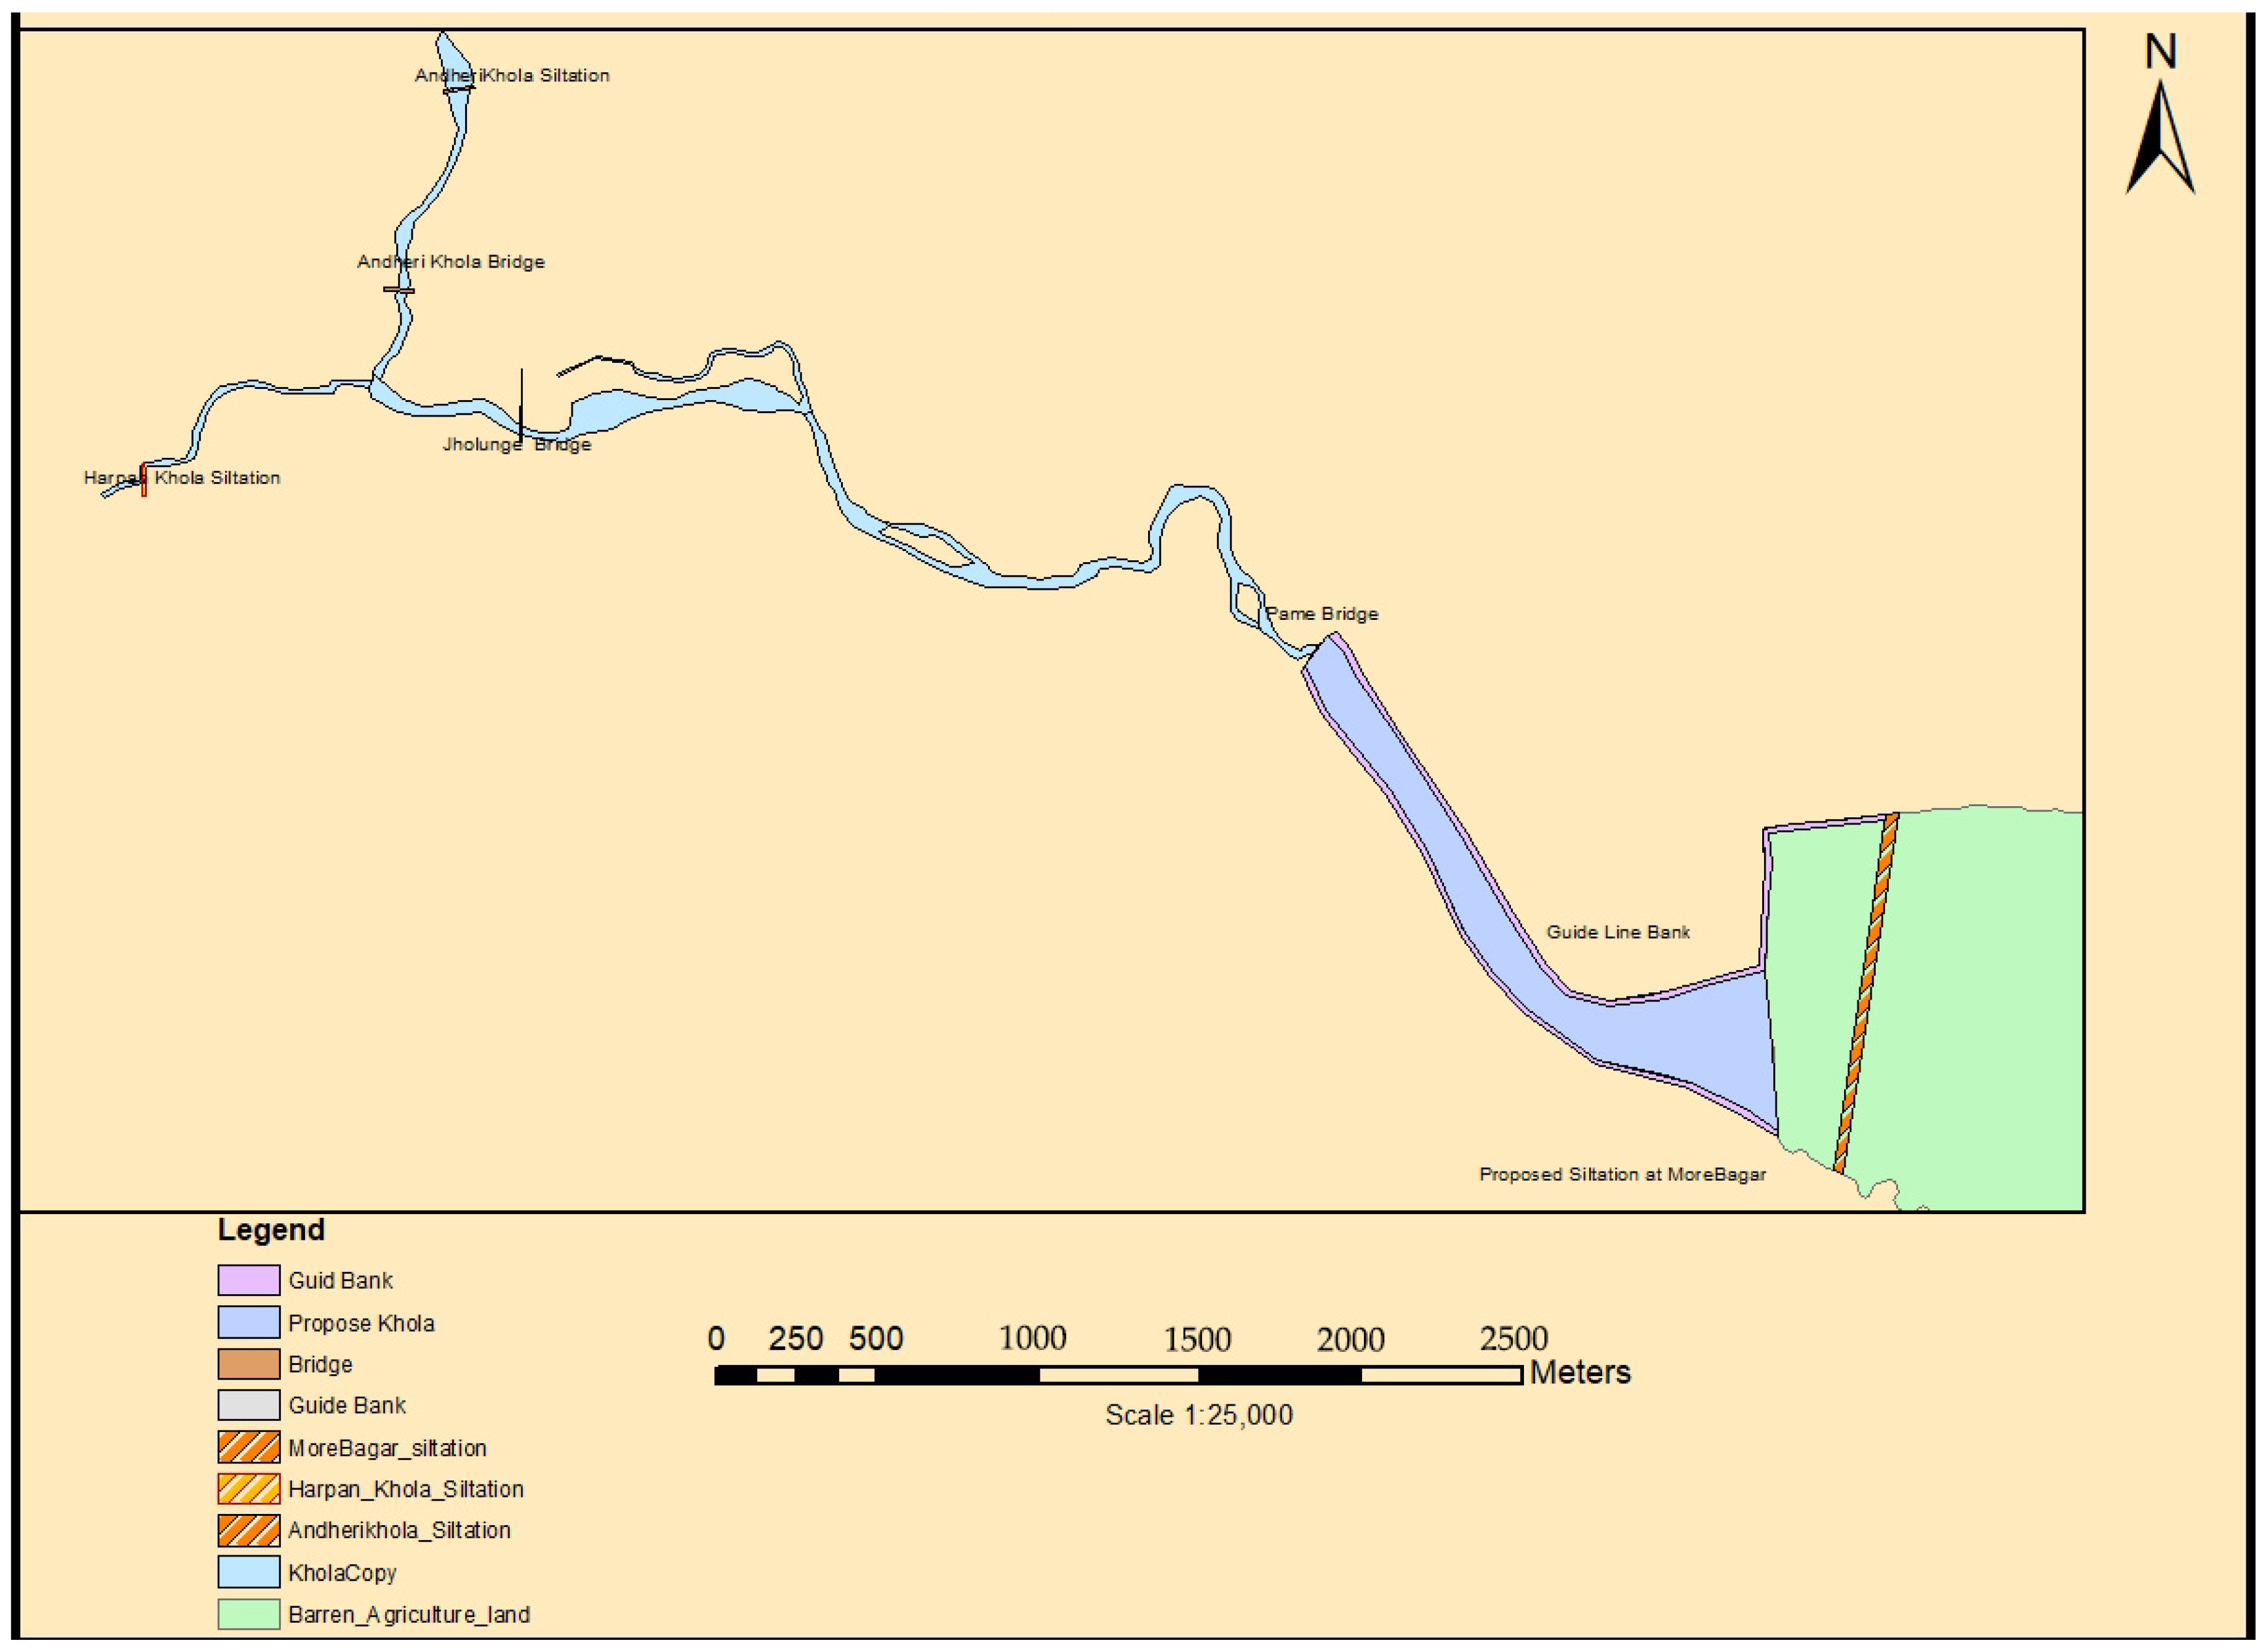
For effective sediment management of the catchment ultimately saving the Phewa Lake, targeted land management strategies such as afforestation, reforestation, and the construction of a siltation dam at Morebagar on the Harpan Khola are recommended (Figure 6). The proposed dam, incorporating a 2.75 m high WES Standard Weir, is expected to achieve a sediment trap efficiency of up to 83.40%, significantly extending the lake’s lifespan by reducing sediment influx and mitigating eutrophication. The proposed siltation dam’s trap efficiency was analyzed using daily discharge data from 1984, which represented a 7-year return period rainfall (calculated via Weibull’s formula). Trap efficiency was modeled for different weir heights, with results showing that efficiency increases with weir height, although incremental gains diminish beyond 2.75 m (Table 4). Therefore, a 2.75 m high weir is considered optimal, balancing sediment retention and construction efficiency. Alongside the dam, bioengineering measures like forest preservation, slope restoration with deep-rooted plants, and pollution control through diversion canals will enhance the sustainability of Phewa Lake’s ecosystem.
Similar ecosystem-based sediment management strategies have been successfully implemented in small to medium catchments worldwide, supporting the proposed Morebagar siltation dam. For example, in Rajasthan’s Fatehsagar Lake catchment, a series of upstream check dams reduced sediment yields by up to 22% in dry years extending lake longevity by approximately 10 years [79]. In Pakistan, the Chashma Reservoir employs regular drawdown flushing combined with barrages to manage silt accumulation and preserve storage capacity [80]. In the Central Himalayan region of India, catchment afforestation and check-dam networks lowered suspended sediment by around 18% during monsoon months [81]. These cases affirm that integrating structural measures such as check or siltation dams with land-based interventions like tree planting and slope stabilization mirroring our approach at Morebagar is an effective, transferable model for sediment management in sensitive mountainous watersheds. Afforestation enhances soil stability and significantly reduces sediment yield by improving canopy interception, increasing surface roughness, and promoting soil cohesion; one catchment-scale study found that converting just high-erosion zones (100–250 t ha−1 yr−1 loss) to forest cover reduced annual sediment input by 26–50% [82]. Forested areas also diminish raindrop impact and overland flow through dense leaf litter and compacted soils, which suppress runoff generation and soil–particle detachment compared to bare or tilled land [83].

5.2. Pollution Management

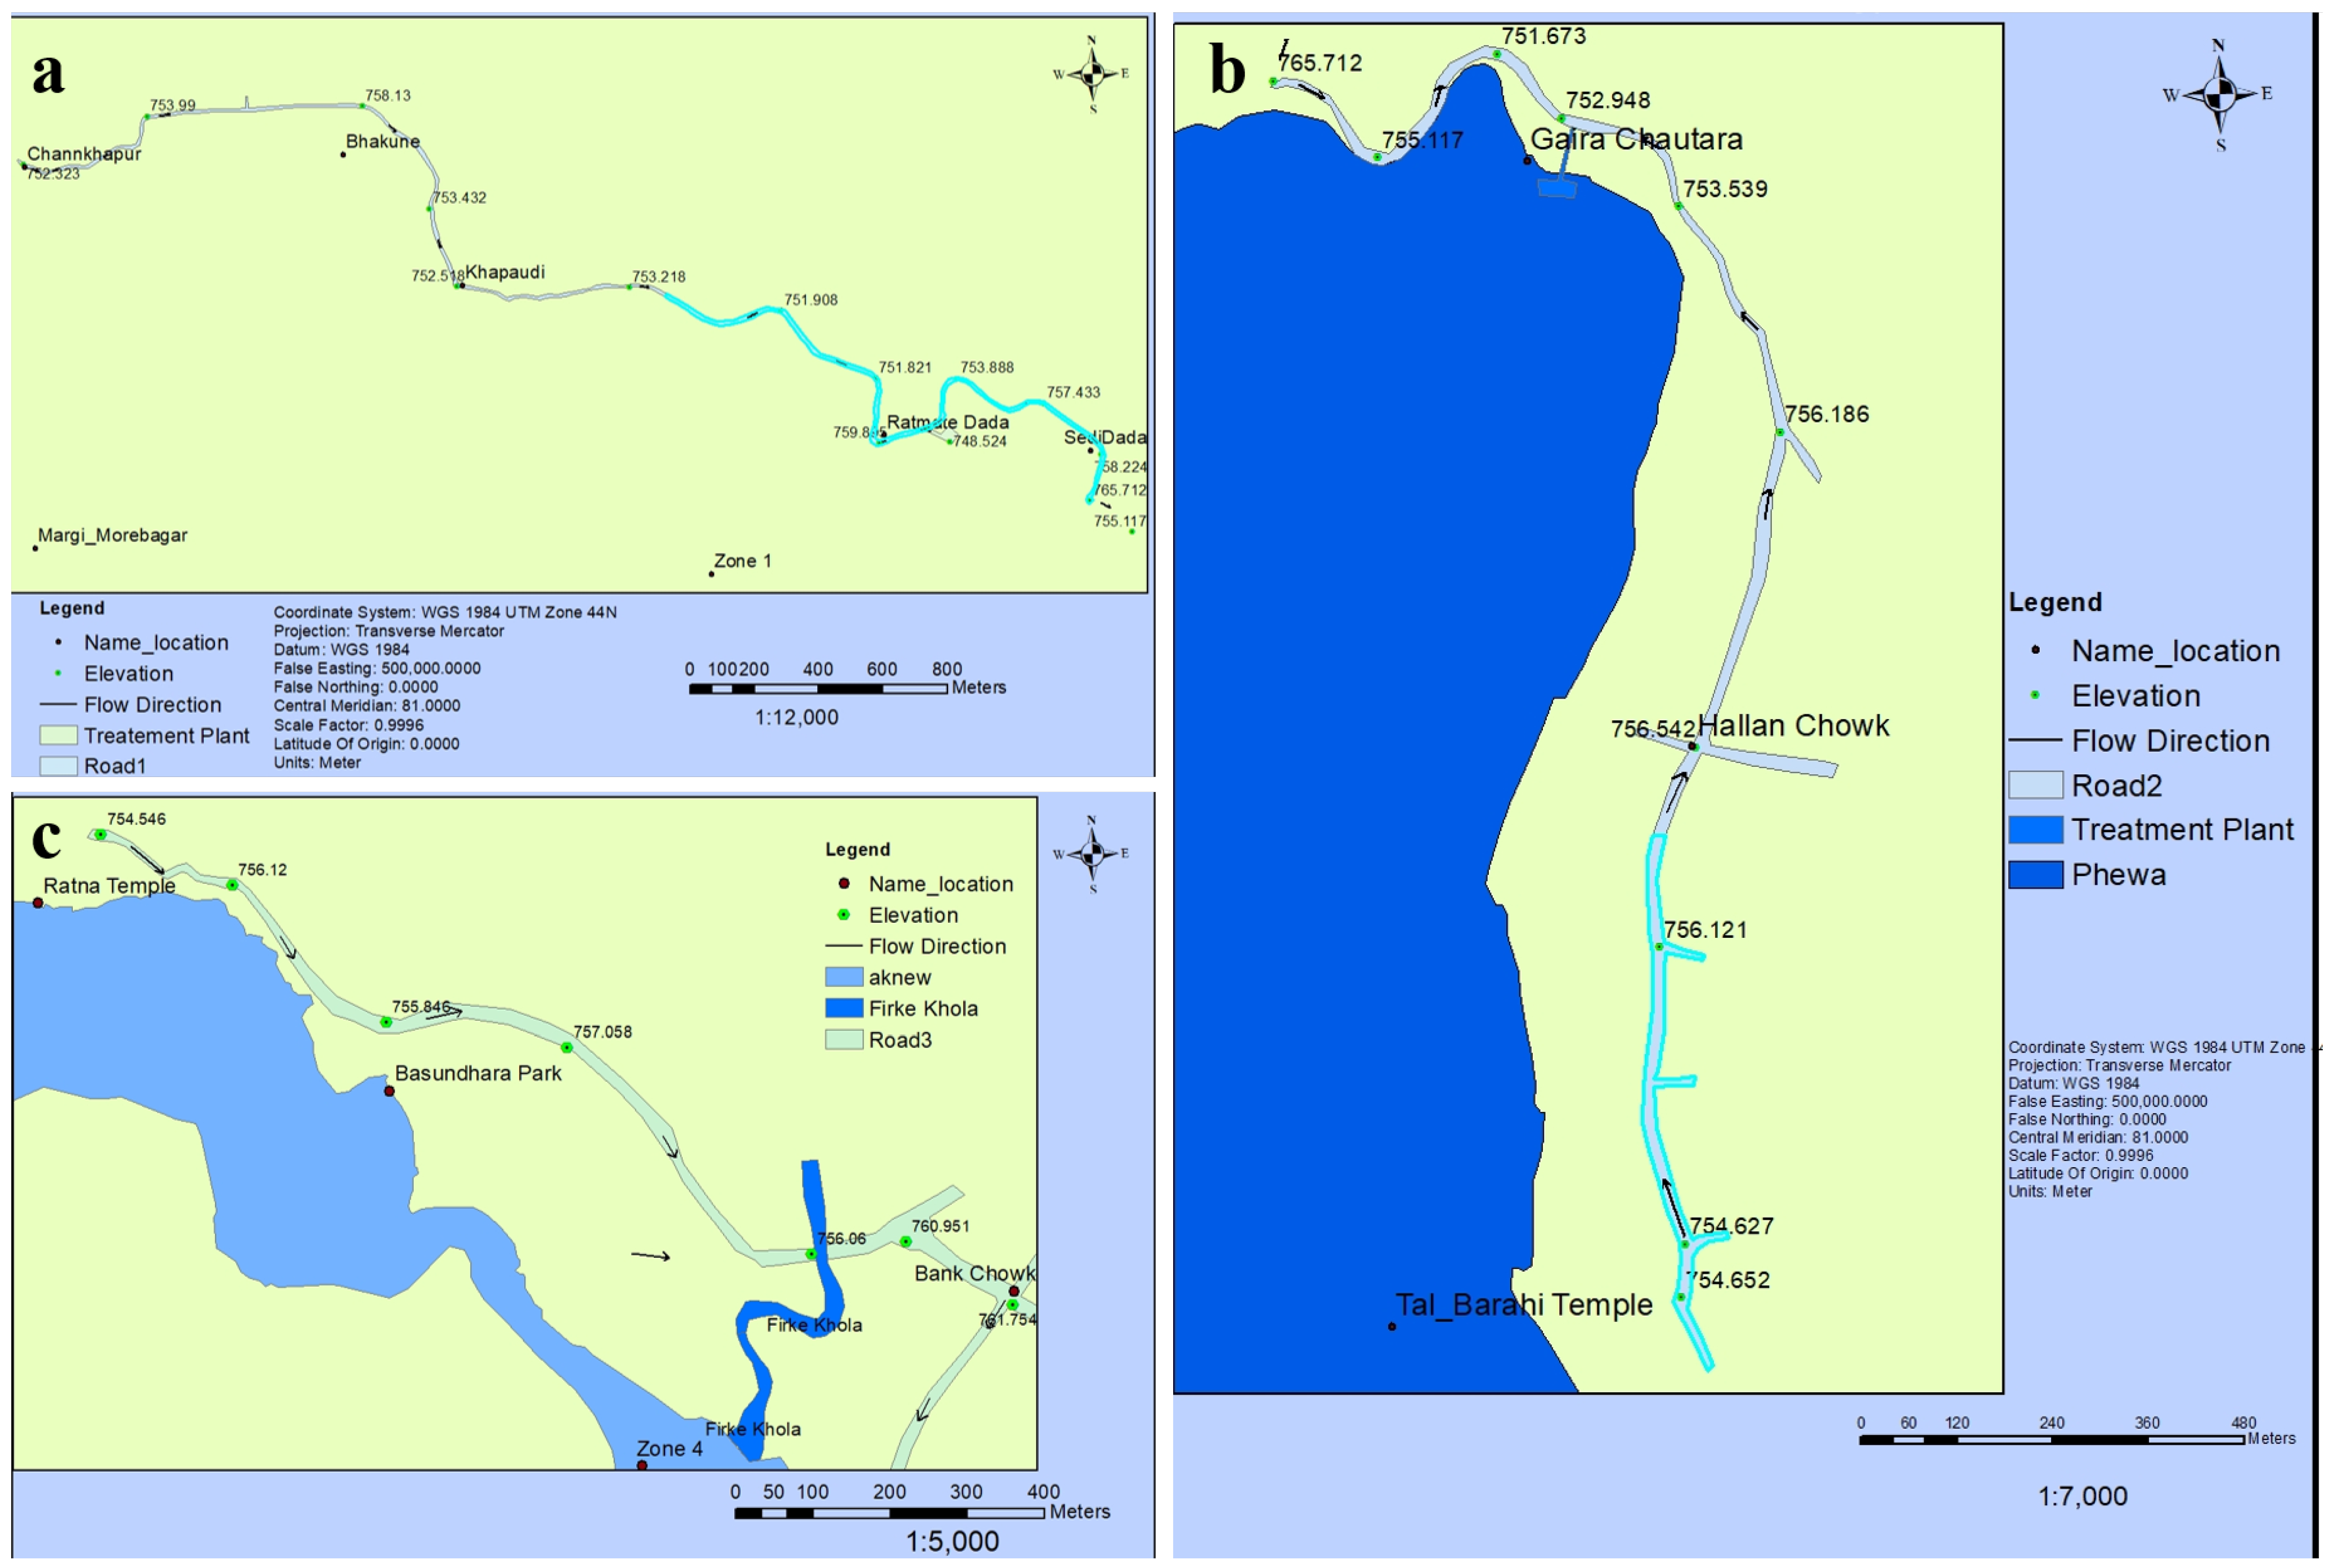
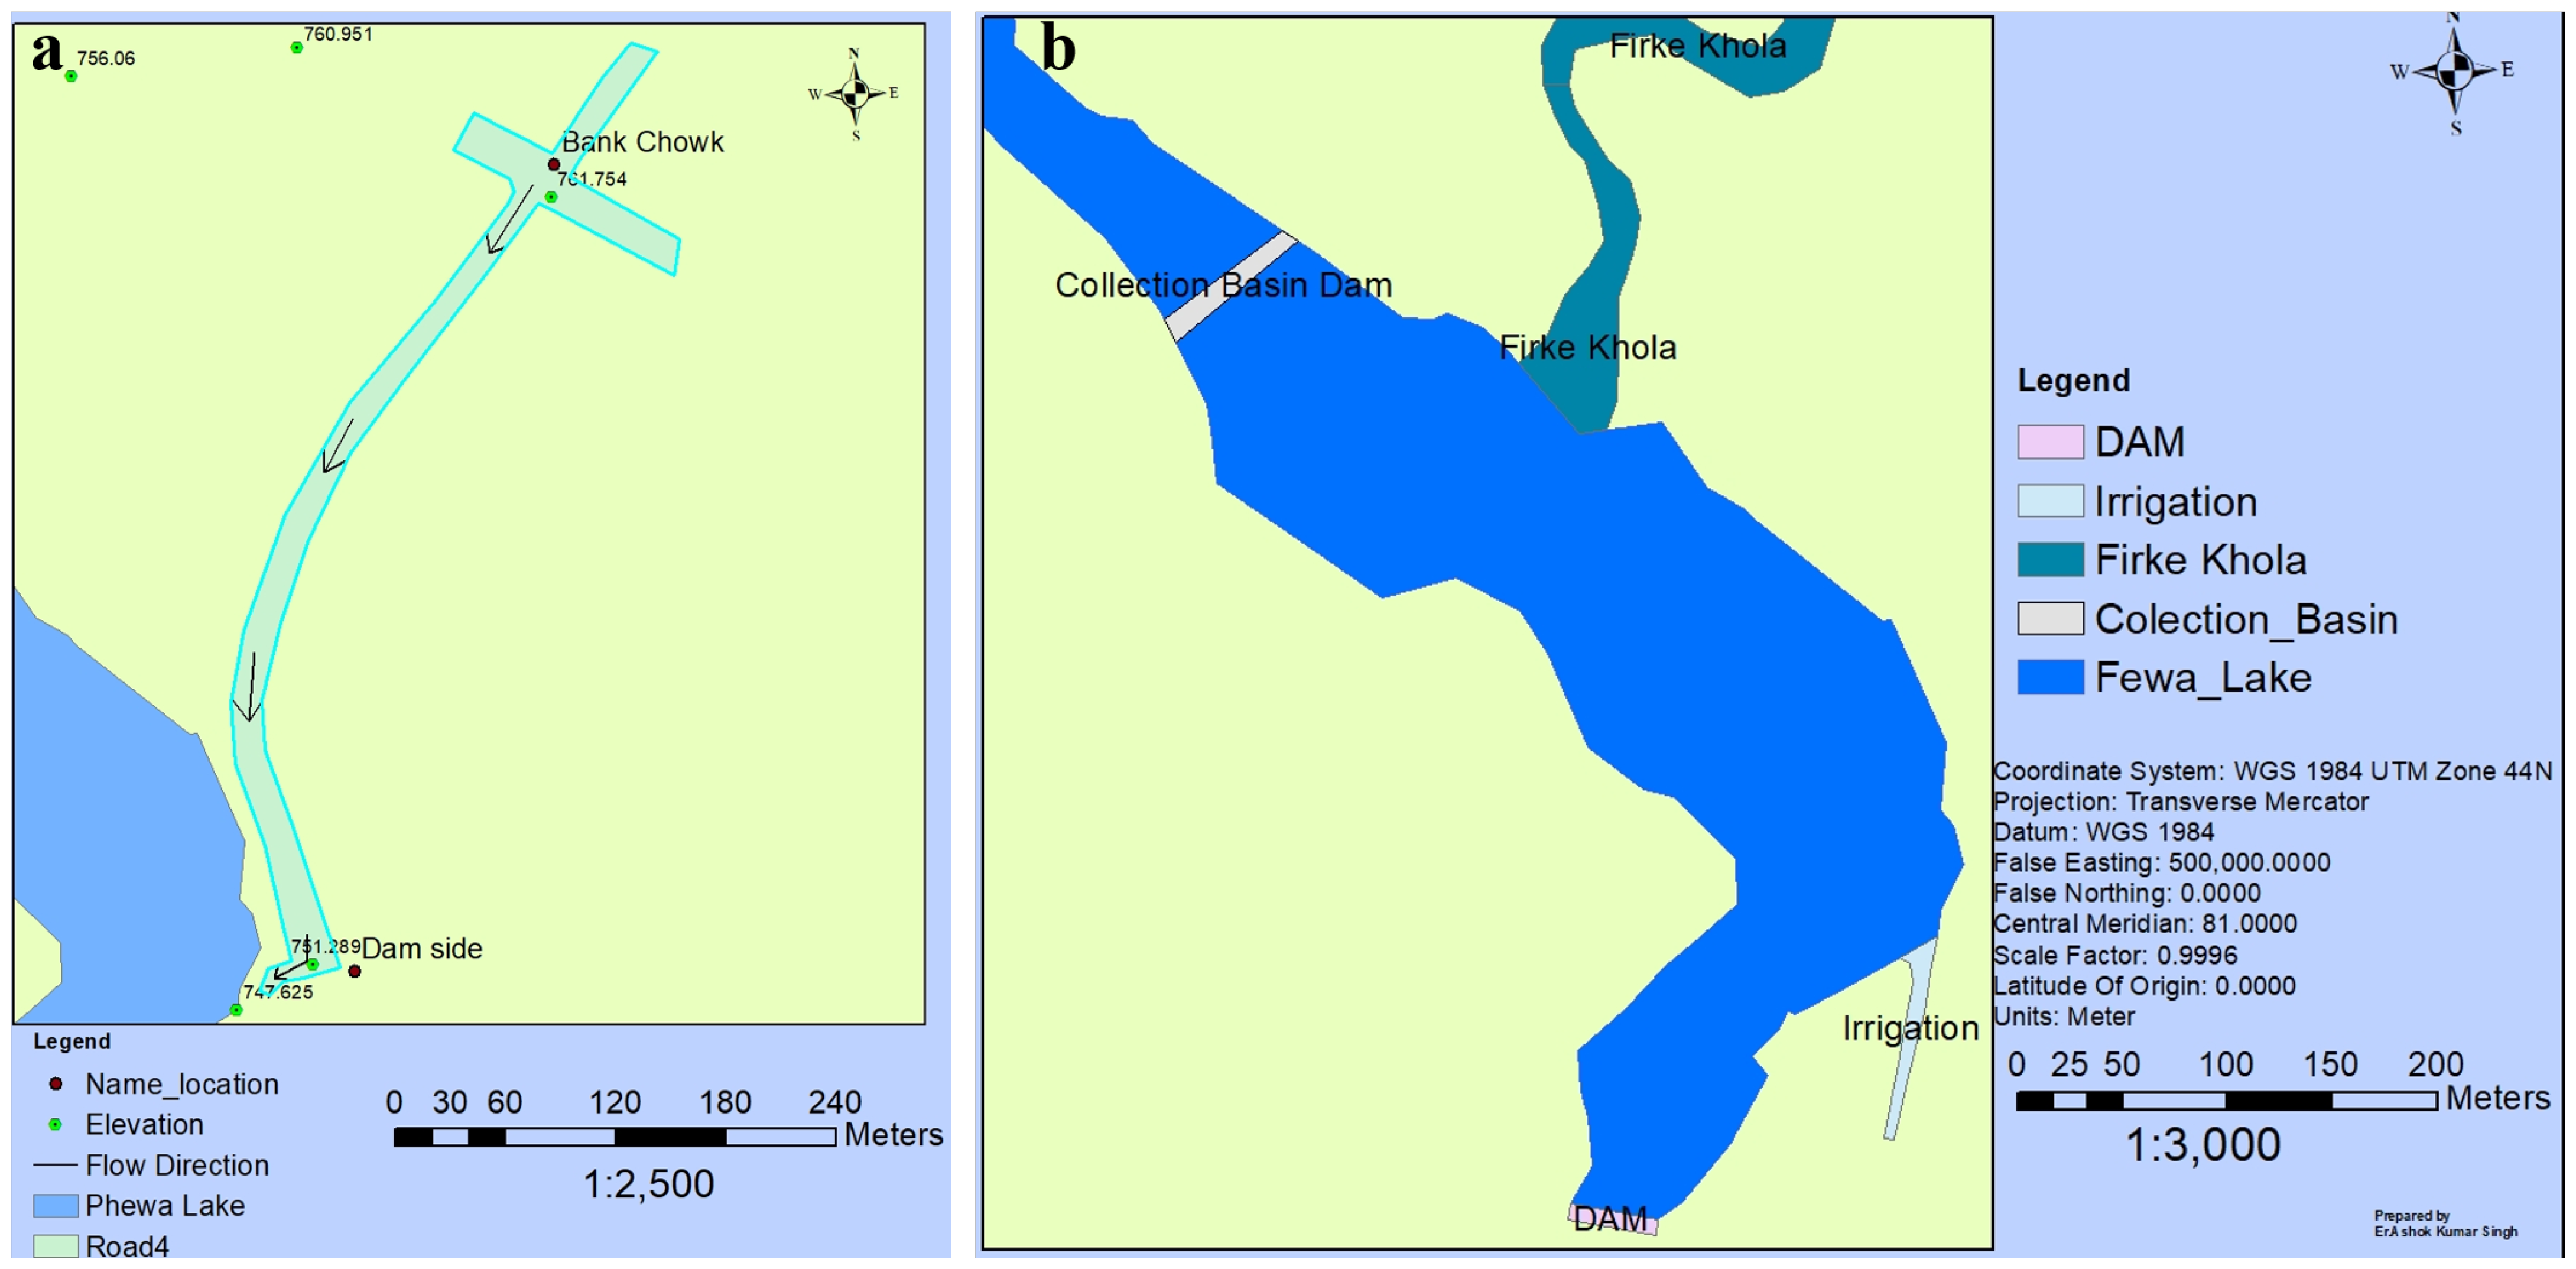
The construction of diversion canals around Phewa Lake (Figure 7 and Figure 8) is a crucial measure to prevent urban waste and surface runoff from contaminating the lake. These canals will be strategically located at various points around the lake to divert polluted water away from the lake’s ecosystem. Each canal will be connected to treatment plants or collection basins, where the water will be cleaned before being safely discharged into the lake. The sludge and silt will be disposed of at designated landfill sites to prevent further contamination. The proposed canal alignments include several routes: Alignment I (4650 m), starting at Chankhapur and ending at Ratamate Dada, will be connected to a treatment plant near Ratamate Dada. Alignment II (3385 m), extending from Barahi Chowk to Gairha Chautary, will link to a treatment plant near Gairha Chautary. Alignment III (1220 m), from Ratna Mandir to Phirke Khola, will direct waste into a collection basin at the Dam Side. Alignment IV (690 m) will run from Bank Chowk to the Dam Side and connect to the collection basin, while Alignment V, utilizing the existing irrigation canal, will direct water from the lake to Phusre Khola. The effectiveness of these diversion canals in improving water quality is supported by evidence from similar lake systems where such infrastructure has significantly reduced pollutant inflow [84]; however, their success in Phewa Lake will depend on proper maintenance, hydraulic design adapted to local topography, and the operational efficiency of the connected treatment plants.
Similar diversion-based interventions have been effectively used to mitigate lake pollution in other parts of the world. In China, large-scale water diversion projects for lakes such as Taihu, Dianchi, and Xihu have shown that introducing cleaner water and diverting polluted inflows can significantly reduce eutrophication, chlorophyll-a levels, and algal blooms [85,86]. For example, in the Xihu Lake system, multiple diversion inlets and constructed flow patterns helped distribute water more evenly and flush out contaminants, improving water clarity and ecological health [86]. Similarly, in Moses Lake, Washington (USA), controlled diversion of low-nutrient Columbia River water led to a measurable decline in algal biomass and nutrient concentrations [87]. These cases suggest that well-planned diversion canal systems complemented by treatment facilities and controlled discharge can serve as an effective pollution management strategy, justifying the proposed approach for Phewa Lake.

5.3. SWOT Analysis

The detailed SWOT (Strengths, Weakness, Opportunities, and Threats) analysis of Phewa Lake (Table 5) provides a strategic assessment of the internal and external factors influencing its ecological health, economic relevance, and cultural value. The use of a SWOT analysis in lake conservation planning is a well-established strategic tool that aids in comprehensively evaluating internal capacities and external pressures. In the context of Phewa Lake, applying this framework enables the integration of ecological, socio-economic, institutional, and infrastructural dimensions, which is essential for sustainable lake governance. Similar frameworks have been successfully employed in lake and watershed management globally to align conservation goals with stakeholder engagement, policy development, and investment prioritization [88,89]. For instance, strategic environmental assessments of lakes like Chilika in India and Tonle Sap in Cambodia have utilized SWOT or similar matrices to identify actionable interventions, improve inter-agency coordination, and engage local communities in co-management [90,91,92]. By systematically mapping Phewa Lake’s strengths such as its Ramsar designation and tourism appeal alongside threats like climate-induced sedimentation and administrative inefficiencies, the SWOT analysis provides a practical roadmap for targeted and adaptive conservation strategies.

5.4. Revitalization of Lake

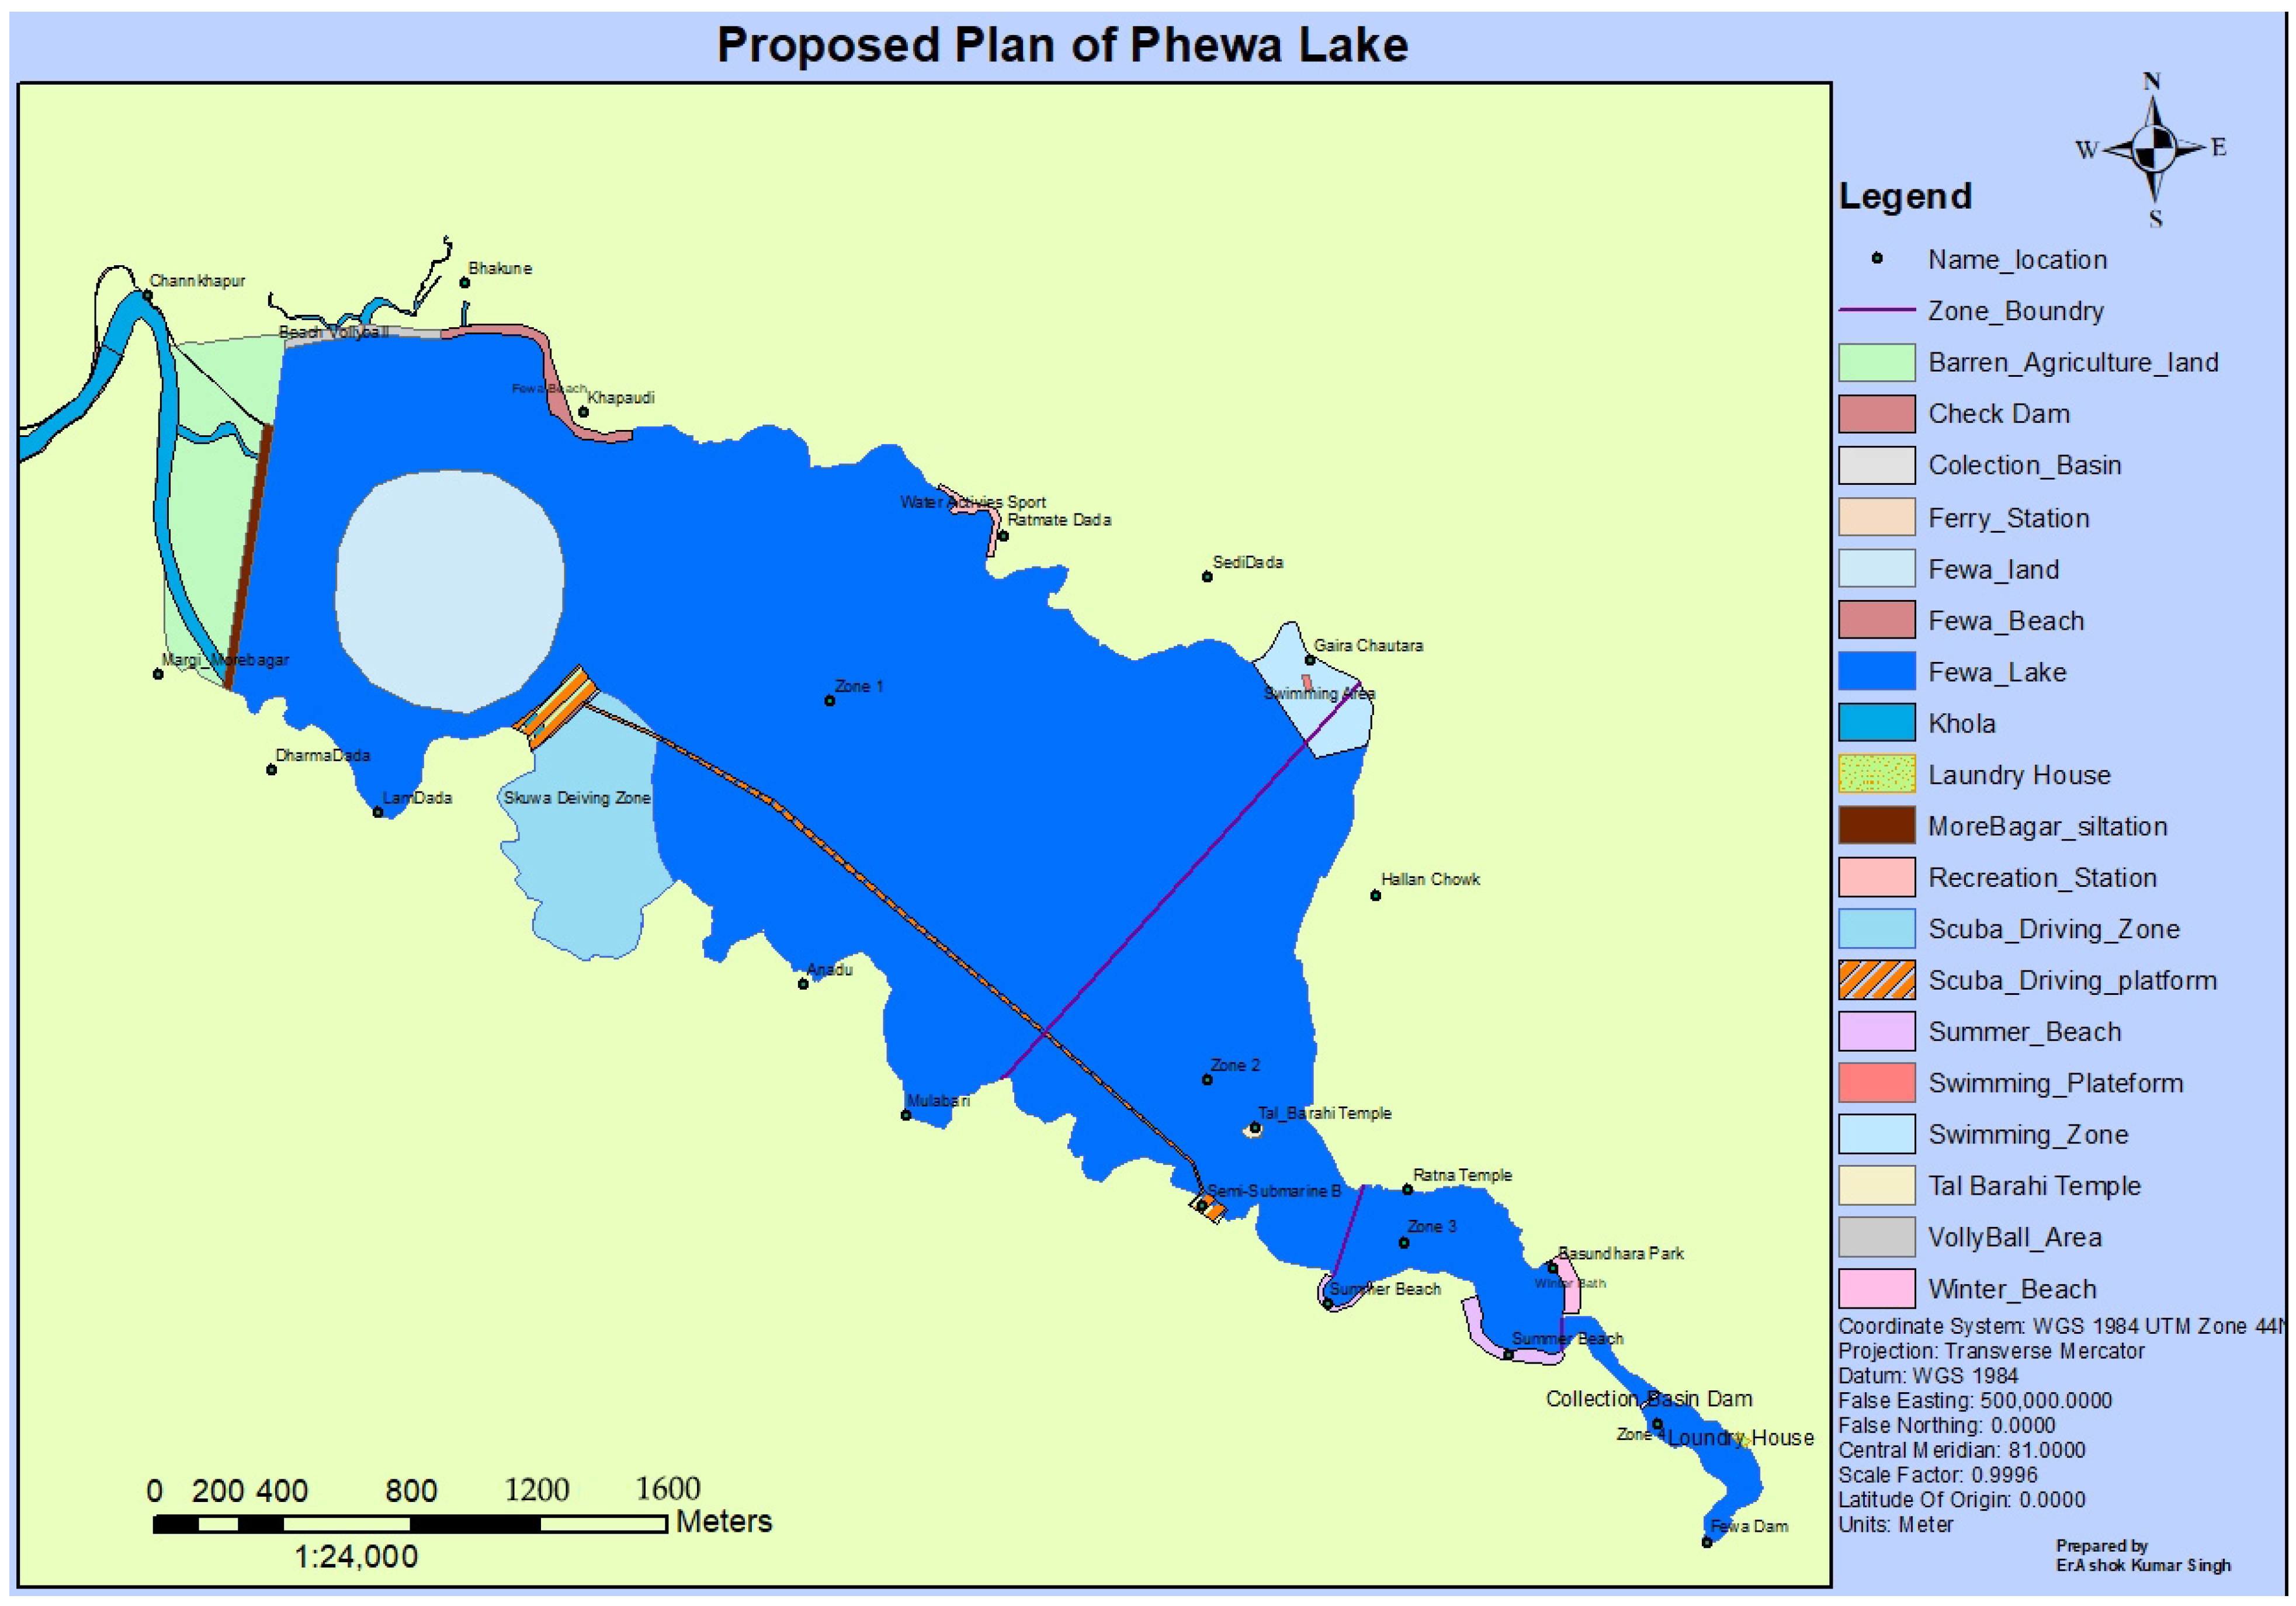
The revitalization plan for Phewa Lake (Figure 9) seeks to improve its ecological health and accessibility through a comprehensive conservation and management strategy. A three-tier management structure, involving the Provincial Government, Metropolitan Government, and the Phewa Lake Conservation Committee, will oversee key conservation actions, such as removing illegal constructions, controlling encroachments, and enhancing shoreline development. Currently, the lake covers 5.726 sq. km, with a water area of 3.96 sq. km and a maximum depth of 24 m. The plan will expand the water area to 5.52 sq. km and develop the shoreline with footpaths and roads for better access. The lake’s maximum depth will be maintained at 23.2 m, and sediment removal will improve water quality. Additionally, an island created by excavated soil, known as Phewa Land, will offer recreational and service areas, including yoga gardens, picnic spots, a cycle track, hotel complex, seminar halls, and themed zones like Culture Land and Adventure Land. Eco-tourism opportunities will be fostered through spaces like the Scuba platform and Siltation Basin. Landowners within the lake’s boundary will be compensated to ensure legal compliance and prevent future encroachments. The plan aims to balance ecological preservation with sustainable recreation, creating a vibrant space for residents and visitors.
Integrated revitalization plans, like the one proposed for Phewa Lake, have been effectively implemented in numerous lake systems worldwide to restore ecological function while promoting sustainable public use. This approach combining ecological restoration, shoreline accessibility, tourism infrastructure, and stakeholder involvement has demonstrated measurable success in lakes such as Dal Lake in India and Lake Biwa in Japan, where comprehensive interventions revitalized degraded water bodies while enhancing their recreational and cultural value [93,94]. Key elements of such revitalization efforts typically include sediment dredging, construction of eco-tourism amenities, community-centric development, and institutional coordination paralleling the proposed Phewa Lake initiative. Moreover, multi-tier governance structures have proven crucial in balancing top-down policy enforcement with local stewardship, as seen in the management of Lake Tana in Ethiopia and Lake Victoria in East Africa [95,96]. These precedents affirm that a revitalization model combining ecological rehabilitation with recreational development and legal regularization can deliver long-term environmental and socio-economic resilience.

6. Conclusions

This study provides a comprehensive assessment of the key threats to Phewa Lake (sedimentation, encroachment, and pollution) and proposes an integrated revitalization plan grounded in multidisciplinary analysis. Using RUSLE, hydrologic and hydraulic modeling (HEC–RAS), bathymetric surveys, and geospatial tools, this research identifies Harpan Khola as the primary sediment source, contributing around 80% of the lake’s annual sediment load of 339,118 tons. Since 1962, the lake has lost approximately 5.62 sq. km of surface area due to dam failure, sediment deposition, and human encroachment, worsened by rapid urbanization and weak land use regulation. Water quality and biodiversity are further threatened by untreated sewage, surface runoff, and invasive weeds. The restoration plan includes a sediment-trapping dam with a 2.75 m weir (up to 83.4% efficiency), diversion canals to reduce pollution inflow, and ecological interventions such as legal boundary enforcement and eco-tourism infrastructure like the proposed Phewa Land island. Supported by SWOT analysis, the strategy promotes sustainable lake management by combining environmental protection with socio-economic benefits and can serve as a model for other Himalayan watershed systems.

Author Contributions

Conceptualization, A.L.S. and N.M.S.; methodology, A.L.S., N.M.S. and B.R.P.; software, A.L.S.; validation, N.M.S. and B.R.P.; formal analysis, A.L.S.; investigation, A.L.S.; resources, A.L.S.; data curation, A.L.S.; writing—original draft preparation, A.L.S.; writing—review and editing, N.M.S. and B.R.P.; visualization, N.M.S.; supervision, N.M.S. and B.R.P.; project administration, A.L.S. All authors have read and agreed to the published version of the manuscript.

Funding

This research received no external funding.

Institutional Review Board Statement

Not applicable.

Informed Consent Statement

Not applicable.

Data Availability Statement

All data used in this study are available within the study itself.

Conflicts of Interest

The authors declare no conflicts of interest.

References

  1. Sterner, T.; Barbier, E.B.; Bateman, I.; Chávez, C.L.; Köhlin, G.; Mäler, K.-G.; Polasky, S.; Rockström, J.; Toman, M.; Vincent, J.R. Policy design for the Anthropocene. Nat. Sustain. 2020, 3, 140–147. [Google Scholar] [CrossRef]
  2. Xu, H.; Zhang, H.; Liu, L.; Liu, Y.; Jiang, H. Changes in lake area in arid Xinjiang, China from the mid-20th century to 2010. Int. J. Appl. Earth Obs. Geoinf. 2017, 53, 160–171. [Google Scholar]
  3. Bennett, E.M.; Carpenter, S.R.; Caraco, N.F. Human impact on erodable phosphorus and eutrophication: A global perspective: Increasing accumulation of phosphorus in soil threatens rivers, lakes, and coastal oceans with eutrophication. BioScience 2001, 51, 227–234. [Google Scholar] [CrossRef]
  4. Mundoli, S.; Manjunath, B.; Nagendra, H. Effects of urbanization on the ecology of lakes in India. Environ. Urban. ASIA 2015, 6, 1–17. [Google Scholar]
  5. Bilgiç, E.; Baba, A. Effect of urbanization on water resources: Challenges and prospects. In Groundwater in Arid and Semi-Arid Areas: Monitoring, Assessment, Modelling, and Management; Springer: Cham, Switzerland, 2023; pp. 81–108. [Google Scholar]
  6. McGrane, S.J. Impacts of urbanisation on hydrological and water quality dynamics, and urban water management: A review. Hydrol. Earth Syst. Sci. 2016, 20, 385–415. [Google Scholar] [CrossRef]
  7. UNEP. World Water Quality Alliance: Global Water Quality Assessment—Summary for Policy Makers; United Nations Environment Programme: Nairobi, Kenya, 2021.
  8. K, P.A.; M, M.; Rajamanickam, S.; Sivarethinamohan, S.; Gaddam, M.K.R.; Velusamy, P.; R, G.; Ravindiran, G.; Gurugubelli, T.R.; Muniasamy, S.K. Impact of climate change and anthropogenic activities on aquatic ecosystem–A review. Environ. Res. 2023, 238, 117233. [Google Scholar]
  9. Tian, Y.; Wang, Y.; Zhou, Y.; Zhang, L.; Li, M.; Zhou, Y. Spatiotemporal changes in lake surface temperatures across China from 2001 to 2016. J. Hydrol. 2020, 582, 124451. [Google Scholar]
  10. IPCC. Climate Change 2022: Impacts, Adaptation and Vulnerability. Contribution of Working Group II to the Sixth Assessment Report; Cambridge University Press: Cambridge, UK, 2022.
  11. Bhuju, U.R.; Khadka, M.; Neupane, P.K.; Adhikari, R. A map based inventory of lakes in Nepal. Nepal J. Sci. Technol. 2010, 11, 173–180. [Google Scholar] [CrossRef]
  12. Lamsal, P.; Pant, K.P.; Atreya, K.; Kumar, L. Diversity, uses, and conservation of wetland plants in Nepal. J. Ecol. Nat. Environ. 2017, 9, 183–194. [Google Scholar]
  13. Watson, C.S.; Regmi, D.; Thapa, R.B.; Chettri, N.; Pandit, A.; Kafle, G.; Sharma, P.; Pradhan, B. Mapping ecosystem services trade-offs and synergies: Phewa Lake watershed, Nepal. Ecosyst. Serv. 2019, 36, 100896. [Google Scholar]
  14. Lamichhane, K.; Karki, S.; Sharma, K.; Khadka, B.; Acharya, B.; Biswakarma, K.; Adhikari, S.; KC, R.; Danegulu, A.; Bhattarai, S.; et al. Unraveling the Causes and Impacts of Increasing Flood Disasters in the Kathmandu Valley: Lessons from the Unprecedented September 2024 Floods. Nat. Hazards Res. 2025, in press. [Google Scholar] [CrossRef]
  15. Adhikari, B.R.; Gautam, S.; Paudel, B. Landslide, land cover, and land use changes and its impacts in Nepal. In Impact of Climate Change, Land Use and Land Cover, and Socio-Economic Dynamics on Landslides; Springer: Cham, Switzerland, 2022; pp. 149–164. [Google Scholar]
  16. McAdoo, B.G.; Hockridge, J.; Vörösmarty, C.; Galloway, G.E. Rising risks to infrastructure from global change. EOS Trans. Am. Geophys. Union 2018, 99, 1–5. [Google Scholar]
  17. Rodriguez, L.G.; McCallum, A.; Kent, D.; Rathnayaka, C.; Fairweather, H. A review of sedimentation rates in freshwater reservoirs: Recent changes and causative factors. Aquat. Sci. 2023, 85, 60. [Google Scholar] [CrossRef]
  18. Giri, I.; KC, R.; Khadka, U.R. Water quality status in Bagmati river of Kathmandu valley, Nepal. In Ecological Significance of River Ecosystems; Elsevier: Amsterdam, The Netherlands, 2022; pp. 481–502. [Google Scholar]
  19. Sarker, M.H.; Mahmud, S.; Khan, M.; Dewan, A. Assessment of wetland dynamics in a rapidly urbanizing city using remote sensing and GIS techniques: A case study of Dhaka, Bangladesh. Environ. Chall. 2021, 5, 100276. [Google Scholar]
  20. Pandey, C.L.; Acharya, P.; Khanal, B. Integrated flood modeling and hazard mapping in a transboundary river basin: A case study of the Babai River, Nepal. J. Flood Risk Manag. 2024, 17, e12894. [Google Scholar]
  21. Ghimire, P. Landscape level efforts to biodiversity conservation in Nepal: A review of current approach and lessons learned. Grassroots J. Nat. Resour. 2019, 2, 16–24. [Google Scholar] [CrossRef]
  22. Paudyal, K.; Baral, S.; Rai, S. Environmental status of Phewa Lake and its sustainability challenges. J. Inst. Eng. 2017, 13, 215–222. [Google Scholar]
  23. Timalsina, D.; Aryal, S.; Adhikari, B.R. Integrated lake management in Pokhara Valley: A case study of Phewa Lake. J. Water Clim. Change 2025, 16, 112–128. [Google Scholar]
  24. Heyojoo, B.P.; Takhachhe, P. An assessment of lake area shrinkage through geospatial approach: Case study of Phewa Lake of Kaski district, Nepal. Int. J. Multidiscip. Curr. Res. 2014, 2, 725–728. [Google Scholar]
  25. Aryal, V. Phewa Lake Watershed Area: A Study on the Challenges to Human Encroachment. In Proceedings of the Taal Conference on the Conservation and Management of Lakes and Wetlands 2007, Jaipur, India, 29 October–2 November 2007; pp. 2292–2299. [Google Scholar]
  26. Benavidez, R.; Jackson, B.; Maxwell, D.; Norton, K. A review of the (Revised) Universal Soil Loss Equation ((R)USLE): With a view to increasing its global applicability and predictive accuracy. J. Hydrol. 2018, 559, 441–451. [Google Scholar]
  27. Luvai, J.; Mwangi, H.M.; Karanja, N.K.; Kamoni, P.T.; Kitaka, N. Predicting soil erosion in the Upper Tana Basin using RUSLE integrated with GIS and remote sensing. Int. Soil Water Conserv. Res. 2022, 10, 1–13. [Google Scholar]
  28. Zhang, Y.; He, X.; Chen, Y.; Xu, C.; Wen, A. Sediment transport and land use change in a typical karst watershed: Evidence from Hongfeng Lake, Southwest China. J. Hydrol. 2019, 578, 124079. [Google Scholar]
  29. Zolotas, A.; Chatzinikolaou, Y.; Koussouris, T. Soil erosion and sedimentation processes in Lake Pamvotis basin (NW Greece) using SWAT model. Environ. Process. 2021, 8, 507–529. [Google Scholar]
  30. Pan, B.; Wen, A. Reservoir sedimentation and sediment yield estimation in the Three Gorges area: A GIS-based approach. J. Hydrol. 2014, 519, 1333–1344. [Google Scholar]
  31. UNDP. Development of Ecosystem-Based Sediment Control Techniques & Design of Siltation Dam to Protect 788 Phewa Lake: Hydrological Analysis; United Nations Development Programme: Kathmandu, Nepal, 2015; pp. 11–13.
  32. Pradhan, A.M.S.; Kim, Y.T. Landslide susceptibility mapping of Phewa catchment using multilayer 750 perceptron artificial neural network. Nepal J. Environ. Sci. 2016, 4, 1–9. [Google Scholar] [CrossRef]
  33. FAO. World Reference Base for Soil Resources 2014: International Soil Classification System for Naming Soils and 656 Creating Legends for Soil Maps (Update 2015); Food and Agriculture Organization of the United Nations: Rome, Italy, 2015.
  34. Renard, K.G. Predicting Soil Erosion by Water: A Guide to Conservation Planning with the Revised Universal Soil 756 Loss Equation (RUSLE); US Department of Agriculture, Agricultural Research Service: Washington, DC, USA, 1997. [Google Scholar]
  35. Department of Hydrology and Meteorology (DHM). 2024; Hydrological and meteorological data. Government of Nepal. Available online: https://www.dhm.gov.np/ (accessed on 14 December 2024).
  36. FAO. Harmonized World Soil Database, Version 1.2; FAO: Rome, Italy; IIASA: Laxenburg, Austria, 2012.
  37. ICIMOD. Land Cover Data for Hindu Kush Himalaya Region. International Centre for Integrated Mountain 676 Development. 2022. Available online: https://rds.icimod.org (accessed on 16 February 2025).
  38. Koirala, P.; Thakuri, S.; Joshi, S.; Chauhan, R. Soil erosion assessment using RUSLE model and GIS in Rasuwa District, Nepal. Geomat. Nat. Hazards Risk 2019, 10, 803–825. [Google Scholar]
  39. Thapa, R.B. Assessment of soil erosion risk in the Gandaki River Basin of Nepal using RUSLE and GIS. Nepal J. Environ. Sci. 2020, 8, 22–30. [Google Scholar]
  40. López-Vicente, M.; Guzmán, G. Soil erosion and conservation studies in Europe: A comprehensive review of modeling approaches. CATENA 2021, 199, 105102. [Google Scholar]
  41. Kaffas, K.; Pisinaras, V.; Al Sayah, M.J.; Santopietro, S.; Righetti, M. A USLE-based model with modified LS-factor combined with sediment delivery module for Alpine basins. CATENA 2021, 207, 105655. [Google Scholar] [CrossRef]
  42. Wang, G.; Liu, J. Development of a grid-based distributed model for simulating the hydrological cycle and water quality in the Sanjiang Plain Wetlands, China. Hydrol. Process. 2006, 20, 505–525. [Google Scholar]
  43. Panagos, P.; Borrelli, P.; Poesen, J.; Ballabio, C.; Lugato, E.; Meusburger, K.; Montanarella, L.; Alewell, C. The new assessment of soil loss by water erosion in Europe. Environ. Sci. Policy 2015, 54, 438–447. [Google Scholar] [CrossRef]
  44. Budhathoki, S.; Poudel, A.; Shrestha, H.L. Soil erosion analysis using GIS and RS in Makawanpur District, Nepal. J. For. Nat. Resour. Manag. 2023, 3, 68–81. [Google Scholar] [CrossRef]
  45. Williams, J.R.; Berndt, H.D. Sediment yield prediction techniques for watersheds in the southeastern United States. Trans. ASAE 1972, 15, 1100–1104. [Google Scholar]
  46. Vanoni, V.A. Sedimentation Engineering: Manuals and Reports on Engineering Practice No. 54; American Society of Civil Engineers (ASCE): New York, NY, USA, 2006. [Google Scholar]
  47. WECS. Flood Control and Management Manual; Government of Nepal: Kathmandu, Nepal, 2019.
  48. USDA (United States Department of Agriculture). Urban Hydrology for Small Watersheds; Technical Release 55 (TR-55); USDA: Washington, DC, USA, 1972.
  49. Pandey, A.; Gautam, D.; Ghimire, S. Application of hydrological modeling for runoff estimation in a mountainous watershed of Nepal. J. Hydrol. Reg. Stud. 2020, 32, 100760. [Google Scholar]
  50. Dulal, K.N.; Baral, S. Analysis of Rainfall and Runoff Patterns for Sustainable Water Resources Management in Gandaki Basin. J. Inst. Eng. 2015, 11, 178–186. [Google Scholar]
  51. USDA NRCS. Chapter 9: Hydrologic Soil-Cover Complexes (Curve Number Method). In National Engineering Handbook: Part 630 Hydrology; United States Department of Agriculture, Natural Resources Conservation Service: Washington, DC, USA, 2021. [Google Scholar]
  52. Yarahmadi, P.; Talebbeydokhti, N.; Saadatpour, M.; Haghighi, A.T. Effects of channel roughness on flood propagation and sediment transport in urban areas using HEC-RAS. Water Supply 2023, 23, 905–922. [Google Scholar]
  53. JICA Nepal; SILT Consultants Pvt. Ltd. The Development Study on the Environmental Preservation of Phewa Lake; Final Report; Japan International Cooperation Agency (JICA) and SILT: Kathmandu, Nepal, 2001.
  54. Impat, P. Hydrometeorology and Sediment Data for Phewa Watershed: 1979 Data; Water and Energy Commission Secretariat (WECS): Kathmandu, Nepal, 1981. [Google Scholar]
  55. Carver, M.; Nakarmi, G. The Effect of Surface Conditions on Soil Erosion and Stream Suspended Sediments; Department of Hydrology and Meteorology (DHM): Kathmandu, Nepal, 1995. [Google Scholar]
  56. Sittig, M. Resource Recovery and Recycling Handbook of Industrial Wastes; Noyes Data Corp.: Park Ridge, NJ, USA, 1975. [Google Scholar]
  57. Ross, M.A. Sediment Deposition and Lake Infilling in Phewa Lake, Pokhara, Nepal. Environ. Geol. 1998, 36, 325–334. [Google Scholar]
  58. Santillan, J.R.; Makinano-Santillan, M. Vertical accuracy assessment of 1-arc second SRTM-derived elevation data over the Philippines. In Proceedings of the ISPRS Annals of Photogrammetry, Remote Sensing and Spatial Information Sciences 2016, Prague, Czech Republic, 2–19 July 2016; Volume III-2, pp. 259–266. [Google Scholar]
  59. Laursen, E.M. An analysis of relief maps as a tool for sediment yield prediction. In Sediment Transport in Alluvial Channels; ASCE: New York, NY, USA, 1958. [Google Scholar]
  60. Thomas, R.B. Measuring suspended sediment yields with acoustic methods. Water Resour. Res. 2002, 38, 1–9. [Google Scholar]
  61. Soulsby, R. Dynamics of Marine Sands: A Manual for Practical Applications; Thomas Telford Publishing: London, UK, 1997. [Google Scholar]
  62. Nepal–India Cooperation Mission. Phewa Lake Area Development Plan; Government of Nepal and India: Kathmandu, Nepal, 1962.
  63. Devkota, S.; Adhikari, B.R. Development of Ecosystem-Based Sediment Control Techniques and Design of Siltation Dam to Protect Phewa Lake; Government of Nepal and UNDP: Kathmandu, Nepal, 2015. [Google Scholar]
  64. International Union for Conservation of Nature (IUCN). Phewa Lake Conservation Action Plan; National Planning Commission and IUCN Nepal: Kathmandu, Nepal, 1997.
  65. District Development Committee Kaski. Pokhara Valley Urban Development and Land Use Report; Kaski DDC: Pokhara, Nepal, 2005.
  66. Pokhara Valley Urban Development Committee. Urban Development Plan of Pokhara Valley; PVUDC: Pokhara, Nepal, 2008.
  67. Lamichhane, R. Area Mapping of Phewa Lake Using Remote Sensing and GIS. Master’s Thesis, Tribhuvan University, Pokhara, Nepal, 2012. [Google Scholar]
  68. Ministry of Land Reform. Boundary and Land Registration Report for Phewa Lake; Government of Nepal: Kathmandu, Nepal, 2015.
  69. Pokhara Municipal Corporation. Environmental Status Report of Phewa Lake; PMC: Pokhara, Nepal, 2021.
  70. Poudel, S. Analysis of Spatiotemporal Changes in Phewa Lake Using GIS and Remote Sensing. Master’s Thesis, Institute of Engineering, Tribhuvan University, Pokhara, Nepal, 2021. [Google Scholar]
  71. Andreasen, M.H.; Agergaard, J.; Kofie, R.Y.; Møller-Jensen, L.; Oteng-Ababio, M. Urban encroachment in ecologically sensitive areas: Drivers, impediments and consequences. Build. Cities 2022, 3, 149–165. [Google Scholar] [CrossRef]
  72. Khanal, K.P.; Regmi, S.K. Enhancing ecosystem services through sediment retention in Phewa Lake of Western Nepal. In Proceedings of the International Conference on Climate Change Innovation and Resilience for Sustainable Livelihood, Kathmandu, Nepal, 12–14 January 2015; p. 76. [Google Scholar]
  73. Malla-Pradhan, N.; Regmi, R.K.; Pradhan, S.; Subedi, D. Seasonal variation of microplastics in the surface water of Phewa Lake, Nepal. Environ. Chall. 2022, 9, 100611. [Google Scholar]
  74. Gautam, R.; Shrestha, S.M. Hydrogeochemical evaluation and characterization of water quality in the Phewa Lake, Pokhara, Nepal. Environ. Sci. Pollut. Res. 2024, 31, 60568–60586. [Google Scholar] [CrossRef] [PubMed]
  75. Karki, B.K.; Lamichhane, K.; Joshi, L.; KC, R.; Sah, M.K.; Pathak, M.; Karki, K.R. Risk assessment of heavy metals in the major surface water system of Nepal with potential remediation technologies. Environ. Chall. 2024, 14, 100865. [Google Scholar] [CrossRef]
  76. Sharma, R. Environmental Audit of Lakeside Sewage Management. Sustain. Cities J. 2024, 9, 35–49. [Google Scholar]
  77. Sharma, R.; Naik, P. Impact of invasive aquatic weeds on lake biodiversity and tourism: A case of Phewa Lake. Wetl. Ecol. Manag. 2024, 32, 227–240. [Google Scholar]
  78. Majumdar, R.; Rahman, M.M.; Ahmad, N.; Naidu, R. Seasonal dynamics of sediment and hydrochemistry in Himalayan freshwater lakes. Water Res. 2020, 170, 115364. [Google Scholar]
  79. Kumar, P.; Meena, N.; Singh, V.P. Sediment and flood management in Fatehsagar Lake catchment using check dam interventions. Environ. Monit. Assess. 2024, 196, 229. [Google Scholar]
  80. Ali, M.; Shakir, A.S. Sustainable sediment management options for reservoirs: A case study of Chashma Reservoir in Pakistan. Appl. Water Sci. 2018, 8, 103. [Google Scholar] [CrossRef]
  81. Qazi, A.N. Effectiveness of catchment afforestation and check dams in sediment yield reduction in Himalayan terrain. J. Soil Water Conserv. 2020, 75, 140–150. [Google Scholar]
  82. Camargo, P.B.; Basílio, J.O.; Santos, T.S. To what extent can a sediment yield model be trusted? A case study from the Passaúna Catchment, Brazil. Water 2021, 13, 1045. [Google Scholar] [CrossRef]
  83. Blanco-Canqui, H.; Lal, R. Soil erosion under forests. In Principles of Soil Conservation and Management; Springer: Dordrecht, The Netherlands, 2008; pp. 321–344. [Google Scholar]
  84. Reddy, V.R.; Char, S. Pollution control and water quality management in urban lakes: A case study of Hussainsagar Lake, Hyderabad. Water Resour. Manag. 2006, 20, 577–594. [Google Scholar]
  85. Zhang, Y.; Qin, B.; Gao, G.; Zhu, G.; Luo, L.; Zhang, Y. Long-term changes of nutrients and chlorophyll-a in Taihu Lake, China: Effects of climatic and anthropogenic factors. J. Environ. Sci. 2012, 24, 136–146. [Google Scholar]
  86. Zhang, Y.; Li, Y.; Liu, X.; Qian, H.; Wang, W. Effect of ecological water diversion on water quality in Dianchi Lake, China. Environ. Sci. Pollut. Res. 2018, 25, 30215–30224. [Google Scholar]
  87. Welch, E.B.; Jacoby, J.M.; Perkins, M.A. Water quality and algae response to reduced phosphorus in Moses Lake, Washington. Lake Reserv. Manag. 2024, 40, 45–60. [Google Scholar]
  88. Mavrommati, G.; Borsuk, M.E.; Howarth, R.B. A stakeholder-based Bayesian approach to strategic lake management: The case of Lake Champlain. Glob. Environ. Change 2014, 24, 48–61. [Google Scholar]
  89. Nair, J.R.; Bhatt, D.; Gurung, T.R.; Sharma, S. SWOT analysis for participatory lake governance in Nepal: The case of Rupa Lake. Environ. Dev. 2021, 38, 100628. [Google Scholar]
  90. Samal, N.R.; Dash, S.K. Integrated management of Chilika Lake using SWOT and DPSIR approaches. Lakes Reserv. Res. Manag. 2025, 30, 201–217. [Google Scholar]
  91. Acharya, S.; Sophal, C.; Lek, S.; Seng, L. Stakeholder-inclusive conservation planning in Tonle Sap Lake, Cambodia: A SWOT-based analysis. Water Int. 2023, 48, 688–707. [Google Scholar]
  92. Hansen, H.S. A framework for sustainability assessment of urban water systems using SWOT and decision support tools. Urban Water J. 2008, 5, 147–159. [Google Scholar]
  93. Shevtsova, N.; Parkhomchuk, N. Revitalization and recreational development of urban lakes: Case studies from Russia and Japan. J. Urban Environ. Eng. 2022, 16, 67–79. [Google Scholar]
  94. Reddi, V.K.; Char, S. Urban lake restoration in India: A case study of Dal Lake. Indian J. Environ. Prot. 2006, 26, 810–817. [Google Scholar]
  95. Alemayehu, T.; Legesse, D.; Ayenew, T. Hydrogeochemical and isotopic composition of Lake Tana and its inflowing rivers, Ethiopia. Hydrol. Process. 2010, 24, 3525–3536. [Google Scholar]
  96. Njiru, J.M.; Abuodha, J.O.Z.; Sitoki, L.; Ongore, C.; Aura, C.M. Sustainable management options for Lake Victoria: The role of community participation. Lakes Reserv. Res. Manag. 2018, 23, 110–119. [Google Scholar]
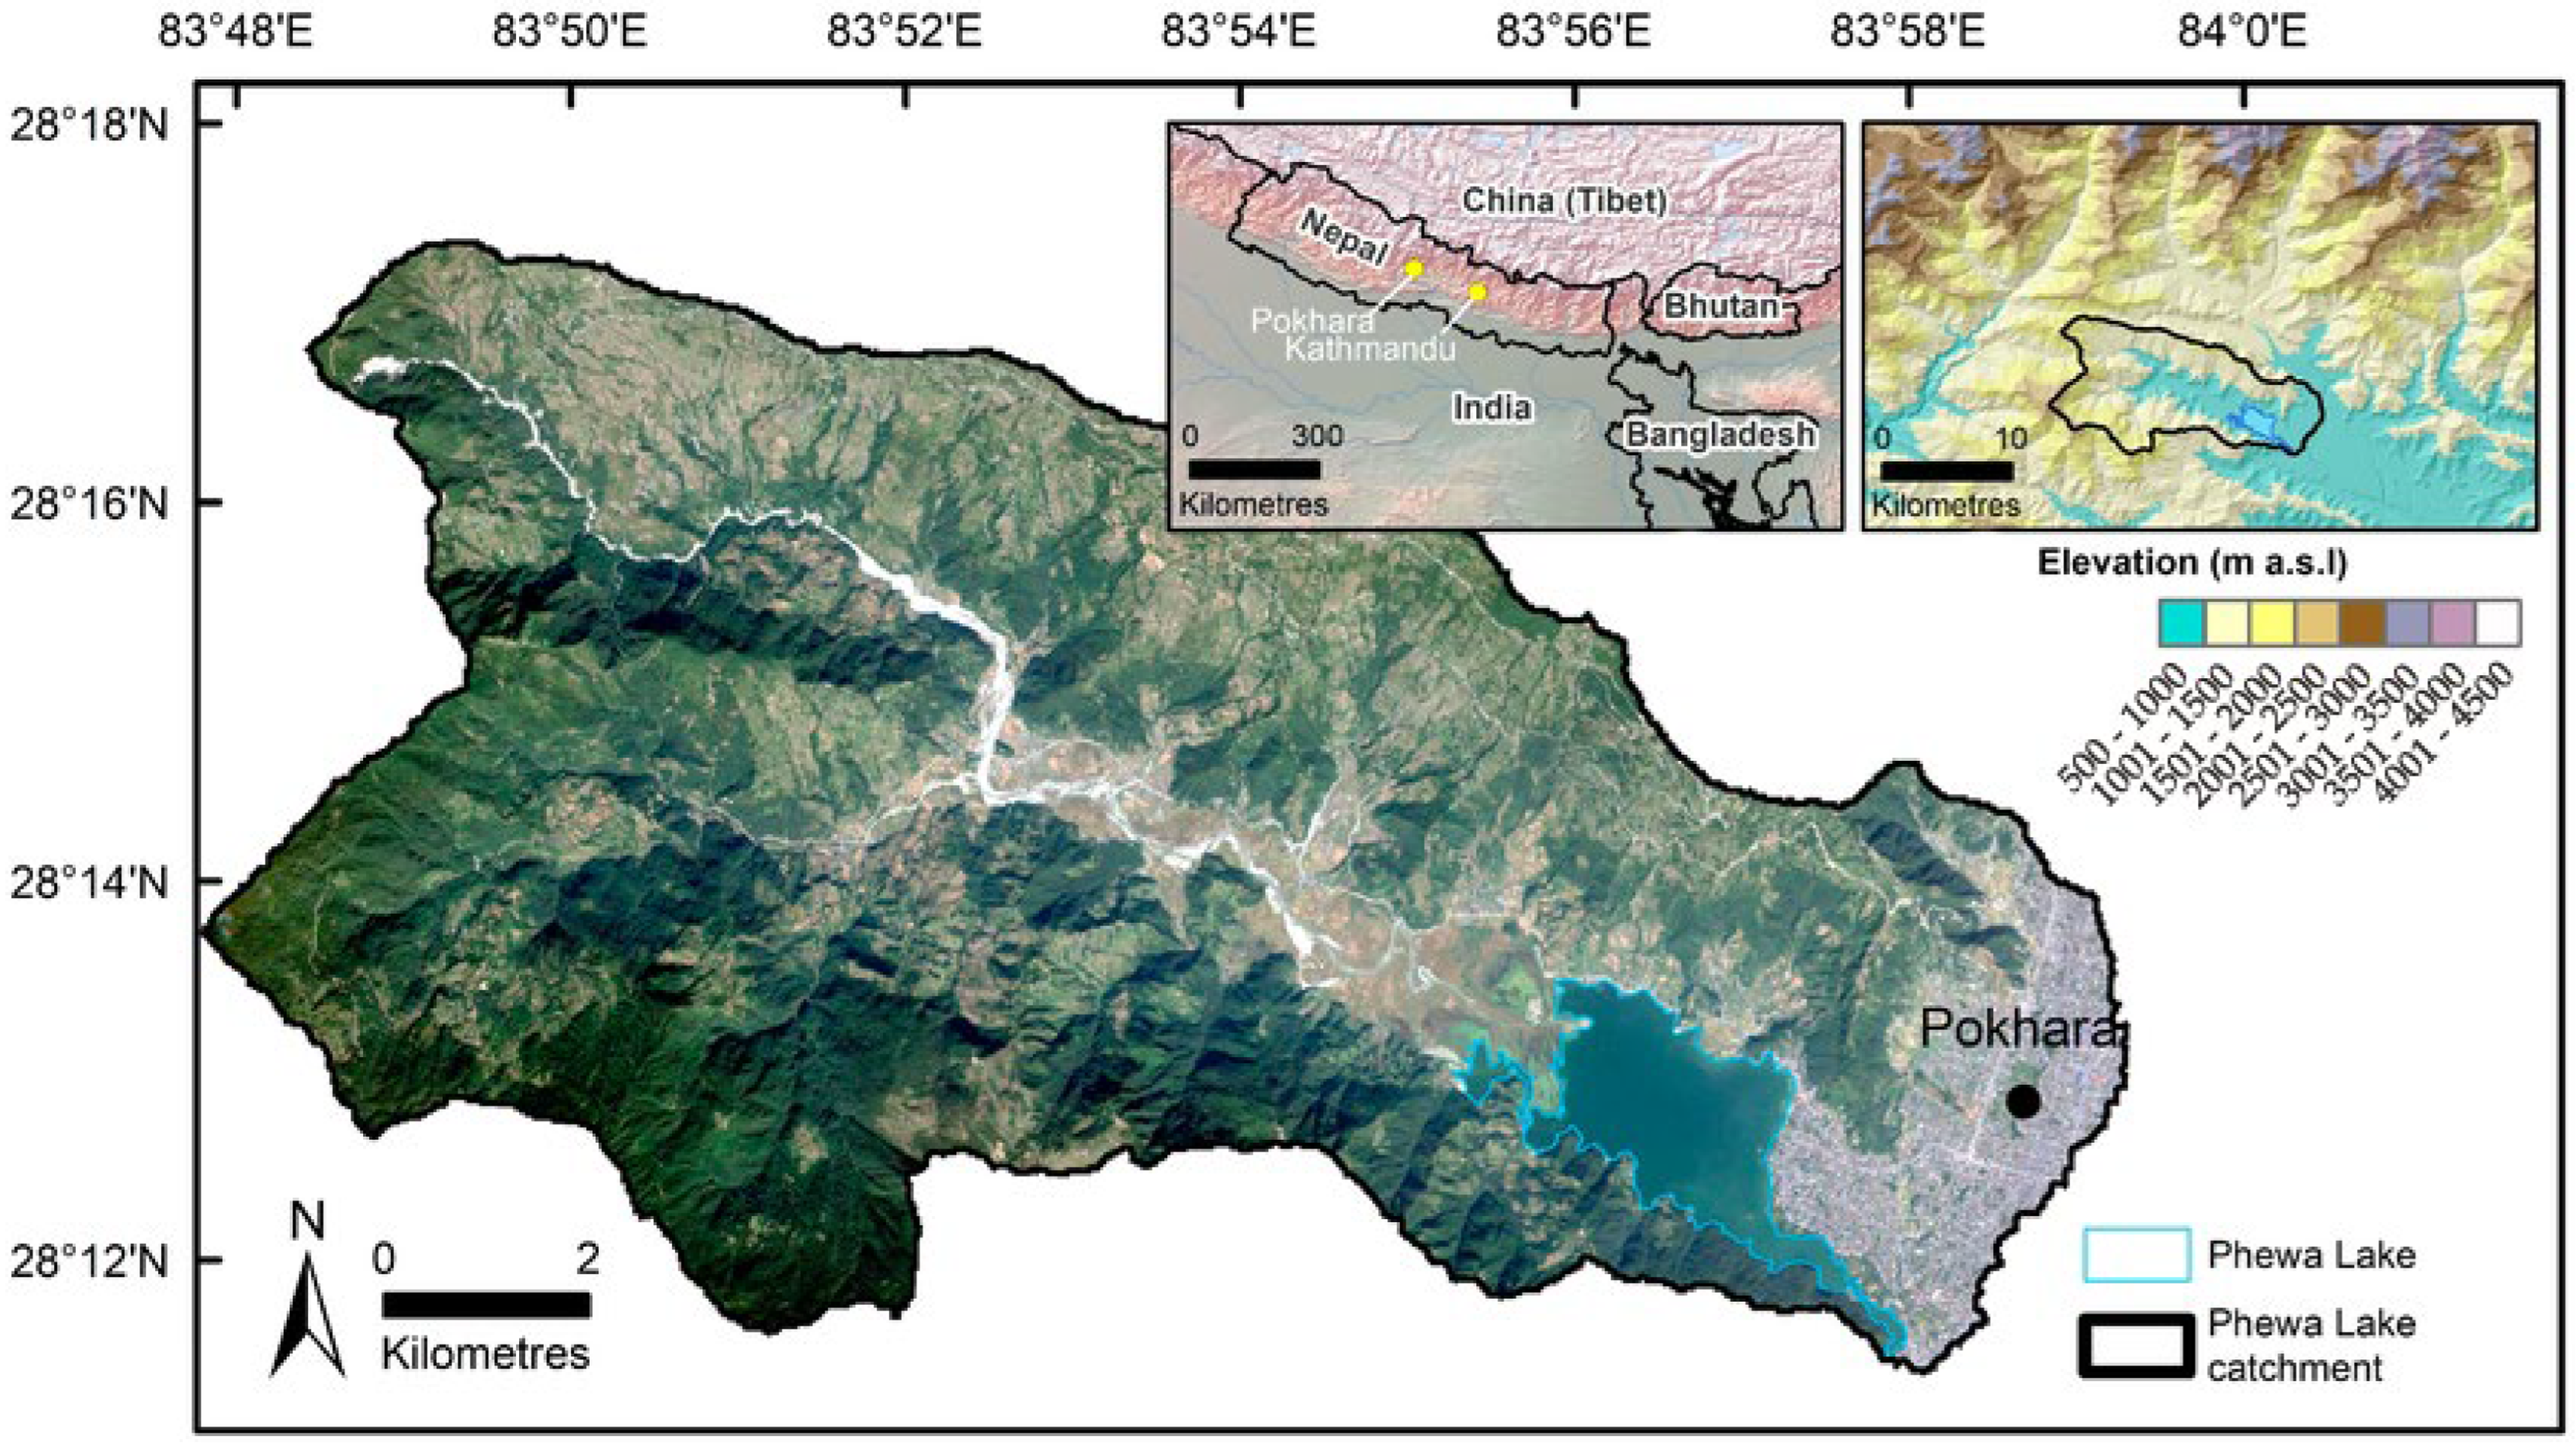
Figure 1. Study area map of Phewa Lake catchment modified from Watson et al. [13].
Sustainability 17 06572 g001
Figure 2. Flowchart of the integrated assessment methodology for Phewa Lake, Nepal, illustrating data collection, analysis, and revitalization planning.
Sustainability 17 06572 g002
Figure 3. (a) Mapping of R-factor, (b) of K-factor, (c) of LS factor, (d) of P-factor, and (e) of C-factor. All of Phewa Lake catchment used for RUSLE analysis.
Sustainability 17 06572 g003
Figure 4. Soil erosion potential mapping of Phewa Lake catchment generated using RUSLE analysis.
Sustainability 17 06572 g004
Figure 5. (a) Human encroachment at Khapaudi, (b) near Seti Bagar, (c) mixing of drain to lake in Gaira Chautari, and (d) growth of Jalkumbhi (Hyacinth) Near Gairha Chautary.
Sustainability 17 06572 g005
Figure 6. Location details of siltation basin, dam, and guide bank.
Sustainability 17 06572 g006
Figure 7. Proposed diversion canal for checking the inflow of waste and urban runoff to Phewa Lake, (a) alignment I, (b) alignment II, and (c) alignment III.
Sustainability 17 06572 g007
Figure 8. Proposed diversion canal for checking the inflow of waste and urban runoff to Phewa Lake, (a) alignment IV and (b) alignment V.
Sustainability 17 06572 g008
Figure 9. Different components of revitalization plan of Phewa Lake for its sustainable management.
Sustainability 17 06572 g009
Table 1. Empirical flood discharge formulas based on return periods using the WECS method [47].
Return Period (yr)FormulaRemarks
2 Q 2 = 1.8767 × A 3000 + 1 0.8783 A3000 = basin area (sq. km) below 3000 m elevation calculated as 84.3599 sq. km.
100 Q 100 = 14.63 × A 3000 + 1 0.7342
Table 2. Sediment yield according to various sediment delivery ratio (SDR).
MethodSDR (%)Suspended Sediment Yield for Harpan Khola at Morebagar (tons)
William and Berndt [45]24.2466,074.18
Vanoni [46]27.1774,142.65
USDA Curve [47]1849,064.99
Table 3. Historical estimates of Phewa Lake area by various studies (1962–2021).
S. No.YearArea of Phewa LakeSource
1196210.35 sq. km[62]
21976–19774.43 sq. km[63]
31982–19835.80 sq. km[64]
419954.49 sq. km[64]
520054.25 sq. km[65]
620085.06 sq. km[66]
720126.50 sq. km[67]
820155.07 sq. km[68]
920215.08 sq. km[69]
1020215.726 sq. km[70]
Table 4. Effect of weir height on sediment trap efficiency (mass and volume) and incremental gains in efficiency.
Weir Height (m)Trap Efficiency (Mass %)Trap Efficiency (Volume %)Increase in Efficiency (Mass %)
2.0073.4072.80
2.2576.9076.403.50
2.5080.3079.903.40
2.7583.4083.003.10
3.0084.6084.201.20
Table 5. Detailed SWOT analysis provided for Phewa Lake of Nepal.
CategoryDetails
Strengths (Internal Positive Factors)
  • Ecological and Economic Importance: Ramsar site supports biodiversity, irrigation, hydroelectricity, and acts as a carbon sink.
  • Tourism and Cultural Significance: Major tourist destination, religious importance, scenic beauty, and eco-tourism activities.
  • Economic Activities and Livelihood: Economic hub with tourism, hospitality, and livelihoods for marginalized communities (fishermen and boatmen).
  • Governmental and Community Initiatives: Conservation efforts by government and community participation in conservation planning.
Weaknesses (Internal Negative Factors)
  • Environmental Degradation: Sedimentation, invasive species (e.g., Jalakumbhi), and sewage disposal affect water quality.
  • Administrative and Planning Challenges: Lack of integration, conflicting interests among stakeholders, and incomplete implementation of policies.
  • Encroachment and Urban Pressure: Unauthorized settlements and businesses impacting ecological balance.
  • Financial Constraints: Insufficient funding and mismanagement of conservation resources.
Opportunities (External Positive Factors)
  • Integrated Lake Conservation Planning: Guidelines for lake conservation focusing on sediment control, pollution prevention, and shoreline management.
  • Eco-tourism Expansion: Potential for sustainable tourism models that balance conservation and economic growth.
  • Technological Solutions: Use of GIS, remote sensing, and sonar for monitoring and management.
  • Infrastructure Development: Siltation basins, guide banks, and diversion canals to mitigate sedimentation.
  • Capacity Building and Awareness Programs: Community education and participation in sustainable conservation practices.
Threats (External Negative Factors)
  • Pollution: Untreated sewage and waste from urban areas threatening water quality.
  • Encroachment: Ongoing illegal construction reducing lake area and disturbing ecosystems.
  • Climate Change Impacts: Increased rainfall causing sedimentation, flooding, and ecosystem disruption.
  • Lack of Sustainable Management: No enforceable long-term management plan leading to further ecological degradation.
Disclaimer/Publisher’s Note: The statements, opinions and data contained in all publications are solely those of the individual author(s) and contributor(s) and not of MDPI and/or the editor(s). MDPI and/or the editor(s) disclaim responsibility for any injury to people or property resulting from any ideas, methods, instructions or products referred to in the content.