Abstract
Climate change can severely impact plant-pollinator interactions and have serious effects on ecosystem services such as pollination. This study was carried out in 2023 and 2024, and it examined the effects of drought on flowering and nectar production in one cultivar of white mustard (Brassica alba cv. Palma), an important entomophilous crop of the temperate zone with several attributes that make it promising for sustainable agricultural practices. Drought-stressed plants delayed the flowering time, shortened the flowering duration, and developed significantly fewer flowers. Nectar production in white mustard depends on soil moisture levels and short-term changes in meteorological conditions (e.g., air humidity, air temperature). At reduced soil moisture, the total sugar yield per plant decreased by 60%, compared to control plants, resulting in lower availability of caloric food resources, which should be considered when developing strategies supporting pollinators. Changes in floral traits resulted in differences in the frequency of insect visits, which may exert a negative impact on white mustard pollination under drought stress and may have indirect consequences for seed yield resulting from increased drought intensity associated with climate change. The results provide important data for the management of the white mustard crop and indicate the need for broader evaluation of cultivars to promote drought-resistant B. alba cultivars.
1. Introduction
In recent decades, we have been experiencing an accelerating trend of climate change [1]. In many regions of the Earth, rising air temperatures, greater numbers of hotter days per year, and reduced rainfalls are some of the severe symptoms of climate change [2]. Episodes of long-term drought combined with heat waves pose the greatest risks for ecosystems, economically important crops, food security, human health, and water supply [2,3,4].
One of the disturbing effects of heat or drought stress (or a combination of both) is the negative impact on plant-insect relationships manifested by changes in flowering phenology, deterioration of flower display (number of flowers and their size), and reduction in the quantity of available floral reward (nectar and pollen) that constitutes the basis of pollinator’s diet [5,6,7,8,9].
Nectar, i.e., of the floral rewards, is the main resource for insect visitors, as it provides calories necessary for their vital functions, e.g., flights, foraging, and larval development [10,11]. Indeed, nectar traits are very plastic and vary in response to a range of environmental factors [12,13,14]. Nectar secretion is highly responsive to air temperature [15]. A moderate increase in air temperature may be beneficial and may increase the amount of secreted nectar [16]; however, substantial temperature rises have been reported to impair nectar volume and nectar sugar content [8,17,18], although the effects appear to be species dependent, as species differ in their thermal tolerance [12,17,19,20]. Nectar production and sugar concentration are also sensitive to air humidity [12]. In general, low relative air humidity increases the evaporation of water from nectar and maintains a high sugar concentration [16]. Among soil properties, soil water availability and fertility can significantly modify nectar secretion [21,22].
In response to the challenges of climate change, it is essential to expand the use of environmentally friendly agricultural models and promote sustainable farming practices to support biodiversity, ensure the welfare of farm animals, and provide habitats for the coexistence of wildlife [23,24,25]. Among these practices, actions that can improve the food supply for pollinators by reducing seasonal “hunger gaps” should be widely promoted [26,27]. This is related to the need to support pollinators, as reduced availability of floral food resources can lead to a further decline in pollinator abundance, which will have an adverse effect on the yields of pollinator-dependent crops [28,29]. The support for pollinators is even more important since it is predicted that the cultivation of pollinator-dependent crops will need to be increased worldwide due to the ever-increasing human population [30].
Therefore, it is necessary to recognize the tolerance of pollinator-friendly crops to temperature rises and/or drought events in order to maintain agricultural yields in the future [2,31,32,33]. Among various entomophilous crops, Brassica alba (L.) Rabenh (synonyms: Sinapis alba L., Brassica hirta Moench; family Brassicaceae), i.e., white mustard, has aroused interest as an important crop for sustainable agriculture and promotion of eco-friendly farming practices in changing climatic conditions [21,34]. White mustard is an annual crop originating from the Mediterranean region [35]. Western Europe is a key production area for white mustard, and the other cultivation areas include Canada, Ukraine, northern regions of the USA, the Near East, Australia, and Japan [36].
White mustard is an economically profitable crop, as it is widely used in the food (for cooking and food preservation) and cosmetic industries, and has many advantages in sustainable agriculture [37]. The species is characterized by rapid growth, and a small number of days (ca. 85–105 days) is required from sowing to seed harvesting [38]. Therefore, it is one of the most frequently used so-called second crops for re-sowing fields after the main crops, pivotal for improving soil structure and maintaining water and nutrient balance [34,39]. Its popularity is related to its high potential value as a fertilizer able to replace manure fertilization, which is largely desired in modern farms struggling with manure shortages [37]. The species is indicated as an alternative to conventional Brassica species for biodiesel production [40] and for enhancing phytoremediation of toxic heavy metals from soil [41]. White mustard is also beneficial for biological pest control [39]. Since Brassica alba is a nectar- and pollen-producing plant, diverse cultivars are highly recommended for supporting food resources for pollinators [42,43,44,45] and are desired by beekeepers to improve summer and late summer food resources for honey bees [46]. The white mustard crop requires an optimal temperature between 18 °C and 27 °C for proper development and growth, whereas temperatures above 30 °C can be harmful for these plants [47].
Understanding the impact of changing climatic factors on nectar abundance can help develop strategies and action plans aimed at improving the food base for pollinators, the shortage of which is indicated as an important cause of the decline in their numbers [29]. Creation of insect-friendly habitats and implementation of professional farm management practices (e.g., crop rotation, introduction of climate-resistant crops) are among actions that can play a crucial role in sustainable agriculture, as insect well-being is crucial for successful food production and maintenance of biodiversity [10,18,33].
Therefore, our study objective was to determine the effect of the variability in soil moisture levels on flowering and nectar production in field-cultivated white mustard. As detailed goals, we observed the blooming phenology and the number of developed flowers per individual plant. Moreover, nectar production was measured in response to different levels of soil moisture and short-term meteorological factors. We hypothesized that reduced soil moisture levels would lead to the reduction of sugar food resources available to pollinators and adversely affect pollinator activity.
2. Materials and Methods
2.1. Experimental Plants and Study Location
We used a white mustard cultivar of Polish origin (Brassica alba cv. Palma), whose certified seeds were obtained from the Małopolska Plant Breeding company. This high-yielding cultivar is grown across the country as a forecrop or a cover crop (https://www.agropolska.pl/, accessed on 14 May 2025).
Experimental plots were established on a commercial farm in Zakrzew (50°53′ N 22°32′ E; ca. 220 m altitude) in the Lubelskie region, SE Poland. The climate corresponds closely to the Dbf climate type—warm summer humid continental climate (the Köppen-Geiger climate categories). In the study region, the mean annual temperature is +8.7 °C (47.1 °F), and the mean annual precipitation is 730 mm (https://pl.climate-data.org, accessed on 14 May 2025).
Seasonal precipitation values recorded in the white mustard growing season are shown in Table S1. In general, the annual average precipitation during the experimental period (May–June) was 87/80 mm (2023/2024), with a long-term annual average value of 137.5 mm. The average long-term annual temperature was 13.6 °C in May and 16.9 °C in June, whereas higher air temperatures were noted in both study years (by 0.2–3.3 °C in May and by 1.5–4.4 °C in June).
The soil in the area is loess with a slightly acidic reaction (pH = 6.2) and a low content of available phosphorus and potassium, a very high content of magnesium, and a moderate content of available microelements. Potato was the forecrop for the white mustard. Fertilization, as well as weed and pest control practices, were implemented according to standard recommendations for commercial crops. Therefore, before seed sowing at the beginning of the experiment, a multi-component granular NPK(S) fertilizer (Polifoska; Grupa Azoty S.A., Puławy, Poland) was applied in an amount of 1 kg per 100 m2. A selective herbicide (Fusilade Forte 150EC) with systemic action at a dose of 1 L/ha was used to control monocotyledonous weeds, whereas dicotyledonous weeds were removed mechanically. If necessary, the chemical control of flea beetle (Psylliodes chrysocephala) and rape beetle (Meligethes aeneus) was employed in accordance with the general principles of integrated pest management (IPM) established by the Institute of Plant Protection—National Research Institute (www.ior.poznan.pl/, accessed on 14 May 2025). For flea beetle limitation, Karate Zeon 5 CS (at a dose of 0.15 mL per 10 L of water on a 100 m2 surface) was administered shortly after plant emergence. For rape beetle control, Mospilan 20 SP (1 g per 2 L of water on a 100 m2 of surface) and Decis Mega 50EW (1 mL per 2 L of water on a 100 m2 of surface) were applied. Spraying was conducted strictly according to the recommendations, i.e., after sunset to minimize potential risks to pollinators. It was performed only at the beginning of flowering, while observations of insect visitors were made 4–5 days after the application of the pesticides.
2.2. Experimental Set-Up and Protocols
The study was conducted in 2023 and 2024. In both years, seeds were sown directly into the field on 2 May. Each time, 80 seeds were sown in rows with ca. 18 cm spacing between plants. Each experimental plot (1 m2) was arranged in five replications, which were randomly distributed in the field space. After emergence, the density was 50 plants/m2. For the first 4 weeks, all plants in three treatments were watered equally, i.e., the plots were watered at the rate of 10 L/m2 in order to ensure uniform seed germination. From the 5th week after sowing, at the first sign of flower bud formation, the watering treatments were started. The experiment involved three treatments: (i)—control (=ambient precipitation); (ii) irrigation—ambient precipitation + 30 mm of water added (3 × 10 L/m2); (iii) reduced soil moisture (hereafter drought)—no watering and elimination of rainwater with a tunnel made of transparent polyethylene foil. The distance between the plots was approximately 50 cm. The watering of plants was carried out carefully in order to prevent the irrigation water from flowing into the neighboring plots. The irrigation water, with a pH of 7, came from the municipal water distribution network. In the drought treatment, all rainwater was excluded, i.e., the plots were covered with transparent polyethylene foil during rainfall and removed after the rain.
2.3. Soil Moisture Levels
During the experiment, soil moisture was determined with the gravimetric method. In brief, soil samples from the plots of each treatment separately (control, irrigation, drought) were taken from a 5–20 cm depth (n = 3 samples per treatment). The soil samples were weighed (soil total weight) and overdried at 105–110 °C for 24 h to constant weight, and the mass of the dry soil was estimated by reweighing the soil samples. Then, actual soil moisture was calculated (amount of soil moisture = total soil weight − absolute dry soil weight × 100) [48]. These measurements were performed in the 7th week after seed sowing. The soil moisture levels were as follows: in 2023—(i) control plots—56%; (ii) irrigated plots—72%; (iii) drought plots—35%, and in 2024—(i) control plots—48%; (ii) irrigated plots—65%; (iii) drought plots—29%.
2.4. Flowering Observations
We recorded the flowering start date (the day when ca. 10% of the flower buds opened) and the flowering end day (ca. 80% of flowers wilted) to assess phenology (flowering start and duration) [49]. We also determined flower abundance per randomly collected individuals (n = 12 individual plants per treatment). The number of flowers was calculated according to [50] during the full-bloom phase, and all flowers that developed during the flowering period were counted (i.e., buds, flowers, and developed siliques were summed).
2.5. Nectar Collection
The nectar amount was estimated using glass pipettes designed by Jabłoński [51]. Tulle isolators were used to prevent insect visitors. Preliminary observations indicated that an average flower life span is very short, and the flower opening is usually completed by 10.00 h (GMT + 2 h) [42]. Therefore, the nectar was collected from 1-day-old flowers chosen randomly from different individuals, harvested between 10.00 and 11.00 h, and transferred to the laboratory immediately (within 1 h). For each treatment, nectar samples were taken three times during the season (on different days), each time in three replicates. One sample contained nectar pooled from 20–25 flowers (control and hydration treatments) or 30–40 flowers (drought treatment) due to the smaller amount of available nectar. The nectar sugar concentration was measured using an automatic refractometer (Rudolph Research Analytical, model J-357, New York, NY, USA). Then, the mass of sugars produced per flower and per plant was calculated. The sugar resource available per plant (Ps in g) was calculated as: Ps (in g) = a × b/1000, where a = average mass of nectar sugars per flower (mg), and b = number of flowers per plant.
To determine the dependence of nectar production on short-term meteorological data, we collected data on relative air humidity H [%], precipitation P [mm], and average air temperature T [°C]. These data were obtained using a portable weather station (Vantage VUE Console Manual Model 6351).
2.6. Flower Attractiveness to Insect Visitors
To assess the effect of drought on flower attractiveness to potential pollinators, we counted insect visitors on the experimental plots. The observations were conducted during the full-bloom phase on 3 days per season [52]. We counted all insect visitors observed in four time periods (7.00–8.00 h, 10.00–11.00 h, 13–14.00 h, 16–18.00 h) in randomly chosen experimental plots (n = 3) for each treatment. Each census of survey was conducted for 5 min. The number of insect visitors recorded per day was summed. The insect visitor monitoring was carried out in weather conditions suitable for their activity, i.e., no rain, no wind or light wind (<35 km/h), cloud cover < 40%, and air temperature 23–27 °C. The following taxonomic groups of insect visitors were identified: Apis mellifera, Bombus spp., other Hymenoptera, Diptera, and Lepidoptera [44,50].
2.7. Data Analysis
To analyze the phenology data, the calendar dates of the start and end of flowering were converted into Julian dates, i.e., continuous count of days since 1 January [53]. Then, we tested differences in the start of flowering and the flowering duration with the non-parametric Kruskal-Wallis H test between the experimental treatments.
We performed a two-factor analysis of variance (ANOVA) for flowering abundance, nectar traits, and total sugar yield. First, the data were verified for normality (the Kolmogorov–Smirnov test). As the data did not follow a normal distribution, they were subjected to logarithmic transformation (natural log ln). Statistica version 13.1 (Statsoft, Kraków, Poland) was applied for these analyses.
To investigate the relationships between the nectar traits and the explanatory variables (field water capacity and short-term meteorological variables), we employed a generalized linear model analysis (GLM) with a Gaussian distribution and a log link function. The following short-term meteorological variables were encompassed in the model—average air temperature T avg [°C], relative air humidity H [%], and amount of rainfall R [mm]. The meteorological data records were made on (i) the day of nectar collection, (ii) a day before nectar collection, and (iii) 2 days before nectar collection.
Pearson’s chi-square tests for independence and goodness of fit were employed to examine whether the observed frequency distribution of individual insect visitor groups in the experimental treatments (control vs. irrigated vs. drought) fit the uniform distribution. The GLM statistical analyses and insect data calculations were conducted in R Studio (1.3.1093, PBC) using the R language (R Core Team, 2023).
The statistical analyses were performed at a significance level α = 0.05.
3. Results
The experimental treatments had a significant effect on the start of flowering (H (2, N = 60) = 12.73, p = 0.0017) and flowering duration (H (2, N = 60) = 39.33, p < 0.0001) in the white mustard cv. Palma plants. The drought-stressed plants delayed the start and shortened the flowering duration in both study years. In general, flowering started 5–6 days later under the drought stress (Figure 1a), whereas the flowering duration was shorter by 7–9 days, compared to the control and irrigated plants, respectively (Figure 1b).
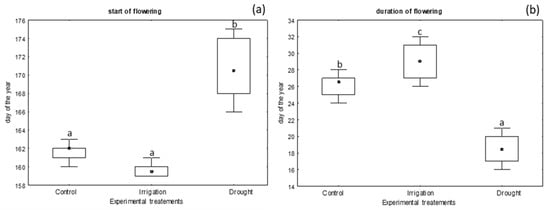
Figure 1.
Flowering phenology of Brassica alba cv. Palma in different experimental treatments (control vs. irrigation vs. drought); (a) flowering start, (b) flowering duration. The flowering start is shown as the day from the 1st January, according to the Julian calendar. Means from 2023–2024 are presented. Significant differences (p < 0.05) between the experimental treatments are marked with different letters, according to the Kruskal-Wallis H. The dots within the boxes indicate median values, and the whiskers show min–max values.
The experimental treatments considerably influenced the abundance of flowering (F 2,102 = 80.09, p < 0.0001; Figure 2). The number of flowers also showed variation between the study years (F 1,102 = 16.07, p < 0.0001); however, the year x treatment interaction was insignificant (p = 0.19). In both years, the lowest number of flowers was recorded on plants exposed to the water soil shortage (drought treatment). The decrease in the number of flowers was ca. 40–50% compared to the control group and ca. 60% compared to the irrigated plants.
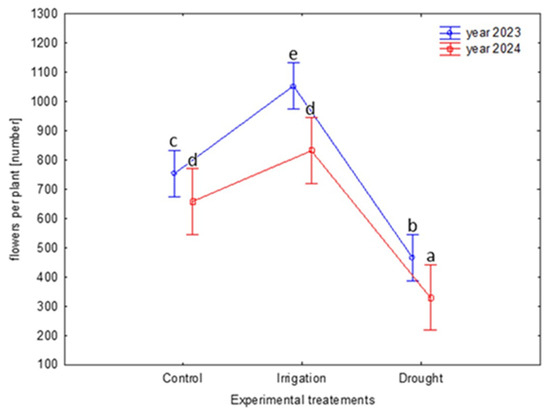
Figure 2.
Number of flowers per plant in B. alba cv. Palma depending on the different experimental treatments (soil moisture levels: control: 2023—56% and 2024—48%; irrigation: 2023—72% and 2024—65%; drought: 2023—35% and 2024—29%) and the study years. Tukey’s HSD test was applied for log-transformed data; however, the presented data are not transformed. Statistically significant differences (p < 0.05) between the means are marked with different letters (the treatment × year effect is shown); the whiskers show the confidence intervals (±0.95).
The experimental treatments had significant effects on the nectar reward traits (nectar mass—F 2,75 = 142.70, p < 0.001; sugar concentration F 2,75 = 37.05, p < 0.001; nectar sugars F 2,75 = 57.17, p < 0.001).
In general, the mass of nectar produced per flower ranged widely (from 0.38 mg to 1.77 mg). On average, the highest amount of nectar was available in the flowers of the irrigated plants (mean = 1.66 mg per flower). The drought stress reduced the amount of nectar produced per flower by ca. 40–50% compared to the control group and by ca. 60% compared to the irrigated plants (Figure 3a).
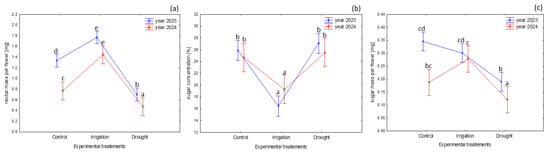
Figure 3.
Nectar traits in B. alba cv. Palma depending on the different experimental treatments (soil moisture levels: control: 2023—56% and 2024—48%; irrigation: 2023—72% and 2024—65%; drought: 2023—35% and 2024—29%); (a) nectar amount secreted per flower life-span (mg); (b) nectar concentration (%); (c) amount of nectar sugar produced during flower life-span (mg) in 2023 and 2024. Tukey’s HSD test was applied for log-transformed data; however, the presented data are not transformed. Significant differences (p < 0.05) are marked with different letters (the treatment × year effect is shown); the whiskers show the confidence intervals (±0.95).
The analyses of nectar traits performed using the GLM model confirmed the significant change in the mean value of nectar mass across the soil moisture treatments (Table 1). Moreover, the model provides some evidence suggesting that there was some additional variation in the annual weather conditions that contributed to the variation in the nectar yield. Comparing 2024 to 2023, an approximate decrease in the expected nectar mass by a factor of 0.74 was recorded.

Table 1.
Effects of experimental variables (treatments and short-term meteorological data) on response variables (nectar traits): nectar volume per flower (in mg), nectar sugar concentration (%), and nectar sugar content per flower (in mg). General linear model (GLM) with a Gaussian distribution and a log link function was applied.
The nectar sugar concentration varied depending on the soil moisture (mean = 26.6% in the drought condition vs. mean = 17.4% in the irrigated plants; Figure 3b, Table 1). The GLM model estimates indicate that the sugar concentration was predicted to increase by a factor of 1.04 when comparing the drought treatment plants and the control cohort, assuming that the other variables remained constant. Conversely, the sugar concentration was expected to decrease by a factor of 0.68 when comparing the irrigated and control plants. In particular, the nectar sugar concentration declined by 0.52% per each additional unit in air humidity on the day of nectar collection, assuming that other variables remained constant. There was an approximate 5.8% reduction in the sugar concentration per one unit increase in rainfall on the day of nectar collection.
The sugar mass available per flower decreased under the drought stress by ca. 33–44% compared to the control group and by 35–55% compared to the irrigated plants (Figure 3c). Considering the GLM model, no statistically significant differences were observed in the sugar mass production when comparing the control and the irrigated plants (Table 1).
The GLM model also revealed the impact of the short-term meteorological variables on the nectar mass, nectar sugar concentration, and sugar mass.
The highest total amount of sugars per plant was determined in the irrigation treatment, whereas the drought-stressed plants produced ca. 65–75% less sugar resources than the control and irrigated treatments (Figure 4).
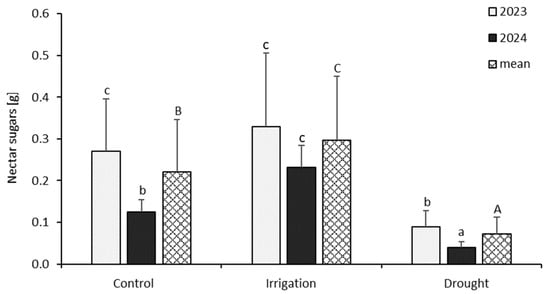
Figure 4.
Nectar sugar yield per white mustard plant, depending on the different experimental treatments (soil moisture level: control: 2023—56% and 2024—48%; irrigation: 2023—72% and 2024—65%; drought: 2023—35% and 2024—29%) in 2023 and 2024. Tukey’s HSD test was applied for log-transformed data; however, the presented data are not transformed. Significant differences between the means (p < 0.05) are marked with different letters: A–C between treatments, a–c treatment × year effect; the whiskers show ± SD—standard deviation.
The chi-square test provided evidence against the statistical independence for both 2023 and 2024. The frequency of insect visitors varied significantly between the experimental treatments when analyzing the study years separately (2023: χ2 = 31.3, df = 8, p = 0.0001; 2024: χ2 = 19.13, df = 8, p = 0.0141) and when considering the combined results for the 2 years (χ2 = 34.2, df = 8, p < 0.0001). However, only honey bees responded equally to the experimental conditions in both years, showing a reduction in the frequency of visits to the drought-stressed plants by ca. 50% compared to the control group and by ca. 55–70% compared to the irrigated plants (Figure 5). In the case of the other insect groups, the chi-square goodness of fit test did not demonstrate that their distribution was consistent with the uniform distribution, indicating the differences in their frequency between the treatment plots in 2023. On the contrary, the empirical frequencies were found to match the expected uniform distribution, suggesting no differences in their frequency between the experimental treatments in 2024.
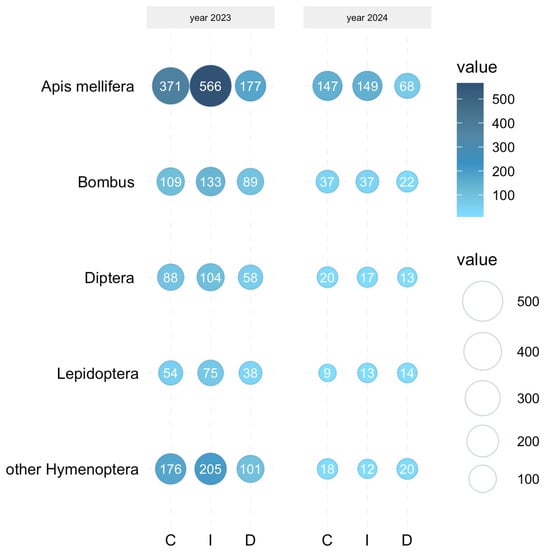
Figure 5.
Bubble plot illustrating the distribution of the insect visitor groups among the experimental plots (C—control vs. I—irrigation vs. D—drought treatments) in B. alba cv. Palma in 2023 and 2024. Pearson Chi-squared test: Apis mellifera 2023 and 2024—p < 0.0001, Bombus 2023—p = 0.012, Bombus 2024—p = 0.095; other Hymenoptera 2023—p ≤ 0.0001, other Hymenoptera 2024—p = 0.534; Diptera 2023—p < 0.0001, Diptera 2024—p = 0.4771; Lepidoptera 2023 p = 0.002, Lepidoptera 2024—p = 0.558. The values are standardized (for details see Section 2.6).
4. Discussion
Our open-field study revealed that plants of B. alba cv. Palma experienced phenotypic changes, i.e., modification of the flowering time (delayed flowering, shortened flowering duration), a decrease in the number of developed flowers, and a reduced nectar volume and nectar sugar yield in plots with water scarcity compared to the well-watered or control plants. These changes undoubtedly indicate that reduced soil moisture may considerably limit pollinator food resources. Differences in the availability of floral nectar can affect pollinator frequency and may reduce the seed yield in white mustard. Therefore, in the scenario of progressive drought episodes, restrictions in the cultivation of white mustard areas should be expected. However, it should be emphasized that our conclusions have certain limitations, as they are based on a short-term experiment (only 2 years) and are focused on one cultivar of white mustard. Therefore, longer-term studies are needed to obtain more realistic assumptions about the impact of drought scenarios on nectar production and the total amount of available food resources for pollinators. Similarly, the impact of reduced nectar resources in drought conditions and changes in other flower characteristics (e.g., volatile organic compounds (VOCs), chemical composition of nectar sugars, pollen production) on pollination effectiveness and seed yield in white mustard requires further research.
It is assumed that extended periods of drought may modify the flowering time, causing either acceleration or delay of flowering (e.g., [54,55]. In our study, the variations in soil moisture levels changed the flowering phenology of the annual B. alba cv. Palma crop, triggering a delay in flowering under water shortages. Similarly, a drought-induced delay of flowering of white mustard was reported by [21,56]. Under drought stress, a special role in controlling the flowering time is assigned to sugars—the main photosynthesis products [57]. The flowering delay may be an adaptation to the storage of sugar resources in unfavorable conditions and an attempt to avoid drought via increased regulation of water loss over reproduction [58]. However, an opposite reaction, i.e., flowering acceleration as a response to reduced soil moisture among annual species of the family Brassicaceae, is also well-known, e.g., in B. rapa [59]. To overcome intense drought stress, plants can trigger different adaptive mechanisms to enhance flowering and maximize the chances for reproduction [21,60,61].
In our experiment, the flowering duration was considerably shorter in plants under water scarcity. It is acknowledged that reduced soil moisture decreases photosynthetic production, causes a significant reduction in sugar reserves, affects plant hormonal changes, and consequently shortens the duration of the flowering phase (e.g., [55,57,62]). Shortening of the flowering phase length under reduced water availability has been confirmed for various annual crops of the family Brassicaceae, e.g., canola (B. campestris), rape (B. napus), and mustard (B. juncea) [22,63].
As expected, the abundance of flowering in B. alba cv. Palma decreased significantly under soil water shortages. Our results are consistent with other reports (e.g., [7,8,17,64,65]) showing general negative effects of soil water deficiency, i.e., reduction in flower development. The number of flowers was reduced by 30–90% under reduced soil moisture (revised in [18]). Although flowers are short-lived, they have a high water demand and are considered to be the major drivers of water loss [15]. Therefore, to reduce transpiration, plants often produce fewer flowers or flowers are aborted in order to decrease water loss during periods of water shortages [21,60]. A decline in flower numbers may also be a well-documented response to reduced resource availability (e.g., through inhibition of plant nutrient uptake, transport, and distribution) and lower plant productivity, which occurs with an increasing duration of reduced soil moisture [58].
The studied plants under reduced soil moisture showed the expected decrease in nectar mass and nectar sugars relative to the control and well-irrigated plants. This is not surprising as, under reduced water availability, plants can decrease water loss through water-saving mechanisms [12]. Numerous studies have shown that nectar amounts decrease in drought-stressed plants [8,13,66]. Similarly to our results, the nectar amount reduction was typically associated with an increase in the nectar sugar concentration in conditions of limited water availability [17,19]. However, no significant changes in nectar reward characteristics (nectar amount, sugar concentration, total sugar amount) under prolonged drought have been reported [8,66]. Our analyses revealed that the nectar production and the nectar sugar concentration are co-dependent on soil moisture levels and short-term weather factors (e.g., air humidity on the day of nectar collection or 1–2 days before, and air temperature). The nectar production is a complex process [14,16,67]. Several studies suggest a highly coupled relationship between the nectar production and short-term abiotic factors, i.e., meteorological conditions, as well as plant water status and its photosynthetic activity [44,49,68]. The response of white mustard to soil water availability and short-term weather factors indicates its high sensitivity not only to soil water deficits but also to variable weather. Therefore, it can be assumed that suboptimal weather may limit the availability and quality of nectar resources for pollinators. In our experiment, the control plants, i.e., those grown in natural field conditions, showed lower nectar productivity and total sugar yield than the irrigated ones, which indicates that white mustard is already experiencing abiotic conditions that limit its productivity. According to the data from the Institute of Soil Science and Plant Cultivation–National Research Institute, soil drought occurred in several regions of Poland, including our research region, during the white mustard growing period in both years of the study (https://susza.iung.pulawy.pl, accessed on 14 May 2025). As underlined in their reports, the crop losses caused by the drought during the study years reached at least 20% compared to yields obtained in average long-term weather conditions. It is predicted that the costs of drought will be rising, which poses a serious threat with potential impacts on food security [69].
Several groups of insect visitors were noted in the experimental white mustard plants, which confirms findings from previous studies highlighting the importance of this species in providing food for wild and managed pollinators e.g., [43,44,50]. We noted differences in the visitation pattern of individual insect groups between the study years. In our field study, honey bees were the most frequently observed, which may be related to the presence of an apiary near our plantation.
We found the lowest abundance of honey bees in the drought-stressed plants in both years, which may illustrate the negative impact of reduced soil moisture on honey bee visitation patterns and was previously documented in many studies [7,70,71]. Plants with lower soil water availability are less attractive as they offer lower amounts of floral rewards (nectar and/or pollen) [18,72]. However, while nectar serves as an important reward, it is not the main attractant for pollinators in white mustard (e.g., [42,44,49]). Modifications in secondary floral traits that are particularly important for attracting pollinators (e.g., flower display size, color, volatile organic compound profiles) are well-documented under drought stress; these flower traits change, making flowers less attractive, which may also reduce the number of plant-pollinator interactions [13]. The honey bee is not regarded as the primary pollinator of white mustard (e.g., [21,51]); therefore, its decline in the drought scenario may not have a substantial impact on the effective pollination of this plant. Interestingly, our field data showed a significant decline in the abundance of bumble bees and ‘other Hymenoptera’ (e.g., solitary bees) in the drought-exposed plants, but only in one study year. These pollinators are indicated as most effective in pollination of Brassicaceae crops (e.g., [42,51,53]); therefore, they may serve as key stabilizers of pollination under environmental stress. In particular, bumble bees are known to continue foraging in more severe weather conditions and even during extreme weather events, although at a reduced levels [73].
Nevertheless, many bee-pollinated economically important cruciferous crops (e.g., oil-seed rape, seed plantations of vegetables) may experience weaker pollination under drought events due to pollinator movement to more rewarding nearby flowers, resulting in reduced productivity of crops despite agricultural technology advances [21,22,74]. However, it has to be emphasized that more extensive investigations are required to fully understand the impact of reduced soil moisture levels and other interdependent factors on floral reward characteristics and the associated behavior of visiting insects and their effectiveness as pollinators in white mustard.
5. Conclusions
This study showed that reduced soil moisture caused a delay in the flowering phase, decreased flower availability by shortening the flowering period, and resulted in a decrease in the number of flowers in white mustard plants. Nectar production in white mustard depends on soil moisture levels and short-term changes in meteorological conditions (e.g., air humidity, rainfall). A decrease in nectar production in drought-stressed plants significantly reduces the total amount of sugars produced in individual plants, which adversely affects the availability of food for pollinators and must be taken into account when developing actions to support pollinators. Strategies for sustainable white mustard production in countries facing an increase in the drought risk should include breeding of drought-resistant cultivars and changes in paradigms in terms of water management.
Supplementary Materials
The following supporting information can be downloaded at: https://www.mdpi.com/article/10.3390/su17146550/s1, Table S1. The climatic data in the study years 2023-2024 in relation to the long-term values; data were originated from the Radawiec weather station.
Author Contributions
B.D. and S.M.—conceptualized the study; S.M. and M.S.-A.—conducted the field observations; M.S.-A. and B.D. performed the laboratory procedures; B.D., M.S.-A. and U.B.-M. performed the statistical analyses; M.S.-A. and U.B.-M. designed the tables and figures; B.D., S.M. and U.B.-M. wrote the main manuscript text; B.D. supervised the study. All authors have read and agreed to the published version of the manuscript.
Funding
This research received no external funding.
Institutional Review Board Statement
Not applicable.
Informed Consent Statement
Not applicable.
Data Availability Statement
No new data were created or analyzed in this study.
Acknowledgments
This work was supported by the Ministry of Science and Higher Education of Poland as statutory activity of the Department of Botany and Plant Physiology, University of Life Sciences in Lublin (project SUBB.WLR.19.071 RiO/BiO).
Conflicts of Interest
The authors declare no conflicts of interest.
References
- Calvin, K.; Dasgupta, D.; Krinner, G.; Mukherji, A.; Thorne, P.W.; Trisos, C.; Romero, J.; Aldunce, P.; Barret, K.; Blanco, G. Climate Change 2023: Synthesis Report, Summary for Policymakers; Contribution of Working Groups I, II and III to the Sixth Assessment Report of the Intergovernmental Panel on Climate Change; Core Writing Team, Lee, H., Romero, J., Eds.; IPCC: Geneva, Switzerland, 2023; pp. 1–34. [Google Scholar]
- European Environment Agency. Trends and Projections in Europe 2023; European Environment Agency: Copenhagen, Denmark, 2023. [Google Scholar]
- Kozyra, J.; Król-Badziak, A.; Żyłowski, T.; Koza, P.; Pudełko, R. Zmiany klimatu i ich wpływ na gospodarkę wodną i rolnictwo. In Konferencja Adaptacja Gospodarki Wodnej w Rolnictwie do Zmieniającego się Klimatu; IUNG-PIB: Puławy, Poland, 2020. [Google Scholar]
- Tabari, H.; Willems, P. Sustainable development substantially reduces the risk of future drought impacts. Commun. Earth Environ. 2023, 4, 180. [Google Scholar] [CrossRef]
- Potts, S.G.; Biesmeijer, J.C.; Kremen, C.; Neumann, P.; Schweiger, O.; Kunin, W.E. Global pollinator declines: Trends, impacts and drivers. Trends Ecol. Evol. 2010, 25, 345–353. [Google Scholar] [CrossRef] [PubMed]
- Ollerton, J.; Winfree, R.; Tarrant, S. How many flowering plants are pollinated by animals? Oikos 2011, 120, 321–326. [Google Scholar] [CrossRef]
- Burkle, L.A.; Runyon, J.B. Drought and leaf herbivory influence floral volatiles and pollinator attraction. Glob. Change Biol. 2016, 22, 1644–1654. [Google Scholar] [CrossRef] [PubMed]
- Descamps, C.; Quinet, M.; Baijot, A.; Jacquemart, A. Temperature and water stress affect plant–pollinator interactions in Borago officinalis (Boraginaceae). Ecol. Evol. 2018, 8, 3443–3456. [Google Scholar] [CrossRef]
- Cohen, I.; Zandalinas, S.I.; Huck, C.; Fritschi, F.B.; Mittler, R. Meta-analysis of drought and heat stress combination impact on crop yield and yield components. Physiol. Plant. 2021, 171, 66–76. [Google Scholar] [CrossRef] [PubMed]
- Burkle, L.; Irwin, R. Nectar sugar limits larval growth of solitary bees (Hymenoptera: Megachilidae). Environ. Entomol. 2009, 38, 1293–1300. [Google Scholar] [CrossRef]
- Somme, L.; Vanderplanck, M.; Michez, D.; Lombaerde, I.; Moerman, R.; Wathelet, B.; Wattiez, R.; Lognay, G.; Jacquemart, A.-L. Pollen and nectar quality drive the major and minor floral choices of bumble bees. Apidologie 2015, 46, 92–106. [Google Scholar] [CrossRef]
- Petanidou, T.; Smets, E. Does temperature stress induce nectar secretion in Mediterranean plants? New Phytol. 1996, 133, 513–518. [Google Scholar] [CrossRef]
- Waser, N.M.; Price, M.V. Drought, pollen and nectar availability, and pollination success. Ecology 2016, 97, 1400–1409. [Google Scholar] [CrossRef]
- Liu, Y.; Dunker, S.; Durka, W.; Dominik, C.; Heuschele, J.M.; Honchar, H.; Hoffmann, P.; Musche, M.; Paxton, R.J.; Settele, J. Eco-evolutionary processes shaping floral nectar sugar composition. Sci. Rep. 2024, 14, 13856. [Google Scholar] [CrossRef] [PubMed]
- Borghi, M.; Perez de Souza, L.; Yoshida, T.; Fernie, A.R. Flowers and climate change: A metabolic perspective. New Phytol. 2019, 224, 1425–1441. [Google Scholar] [CrossRef] [PubMed]
- Pacini, E.; Nepi, M. Nectar production and presentation. In Nectaries and Nectar; Springer: Berlin/Heidelberg, Germany, 2007; pp. 167–214. [Google Scholar]
- Descamps, C.; Marée, S.; Hugon, S.; Quinet, M.; Jacquemart, A. Species-specific responses to combined water stress and increasing temperatures in two bee-pollinated congeners (Echium, Boraginaceae). Ecol. Evol. 2020, 10, 6549–6561. [Google Scholar] [CrossRef]
- Descamps, C.; Quinet, M.; Jacquemart, A.-L. The effects of drought on plant–pollinator interactions: What to expect? Environ. Exp. Bot. 2021, 182, 104297. [Google Scholar] [CrossRef]
- Takkis, K.; Tscheulin, T.; Petanidou, T. Differential effects of climate warming on the nectar secretion of early-and late-flowering Mediterranean plants. Front. Plant Sci. 2018, 9, 874. [Google Scholar] [CrossRef]
- Roth, N.; Kimberley, A.; Guasconi, D.; Hugelius, G.; Cousins, S.A. Floral resources in Swedish grasslands remain relatively stable under an experimental drought and are enhanced by soil amendments if regularly mown. Ecol. Solut. Evid. 2023, 4, e12231. [Google Scholar] [CrossRef]
- Akter, A.; Klečka, J. Water stress and nitrogen supply affect floral traits and pollination of the white mustard, Sinapis alba (Brassicaceae). PeerJ 2022, 10, e13009. [Google Scholar] [CrossRef]
- Secchi, M.A.; Fernandez, J.A.; Stamm, M.J.; Durrett, T.; Prasad, P.V.; Messina, C.D.; Ciampitti, I.A. Effects of heat and drought on canola (Brassica napus L.) yield, oil, and protein: A meta-analysis. Field Crops Res. 2023, 293, 108848. [Google Scholar] [CrossRef]
- Badora, D.; Borek, R.; Doroszewski, A.; Jończyk, K.; Koza, P.; Kozyra, J.; Nowocień, E.; Skowron, P.; Smagacz, J.; Wach, D.; et al. Gospodarka Wodna w Rolnictwie Jako Element Adaptacji do Zmian Klimatu; Instytut Uprawy, Nawożenia i Gleboznawstwa Państwowy Instytut Badawczy; Studia i Raporty IUNG-PIB; Dział Upowszechniania i Wydawnictw IUNG PIB w Puławach: Puławy, Poland, 2023; Volume 71, ISBN 978-83-7562-403-8. [Google Scholar]
- Gamage, A.; Gangahagedara, R.; Subasinghe, S.; Gamage, J.; Guruge, C.; Senaratne, S.; Randika, T.; Rathnayake, C.; Hameed, Z.; Madhujith, T. Advancing sustainability: The impact of emerging technologies in agriculture. Curr. Plant Biol. 2024, 40, 100420. [Google Scholar] [CrossRef]
- Srisawat, T.; Tarasuk, T.; Kaosuwan, S.; Chimpud, W.; Chumkaew, P.; Samala, S.; Sukolrat, A. Natural farming negatively influences the growth of Sangyod Muang Phatthalung rice (Oryza sativa L.) but not its grain production or quality in preliminary comparison to conventional farming. Acta Agrobot. 2024, 77, 185310. [Google Scholar] [CrossRef]
- Jayaraman, S.; Dang, Y.P.; Naorem, A.; Page, K.L.; Dalal, R.C. Conservation agriculture as a system to enhance ecosystem services. Agriculture 2021, 11, 718. [Google Scholar] [CrossRef]
- Bożek, M.; Denisow, B.; Strzałkowska-Abramek, M.; Chrzanowska, E.; Winiarczyk, K. Non-forest woody vegetation: A critical resource for pollinators in agricultural landscapes—A review. Sustainability 2023, 15, 8751. [Google Scholar] [CrossRef]
- Jachuła, J.; Denisow, B.; Wrzesień, M. Habitat heterogeneity helps to mitigate pollinator nectar sugar deficit and discontinuity in an agricultural landscape. Sci. Total Environ. 2021, 782, 146909. [Google Scholar] [CrossRef]
- Brunet, J.; Fragoso, F.P. What Are the Main Reasons for the Worldwide Decline in Pollinator Populations? CABI Reviews: Wallingford, UK, 2024. [Google Scholar]
- Aizen, M.A.; Harder, L.D. The global stock of domesticated honey bees is growing slower than agricultural demand for pollination. Curr. Biol. 2009, 19, 915–918. [Google Scholar] [CrossRef]
- Gallai, N.; Salles, J.-M.; Settele, J.; Vaissière, B.E. Economic valuation of the vulnerability of world agriculture confronted with pollinator decline. Ecol. Econ. 2009, 68, 810–821. [Google Scholar] [CrossRef]
- Garrity, D.P.; Akinnifesi, F.K.; Ajayi, O.C.; Weldesemayat, S.G.; Mowo, J.G.; Kalinganire, A.; Larwanou, M.; Bayala, J. Evergreen Agriculture: A robust approach to sustainable food security in Africa. Food Secur. 2010, 2, 197–214. [Google Scholar] [CrossRef]
- Semeraro, T.; Scarano, A.; Leggieri, A.; Calisi, A.; De Caroli, M. Impact of climate change on agroecosystems and potential adaptation strategies. Land 2023, 12, 1117. [Google Scholar] [CrossRef]
- Mitrović, P.M.; Stamenković, O.S.; Banković-Ilić, I.; Djalović, I.G.; Nježić, Z.B.; Farooq, M.; Siddique, K.H.; Veljković, V.B. White mustard (Sinapis alba L.) oil in biodiesel production: A review. Front. Plant Sci. 2020, 11, 299. [Google Scholar] [CrossRef]
- Jalas, J.; Suominen, J. Atlas Florae Europaeae: Volume 3: Distribution of Vascular Plants in Europe; Cambridge University Press: Cambridge, UK, 1988; Volume 3, ISBN 0-521-34272-4. [Google Scholar]
- Butenko, S.; Melnyk, A.; Melnyk, T.; Jia, P.; Kolosok, V. Influence of Growth Regulators with Anti–Stress Activity on Productivity Parameters of Sinapis alba L. J. Ecol. Eng. 2022, 23, 128–135. [Google Scholar] [CrossRef]
- Katepa-Mupondwa, F.; Gugel, R.; Raney, J. Genetic diversity for agronomic, morphological and seed quality traits in Sinapis alba L. (yellow mustard). Can. J. Plant Sci. 2006, 86, 1015–1025. [Google Scholar] [CrossRef]
- Kisielewska, W.; Harasimowicz-Hermann, G. Sowing value of white mustard (Sinapis alba L.) seeds collected from plants sown in different times. Rośliny Oleiste-Oilseed Crops 2006, 27, 223–230. [Google Scholar]
- Mena, G.T.; Gospodarek, J. White mustard, Sweet alyssum, and Coriander as insectary plants in agricultural systems: Impacts on ecosystem services and yield of crops. Agriculture 2024, 14, 550. [Google Scholar] [CrossRef]
- Jaime, R.; Alcantara, J.M.; Manzaneda, A.J.; Rey, P.J. Climate change decreases suitable areas for rapeseed cultivation in Europe but provides new opportunities for white mustard as an alternative oilseed for biofuel production. PLoS ONE 2018, 13, e0207124. [Google Scholar] [CrossRef] [PubMed]
- Kos, B.; Greman, H.; Lestan, D. Phytoextraction of lead, zinc and cadmium from soil by selected plants. Plant Soil Environ. 2003, 49, 548–553. [Google Scholar] [CrossRef]
- Masierowska, M.L. Floral nectaries and nectar production in brown mustard (Brassica juncea) and white mustard (Sinapis alba) (Brassicaceae). Plant Syst. Evol. 2003, 238, 97–107. [Google Scholar] [CrossRef]
- Farkas, Á.; Zajácz, E. Nectar production for the Hungarian honey industry. Eur. J. Plant Sci. Biotechnol. 2007, 1, 125–151. [Google Scholar]
- Masierowska, M.; Piętka, T. Variability in nectar and pollen production in flowers of double-low lines of white mustard (Sinapis alba L.) and their attractiveness to honey bees. Acta Sci. Pol. Hortorum Cultus 2014, 13, 197–209. [Google Scholar]
- Flacher, F.; Raynaud, X.; Hansart, A.; Geslin, B.; Motard, E.; Verstraet, S.; Bataille, M.; Dajoz, I. Below-ground competition alters attractiveness of an insect-pollinated plant to pollinators. AoB Plants 2020, 12, plaa022. [Google Scholar] [CrossRef]
- Kołtowski, Z.; Miśkiewicz, I. Wielki Atlas Roślin miododajnych; Przedsiębiorstwo Wydawnicze Rzeczpospolita: Warsaw, Poland, 2006; ISBN 83-60192-13-8. [Google Scholar]
- Dorsainvil, F.; Dürr, C.; Justes, E.; Carrera, A. Characterisation and modelling of white mustard (Sinapis alba L.) emergence under several sowing conditions. Eur. J. Agron. 2005, 23, 146–158. [Google Scholar] [CrossRef]
- Francesca, V.; Osvaldo, F.; Stefano, P.; Paola, R.P. Soil moisture measurements: Comparison of instrumentation performances. J. Irrig. Drain. Eng. 2010, 136, 81–89. [Google Scholar] [CrossRef]
- Dmitruk, M.; Denisow, B.; Chrzanowska, E.; Dąbrowska, A.; Bożek, M. Comparison of nectar and pollen resources in various Tilia species. A case study from southern Poland. Trees 2024, 38, 953–967. [Google Scholar] [CrossRef]
- Masierowska, M. Floral Display and Reproductive System in Brown Mustard Brassica juncea (L.) Czern. et Coss. and White Mustard Sinapis alba; Brassicaceae; Università di Scienze di Lublino: Lubin, Poland, 2012; 366p. [Google Scholar]
- Jabłonski, B. Notes on the method to investigate nectar secretion rate in flowers. J. Apic. Sci. 2002, 46. [Google Scholar]
- Dmitruk, M.; Strzałkowska-Abramek, M.; Bożek, M.; Denisow, B. Plants enhancing urban pollinators: Nectar rather than pollen attracts pollinators of Cotoneaster species. Urban For. Urban Green. 2022, 74, 127651. [Google Scholar] [CrossRef]
- Jabłońska, K.; Kwiatkowska-Falińska, A.; Czernecki, B.; Walawender, J.P. Changes in Spring and Summer Phenology in Poland—Responses of Selected Plant Species to Air Temperature Variations. Pol. J. Ecol. 2015, 63, 311–319. [Google Scholar] [CrossRef]
- Ashraf, M.; Mehmood, S. Response of four Brassica species to drought stress. Environ. Exp. Bot. 1990, 30, 93–100. [Google Scholar] [CrossRef]
- Fletcher, R.S.; Mullen, J.L.; Heiliger, A.; McKay, J.K. QTL analysis of root morphology, flowering time, and yield reveals trade-offs in response to drought in Brassica napus. J. Exp. Bot. 2015, 66, 245–256. [Google Scholar] [CrossRef]
- Retuerto, R.; Woodward, F.I. Compensatory responses in growth and fecundity traits of Sinapis alba L. following release from wind and density stress. Int. J. Plant Sci. 2001, 162, 171–179. [Google Scholar] [CrossRef]
- Cho, L.-H.; Pasriga, R.; Yoon, J.; Jeon, J.-S.; An, G. Roles of sugars in controlling flowering time. J. Plant Biol. 2018, 61, 121–130. [Google Scholar] [CrossRef]
- Lemoine, R.; Camera, S.L.; Atanassova, R.; Dédaldéchamp, F.; Allario, T.; Pourtau, N.; Bonnemain, J.-L.; Laloi, M.; Coutos-Thévenot, P.; Maurousset, L. Source-to-sink transport of sugar and regulation by environmental factors. Front. Plant Sci. 2013, 4, 272. [Google Scholar] [CrossRef]
- Franks, S.J.; Weis, A.E. Climate change alters reproductive isolation and potential gene flow in an annual plant. Evol. Appl. 2009, 2, 481–488. [Google Scholar] [CrossRef]
- Galen, C.; Sherry, R.A.; Carroll, A.B. Are flowers physiological sinks or faucets? Costs and correlates of water use by flowers of Polemonium viscosum. Oecologia 1999, 118, 461–470. [Google Scholar] [CrossRef]
- Kazan, K.; Lyons, R. The link between flowering time and stress tolerance. J. Exp. Bot. 2016, 67, 47–60. [Google Scholar] [CrossRef] [PubMed]
- Lawlor, D.W. Photosynthesis, productivity and environment. J. Exp. Bot. 1995, 46, 1449–1461. [Google Scholar] [CrossRef]
- Gan, Y.; Angadi, S.; Cutforth, H.; Potts, D.; Angadi, V.; McDonald, C. Canola and mustard response to short periods of temperature and water stress at different developmental stages. Can. J. Plant Sci. 2004, 84, 697–704. [Google Scholar] [CrossRef]
- Muhl, Q.E.; du Toit, E.S.; Steyn, J.M.; Apostolides, Z. Bud development, flowering and fruit set of Moringa oleifera Lam. (Horseradish Tree) as affected by various irrigation levels. J. Agric. Rural Dev. Trop. Subtrop. JARTS 2013, 114, 79–87. [Google Scholar]
- Glenny, W.R.; Runyon, J.B.; Burkle, L.A. Drought and increased CO2 alter floral visual and olfactory traits with context-dependent effects on pollinator visitation. N. Phytol. 2018, 220, 785–798. [Google Scholar] [CrossRef]
- Carroll, A.B.; Pallardy, S.G.; Galen, C. Drought stress, plant water status, and floral trait expression in fireweed, Epilobium angustifolium (Onagraceae). Am. J. Bot. 2001, 88, 438–446. [Google Scholar] [CrossRef]
- Bernardello, G. A systematic survey of floral nectaries. In Nectaries and Nectar; Springer: Berlin/Heidelberg, Germany, 2007; pp. 19–128. [Google Scholar]
- Thom, M.D.; Eberle, C.A.; Forcella, F.; Gesch, R.; Weyers, S.; Lundgren, J.G. Nectar production in oilseeds: Food for pollinators in an agricultural landscape. Crop Sci. 2016, 56, 727–739. [Google Scholar] [CrossRef]
- Markiewicz, J.; Ogórek, S. Gospodarcze Koszty Suszy dla Polskiego Rolnictwa; Working paper/Polski Instytut Ekonomiczny; Polski Instytut Ekonomiczny: Warsaw, Poland, 2022; ISBN 978-83-66698-96-3. [Google Scholar]
- Corbet, S.A. Bee visits and the nectar of Echium vulgare L. and Sinapis alba L. Ecol. Entomol. 1978, 3, 25–37. [Google Scholar]
- Hegland, S.J.; Nielsen, A.; Lázaro, A.; Bjerknes, A.; Totland, Ø. How does climate warming affect plant-pollinator interactions? Ecol. Lett. 2009, 12, 184–195. [Google Scholar] [CrossRef]
- Rering, C.C.; Franco, J.G.; Yeater, K.M.; Mallinger, R.E. Drought stress alters floral volatiles and reduces floral rewards, pollinator activity, and seed set in a global plant. Ecosphere 2020, 11, e03254. [Google Scholar] [CrossRef]
- Bie, M.; Song, K.; Dong, H.; Zhao, W.; Lin, H.; Shi, D.; Liu, D. Advancing Sustainable Agriculture Through Bumblebee Pollination: Bibliometric Insights and Future Directions. Sustainability 2025, 17, 2177. [Google Scholar] [CrossRef]
- Zhang, X.; Lu, G.; Long, W.; Zou, X.; Li, F.; Nishio, T. Recent progress in drought and salt tolerance studies in Brassica crops. Breed. Sci. 2014, 64, 60–73. [Google Scholar] [CrossRef]
Disclaimer/Publisher’s Note: The statements, opinions and data contained in all publications are solely those of the individual author(s) and contributor(s) and not of MDPI and/or the editor(s). MDPI and/or the editor(s) disclaim responsibility for any injury to people or property resulting from any ideas, methods, instructions or products referred to in the content. |
© 2025 by the authors. Licensee MDPI, Basel, Switzerland. This article is an open access article distributed under the terms and conditions of the Creative Commons Attribution (CC BY) license (https://creativecommons.org/licenses/by/4.0/).