
Spatiotemporal Evolution and Influencing Factors of Population Aging in the Triangle of Central China at Multiple Scales


Abstract
1. Introduction
2. Data Sources and Research Methodology
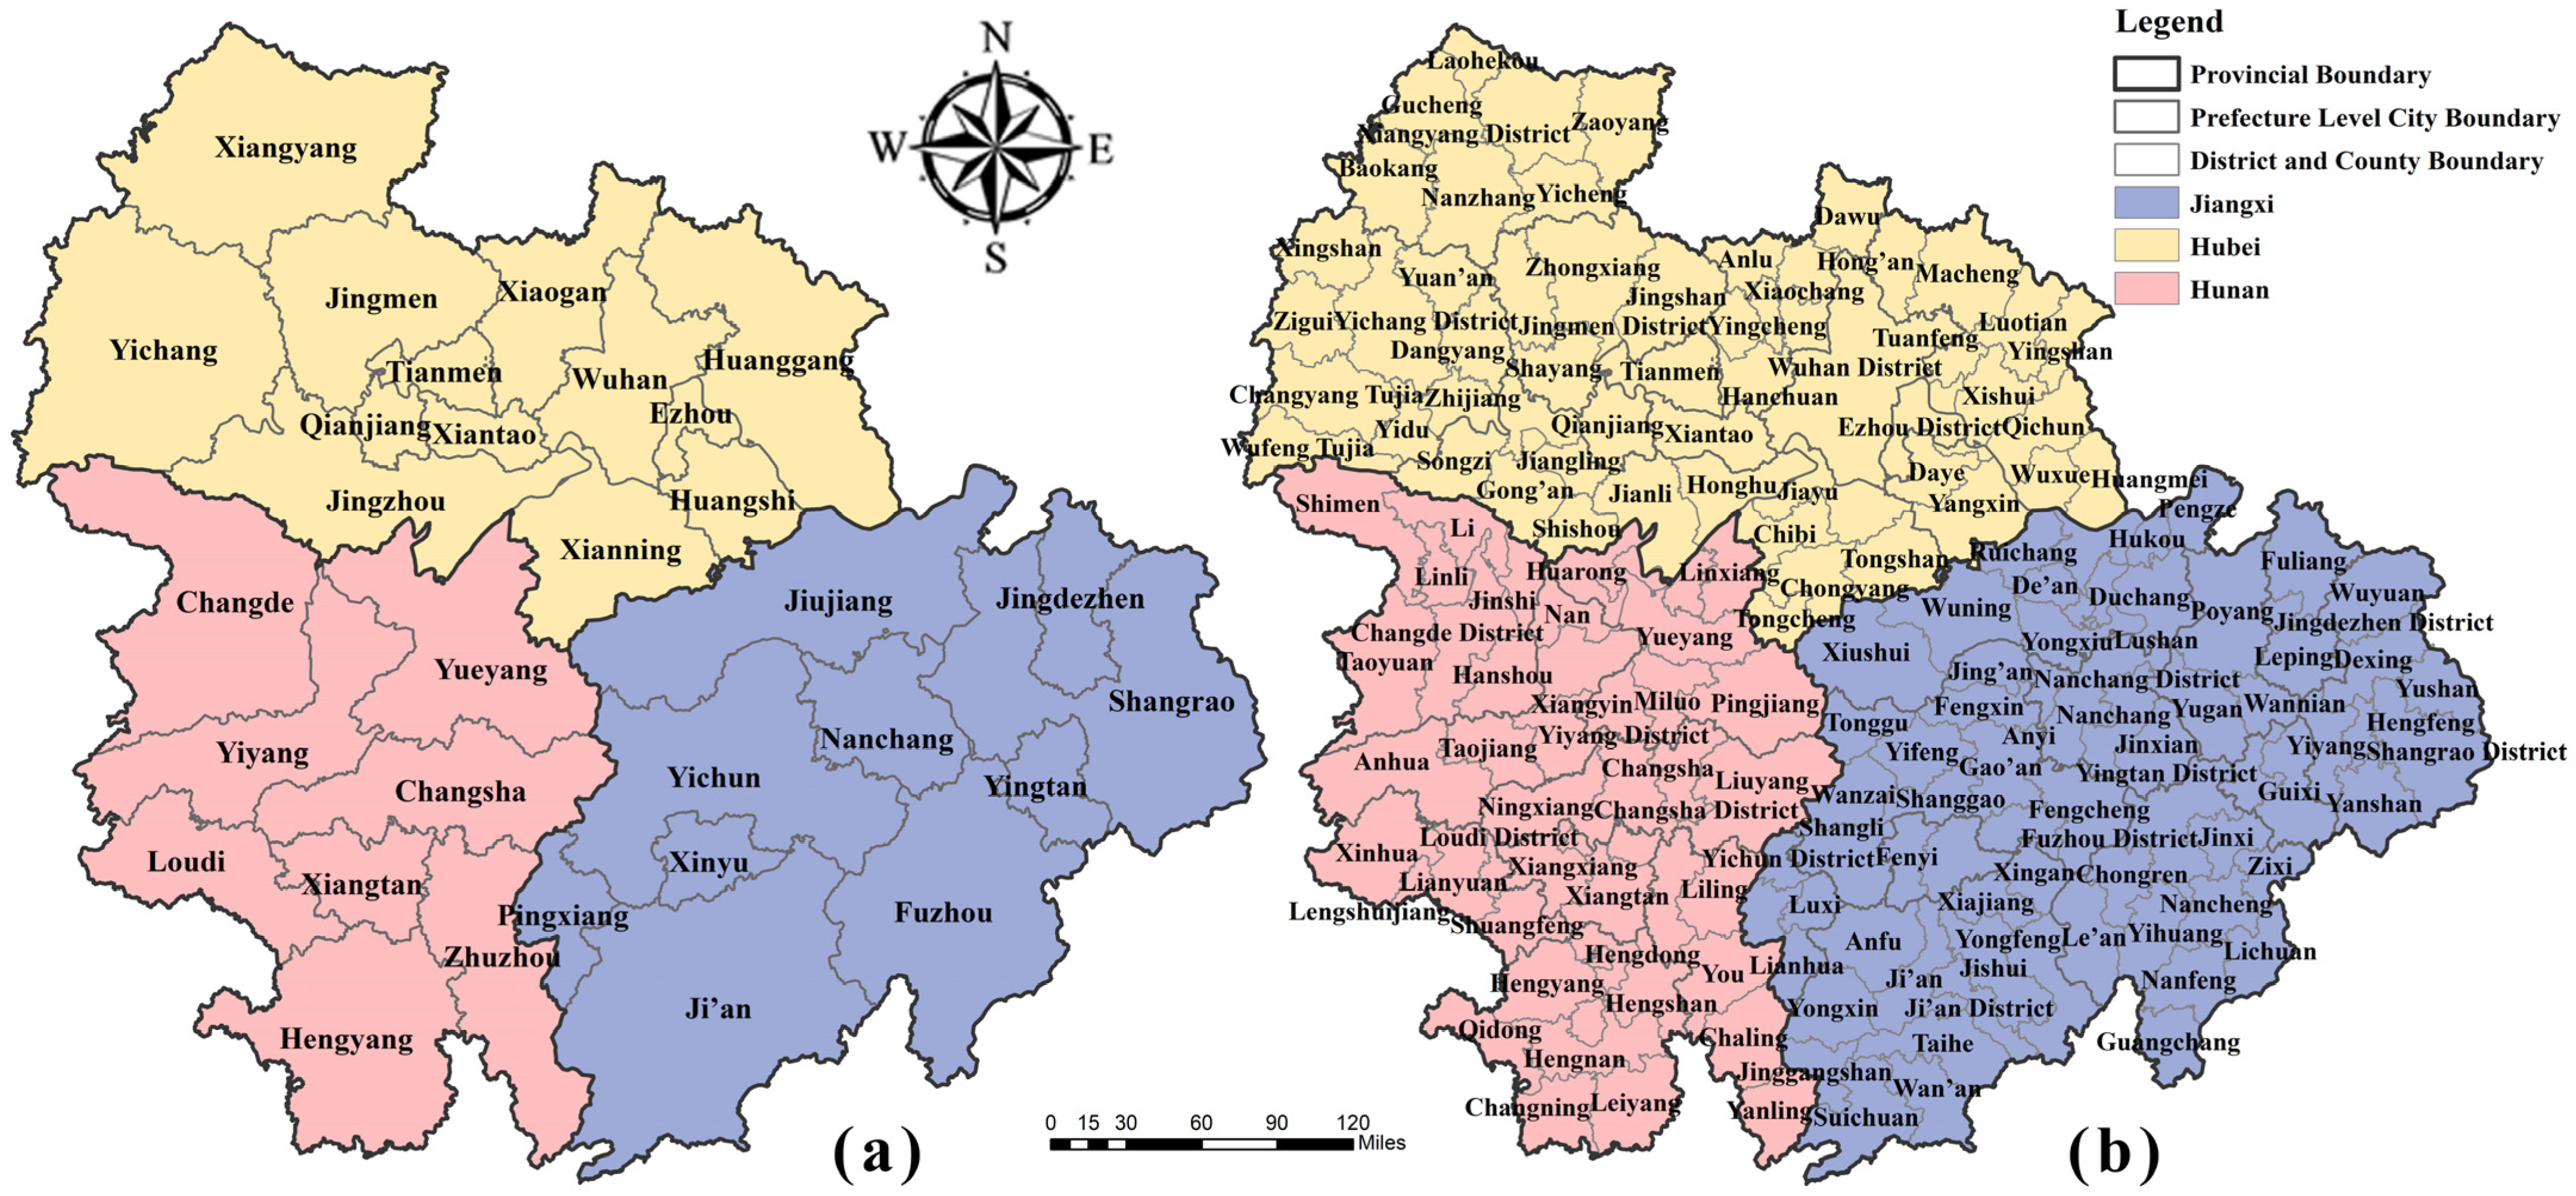
2.1. Overview of the Study Area
2.2. Data Sources
- (1)
- Vector data of regional administrative boundaries. The data were obtained from the National Administrative Division Information Query Platform of the People’s Republic of China (http://xzqh.mca.gov.cn/map/, accessed on 27 June 2020), using the 2020 administrative divisions. To address frequent adjustments at the district and county levels, the 2000 and 2010 statistical and geographic data were merged based on the 2020 administrative boundaries. This approach ensures data consistency and reliability and facilitates comparison across datasets. In this study, to present city names more clearly on the map, we simplified the names of prefecture-level cities and autonomous prefectures. For example, “Wuhan City” was simplified to “Wuhan,” “Nanchang County” to “Nanchang,” and “Changyang Tujia Autonomous County” to “Changyang Tujia.” This simplification helps to highlight key information on the map and allows readers to more intuitively grasp the spatial distribution of cities.
- (2)
- Demographic data. The data were sourced from the 5th (2000), 6th (2010), and 7th (2020) national population censuses published by the National Bureau of Statistics. Data were primarily collected for 31 prefecture-level cities and 173 districts and counties in the Triangle of Central China, covering both the permanent population and the population aged 65 and over.
- (3)
- Socioeconomic data. The main sources include the 2001, 2011, and 2021 statistical yearbooks of Hunan, Hubei, and Jiangxi provinces, as well as those of the 31 prefecture-level cities. To obtain a more comprehensive picture of regional economic and social development, the study also referred to the China Regional Economic Statistical Yearbook, China County Statistical Yearbook, and China City Statistical Yearbook.
- (4)
- Selection of Influencing Factor Indicators
2.3. Research Methods
- (1)
- Definition of Population Aging
- (2)
- Spatial Autocorrelation
- (3)
- Geographic detector
- (4)
- Geographically Weighted Regression
3. Spatiotemporal Characteristics of Population Aging in the Triangle of Central China
3.1. Analysis of the Spatiotemporal Evolution of Aging Levels in the Triangle of Central China
3.1.1. Prefecture-Level Scale
- (1)
- Analysis of Aging Levels
- (2)
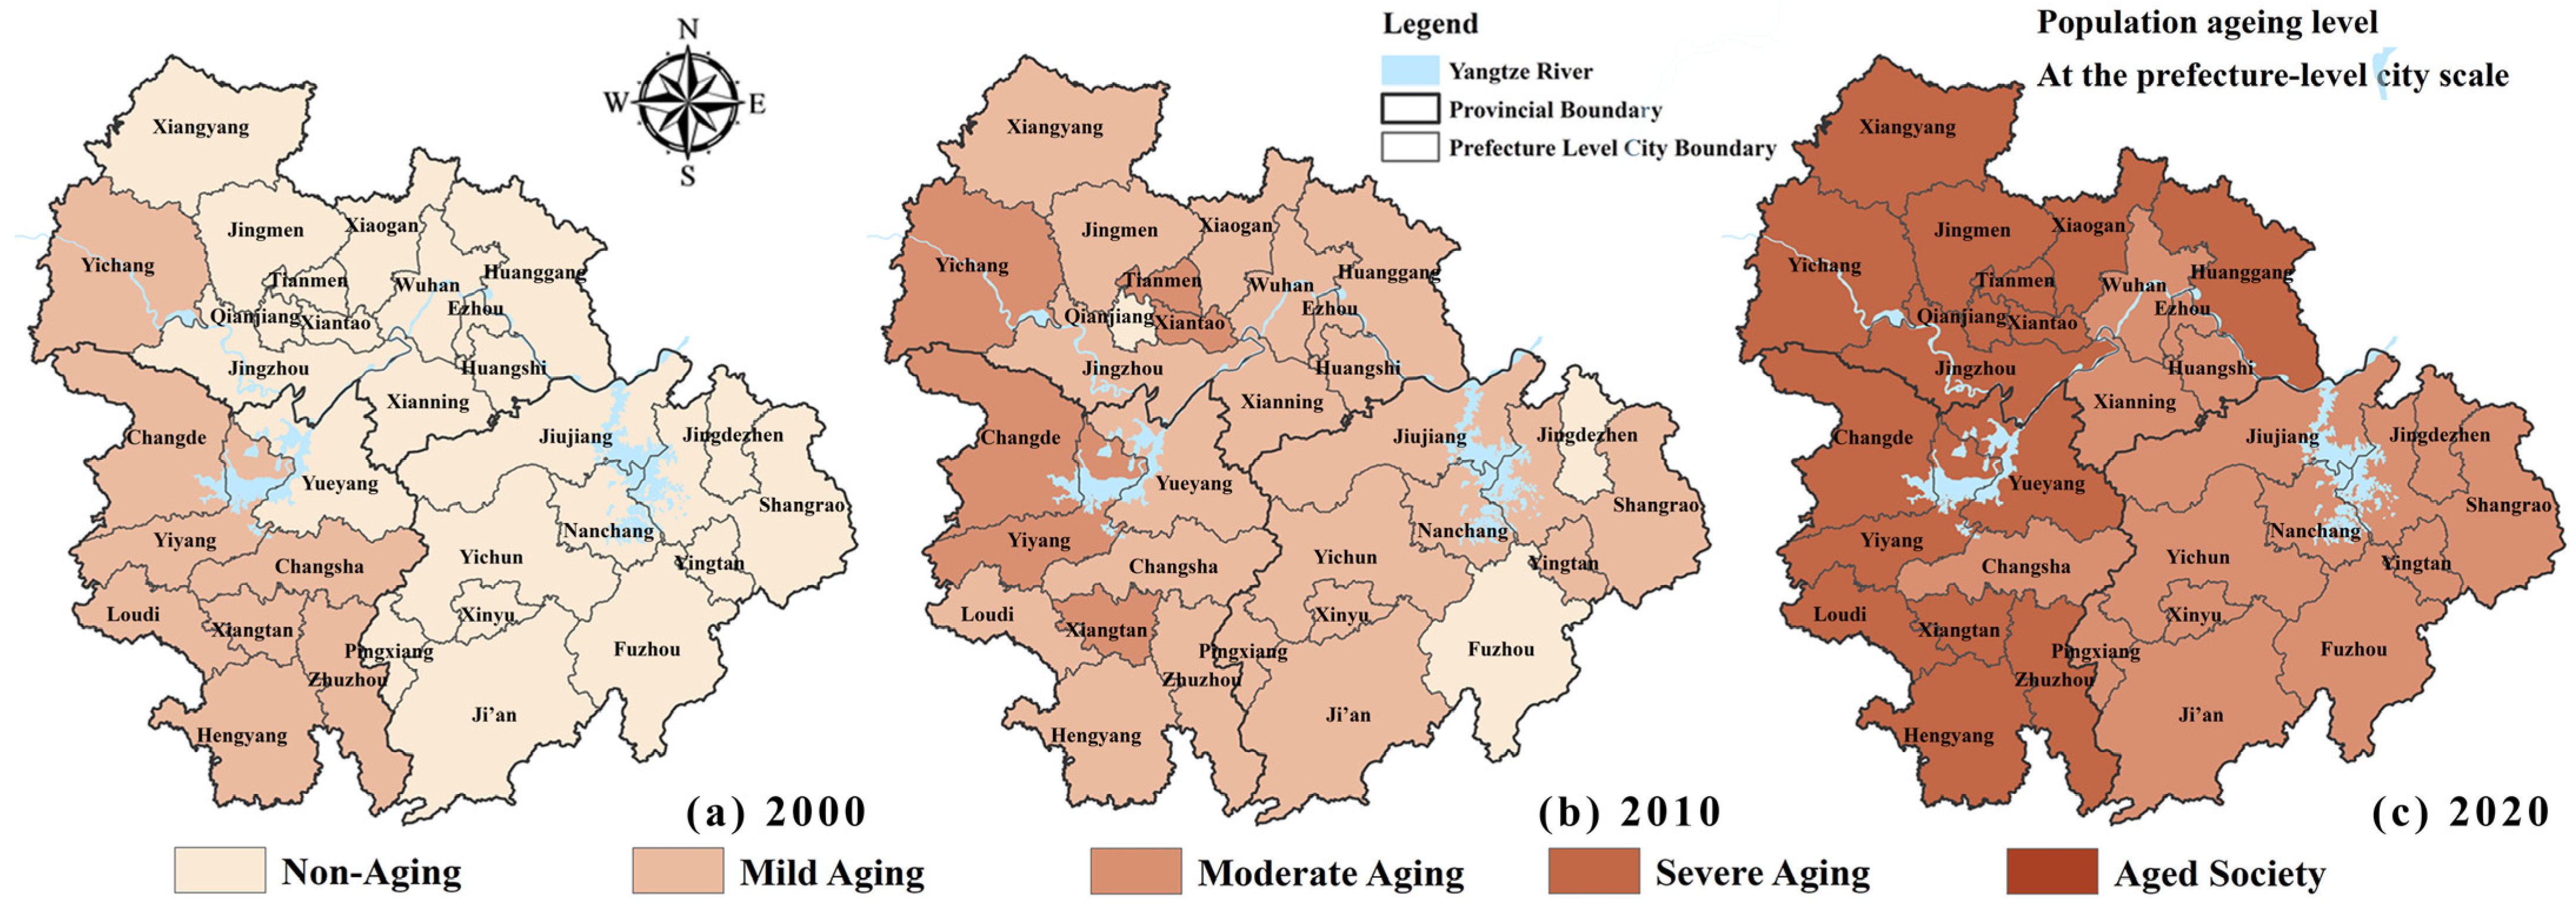
- Spatiotemporal Distribution of Aging Levels
3.1.2. District and County Level
- (1)
- Analysis of Aging Levels
- (2)
- Spatiotemporal Distribution of Aging Levels
3.2. Spatial Differentiation and Temporal Variation of the Elderly Population in the Triangle of Central China
3.2.1. Global Spatial Clustering Characteristics of the Aging Rate
- (1)
- Prefecture-level Scale
- (2)
- District and county level Scale
3.2.2. Local Spatial Clustering Characteristics of the Aging Rate
- (1)
- Prefecture-level Scale (Figure 5A)
- (2)
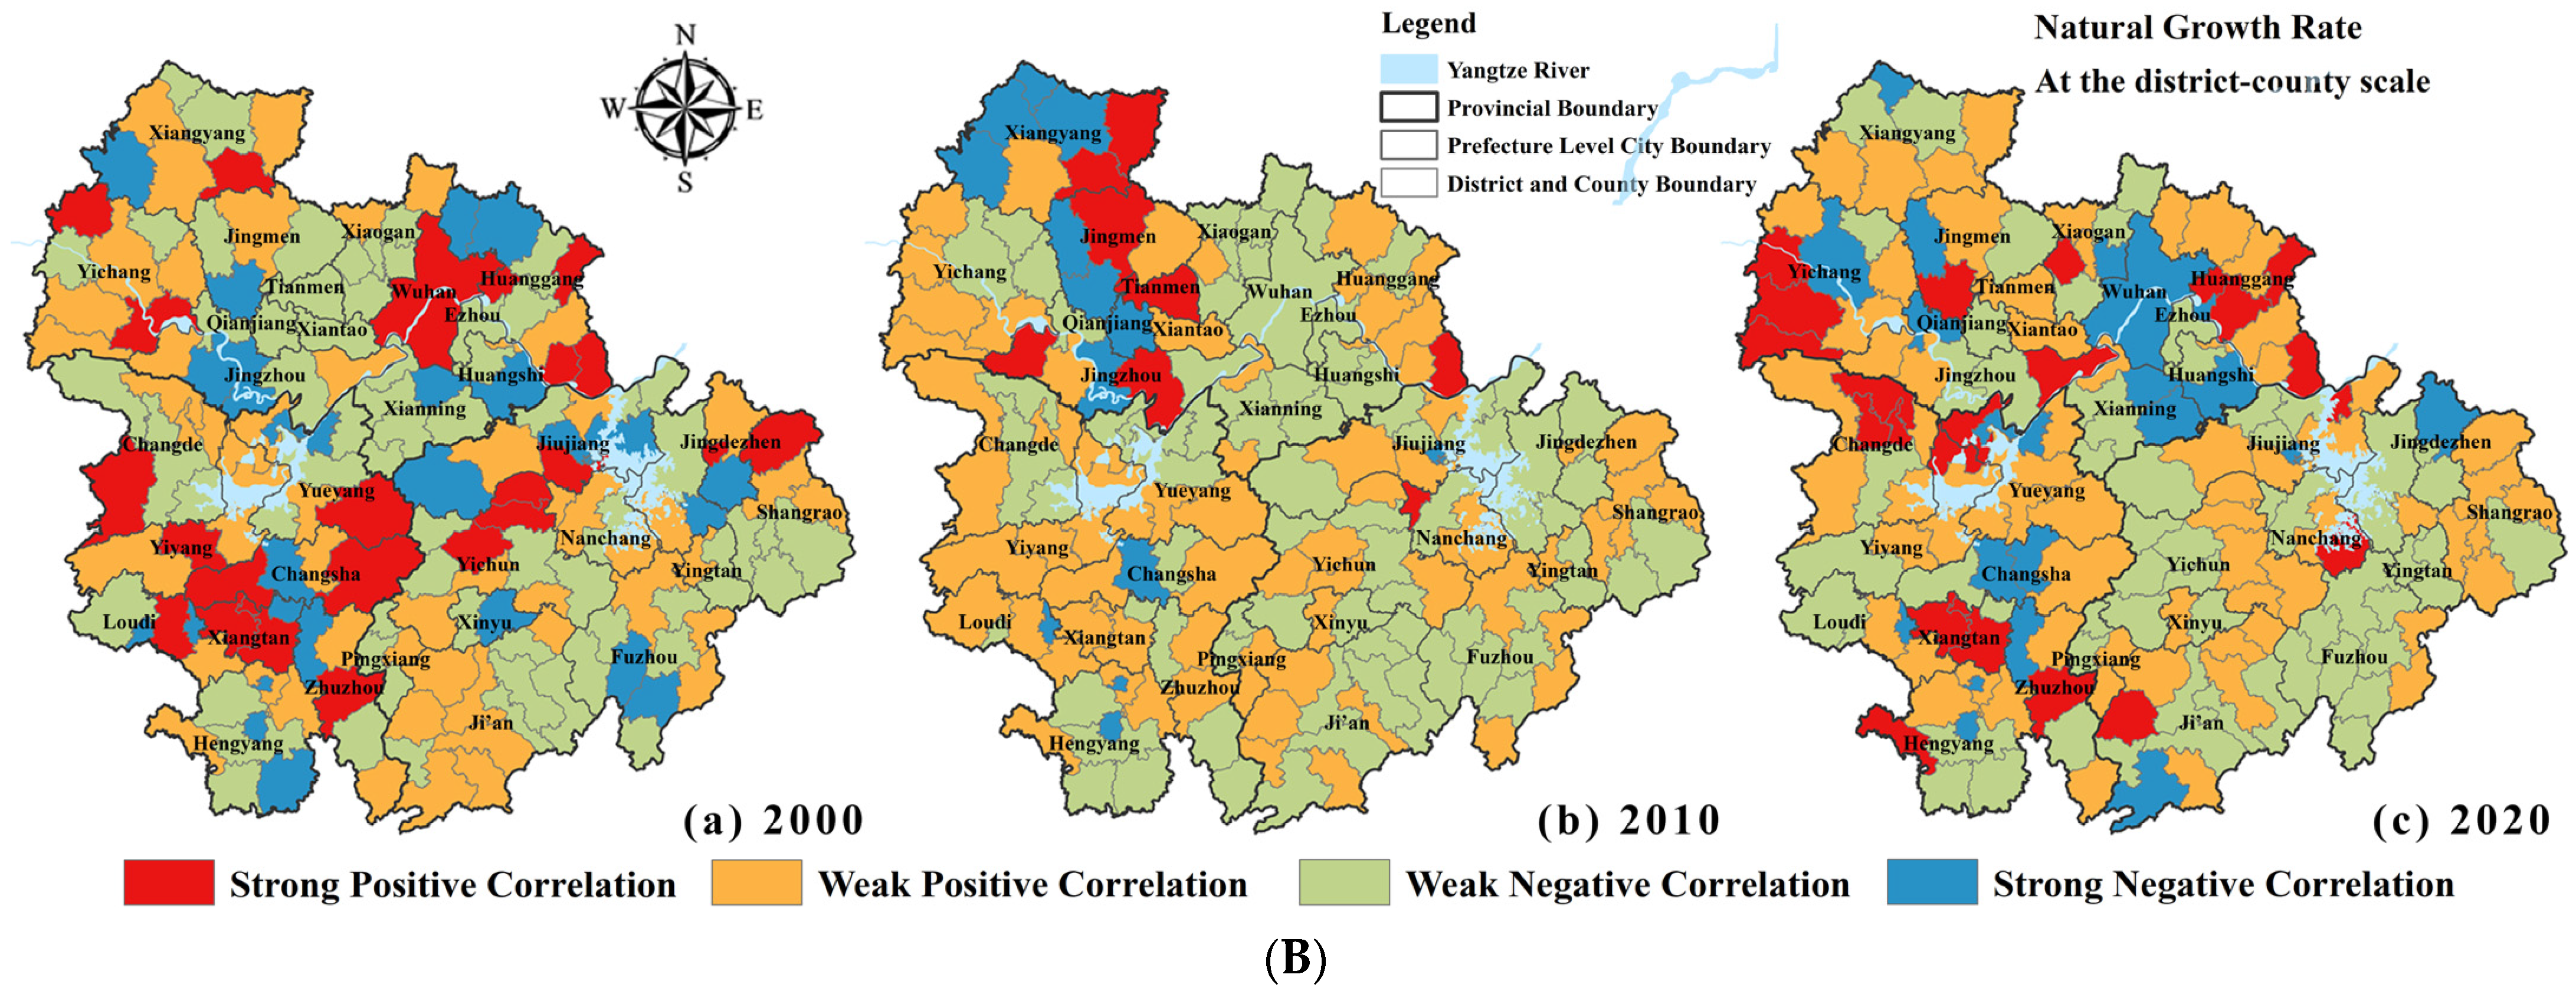
- District and county level Scale (Figure 5B)
4. Analysis of Influencing Factors
4.1. Detection Results of Univariate Influencing Factors of Population Aging
- (1)
- Comparative Influence of Demographic Factors
- (2)
- Impact of Economic Structure on Population Aging
- (3)
- Comparative Analysis of the Impact of Social Resources and Urbanization Levels
4.2. Geographically Weighted Regression Analysis of Comprehensive Influencing Factors on Population Aging (Spatial Heterogeneity Analysis–GWR)
4.2.1. Natural Population Growth Rate and Population Aging
- (1)
- At the prefecture level (Figure 6A)
- (2)
- At the district and county level (Figure 6B)
- (3)
- Comparative Insights and Implications
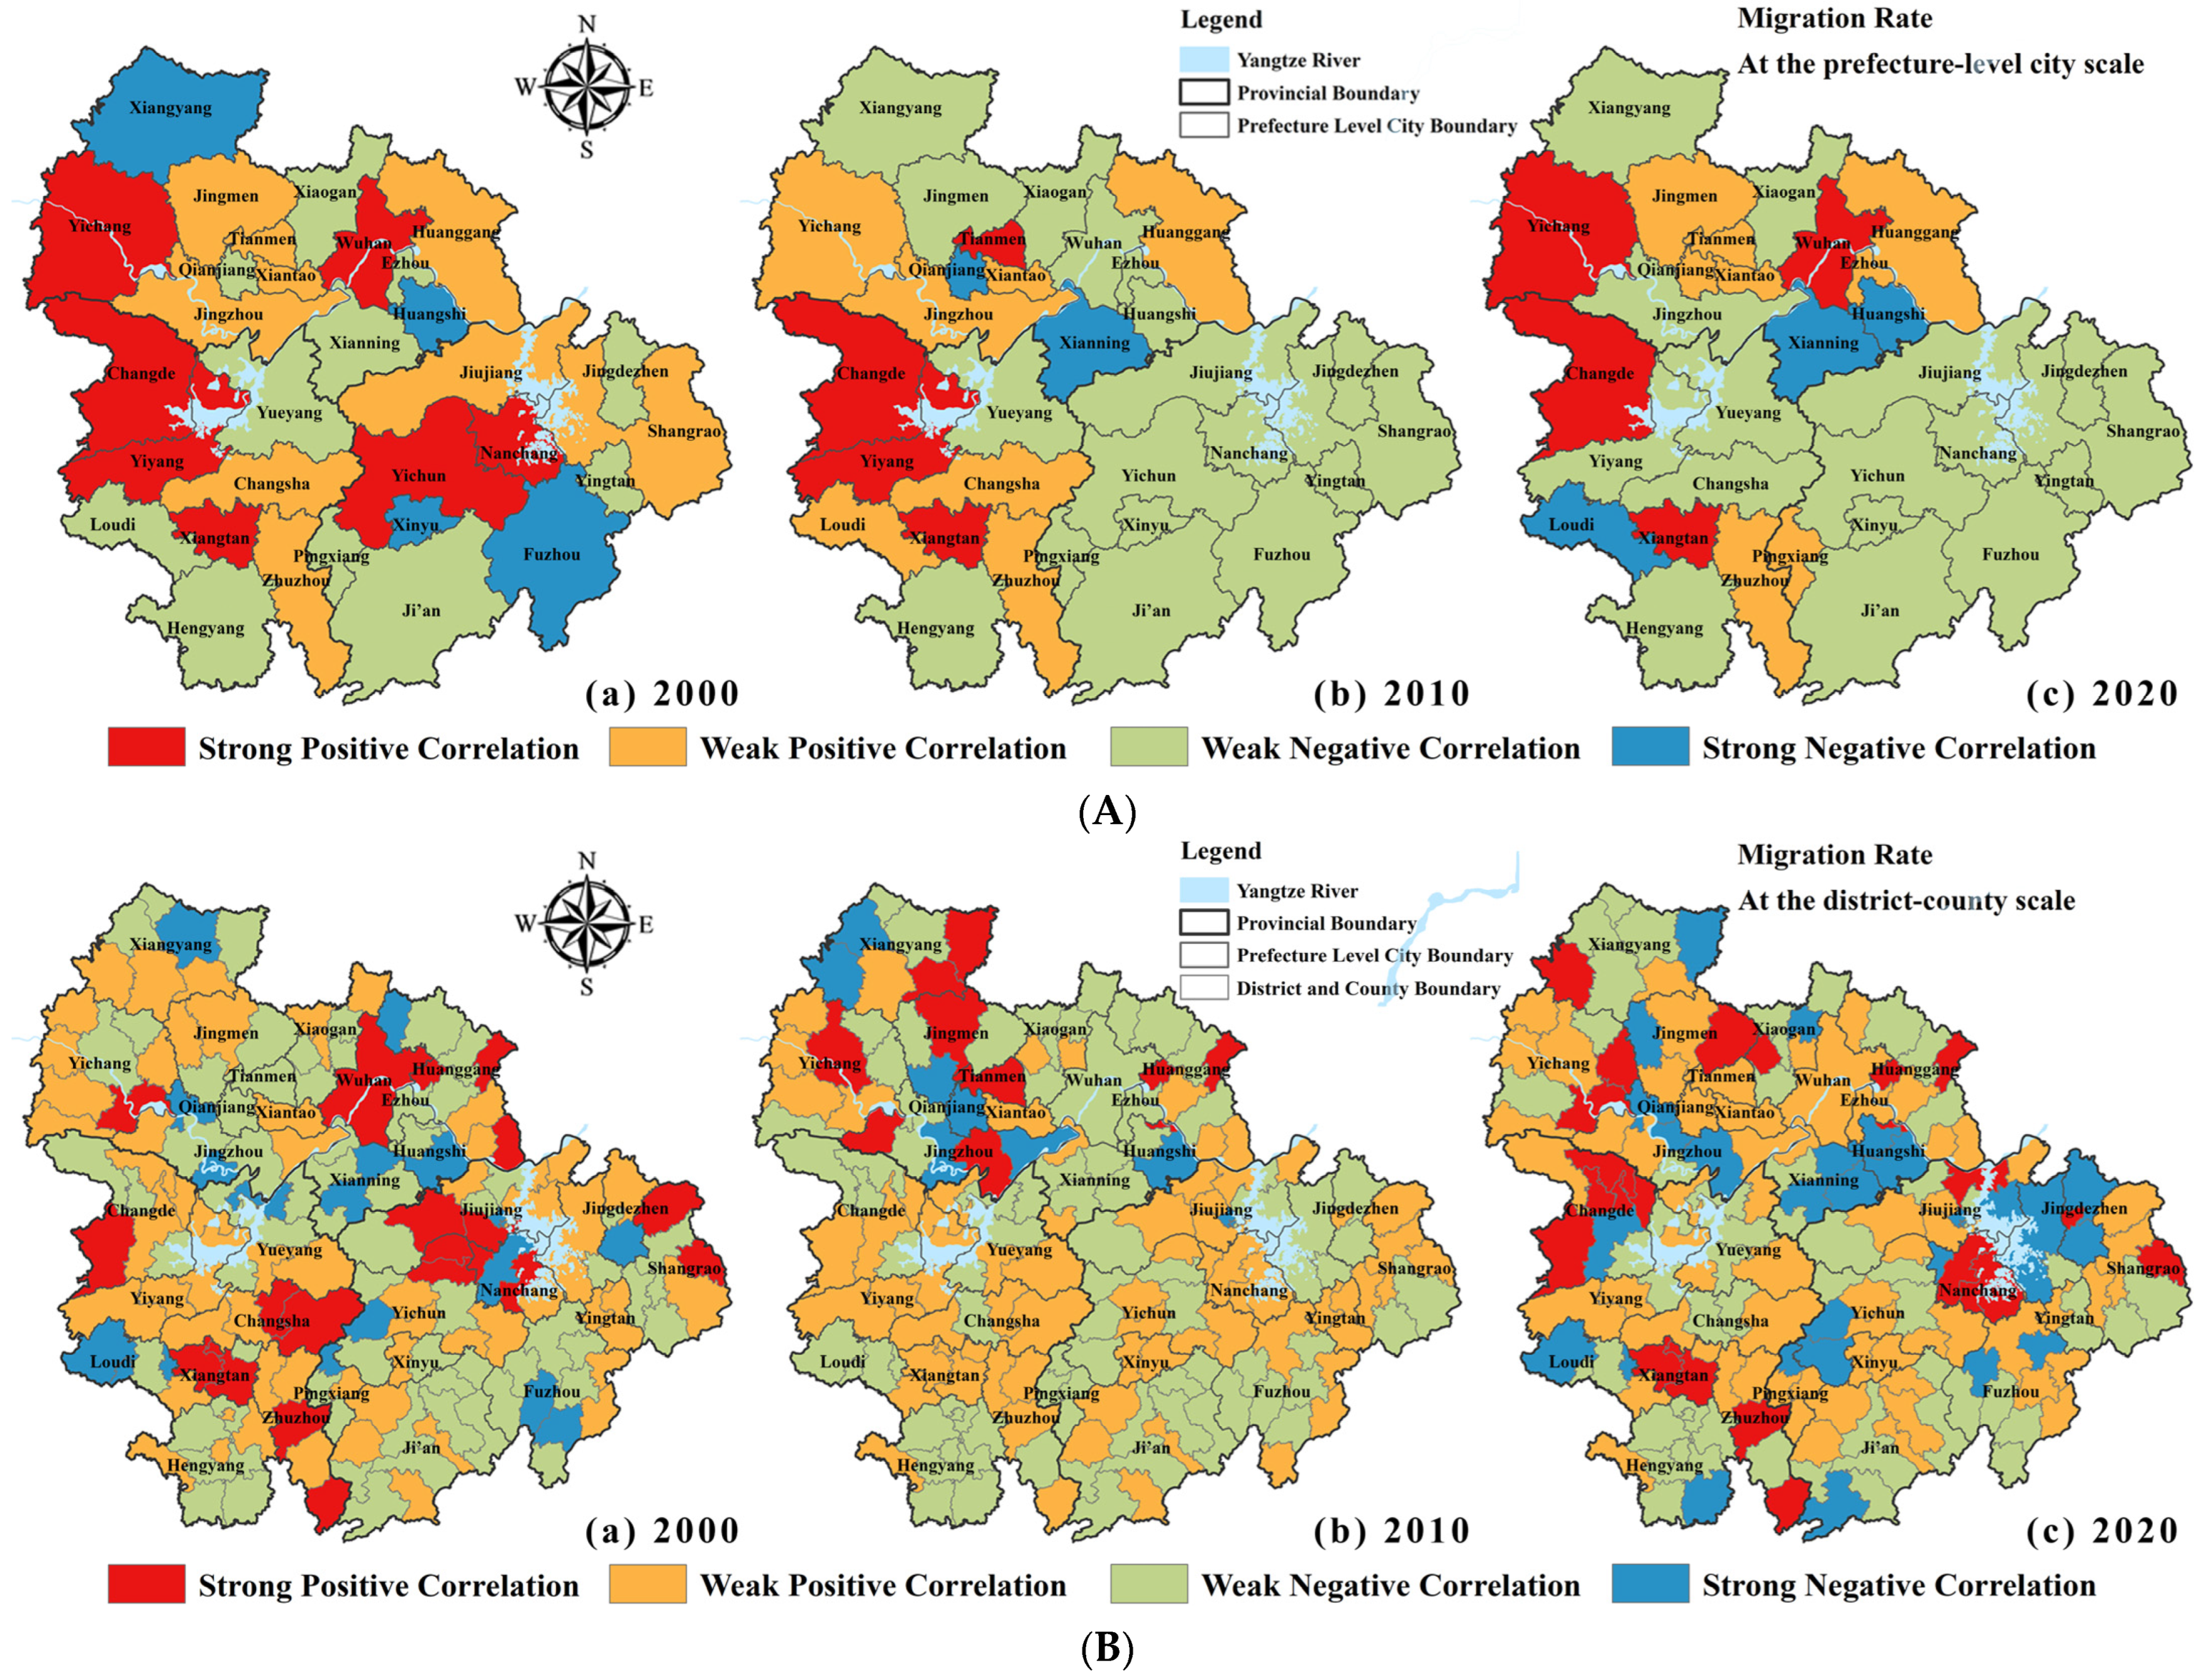
4.2.2. Migration Rate and Population Aging
- (1)
- At the prefecture level (Figure 7A)
- (2)
- At the district and county level (Figure 7B)
- (3)
- Multi-Scale Insights and Underlying Mechanisms
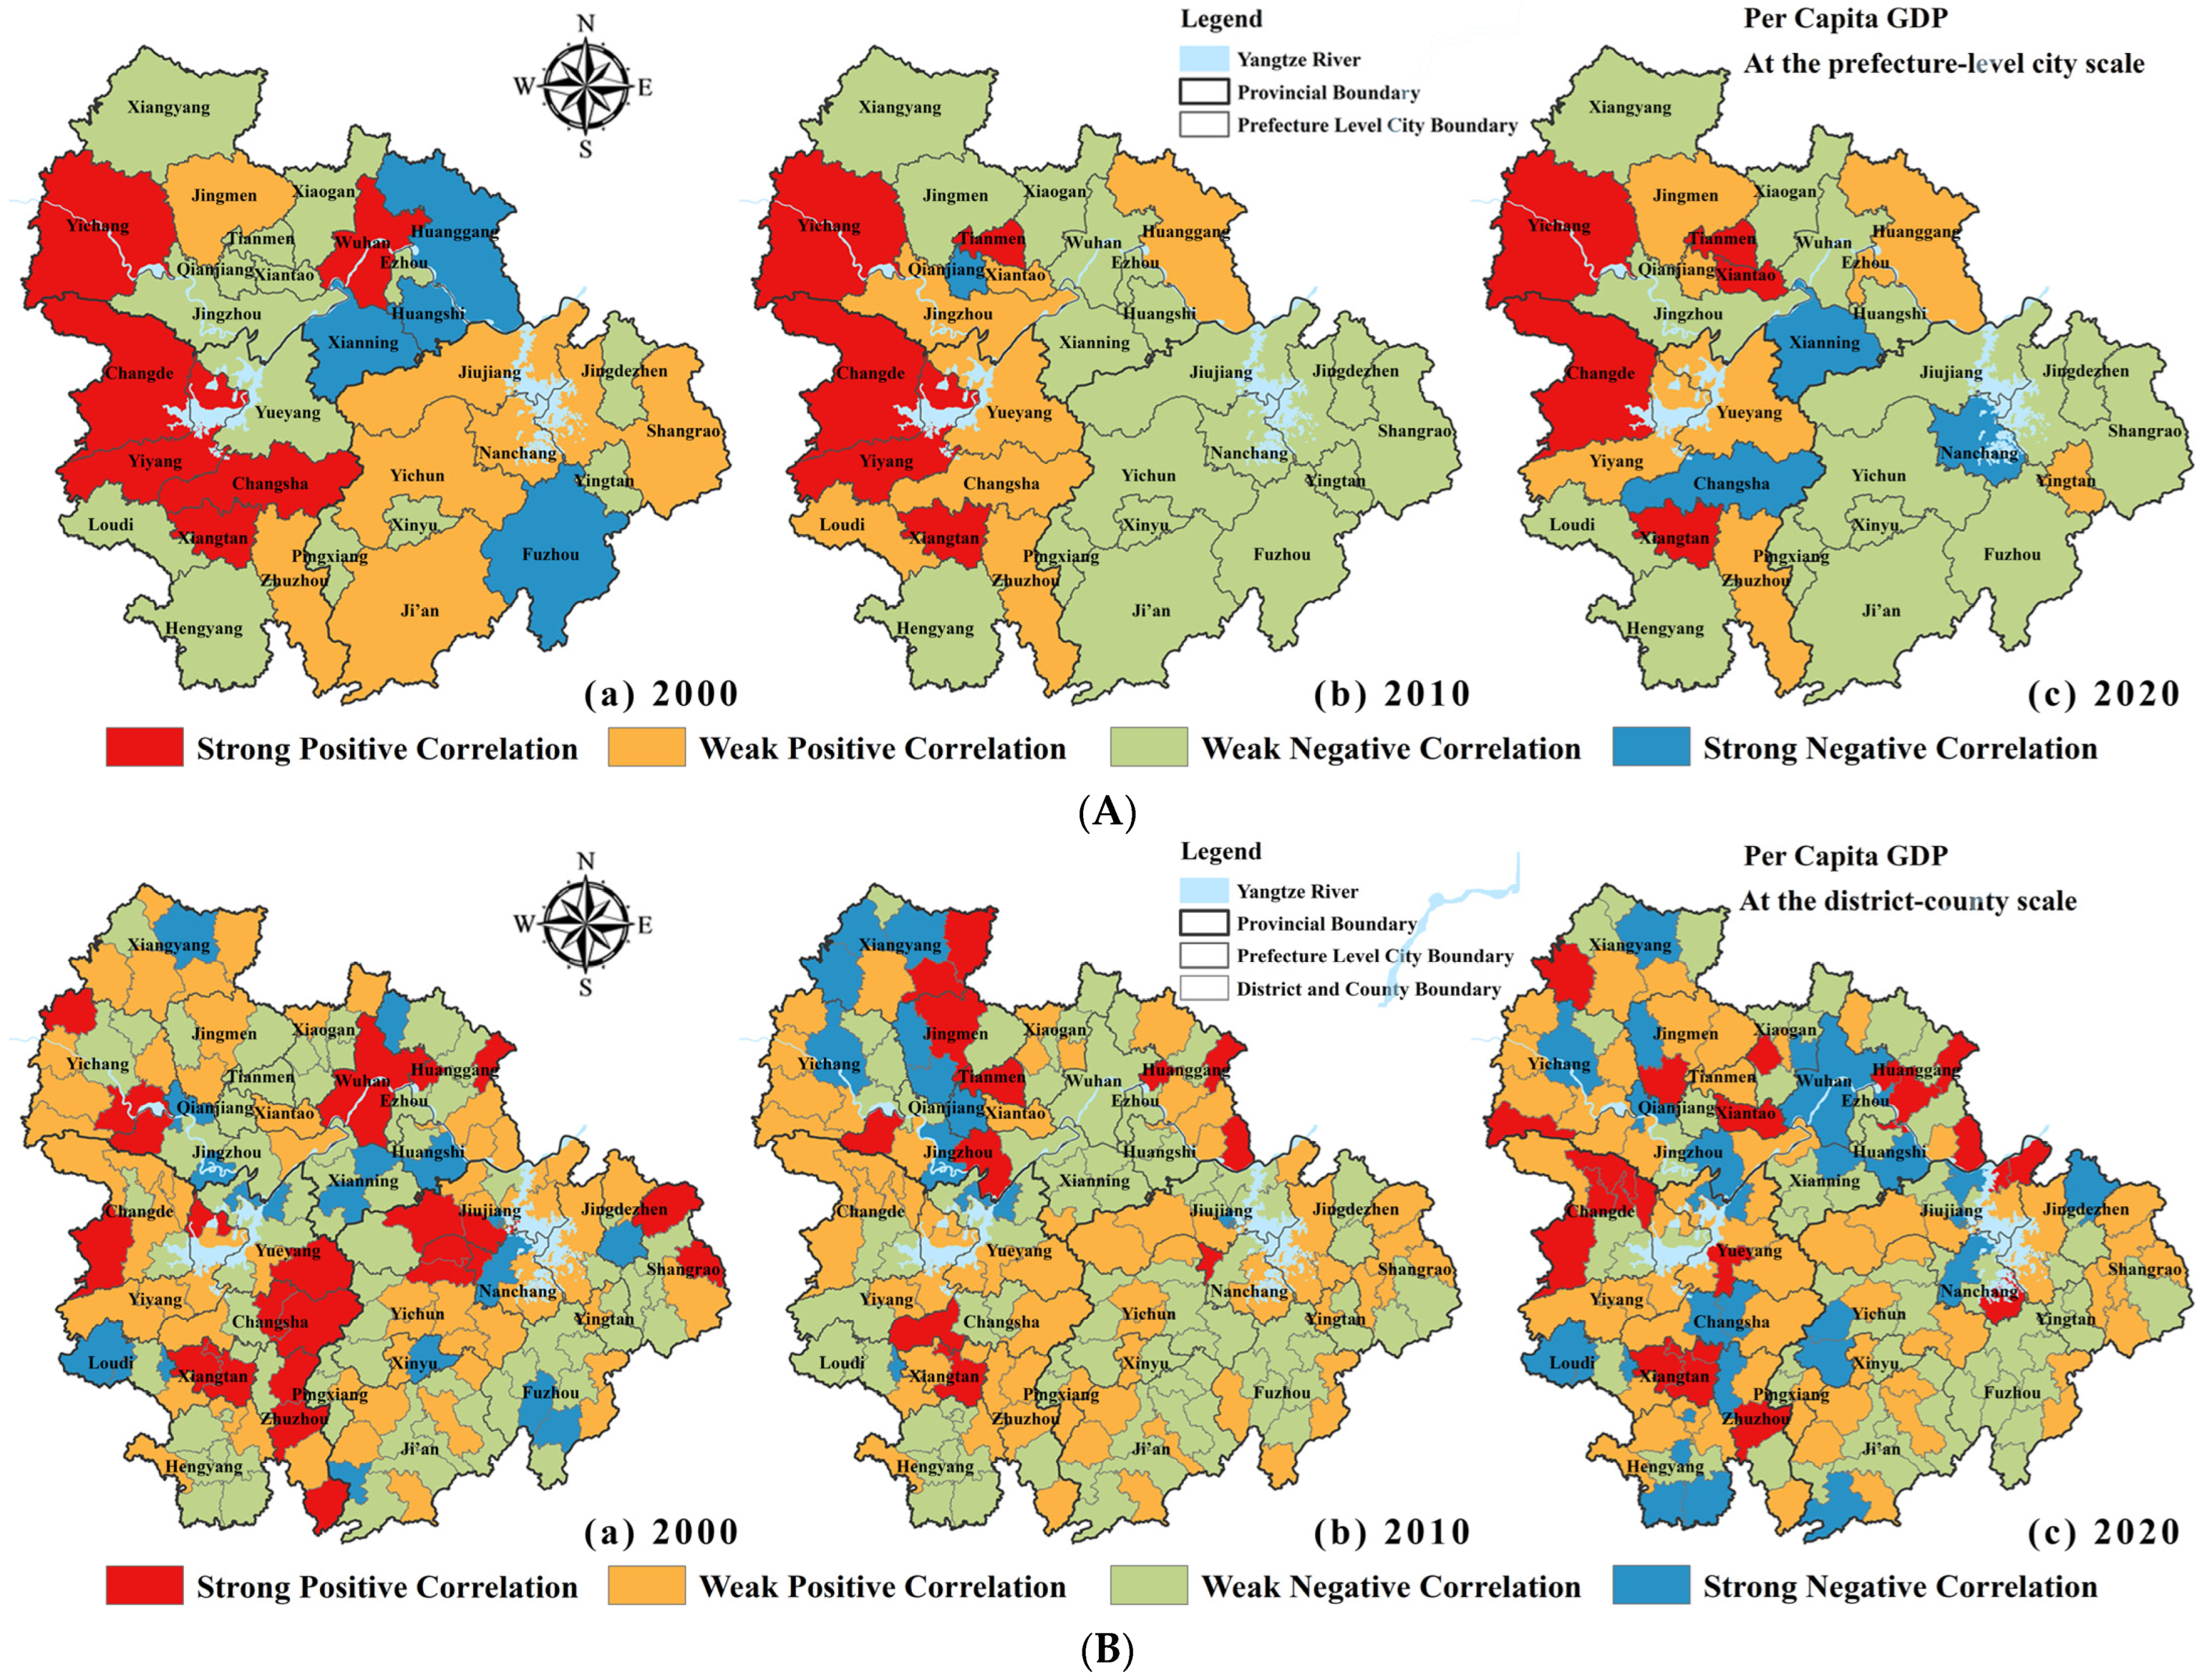
4.2.3. Per Capita GDP and Population Aging
- (1)
- At the prefecture level (Figure 8A)
- (2)
- At the district and county level (Figure 8B)
- (3)
- Multi-Scale Insights and Underlying Mechanisms
4.2.4. Illiteracy Rate and Population Aging
- (1)
- At the prefecture level (Figure 9A)
- (2)
- At the district and county level (Figure 9B)
- (3)
- Multi-Scale Comparison and Implications for Policy
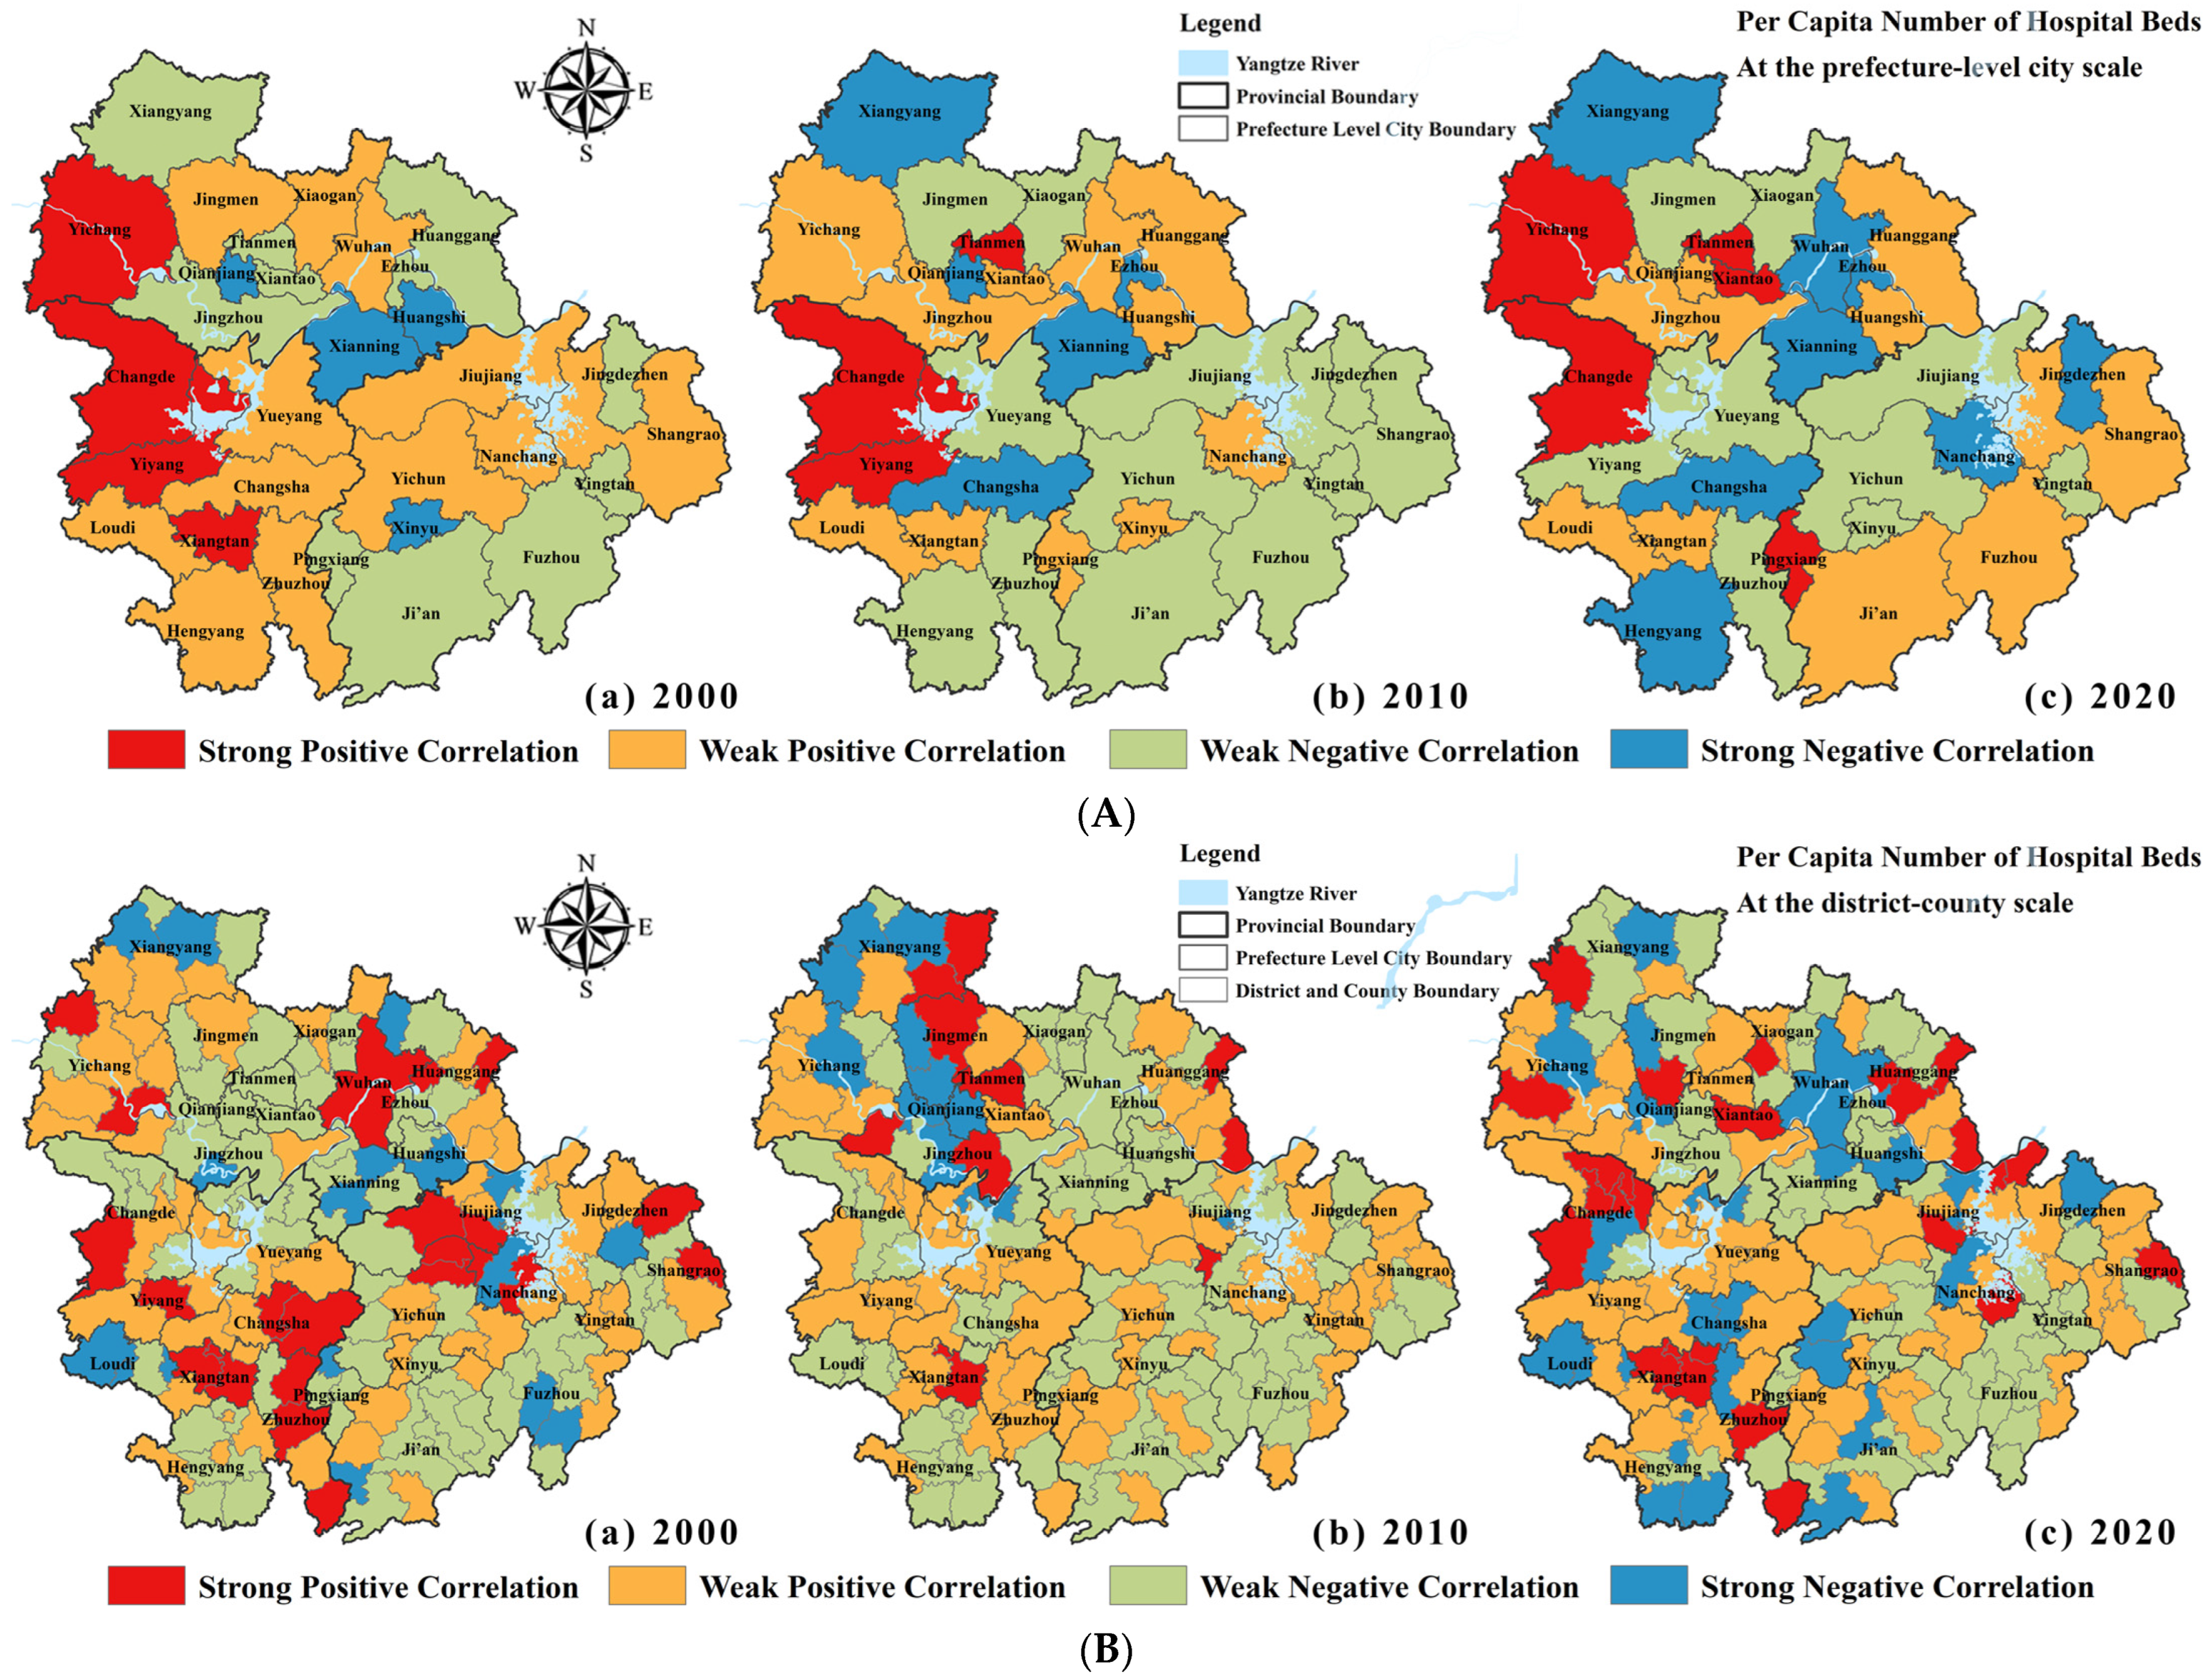
4.2.5. Per Capita Number of Hospital Beds and Population Aging
- (1)
- At the prefecture level (Figure 10A)
- (2)
- At the district and county level (Figure 10B)
- (3)
- Comparative Insights and Implications
5. Discussion
5.1. Structural Differences and Complementarity from a Multi-Scale Perspective
5.2. Spatial Heterogeneity and Coupled Mechanisms of Influencing Factors
5.3. Regional Specificity and Commonality
5.4. Research Contributions and Methodological Reflections
6. Conclusions and Recommendations
6.1. Conclusions
- (1)
- Spatiotemporal Evolution Pattern: Accelerated Aging Process and Emerging Spatial Distribution
- (2)
- Spatial Differentiation: Pronounced Polarization and Increasing Core-Periphery Disparities
- (3)
- Analysis of Influencing Factors: Multidimensional Drivers and Spatial Heterogeneity
6.2. Policy Recommendations
Author Contributions
Funding
Institutional Review Board Statement
Informed Consent Statement
Data Availability Statement
Conflicts of Interest
References
- Yao, Y. An important study to fill the gap in gerontology research: Review of “Introduction to Aging Society. Popul. Res. 2005, 29, 96. [Google Scholar]
- Liu, W. Global Development Trend of Aging of Population. Labor Econ. Rev. 2015, 8, 84–106. [Google Scholar]
- Sheng, Y.N.; Gu, D.N. Probabilistic Population Projection and Its Application: An Introduction of Methods Used in the UN World Population Prospects. Popul. J. 2020, 42, 31–46. [Google Scholar]
- Xiao, Y. The National Aging Office released the Research Report on the Prediction of the Development Trend of China’s Population Aging. Hum. Rights 2006, 2, 60. [Google Scholar]
- Zheng, B.W. Aging of population: International comparison and enlightenment of countermeasures. Chin. Cadres Trib. 2024, 5, 37–44. [Google Scholar]
- Ding, M.M. Analysis of population aging and coping strategies of insurance companies. Shanghai Insur. Mon. 2024, 1, 20–26. [Google Scholar]
- Molly. Aging population: A common global challenge. Financ. News 2024, 1–4. [Google Scholar]
- Mu, G.Z.; Zhang, T. The development trend of population aging in China and its strategic response. J. Cent. China Norm. Univ. Soc. Sci. 2011, 50, 29–36. [Google Scholar]
- Du, Y. The impact of population aging on Chinese-style modernization. Chin. Cadres Trib. 2024, 2, 11–16. [Google Scholar]
- Tong, Y.F.; Yang, Y.F. Re-examining the Concept and Stage of “Getting Old Before Getting Rich” in China. Hebei Acad. J. 2025, 45, 173–180. [Google Scholar]
- Qi, G.Z.; Wang, Z.B.; Zhao, N.N. Research on spatiotemporal evolution and driving factors of population aging in the Yellow River Basin. J. Xi Univ. Technol. 2022, 38, 301–310. [Google Scholar]
- Liu, J.; Yang, Q.S.; Zhang, Y.; Liu, J.; Jiang, X.J. Spatial patterns evolution and classification of population aging in the three provinces of Northeast China based on the county scale. Sci. Geogr. Sin. 2020, 40, 918–927. [Google Scholar]
- Leyso, N.L.; Umezaki, M. Uncovering Spatial Patterns and Temporal Trends in the Ageing of the Tokyo Metropolis Population. J. Popul. Ageing 2023, 16, 939–958. [Google Scholar] [CrossRef]
- Wu, L.G.; Wu, R.W.; Yang, D.G. Spatial-temporal patterns and influencing factors of population aging in China from 2000 to 2020. World Reg. Stud. 2023, 33, 163–176. [Google Scholar]
- Jin, Y.H.; Yang, X.J. Visualizing Spatial Disparities in Population Aging in the Seoul Metropolitan Area. Environ. Plan. A 2021, 53, 879–882. [Google Scholar]
- Fu, M.; Wang, L.; Li, Q. How Does the Spatial Structure of Urban Agglomerations Affect the Spatiotemporal Evolution of Population Aging? Sustainability 2024, 16, 3710. [Google Scholar] [CrossRef]
- Tang, H.L.; Liu, Y.; Gu, J.R. Vulnerability assessment and spatial heterogeneity characteristics of China’s urban economic system under the influence of population aging. Geogr. Sci. 2025, 45, 835–847. [Google Scholar]
- Serban, A.C. Aging Population and Effects on Labour Market. Procedia Econ. Financ. 2012, 1, 356–364. [Google Scholar] [CrossRef]
- Cowgill, D.O. Residential Segregation by Age in American Metropolitan Areas. J. Gerontol. 1978, 33, 446–453. [Google Scholar] [CrossRef] [PubMed]
- Golant, S.M. A Place to Grow Old: The Meaning of Environment in Old Age; Columbia University Press: New York, NY, USA; p. 436. ISBN 978-0-231-88808-0.
- Heikkila, E. Development features of regional population aging in Finland. Terra Hels. Finl. 1994, 106, 374–383. [Google Scholar]
- Goodman, A.C. Using Lorenz Curves to Characterise Urban Elderly Populations. Urban Stud. 1987, 24, 77–80. [Google Scholar] [CrossRef]
- Lee, J.; Kim, H.J. Identification of Spatial Distribution of an Aged Population and Analysis on Characterization of the Cluster: Focusing on Seoul Metropolitan Area. J. Digit. Contents Soc. 2019, 20, 1365–1371. [Google Scholar] [CrossRef]
- Zhu, W.; Yuan, C. Urban Heat Health Risk Assessment in Singapore to Support Resilient Urban Design—By Integrating Urban Heat and the Distribution of the Elderly Population. Cities 2023, 132, 104103. [Google Scholar] [CrossRef]
- González, A.L.; Vázquez, J.A.A. Immigration and distribution of the elderly population in Spain (2002–2011): An approach from the municipal level. Estud. Geográficos 2014, 75, 619–648. [Google Scholar]
- Andreas, H. Population Ageing in Central and Eastern Europe: Societal and Policy Implications; Ashgate Publishing, Ltd.: Hampshire, UK; p. 290. ISBN 978-1-315-60148-9.
- Li, S.; Cheng, Y.; Gauss, Y. The Regional Difference of Population Aging in Beijing–Tianjin–Hebei Region. Popul. Dev. 2017, 23, 2–12. [Google Scholar]
- Zhao, Y.N.; Sun, Z.M.; Zhang, M. Spatial-epidemiological analysis of population aging in counties in Jiangsu Province, 1990–2020. Zhonghua Liu Xing Bing Xue Za Zhi 2023, 44, 1203–1208. [Google Scholar] [PubMed]
- Li, S.X.; Wang, X.Z.; Ji, X.L.; Zhang, Y. Spatial Change and Influencing Factors of Population Aging in Shandong Province at the Township Scale. Prog. Geogr. 2019, 38, 567–576. [Google Scholar] [CrossRef]
- Zhou, P.; Deng, W.; Zhang, S.Y. Regional Characteristics and Influencing Factors of Population Aging in Sichuan. Econ. Geogr. 2019, 39, 39–47. [Google Scholar]
- Ying, K.; Li, X.D.; Cheng, D.Y. Spatial Pattern Evolution and Environmental Causes of Population Aging in Guizhou Province. Resour. Environ. Yangtze Basin 2020, 29, 334–345. [Google Scholar]
- Xu, Z.; Lin, X.S.; Luo, C.Y. Temporal spatial evolution and classification of population aging in Chongqing. J. Beijing Norm. Univ. Nat. Sci. 2019, 55, 772–779. [Google Scholar]
- Wu, Y.Y.; Song, Y.X. The evolution of China’s population aging spatial pattern and its driving factors. Sci. Geogr. Sin. 2020, 40, 768–775. [Google Scholar]
- Huang, Y.; Lu, X.J.; Liu, X.X.; Shi, L.J. Research on the contribution difference of the direct influencing factors of aging in China. Areal Res. Dev. 2022, 41, 156–161. [Google Scholar]
- Meng, Y.W.; Wang, X.W.; Lin, Z.Q.; Qiu, M.Y. Analysis on Spatial Evolution Pattern of the Aging of Population at the Township Scale—A Case Study of Fujian Province as an example. Taiwan Agric. Res. 2019, 04, 32–36. [Google Scholar]
- Cheng, G.S. The impact of fertility policy adjustment on the labor participation of the elderly in urban areas—Taking the comprehensive two-child policy as an example. Theory Mon. 2024, 04, 69–79. [Google Scholar]
- Chen, R.; Wang, M.F. Unbalanced Economic Development, Migration and Regional Differences of Ageing: An Empirical Study with Data of 287 Cities in China. Popul. J. 2018, 40, 71–81. [Google Scholar]
- Wan, S.Q.; Qin, B. A review of elderly migration research and implications. Prog. Geogr. 2022, 41, 922–934. [Google Scholar] [CrossRef]
- Wang, L.C.; Wu, R.W.; Liu, H.M.; Zhou, P. Spatial patterns and regional differences of population ageing in China based on the county scale. Prog. Geogr. 2016, 35, 921–931. [Google Scholar]
- Zhang, H.; Jiang, W.; Yang, L.; Zheng, H. Impact of Cross-Provincial Population Migration on Population Aging in China: 2000–2020. China Popul. Dev. Stud. 2024, 8, 64–77. [Google Scholar] [CrossRef]
- Yi, W.H.; Ye, X.Y.; Wang, Z.Y. The Spatial Aging Pattern and Its Driving Forces in Guangdong. Popul. Econ. 2015, 03, 33–42. [Google Scholar]
- Wang, L.C.; Wu, R.W.; Li, W. Spatial-temporal patterns of population aging on China’s urban agglomerations. Acta Geogr. Sin. 2017, 72, 1001–1016. [Google Scholar]
- Hu, M. Spatial-Temporal Pattern and Influencing Factors of Population Aging in the ZhongYuan Urban Agglomeration. Master’s Thesis, Henan University, Kaifeng, China, 2020. [Google Scholar]
- Wu, L.X.; Zhao, Y.; Wu, K.Y.; Hao, L.X.; Wang, Y.J. Regional Variations and Driving Mechanism of Aging Population in China. Sci. Geogr. Sin. 2018, 38, 877–884. [Google Scholar]
- Lu, J.; Wang, X.F.; Liu, L.; Chen, Y. Synergy Effects of Aging, Population Migration and Industrial Structure in China. Econ. Geogr. 2019, 39, 39–47. [Google Scholar]
- Wang, Z.S.; Xu, N.; Wei, W.D.; Zhao, N.N. Social Inequality among Elderly Individuals Caused by Climate Change: Evidence from the Migratory Elderly of Mainland China. J. Environ. Manag. 2020, 272, 111079. [Google Scholar] [CrossRef] [PubMed]
- Lian, Z.Y.; Zhong, J.; Xu, D.D.; Cao, S.; Liu, S.Q. Spatial-temporal evolution and influence factors of population aging in the hilly regions of China. Mt. Res. 2024, 42, 519–534. [Google Scholar]
- Jayawardhana, T.; Jayathilaka, R.; Karadanaarachchi, R.; Nimnadi, T.; Anuththara, S. Ageing Affecting the Americas?: Exploring the Growth Direction: The Relationship between the Elderly Population and Economic Growth in the American Context. BMC Geriatr. 2025, 25, 96. [Google Scholar] [CrossRef] [PubMed]
- Chen, X.F.; Gao, R.R.; Han, T.T.; Zhang, S.N. Spatial Pattern and Influencing Factors of Urban Shrinkage in the Yellow River Basin from the Perspective of Population Change. Econ. Geogr. 2020, 40, 37–46. [Google Scholar]
- Yuan, R. The Influence of Urbanization on the Aging of Urban and Rural Population in China. Master’s Thesis, Yunnan University of Finance and Economics, Kunming, China, 2025. [Google Scholar]
- Guo, J.M.; Xie, X.J.; Li, Y.F.; Zeng, Y.M. The Spatial-temporal Evolution and Influencing Factors of Aging in Sichuan Province. South China Popul. 2019, 34, 56–71. [Google Scholar]
- Ao, R.J.; Chang, L. Influencing mechanism of regional ageing in China based on the Structural Equation Model. Acta Geogr. Sin. 2020, 75, 1572–1584. [Google Scholar]


| Variable | Indicator Description | Calculation Method | Data Source | |
|---|---|---|---|---|
| Demographic Factors | Proportion of Population Aged 55–65 | Trend of Population Aging | Ratio of Population Aged 55–65 in Previous Period | National Census |
| Natural Population Growth Rate | Conditions for a Younger Population Structure | Birth Rate minus Death Rate | National Census | |
| Net Migration Rate | Regional Population Mobility | (In-Migrants—Out-Migrants)/Resident Population | National Census | |
| Economic Factors | Per Capita GDP | Economic Push and Pull Factors of Migration | Regional GDP/Resident Population | Statistical Yearbook |
| Value Added by Primary Industry | Final Output of Agricultural Activities | Total value added of agriculture, forestry, animal husbandry and fishery | Statistical Yearbook | |
| Proportion of Secondary and Tertiary Industries | Regional Economic Structure | (Secondary + Tertiary Industries)/Regional GDP | Statistical Yearbook | |
| Social Factors | Urbanization Rate | Level of Urban Development | Urban Population/Total Population | National Census |
| Hospital Beds per 1000 People | Objective Factors for Longer Life Expectancy | Total Hospital Beds/Resident Population × 1000 | Statistical Yearbook | |
| Illiteracy Rate | Basic Education Level | (Number of illiterate people aged 15 and above ÷ Number of people aged 15 and above) × 100% | National Census |
| Types of Population Aging | Non-Aging (0–7%) | Mild Aging (7–10%) | Moderate Aging (10–14%) | Severe Aging (14–20%) | Aged Society (>20%) | |||||
|---|---|---|---|---|---|---|---|---|---|---|
| Year | Num. | Per. | Num. | Per. | Num. | Per. | Num. | Per. | Num. | Per. |
| 2000 | 111 | 64.53 | 60 | 34.88 | 1 | 0.58 | 0 | 0 | 0 | 0 |
| 2010 | 22 | 12.79 | 102 | 59.30 | 43 | 25 | 3 | 1.74 | 2 | 1.16 |
| 2020 | 1 | 0.58 | 2 | 1.16 | 80 | 46.51 | 79 | 45.93 | 10 | 5.81 |
| Year | Prefecture-Level Scale | District and County Scales | ||||
|---|---|---|---|---|---|---|
| Moran’s i | p-Value | Z-Score | Moran’s i | p-Value | Z-Score | |
| 2000 | 0.52096 | 0.0001 | 4.909 | 0.602 | 0 | 10.99 |
| 2010 | 0.16529 | 0.0722 | 1.797 | 0.299 | 0 | 5.73 |
| 2020 | 0.52712 | 0.0001 | 4.929 | 0.604 | 0 | 11.11 |
| Variant | 2000 Year | 2010 Year | 2020 Year | |||
|---|---|---|---|---|---|---|
| q Statistic | p Value | q Statistic | p Value | q Statistic | p Value | |
| Natural Population Growth Rate | 0.342 | 0.000 | 0.507 | 0.169 | 0.405 | 0.027 |
| Proportion of Population Aged 55–65 | 0.630 | 0.000 | 0.601 | 0.000 | 0.535 | 0.001 |
| Net Migration Rate | 0.091 | 0.000 | 0.270 | 0.000 | 0.233 | 0.001 |
| Per Capita GDP | 0.242 | 0.000 | 0.078 | 0.000 | 0.409 | 0.001 |
| Value Added by the Primary Industry | 0.586 | 0.000 | 0.444 | 0.000 | 0.537 | 0.000 |
| Proportion of Secondary and Tertiary Industries | 0.266 | 0.001 | 0.586 | 0.000 | 0.452 | 0.085 |
| Hospital Beds per 1000 People | 0.162 | 0.000 | 0.155 | 0.000 | 0.366 | 0.000 |
| Illiteracy Rate | 0.547 | 0.149 | 0.291 | 0.000 | 0.351 | 0.000 |
| Urbanization Rate | 0.271 | 0.000 | 0.303 | 0.000 | 0.366 | 0.000 |
| Variant | 2000 Year | 2010 Year | 2020 Year | |||
|---|---|---|---|---|---|---|
| q Statistic | p Value | q Statistic | p Value | q Statistic | p Value | |
| Natural Population Growth Rate | 0.437 | 0.000 | 0.232 | 0.000 | 0.347 | 0.000 |
| Proportion of Population Aged 55–65 | 0.305 | 0.000 | 0.404 | 0.002 | 0.269 | 0.000 |
| Net Migration Rate | 0.100 | 0.000 | 0.214 | 0.000 | 0.248 | 0.000 |
| Per Capita GDP | 0.217 | 0.000 | 0.235 | 0.000 | 0.236 | 0.000 |
| Value Added by the Primary Industry | 0.405 | 0.000 | 0.624 | 0.003 | 0.532 | 0.000 |
| Proportion of Secondary and Tertiary Industries | 0.209 | 0.000 | 0.528 | 0.000 | 0.378 | 0.000 |
| Hospital Beds per 1000 People | 0.105 | 0.000 | 0.268 | 0.000 | 0.287 | 0.000 |
| Illiteracy Rate | 0.272 | 0.000 | 0.078 | 0.000 | 0.090 | 0.000 |
| Urbanization Rate | 0.120 | 0.000 | 0.090 | 0.000 | 0.258 | 0.000 |
Disclaimer/Publisher’s Note: The statements, opinions and data contained in all publications are solely those of the individual author(s) and contributor(s) and not of MDPI and/or the editor(s). MDPI and/or the editor(s) disclaim responsibility for any injury to people or property resulting from any ideas, methods, instructions or products referred to in the content. |
© 2025 by the authors. Licensee MDPI, Basel, Switzerland. This article is an open access article distributed under the terms and conditions of the Creative Commons Attribution (CC BY) license (https://creativecommons.org/licenses/by/4.0/).
Share and Cite
Sun, J.; Huang, J.; Jiang, X.; Song, X.; Zhang, N. Spatiotemporal Evolution and Influencing Factors of Population Aging in the Triangle of Central China at Multiple Scales. Sustainability 2025, 17, 6549. https://doi.org/10.3390/su17146549
Sun J, Huang J, Jiang X, Song X, Zhang N. Spatiotemporal Evolution and Influencing Factors of Population Aging in the Triangle of Central China at Multiple Scales. Sustainability. 2025; 17(14):6549. https://doi.org/10.3390/su17146549
Chicago/Turabian StyleSun, Jingyuan, Jinchuan Huang, Xiujuan Jiang, Xinlan Song, and Nan Zhang. 2025. "Spatiotemporal Evolution and Influencing Factors of Population Aging in the Triangle of Central China at Multiple Scales" Sustainability 17, no. 14: 6549. https://doi.org/10.3390/su17146549
APA StyleSun, J., Huang, J., Jiang, X., Song, X., & Zhang, N. (2025). Spatiotemporal Evolution and Influencing Factors of Population Aging in the Triangle of Central China at Multiple Scales. Sustainability, 17(14), 6549. https://doi.org/10.3390/su17146549