

The Impact of IMO Market-Based Measures on Korean Shipping Companies: A Focus on the GHG Levy

Abstract
1. Introduction
2. Literature Review
3. Estimation of Fuel Consumption and Carbon Emissions of Korean Shipping Companies’ Vessels
3.1. Analysis Method
3.1.1. Fuel Consumption Estimation Method
3.1.2. Carbon Emission Estimation Method
3.2. Analysis Results
3.2.1. Basic Analysis Data
3.2.2. Estimated Results of Fuel Consumption for Korean Shipping Companies
3.2.3. Estimated Carbon Emissions Results for Korean Shipping Companies
Estimated Carbon Emissions by Vessel Type for Korean Shipping Companies
Estimated Carbon Emissions by Listed Shipping Companies
4. Analysis of Cost Burden and Financial Structure Impact Due to Carbon Tax Introduction
4.1. Analysis Method
4.1.1. Estimation of Asset Value and Volatility
4.1.2. Calculation of Distance to Default (DD)
4.1.3. Calculation of Expected Default Frequency (EDF)
4.2. Analysis Results
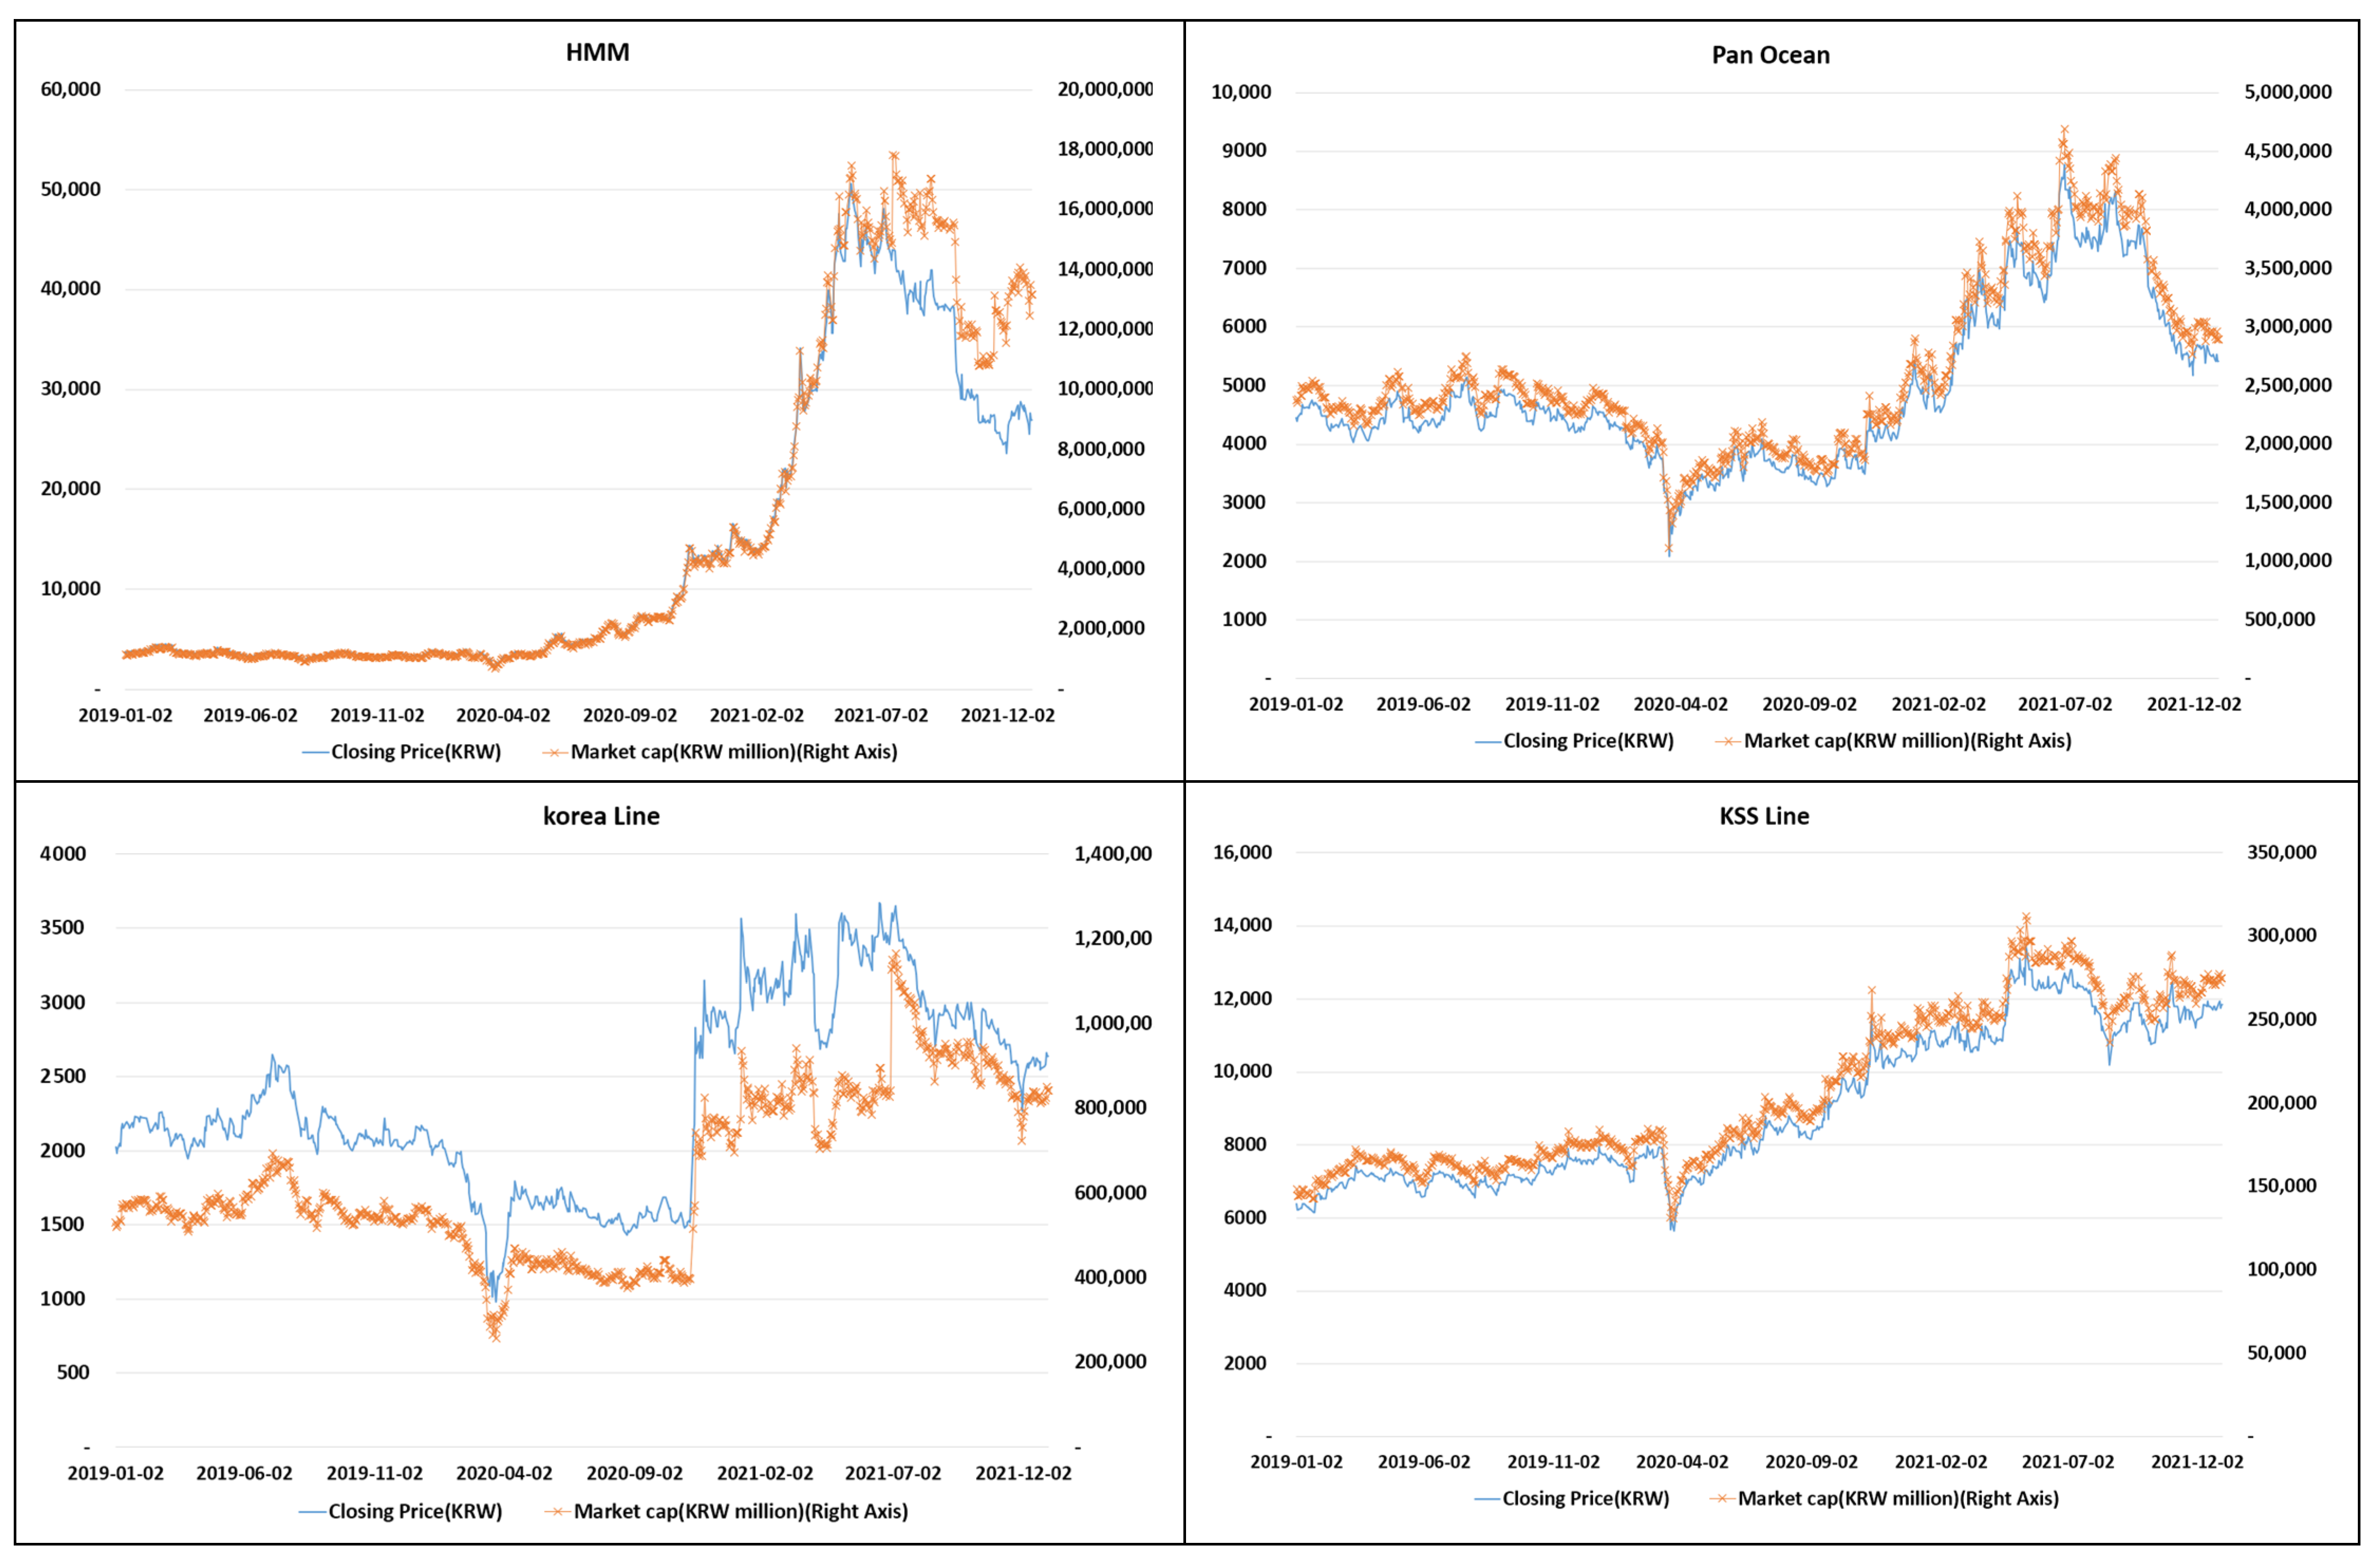
4.2.1. Basic Analysis Data
4.2.2. Carbon Tax Introduction Scenarios
4.2.3. Analysis Results of Carbon Tax Cost Burden
4.2.4. Analysis Results of Carbon Tax Introduction Impact Through the Merton Model
5. Conclusions
Author Contributions
Funding
Institutional Review Board Statement
Informed Consent Statement
Data Availability Statement
Acknowledgments
Conflicts of Interest
References
- International Maritime Organization. Draft Report of the Marine Environment Protection Committee on Its Eightieth Session; International Maritime Organization: London, UK, 2023. [Google Scholar]
- Psaraftis, H.N.; Kontovas, C.A. Decarbonization of maritime transport: Is there light at the end of the tunnel? Sustainability 2020, 13, 237. [Google Scholar] [CrossRef]
- Mundaca, G.; Strand, J.; Young, I.R. Carbon pricing of international transport fuels: Impacts on carbon emissions and trade activity. J. Environ. Econ. Manag. 2021, 110, 102517. [Google Scholar] [CrossRef]
- Lin, B.; Li, X. The effect of carbon tax on per capita CO2 emissions. Energy Policy 2011, 39, 5137–5146. [Google Scholar] [CrossRef]
- World Bank. Emissions Trading in Practice: A Handbook on Design and Implementation, 2nd ed.; World Bank: Washington, DC, USA, 2021. [Google Scholar]
- Wu, Y.; Wen, K.; Zou, X. Impacts of Shipping Carbon Tax on Dry Bulk Shipping Costs and Maritime Trades—The Case of China. J. Mar. Sci. Eng. 2022, 10, 1105. [Google Scholar] [CrossRef]
- Bakkehaug, R.; Fagerholt, K.; Lindstad, H. A stochastic programming formulation for strategic fleet renewal in shipping. Transp. Res. Part E Logist. Transp. Rev. 2014, 72, 60–76. [Google Scholar] [CrossRef]
- Yu, H. Stochastic Ship Fleet Routing with Inventory Limits. Ph.D. Thesis, University of Edinburgh, Edinburgh, UK, 2010. [Google Scholar]
- Meng, Q.; Wang, S. A chance constrained programming model for short-term liner ship fleet planning problems. Marit. Policy Manag. 2010, 37, 329–346. [Google Scholar] [CrossRef]
- Zhu, C.; Chen, Y.; Kristal, M. Modelling the impacts of uncertain carbon tax policy on maritime fleet mix strategy and carbon mitigation. Transport 2018, 33, 707–717. [Google Scholar] [CrossRef]
- Pereda, P.C.; Lucchesi, A.; Oliveira, T.D.; Wolf, R. Carbon tax in the shipping sector: Assessing economic and environmental impacts. Energy Policy 2025, 204, 114627. [Google Scholar] [CrossRef]
- Park, S.-H.; Han, C.-W.; Kim, T.-I. Effect of low sulphur fuel oil use on Korean container shipping companies by IMO environmental regulations. Korea Port Econ. Assoc. 2020, 36, 23–40. [Google Scholar] [CrossRef]
- Han, N.H.; Kim, M.J. A study on the decarbonization strategy of global shipping. J. Marit. Bus. 2020, 47, 143–164. [Google Scholar]
- Battiston, S.; Mandel, A.; Monasterolo, I.; Schütze, F.; Visentin, G. A climate stress-test of the financial system. Nat. Clim. Change 2017, 7, 283–288. [Google Scholar] [CrossRef]
- Reinders, H.J.; Schoenmaker, D.; Van Dijk, M. A finance approach to climate stress testing. J. Int. Money Financ. 2020. preprint. [Google Scholar] [CrossRef]
- Naim, P.; Condamin, L. Modeling corporate credit climate risk. Am. Bank. Assoc. Bank. J. 2021, 113, 26–29. [Google Scholar]
- Capasso, G.; Gianfrate, G.; Spinelli, M. Climate change and credit risk. J. Clean. Prod. 2020, 266, 121634. [Google Scholar] [CrossRef]
- Bank of Korea. Current Status of Carbon Neutrality Promotion in the International Community and Its Economic Impact; Overseas Economy Focus No. 2021-16; Bank of Korea: Seoul, Republic of Korea, 2018. [Google Scholar]
- International Maritime Organization (IMO). Fourth IMO Greenhouse Gas Study; International Maritime Organization: London, UK, 2020. [Google Scholar]
- World Fleet Register (WFR). Available online: https://www.clarksons.net/wfr/ (accessed on 30 May 2022).
- Korea Shipowners’ Association, internal data.
- Jang, W.; Park, J.W. Credit Risk Management; Korea Financial Training Institute: Seoul, Republic of Korea, 2009. [Google Scholar]
- Gropp, R.; Vesala, J.; Vulpes, G. Equity and bond market signals as leading indicators of bank fragility. J. Money Credit Bank 2006, 38, 399–428. [Google Scholar] [CrossRef]
- Korea Securities Depository. RFR Information. Available online: https://www.kofr.kr/intro/RFRinfo.jsp (accessed on 6 August 2022).
- FnGuide’s Daily Dataset. Available online: https://www.fnguide.com (accessed on 26 July 2022).
- Maritime Korea. Urgent Response Needed from Shipping Industry to IMO’s 2050 Carbon Neutral and Zero Carbon Goals. Available online: http://m.monthlymaritimekorea.com/news/articleView.html?idxno=33095 (accessed on 19 April 2022).
- Ship & Bunker. Maersk Proposes $450/MT Carbon Tax for Bunker Fuel. Available online: https://shipandbunker.com/news/world/633414-maersk-proposes-450mt-carbon-tax-for-bunker-fuel (accessed on 8 August 2022).
- Financial Times. Shipping Heavyweight Japan Tables Carbon Tax Proposal for the Industry. Available online: https://www.ft.com/content/ae5893a1-4a7e-4152-8fb2-65679ebc73c4 (accessed on 26 July 2022).
- Deloitte Insights Editorial Department. 2050 Carbon Neutral Roadmap Chapter 03: Global Carbon Pricing System Status; Deloitte: London, UK, 2021; pp. 1–27. [Google Scholar]
- Park, S.; Ko, B.; Lee, K. Study on the Development of Support Programs for the Transition to Eco-Friendly Ships; Korea Shipowners’ Association: Seoul, Republic of Korea, 2021. [Google Scholar]
- Kim, H.; Park, S.; Kim, T.; Choi, S. Effect of IMO Market-Based Measures on Korean Shipping Companies; Korea Maritime Institute: Busan, Republic of Korea, 2022. [Google Scholar]


| Category | 2021 |
|---|---|
| HFO | IFO180 |
| IFO380 | |
| VLS IFO | |
| MDO | VLS MDO |
| VLS MGO | |
| LNG | LNG VLS IFO |
| LNG VLS MDO | |
| LNG VLS MGO | |
| Methanol | - |
| LSHFO 1.0% | - |
| Fuel Type | Carbon Content | |
|---|---|---|
| HFO | 0.8493 | 3.114 |
| MDO | 0.8744 | 3.206 |
| LNG | 0.7500 | 2.750 |
| Methanol | 0.3750 | 1.375 |
| LSHFO 1.0% | 0.8493 | 3.114 |
| Description | Source |
|---|---|
| Statistics on vessels owned by Korean shipping companies | Clarksons Research World Fleet Register (WFR) |
| Financial statistics of Korean shipping companies | Korea Shipowners’ Association |
| 2018 Bottom-up fleet standard data | IMO |
| Vessel Type | Number of Vessels | GT | DWT |
|---|---|---|---|
| Bulk carriers | 367 | 25,294,195 | 47,482,954 |
| Chemical tankers | 282 | 1,500,955 | 2,340,785 |
| Container ships | 217 | 9,809,526 | 10,909,517 |
| Crude tankers | 76 | 10,273,661 | 19,784,242 |
| General cargo | 410 | 938,009 | 1,421,574 |
| LNG | 49 | 4,754,952 | 3,738,372 |
| LPG | 86 | 1,465,821 | 1,659,501 |
| Product tankers | 296 | 3,760,904 | 6,391,224 |
| Total | 1,783 | 57,798,023 | 93,728,169 |
| Vessel Type | Vessel Size | Number of Vessels | DWT | Average Age | Annual Fuel Consumption (kt) | Annual Carbon Emissions (M Tons) |
|---|---|---|---|---|---|---|
| Bulk carriers | 10,000–34,999 | 31 | 925,874 | 13 | 99 | 0.31 |
| 35,000–59,999 | 42 | 2,096,152 | 12 | 181 | 0.56 | |
| 60,000–99,999 | 78 | 6,033,350 | 11 | 460 | 1.43 | |
| 100,000–199,999 | 88 | 15,227,554 | 12 | 889 | 2.75 | |
| 200,000+ | 70 | 20,184,303 | 5 | 952 | 2.96 | |
| Subtotal | 309 | 44,467,233 | 52 | 2581 | 8.02 | |
| Chemical tankers | 0–4999 | 68 | 182,671 | 18 | 136 | 0.42 |
| 5000–9999 | 50 | 351,635 | 15 | 155 | 0.48 | |
| 10,000–19,999 | 84 | 1,196,109 | 16 | 378 | 1.18 | |
| 20,000–39,999 | - | - | - | - | - | |
| Subtotal | 202 | 1,730,415 | 48 | 669 | 2.08 | |
| Container ships | 0–999 | 43 | 405,091 | 22 | 159 | 0.50 |
| 1000–1999 | 72 | 1,226,461 | 11 | 504 | 1.57 | |
| 2000–2999 | 17 | 589,608 | 12 | 170 | 0.53 | |
| 3000–4999 | 26 | 1,480,493 | 16 | 406 | 1.26 | |
| 5000–7999 | 20 | 1,542,384 | 15 | 464 | 1.44 | |
| 8000–11,999 | 6 | 665,946 | 12 | 179 | 0.56 | |
| 12,000–14,499 | 5 | 736,737 | 9 | 156 | 0.48 | |
| 14,500–19,999 | 8 | 1,287,415 | 2 | 248 | 0.77 | |
| 20,000+ | 12 | 2,773,437 | 3 | 306 | 0.95 | |
| Subtotal | 209 | 10,707,572 | 102 | 2591 | 8.07 | |
| Crude tankers | 80,000–119,999 | 14 | 1,591,658 | 3 | 136 | 0.39 |
| 200,000+ | 53 | 16,412,958 | 8 | 1023 | 3.19 | |
| Subtotal | 67 | 18,004,616 | 11 | 1159 | 3.57 | |
| General cargo | 0–4999 | 62 | 196,759 | 20 | 43 | 0.14 |
| 5000–9999 | 35 | 233,214 | 16 | 67 | 0.21 | |
| 10,000–19,999 | 7 | 91,640 | 16 | 27 | 0.08 | |
| 20,000+ | - | - | - | - | - | |
| Subtotal | 104 | 521,613 | 51 | 137 | 0.43 | |
| LPG | 0–49,999 | 1 | 5320 | 6 | 4 | 0.01 |
| 50,000–99,999 | 35 | 2,830,768 | 20 | 966 | 2.88 | |
| Subtotal | 36 | 2,836,088 | 26 | 970 | 2.89 | |
| Product tankers | 0–4999 | 13 | 32,225 | 29 | 26 | 0.08 |
| 5000–9999 | 7 | 46,407 | 12 | 22 | 0.07 | |
| 10,000–19,999 | - | - | - | - | - | |
| 20,000–39,999 | 1 | 37,764 | 2 | 7 | 0.02 |
| Shipping Company | Number of Vessels | DWT | Average Main Engine | Auxiliary Engine | Boiler | Annual Fuel Consumption (Kt) |
|---|---|---|---|---|---|---|
| HMM | 57 | 8,555,754 | 19 | 3 | 1 | 1284 |
| Pan Ocean | 110 | 12,967,940 | 7 | 1 | 0 | 858 |
| Korea Line | 39 | 5,845,885 | 8 | 1 | 1 | 373- |
| KSS Line | 29 | 872,256 | 5 | 2 | 1 | 217 |
| Total (95 companies) | 1094 | 84,805,202 | - | - | - | 9211 |
| Vessel Type | Number of Vessels | DWT | Annual Fuel Consumption (Kt) | Annual Carbon Emissions (Tons) |
|---|---|---|---|---|
| Bulk carriers | 309 | 44,467,233 | 2581 | 8,020,340 |
| Chemical tankers | 202 | 1,730,415 | 669 | 2,084,186 |
| Container ships | 209 | 10,707,572 | 2591 | 8,068,374 |
| Crude tankers | 67 | 18,004,616 | 1159 | 3,572,884 |
| General cargo | 104 | 521,613 | 137 | 425,539 |
| LNG | 36 | 2,836,088 | 970 | 2,888,246 |
| LPG | 59 | 20,184,303 | 433 | 1,346,805 |
| Product tankers | 108 | 5,114,040 | 672 | 2,094,323 |
| Total | 1094 | 84,805,202 | 9211 | 28,500,697 |
| Shipping Company | Number of Vessels | DWT | Annual Fuel Consumption (Kt) | Annual Carbon Emissions (Tons) |
|---|---|---|---|---|
| HMM | 55 | 8,442,798 | 1275 | 3,997,130 |
| Pan Ocean | 110 | 12,967,940 | 858 | 2,671,015 |
| Korea Line | 39 | 5,845,885 | 373 | 1,162,456 |
| KSS Line | 29 | 872,256 | 217 | 674,860 |
| Total (95 companies) | 1094 | 84,805,202 | 9211 | 28,500,697 |
| Company | Vessel Type | Bulk Carriers | Chemical Tankers | Container Ships | Crude Tankers | General Cargo | LNG | LPG | Product Tankers | Total |
|---|---|---|---|---|---|---|---|---|---|---|
| HMM | Number of vessels | 4 | 0 | 45 | 5 | 0 | 0 | 0 | 1 | 55 |
| Percentage by type | 7 | - | 82 | 9 | - | - | - | 2 | 100 | |
| Annual carbon emissions (10,000 tons) | 10 | - | 355 | 30 | - | - | - | 2 | 397 | |
| Pan Ocean | Number of vessels | 81 | 6 | 5 | 2 | 0 | 2 | 0 | 14 | 110 |
| Percentage by type | 74 | 5 | 5 | 2 | - | 2 | - | 13 | 100 | |
| Annual carbon emissions (10,000 tons) | 197 | 8 | 9 | 12 | - | 10 | - | 31 | 267 | |
| Korea Line | Number of vessels | 32 | - | - | 4 | - | - | - | 3 | 39 |
| Percentage by type | 82 | - | - | 10 | - | - | - | 8 | 100 | |
| Annual carbon emissions (10,000 tons) | 86 | - | - | 24 | - | - | - | 7 | 116 | |
| KSS Line | Number of vessels | 8 | 20 | 1 | 29 | |||||
| Percentage by type | 28 | 69 | 3 | 100 | ||||||
| Annual carbon emissions (10,000 tons) | 5 | 60 | 2 | 67 |
| Data | Source |
|---|---|
| Korea Overnight Financing Repo Rate (KOFR) | Korea Securities Depository |
| Listed shipping companies’ stock price data, market capitalization | FnGuide |
| Financial statistics of Korean shipping companies | Korea Shipowners’ Association |
| Company | Equity (M KRW) | EquityVol |
|---|---|---|
| HMM | 13,155,162 | 0.6056 |
| Pan Ocean | 2,892,021 | 0.4814 |
| Korea Line | 842,628 | 0.4675 |
| KSS Line | 274,753 | 0.289 |
| Company | Liability (M KRW) |
|---|---|
| HMM | 7,517,806 |
| Pan Ocean | 2,891,942 |
| Korea Line | 2,341,620 |
| KSS Line | 1,103,404 |
| Company | Asset (M KRW) | EBITDA (M KRW) | Drift (Expected Return) |
|---|---|---|---|
| HMM | 17,876,100 | 5,337,151 | 0.298564 |
| Pan Ocean | 6,488,779 | 549,305 | 0.084655 |
| Korea Line | 3,859,734 | 306,589 | 0.079433 |
| KSS Line | 1,446,228 | 56,071 | 0.038771 |
| Company | DD | EDF |
|---|---|---|
| HMM | 3.1521 | 0.0008 |
| Pan Ocean | 3.0317 | 0.0012 |
| Korea Line | 2.8816 | 0.0020 |
| KSS Line | 4.1567 | 0.0000 |
| Scenario | Cost (USD /tCO2eq) | Country/Organization |
|---|---|---|
| 1 | 100 | IMO (Marshall Islands) |
| 2 | 150 | AP Moller-Maersk |
| 3 | 56 | Japan |
| 4 | 75 | IMF |
| 5 | 32.8 | Average of 27 countries implementing carbon tax |
| Carbon Tax Scenario | S1 | S2 | S3 | S4 | S5 |
|---|---|---|---|---|---|
| IMO (Marshall Islands) | AP Moller-Maersk | Japan | IMF | Average of Other Industries in Other Countries | |
| Carbon tax price (USD /tCO2eq) | 100 | 150 | 56 | 75 | 32.81 |
| Carbon tax cost by scenario (MUSD) | 2,849.57 | 4,274.35 | 1,595.76 | 2,137.17 | 934.94 |
| Carbon tax cost by scenario (KRW 100 million) | 32,611 | 48,916 | 18,262 | 24,458 | 10,700 |
| Category | Carbon Emission (Tons/year) | S1 | S2 | S3 | S4 | S5 |
|---|---|---|---|---|---|---|
| IMO (Marshall Islands) | AP Moller-Maersk | Japan | IMF | Average of Other Industries in Other Countries | ||
| USD 100 | USD 150 | USD 56 | USD 75 | USD 32.81 | ||
| HMM | 3,997,130 | 4,574.40 | 6,861.59 | 2,561.66 | 3,430.80 | 1,500.86 |
| Pan Ocean | 2,671,015 | 3,056.76 | 4,585.14 | 1,711.79 | 2,292.57 | 1,002.92 |
| Korea Line | 1,162,456 | 1,330.34 | 1,995.51 | 744.99 | 997.75 | 436.48 |
| KSS Line | 674,860 | 772.32 | 1,158.49 | 432.50 | 579.24 | 253.40 |
| Category | Drift (Expected Return Rate) |
|---|---|
| HMM (base) | 0.298564 |
| HMM (S1) | 0.272974 |
| HMM (S2) | 0.260179 |
| HMM (S3) | 0.284233 |
| HMM (S4) | 0.279371 |
| HMM (S5) | 0.290168 |
| Pan Ocean (base) | 0.084655 |
| Pan Ocean (S1) | 0.037546 |
| Pan Ocean (S2) | 0.013992 |
| Pan Ocean (S3) | 0.058274 |
| Pan Ocean (S4) | 0.049323 |
| Pan Ocean (S5) | 0.069198 |
| Korea Line (base) | 0.079433 |
| Korea Line (S1) | 0.044966 |
| Korea Line (S2) | 0.027732 |
| Korea Line (S3) | 0.060131 |
| Korea Line (S4) | 0.053582 |
| Korea Line (S5) | 0.068124 |
| KSS Line (base) | 0.038771 |
| KSS Line (S1) | −0.01463 |
| KSS Line (S2) | −0.04133 |
| KSS Line (S3) | 0.008865 |
| KSS Line (S4) | −0.00128 |
| KSS Line (S5) | 0.021249 |
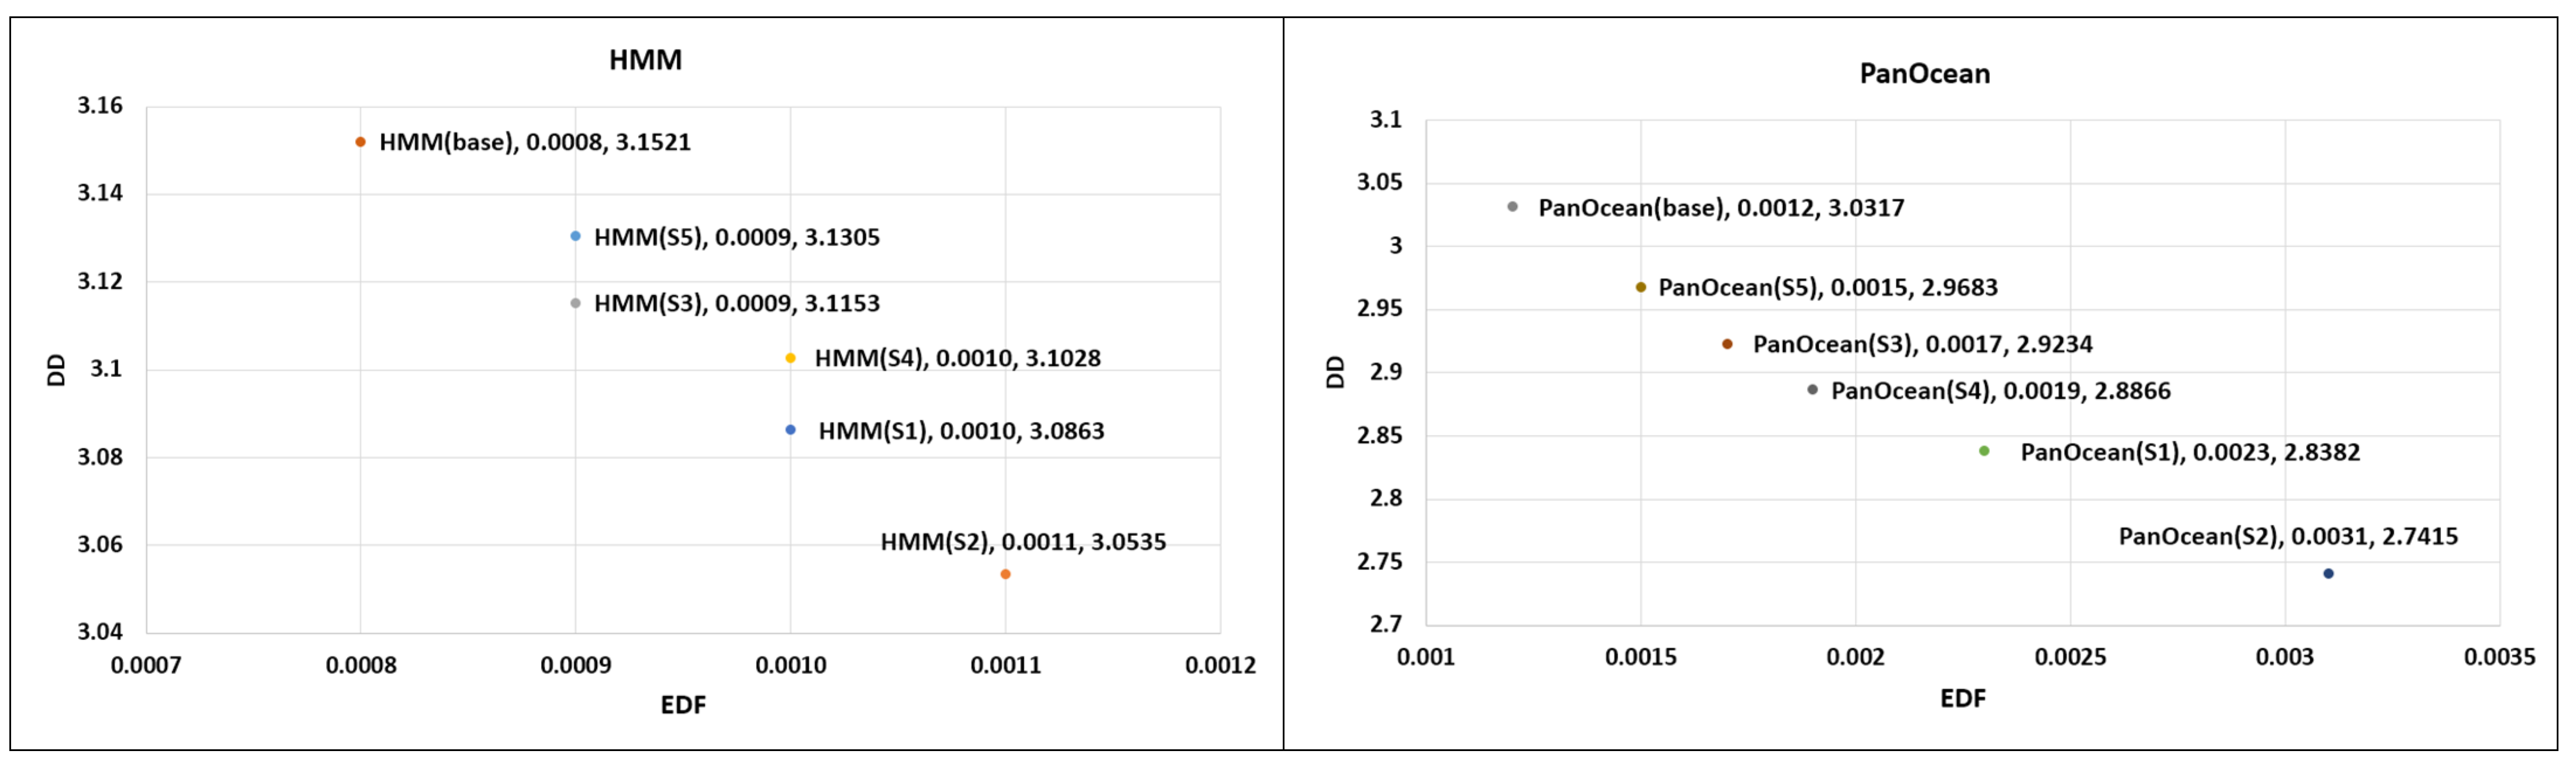
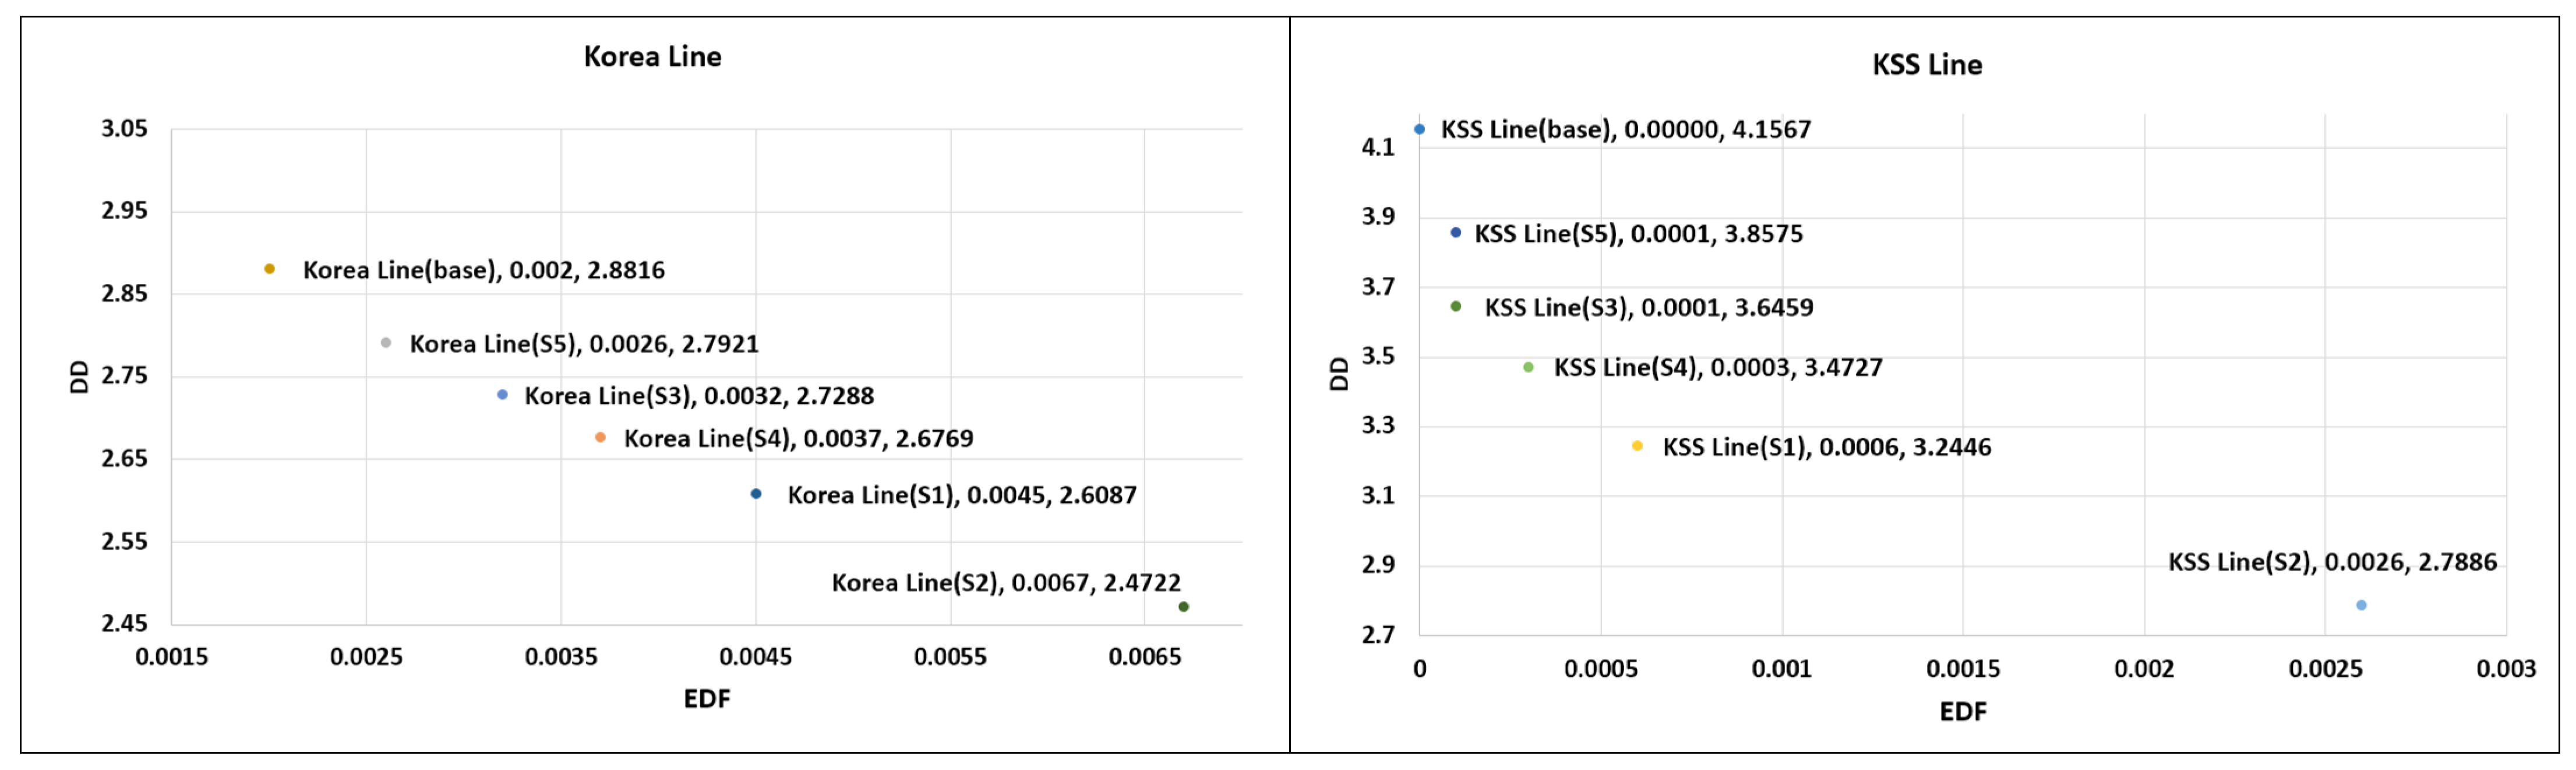
| Category | DD | EDF |
|---|---|---|
| HMM (base) | 3.1521 | 0.0008 |
| HMM (S1) | 3.0863 | 0.001 |
| HMM (S2) | 3.0535 | 0.0011 |
| HMM (S3) | 3.1153 | 0.0009 |
| HMM (S4) | 3.1028 | 0.001 |
| HMM (S5) | 3.1305 | 0.0009 |
| Pan Ocean (base) | 3.0317 | 0.0012 |
| Pan Ocean (S1) | 2.8382 | 0.0023 |
| Pan Ocean (S2) | 2.7415 | 0.0031 |
| Pan Ocean (S3) | 2.9234 | 0.0017 |
| Pan Ocean (S4) | 2.8866 | 0.0019 |
| Pan Ocean (S5) | 2.9683 | 0.0015 |
| Korea Line (base) | 2.8816 | 0.002 |
| Korea Line (S1) | 2.6087 | 0.0045 |
| Korea Line (S2) | 2.4722 | 0.0067 |
| Korea Line (S3) | 2.7288 | 0.0032 |
| Korea Line (S4) | 2.6769 | 0.0037 |
| Korea Line (S5) | 2.7921 | 0.0026 |
| KSS Line (base) | 4.1567 | 0.00000 |
| KSS Line (S1) | 3.2446 | 0.0006 |
| KSS Line (S2) | 2.7886 | 0.0026 |
| KSS Line (S3) | 3.6459 | 0.0001 |
| KSS Line (S4) | 3.4727 | 0.0003 |
| KSS Line (S5) | 3.8575 | 0.0001 |
Disclaimer/Publisher’s Note: The statements, opinions and data contained in all publications are solely those of the individual author(s) and contributor(s) and not of MDPI and/or the editor(s). MDPI and/or the editor(s) disclaim responsibility for any injury to people or property resulting from any ideas, methods, instructions or products referred to in the content. |
© 2025 by the authors. Licensee MDPI, Basel, Switzerland. This article is an open access article distributed under the terms and conditions of the Creative Commons Attribution (CC BY) license (https://creativecommons.org/licenses/by/4.0/).
Share and Cite
Kim, H.; Park, S. The Impact of IMO Market-Based Measures on Korean Shipping Companies: A Focus on the GHG Levy. Sustainability 2025, 17, 6524. https://doi.org/10.3390/su17146524
Kim H, Park S. The Impact of IMO Market-Based Measures on Korean Shipping Companies: A Focus on the GHG Levy. Sustainability. 2025; 17(14):6524. https://doi.org/10.3390/su17146524
Chicago/Turabian StyleKim, Hanna, and Sunghwa Park. 2025. "The Impact of IMO Market-Based Measures on Korean Shipping Companies: A Focus on the GHG Levy" Sustainability 17, no. 14: 6524. https://doi.org/10.3390/su17146524
APA StyleKim, H., & Park, S. (2025). The Impact of IMO Market-Based Measures on Korean Shipping Companies: A Focus on the GHG Levy. Sustainability, 17(14), 6524. https://doi.org/10.3390/su17146524