Article

Research on the Carbon Footprint of Rural Tourism Based on Life Cycle Assessment: A Case Study of a Village in Guangdong, China

1
School of Environment, South China Normal University, Guangzhou 510006, China
2
Guangdong Provincial Key Laboratory of Chemical Pollution and Environmental Safety, South China Normal University, Guangzhou 510006, China
3
School of Environmental Science and Engineering, Guangzhou University, Guangzhou 510006, China
4
Environmental Education Center, Guangzhou University, Guangzhou 510006, China
*
Authors to whom correspondence should be addressed.
Sustainability 2025, 17(14), 6495; https://doi.org/10.3390/su17146495
Submission received: 18 May 2025 / Revised: 4 July 2025 / Accepted: 11 July 2025 / Published: 16 July 2025

Abstract

In the context of China’s “dual carbon” goals and rural revitalization strategy, scientifically assessing the carbon footprint of rural tourism is essential for promoting the sustainable development of the tourism sector. This study presents the first case analysis of the rural tourism carbon footprint in Guangdong Province, using Village B as a representative example. A tourism carbon footprint model for village B was developed using the life cycle assessment (LCA) method. Based on empirical survey data, the tourism carbon footprint of Village B in 2024 was estimated at 7731.23 t, with a per capita carbon footprint of 38.656 kg/p/a. Among the contributing sectors, transportation accounted for the largest share (85.18%), followed by catering (6.93%) and accommodation (5.10%). As an ecotourism-oriented rural destination, Village B exhibited a relatively low carbon footprint from recreational activities. To facilitate the low-carbon transition of rural tourism in the study area and accelerate progress toward the “dual carbon” targets, it is recommended to optimize public transport infrastructure, promote green mobility, enhance the energy efficiency of rural dining and accommodation, and raise awareness of low-carbon tourism.

1. Introduction

As a central component of China’s rural revitalization strategy, rural tourism has capitalized on rich natural resources and cultural heritage to become a major driver of rural economic growth. In 2019, rural tourism in China recorded 3.09 billion visits, accounting for over half of all domestic tourism trips. By 2022, rural tourism represented 89.4% of total domestic tourist visits [1]. In the post-pandemic era, rural tourism has experienced rapid growth, but it has also posed significant challenges to environmental sustainability, particularly in terms of carbon emissions. In recent years, global efforts to advance sustainable tourism have intensified. The European Union’s “Green Deal” explicitly outlines emission reduction targets for the tourism sector, while China’s 14th Five-Year Plan emphasizes the transition toward green and low-carbon tourism. Following the introduction of the Paris Agreement and the Glasgow Declaration, the tourism industry’s responsibility in reducing emissions and achieving carbon neutrality has become increasingly prominent. Notably, the Glasgow Declaration aims to halve tourism-related carbon emissions by 2030 and achieve net-zero emissions by 2050 [2]. These objectives necessitate evidence-based actions in measuring, managing, and mitigating tourism-related carbon footprints [3].
As the global pursuit of carbon neutrality accelerates, measuring and reducing tourism-related carbon footprints have emerged as key research priorities. The tourism carbon footprint, a crucial indicator of the environmental impact of tourism activities, directly reflects the extent and intensity of energy consumption and greenhouse gas emissions across the tourism lifecycle. Within the framework of China’s “dual carbon” targets, examining the carbon footprint of rural tourism holds important theoretical and practical implications. Quantifying rural tourism’s contribution to carbon emissions facilitates the identification of key processes and emission hotspots. Moreover, it provides a scientific foundation for formulating low-carbon tourism policies, optimizing resource allocation, and raising tourists’ environmental awareness. Therefore, accurately measuring and effectively managing the carbon footprint of rural tourism has become essential to promoting rural revitalization and sustainable development.
The tourism carbon footprint refers to the amount of carbon dioxide equivalent emissions generated both directly and indirectly by tourism activities [4]. It encompasses the entire travel process—from departure to destination—including transportation, accommodation, dining, shopping, entertainment, and other related activities that contribute to both direct and indirect carbon emissions. According to previous studies, the calculation of tourism’s carbon footprint primarily includes emissions from transportation, accommodation, dining, sightseeing, entertainment, shopping, and other aspects [4,5,6,7]. The calculation scope, influencing factors, and key assessment areas are summarized in Table 1.
Existing research on tourism carbon footprints primarily focuses on broader geographical scales, including global [27], national [22,28,29], provincial [30,31], municipal [5,6], and regional [32,33] levels. However, there is a notable lack of carbon emission data at the microscale, particularly for rural tourism. Empirical studies focusing on specific rural areas remain limited, particularly in resource-rich regions such as Guangdong. Existing studies have yet to establish a standardized measurement framework for rural tourism carbon footprints [26,34,35,36], resulting in ambiguous measurement boundaries. Internal tourism-related transportation emissions are often considered, whereas external transportation and indirect emissions, such as those from waste treatment, are frequently overlooked. Moreover, many rural tourism destinations lack reliable statistical infrastructure. Emission coefficients are typically derived from regional or industry-wide averages, limiting their accuracy in representing specific rural contexts.
The life cycle assessment (LCA) method enables a comprehensive evaluation of rural tourism’s carbon footprint. To improve the accuracy of carbon footprint calculations, this study presents the first case analysis of rural tourism carbon footprint in Guangdong Province. Guangdong Province, a major economic region with a rapidly growing rural tourism sector, was selected as the case study area. Village B, a representative site with rapidly developing rural tourism, was selected to develop a more comprehensive carbon footprint model using the LCA method. The study also explores practical data collection methods, systematically analyzes emission sources and characteristics, and examines the potential and challenges of aligning rural tourism with the “dual carbon” goals and rural revitalization. It further seeks pathways for the low-carbon transformation of rural tourism consistent with the “dual carbon” targets. This research advances the theoretical understanding of rural tourism carbon footprints and fills a critical research gap in Guangdong Province by providing empirical evidence for sustainable development. It also establishes an empirical foundation for integrating the “dual carbon” goals with rural revitalization strategies, offering practical insights for policymakers and community stakeholders.

2. Materials and Methods

2.1. Study Area

Village B is located in Town A, Conghua District, Guangzhou, Guangdong Province, China, in the central region of the province, northeast of Guangzhou City. It is geographically positioned at 113°17′–114°04′ E and 23°22′–23°56′ N [37]. The village covers a total administrative area of 503.39 hectares. It is approximately one hour by car from the center of Conghua with convenient regional transportation. As shown in Figure 1, Village B is situated near several natural scenic sites, including Paitan Phoenix Mountain Forest Park, Baishuizhai Scenic Spot, Dafengmen Forest Park, Conghua Hot Spring Scenic Spot, Shimen National Forest Park, and Nankun Mountain, indicating a pronounced tourism agglomeration effect.
In 2016, Village B was designated as a tourism-oriented village emphasizing sightseeing and leisure as part of the third batch of provincial-level new rural demonstration areas in Guangzhou. With a forest coverage rate of 97%, Village B features five distinct ecological elements: mountains, springs, forests, streams, and rocks. Leveraging its natural and cultural resources, the village has developed a diverse portfolio of rural tourism offerings, including specialty cuisine, recreational activities, agricultural experiences, performing arts, and unique shopping, forming an integrated cultural-tourism complex. The rapid growth of rural tourism has contributed to increased household income and improved industrial efficiency. The per capita annual income of villagers increased from 16,200 yuan in 2016 to 38,000 yuan in 2022 [38], representing a 134.6% increase. Village B has received seven national-level honors, such as “China’s Beautiful Leisure Village”, ”National Forest Village”, “Key National Rural Tourism Village”, and “National AAA Tourism Scenic Area”, along with twelve provincial-level recognitions, including “Guangdong Province Cultural and Tourism Specialty Village” and “Top Ten Beautiful Villages in Guangdong Province”. Additionally, it has earned eleven city-level accolades and was selected as one of the “Top Ten Innovative Cases of Rural Party Building in Guangdong”. The village has attracted national-level recognition and has become a benchmark for rural revitalization in both Guangdong Province and China as a whole. It has also been identified as a representative case in the “Project of High-quality Development in Hundred Counties, Thousands Towns and Ten Thousand Villages”.

2.2. Data Source

Survey Design: A structured questionnaire was designed to collect data on tourists’ transportation modes (e.g., private car, bus), sightseeing behaviors, travel origins, accommodation conditions, and participation in recreational activities. The questionnaire comprised both closed-ended questions (e.g., options for transportation mode) and open-ended questions (e.g., details on tourist activities). To ensure content validity, a pilot survey was conducted, and ambiguous questions were revised accordingly. The survey yielded data on round-trip transportation distances, transportation modes, energy sources, and levels of energy consumption. Carbon footprints associated with transportation and sightseeing were calculated using corresponding transportation energy coefficients.
Survey Distribution and Collection: A random sampling method was adopted, and questionnaires regarding the rural tourism carbon footprint of Village B were distributed from January to October 2024 (see Appendix A). The survey period encompassed both peak tourist seasons (e.g., holidays) and off-peak periods. Face-to-face interviews were conducted to enhance the response rate and ensure timely data collection. A total of 740 questionnaires were distributed, and 690 valid responses were obtained, yielding a response rate of 93.2%. The survey was conducted in accordance with ethical standards, and all respondents participated voluntarily.
Field Investigation: Between January and October 2024, field investigations were conducted (see Appendix B: Energy-related Interviews in the Rural Tourism Destination of Village B). Data on energy consumption for accommodation, dining, and shopping were gathered through interviews with 23 homestays, 10 restaurants, and 21 shops, supplemented by electricity bills and operation records. Waste carbon footprints were estimated through interviews with personnel from the local waste management department. All fieldwork complied with ethical research standards, and participation was entirely voluntary.
Standard Data: Standard data were obtained from official sources, including the “China Energy Statistical Yearbook (2023)”, General rules for calculation of the comprehensive energy consumption (GB/T 25890-2020) [39], and relevant academic literature.

2.3. Methods

A comprehensive literature review suggests that a tourist’s carbon footprint spans the entire tourism life cycle, including transportation, accommodation, dining, entertainment, shopping, and waste disposal. Consequently, this study primarily quantifies the carbon footprints of tourism transportation, accommodation, activities, and dining from the tourists’ perspective, using a bottom-up approach. The life cycle assessment method was employed to evaluate and quantify the rural tourism carbon footprint in Village B. Drawing on the carbon footprint measurement methods proposed by scholars such as Xiao Jianhong [32], Xie Yuanfang [40], Luo Chunlin [41], and Ding Yulian [42], this study establishes a more comprehensive model for assessing the rural tourism carbon footprint in Village B, as elaborated in Section 2.3.1, Section 2.3.2, Section 2.3.3, Section 2.3.4, Section 2.3.5, Section 2.3.6 and Section 2.3.7. All symbols and their meanings are provided in Appendix C.

2.3.1. Tourism Transportation Carbon Footprint Model

This section quantifies the direct and indirect carbon footprints resulting from tourists’ energy consumption during transportation to and from rural tourism destinations.
C1 = ∑(Na × Da × ρa) × 2
where C1 denotes the carbon footprint of tourism transportation (kg); Na denotes the total number of tourists using transportation mode a (p); Da denotes the distance traveled by transportation mode a (km); and ρa denotes the carbon emission factor per person per kilometer for transportation mode a (kg CO2/p/km), as presented in Table 2. To simplify the analysis, it is assumed that tourists use the same mode of transportation for both outbound and return journeys. Accordingly, the derived formula quantifies the carbon footprint associated with tourists’ transportation between their origin and destination.

2.3.2. Tourism Accommodation Carbon Footprint Model

This section quantifies the direct and indirect carbon footprints associated with tourist accommodation activities. These primarily include carbon emissions resulting from energy consumption across various accommodation types at the destination, encompassing indirect carbon emissions from electricity use and direct carbon emissions from fossil fuel consumption. In rural tourism destinations, accommodation types typically include homestays, inns, and budget hotels. Based on the equation “Carbon emissions = Energy consumption × Emission factor”, the carbon emission calculation method for rural tourism accommodation is developed, as detailed in the following equations:
C2 = ∑C2b
C2b = ∑Ebi × Ci × EFce
where C2 denotes the carbon footprint of tourism accommodations (kg); C2b denotes the carbon footprint of the b-th accommodation facility (kg); Ebi denotes the energy consumption of the i-th energy type at the b-th accommodation facility; Ci denotes the conversion factor for converting the i-th type of energy to standard coal, as presented in Table 3; and EFce denotes the CO2 emission factor for standard coal, with an empirical value of 2.45 kg CO2/kg standard coal [47].

2.3.3. Tourism Catering Carbon Footprint Model

This study primarily quantifies the carbon footprint resulting from energy consumption in the catering sector during the provision of food and services to tourists, while it does not incorporate upstream emissions from agricultural production of food consumed by tourists, mainly due to limited local primary data availability.
C3 = ∑Ecj × Cj × EFce
where C3 denotes the carbon footprint of tourism catering (kg); Ecj denotes the energy consumption of the j-th type of energy at the c-th restaurant; Cj denotes the conversion factor for converting the j-th energy type to standard coal, as presented in Table 3; and EFce denotes the CO2 emission factor for standard coal, with an empirical value of 2.45 kg CO2/kg for standard coal.

2.3.4. Tourism Recreation Carbon Footprint Model

This study quantifies the direct and indirect carbon footprints associated with tourists’ participation in traditional rural festivals, folk activities, outdoor sports, agricultural production experiences, and other recreational activities in rural tourism destinations.
C4 = ΣEd × Qd
where C4 denotes the carbon footprint of tourism recreational activities (kg); Ed denotes the number of participants in recreational activity d (p); and Qd denotes the carbon emission factor for energy consumption for recreational activity d (kg/p).

2.3.5. Tourism Sightseeing Carbon Footprint Model

This study quantifies the direct and indirect carbon footprints associated with tourists’ vehicle travel for sightseeing of natural ecosystems, folk culture, and agricultural production activities in rural tourism destinations.
C5 = ∑(Ne × De × ρe) × 2
where C5 denotes the carbon footprint of tourist sightseeing (kg); Ne denotes the total number of tourists using transportation mode e (p), De denotes the distance traveled by transportation mode e (km); and ρe denotes the carbon emission factor per person per kilometer for transportation mode e (kg CO2/p/km), as presented in Table 2.

2.3.6. Tourism Shopping Carbon Footprint Model

This study primarily quantifies the indirect carbon footprint associated with energy consumption in the production of goods (e.g., agricultural products) and the provision of retail services during shopping activities.
C6 = ∑Efk × Ck × EFce
where C6 denotes the carbon footprint of tourism shopping (kg); Efk denotes the energy consumption of the k-th energy type at the f-th retail store; Ck denotes the conversion factor for converting the k-th energy type to standard coal, as presented in Table 3; and EFce denotes the CO2 emission factor for standard coal, with an empirical value of 2.45 kg CO2/kg standard coal.

2.3.7. Tourism Waste Carbon Footprint Model

This study quantifies the direct and indirect carbon footprints associated with waste disposal throughout the tourism process, accounting for energy consumption from waste transportation and incineration.
C7 = ∑(Ln × ρn × Wn × EFce) + ∑(IWn × CCWn × FCFn × EFn × 44/12
where C7 denotes the carbon footprint of waste disposal at the tourism site (kg); Ln denotes the transportation distance for the n-th types of waste (km); ρn denotes the energy consumption factor for transporting the n-th waste type (kgce/t/km), as presented in Table 4; Wn denotes the mass of the n-th waste type transported (t); EFce denotes the CO2 emission factor for standard coal, with an empirical value of 2.45 kg CO2/kg standard coal; IWn denotes the mass of the n-th solid waste type incinerated (t); CCWn denotes the carbon content in the dry matter of the n-th waste type (%); FCFn denotes the proportion of mineral carbon in the total carbon of the n-th waste type (%); EFn denotes the complete combustion efficiency of the incinerator for the n-th solid waste type(%); and 44/12 is the conversion coefficient of carbon to carbon dioxide. According to the IPCC Guidelines for National Greenhouse Gas Inventories, the carbon content of solid waste (CCWn) is 40%, the proportion of mineral carbon in total carbon (FCFn) is 40%, and the combustion efficiency (EFn) is 95% [48].

2.3.8. Assumptions and Limitations of the Model

The rural tourism carbon footprint model is based on the following assumptions:
(1)
Symmetric Round-Trip Transportation: It is assumed that tourists use the same mode of transportation for both the inbound and outbound journeys. Although this simplification facilitates the calculation process, it may lead to an underestimation of emissions if different transportation modes are used for each leg (e.g., taxi for arrival and bus for departure).
(2)
Static Energy Structure: Energy conversion coefficients (e.g., electricity emission factor) are derived from the 2023 national average and do not account for dynamic regional variations in energy structure.
(3)
Seasonal Homogeneity: The model assumes that tourist behaviors (e.g., transportation preferences) remain consistent across seasons, potentially overlooking variations between peak and off-peak periods.
In addition, dynamic changes were also taken into account, such as the effects of key variables—including travel distance, energy structure, and the number of tourists—on total carbon emissions. Detailed scenario simulations are provided in Appendix D.

3. Results

3.1. Descriptive Statistical Analysis

Table 5 presents the statistical summary of the basic demographic characteristics of the tourist sample in Village B. The gender distribution is relatively balanced, with male tourists comprising 41.0% (n = 283) and female tourists comprising 59.0% (n = 407). The age distribution is divided into seven groups: under 18, 18–25, 26–30, 31–40, 41–50, 51–60, and over 60 years old. The largest proportion of tourists falls within the 31–40 age group, accounting for 23.6% (n = 163). Educational attainment is classified into five levels: junior high school and below, high school/vocational school/technical school, junior college, undergraduate, and master’s and above. The largest share is represented by undergraduates, accounting for 42.9% (n = 296). Travel modes are grouped into four categories: solo self-guided tour, group or family/friends self-guided tour, travel agency-organized tour, and company-organized tour. The most common mode is a group or family/friends self-guided tour, accounting for 54.9% (n = 379). Regarding length of stay, rural tourists in Village B tend to make short visits, with the majority staying for only one day (66.1%, n = 456).
To provide a comprehensive assessment of the carbon footprint of rural tourism activities in Village B, the following sections analyze seven core sectors: transportation, accommodation, catering, recreation, sightseeing, shopping, and waste management. Each component is quantified based on detailed survey data and standardized emission factors, offering an integrated overview of tourism-related carbon emissions in 2024.

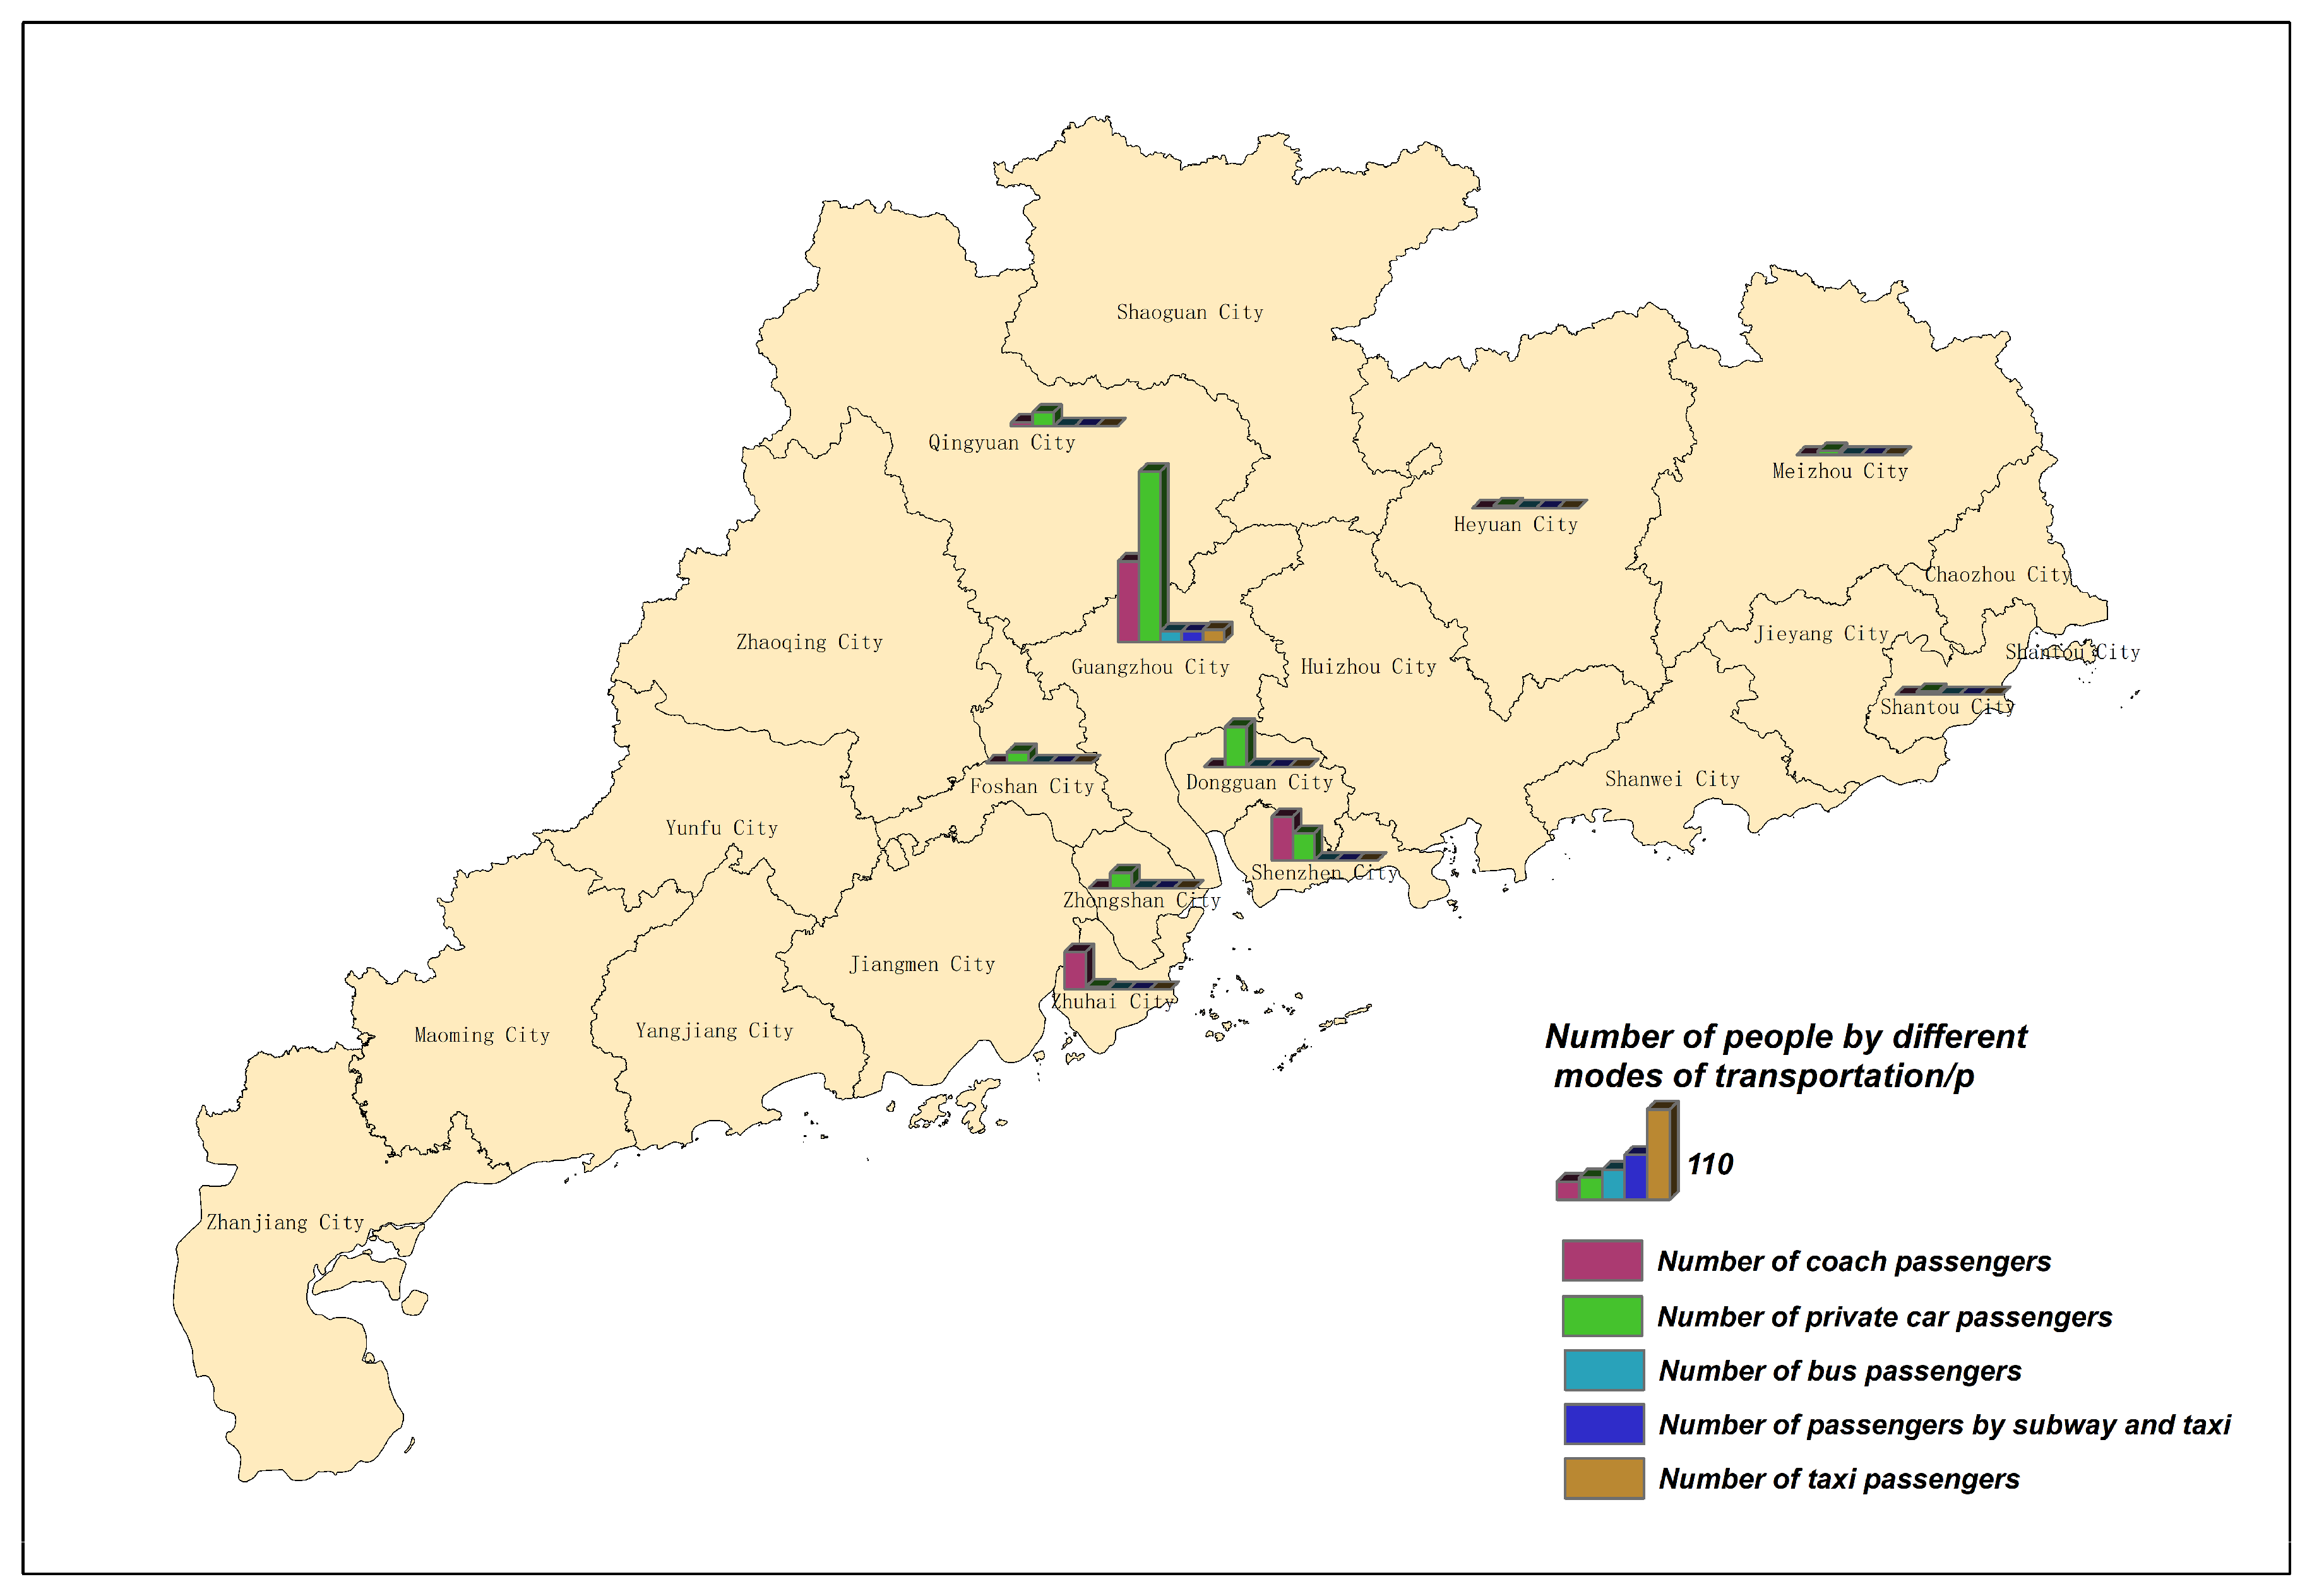
3.2. Tourism Transportation Carbon Footprint

Data from a total of 690 completed questionnaires were collected through a visitor survey, capturing data on tourists’ departure locations and transportation choices when visiting Village B. Owing to its geographical location, the majority of tourists traveling to Village B originate from the Pearl River Delta region. Tourists selected from five modes of transportation: coach, private car, bus, subway and taxi, and taxi. The distribution of transportation modes is as follows: 38.99% coach, 54.64% private car, 2.03% public bus, 2.03% subway and taxi, and 2.32% taxi. The corresponding statistical results are presented in Figure 2. Among all respondents, the majority of tourists—632 in total—were from Guangdong Province. Detailed departure locations and transportation modes for tourists from Guangdong Province are illustrated in Figure 3. A total of 49 tourists were from Macau (all traveled by coach), and 9 tourists were from Guangxi Province (specifically from Yuzhou District, Yulin City), all of whom traveled by private car.
Interviews with village committee members and tourism operators revealed that Village B received 200,000 visitors in 2024. By integrating geographic data to determine average travel distances for different transportation modes and applying Equation (1), the tourism transportation carbon footprint of Village B for 2024 was calculated. The total transportation carbon footprint for the village amounted to 6585.22 tons, while the per capita transportation carbon footprint for tourists was 32.926 kg/p/a. Detailed results are presented in Table 6.

3.3. Tourism Accommodation Carbon Footprint

According to statistics provided by the village committee, there are currently 45 accommodation establishments in Village B, offering a total of 488 beds. Among them, two establishments with more than 40 beds are classified as large homestays, while the remaining 43 establishments with fewer than 40 beds are considered small homestays. Research suggests that small homestays are more prevalent in Village B. Surveys and interviews were conducted to gather information on the types and quantities of energy consumed by these accommodations. On-site interviews were conducted with 23 homestays in Village B (labeled A1 to A23), as presented in Table 7 and Table 8. The surveyed small-scale homestays primarily relied on electricity, with a relatively low proportion of liquefied petroleum gas usage and the lowest proportion of fuelwood consumption. On average, each small-scale homestay emitted 5273 kg (5.2 tons) of CO2 per year, mainly attributable to electricity consumption. Based on the calculated average values, the total annual accommodation-related carbon footprint was 394.56 t/a, with a per capita accommodation carbon footprint of 1.973 kg/p/a.

3.4. Tourism Catering Carbon Footprint

The catering industry in Village B is primarily composed of small restaurants and farmhouses. According to statistics from the village committee, there are currently 24 catering establishments in the village. Only one establishment, B1, with more than 20 tables, is classified as a large restaurant. The remaining establishments, comprising small restaurants and farmhouses with relatively few tables, are classified as small restaurants. Field surveys were conducted at 10 catering establishments (labeled B1 to B10), and the types and quantities of energy consumed are presented in Table 9 and Table 10. The survey also revealed that the food served in Village B’s restaurants is locally sourced from crops grown and livestock raised in the area, resulting in minimal carbon emissions from food transportation. The surveyed restaurants primarily relied on electricity for daily operations, supplemented by liquefied petroleum gas (LPG), while firewood use was nearly eliminated, present only in two establishments. On average, each restaurant emitted approximately 19.58 tons of CO2 per year, with electricity accounting for the majority of emissions. Based on this estimated average, the total carbon footprint of the catering sector was 535.87 t/a, and the per capita dining carbon footprint for tourists was 2.679 kg/p/a.

3.5. Tourism Recreation Carbon Footprint

The survey revealed that entertainment activities in Village B primarily include fruit picking, fish and shrimp fishing, farm work experiences, hiking on mountain boardwalks, leisure activities at Lixia Book Bar, and nighttime firefly watching. As there are no energy-intensive electric amusement facilities, the carbon footprint of rural tourism entertainment is considered negligible.

3.6. Tourism Sightseeing Carbon Footprint

Based on the tourist questionnaire survey, three modes of transportation within Village B were identified: coach, private car, and walking. The proportion of tourists choosing each mode was 14.64%, 26.81%, and 58.55%, respectively, as shown in Figure 4. Among these, walking is a zero-carbon emission mode, indicating that the sightseeing carbon footprint primarily results from coach and private cars. Most tourists participate in activities such as walking along the creekside plank road, strolling through orchards, and playing in streams. Some tourists travel along the village’s main roads by private car or coach. The primary sightseeing route within the village is approximately 1.8 km in length, resulting in a round-trip distance of around 3.6 km. The average travel distance for private cars and coach is assumed to be twice the length of the village’s main road, totaling 3.6 km. Based on our calculations, the total sightseeing carbon footprint in Village B in 2024 was 50.16 t (as shown in Table 11), with a per capita sightseeing carbon footprint of 0.251 kg/p/a.

3.7. Tourism Shopping Carbon Footprint

The survey revealed that there are 21 shopping points in Village B, including 15 small-scale agricultural markets (stall-type vendors) and 6 specialty stores. Products primarily include locally made delicacies such as tofu pudding, herbal jelly, and double-skin milk, as well as locally sourced, ecologically grown produce like lychees, longans, wampee, persimmons, wild ficus hirta, ganoderma lucidum, dried tangerine peel, and other fresh and dried goods. The production of these agricultural products generates relatively low carbon emissions; most emissions arise from the services provided by the stores during the sales process. The 15 small-scale agricultural markets are open-air stalls with no energy consumption, such as electricity, while the 6 specialty stores primarily consume electricity, with minimal variation in usage, averaging 3181 kWh, as shown in Figure 5. According to Equation (7), the total shopping-related carbon footprint of Village B in 2024 was calculated to be 5748 kg (5.75 t), resulting in a per capita shopping carbon footprint of 0.029 kg/p/a. Overall, the carbon footprint associated with shopping in Village B remains relatively low.

3.8. Tourism Waste Carbon Footprint

Tourist-generated waste in Village B primarily consists of kitchen waste, such as leftover food and fruit peels, as well as plastic and paper waste discarded during sightseeing activities. The village is equipped with waste-sorting and recycling stations that categorize waste into recyclables, hazardous waste, kitchen waste, and other waste, as detailed in Table 12.
The survey results suggest that the average amount of kitchen waste generated per tourist is approximately 1.2 kg, while plastic and paper waste contribute around 0.2 kg. The waste-sorting stations in Village B are located 25.3 km from the Seventh Resource Thermal Power Plant, resulting in a round-trip transportation distance of 50.6 km. Based on Equation (8), the carbon footprint associated with rural tourism waste in Village B was calculated. Table 13 and Table 14 present the carbon footprints associated with waste transportation and incineration, respectively.
The results suggest that the total waste-related carbon footprint in Village B for 2024 was 159.67 tons, with a per capita rural tourism waste carbon footprint of 0.798 kg/p/a. Of this total, waste incineration contributed the majority (97.73%), while waste transportation accounted for only 2.27%.

3.9. The Total Tourism Carbon Footprint

Based on the calculated carbon footprints of seven components of rural tourism in Village B—tourism transportation, accommodation, dining, entertainment, sightseeing, shopping, and waste—the total rural tourism carbon footprint of Village B for 2024 is estimated at 7731.23 t, with a per capita carbon footprint of 38.656 kg/p/a. As shown in Figure 6, among these seven categories, tourism transportation accounts for the largest share at 85.45%, followed by tourism dining at 6.95% and tourism accommodation at 5.12%. Comparatively, catering and transportation activities were the largest contributors to the total carbon footprint, jointly responsible for over 90% of emissions from tourism in Village B. This pattern underscores the prevailing tendency within the tourism industry for primary services—namely, transport and food—to constitute the principal contributors to carbon emissions. In contrast, emissions from shopping and entertainment were negligible. This comprehensive analysis underscores both the achievements and the persistent challenges in Village B’s transition to a low-carbon tourism model, indicating that targeted measures in high-emission sectors such as catering and transportation will be essential to support Guangdong’s broader sustainable development agenda.

4. Discussion

Among the various components of tourism in Village B, the carbon footprint is distributed in descending order as follows: transportation, dining, accommodation, waste, sightseeing, shopping, and entertainment. Notably, transportation and dining together account for over 90% of the total tourism carbon footprint. The distribution of the carbon footprint across tourism sectors in Village B shows substantial variation, with transportation contributing the largest share—a pattern consistent with findings from numerous previous studies [5,6,15,41,50,51,52,53,54,55]. This dominance is primarily attributed to the tourists’ reliance on energy-intensive modes of transport, particularly automobiles, to access the destination. The carbon footprint of tourism transportation in Village B accounted for as much as 85.45% of the total, while in China, tourism transportation contributes 67.72% of the overall carbon emissions from the tourism sector, making it the primary source of CO2 emissions in tourism activities [5]. Compared with existing village-level tourism carbon footprint studies, the total carbon footprint of rural tourism in Village B is higher than that of Zhahan Village in Hainan Province in 2019 (1296.3 t) [35] but lower than that of the Huangling Scenic Area in 2016 (9732 t) [34]. The substantial differences in tourism carbon footprints among different villages are largely attributable to variations in the defined calculation boundaries and the scope of included components. In 2024, the per capita tourism carbon footprint in Village B was 38.656 kg/p/a. As a rural tourism destination, this figure exceeds the national average tourism carbon footprint in China (22.7 kg/p/a) [36], as well as those of other rural tourist destinations, including Wuyuan Huangling in Jiangxi Province (13.770 kg/p/a) [34], Zhahan Village in Hainan [35], the provincial average of Shanxi (7.448 kg) [56], and Jigong Mountain Scenic Area in Henan Province (36.644 kg/p/a) [57], while remaining lower than the provincial average of Jiangsu (145.1 kg/p/a) [58]. Overall, the per capita carbon footprint of rural tourism in Village B is comparatively high. This is primarily because Village B is characterized as an ecotourism- and sightseeing-oriented destination, where emissions from entertainment, sightseeing, and shopping are comparatively low. This is consistent with the relatively low proportion of carbon emissions from shopping and recreational activities observed in the four-day tour of Guilin [59]. However, the substantial carbon footprint associated with transportation, accommodation, and dining—particularly due to the heavy reliance on private cars—significantly contributes to the elevated total footprint. Consequently, enhancing the village’s capacity for low-carbon and sustainable development is urgently needed.
Regarding the carbon footprint distribution across different modes of tourism transportation, private cars contribute a substantial 92.32% of the total, followed by coach at 5.52%. This suggests that tourism transportation in Village B primarily relies on high-carbon travel modes. Although 54.64% of tourists travel to Village B by private vehicle, they are responsible for 92.32% of the total tourism transportation carbon footprint. In contrast, 38.99% of tourists use coaches, which contribute only 5.52% of the carbon footprint. This disparity is primarily due to the significantly higher carbon emission factor of private cars compared to coaches. Despite Village B being in proximity to the Guangzhou-Shenzhen Expressway entrance (only 3 km away), public transportation adoption is limited. Only 2.03% of tourists take public buses, while another 2.03% use a combination of metro and taxis to reach the village. This highlights the inadequacy of public transportation infrastructure, as no direct metro line or dedicated tourist shuttle service is available to the destination. Village B, located in central Guangdong Province, primarily attracts local tourists. Data shows that 91.6% of visitors originate from within Guangdong, with only a small proportion arriving from other provinces. Given the region’ developed economy and high private vehicle ownership in the Pearl River Delta, many tourists prefer flexible self-driving trips, especially considering the relatively short travel distance to Village B (typically one to several hours by car). Additionally, time-sensitive tourists from the Pearl River Delta tend to prioritize the convenience and flexibility of private vehicle use over the limitations of public transportation, where inadequate service frequency and limited coverage further reinforce this preference. As a result, the tourism transportation carbon footprint in Village B is heavily concentrated in private vehicle use, reflecting a structural mismatch between decentralized travel behavior and the lack of an integrated, low-carbon transportation system. To reduce carbon emissions, it is essential to optimize the transportation structure by expanding public transit coverage, promoting carpooling, and encouraging the adoption of more energy-efficient travel modes.
Additionally, homestays in Village B primarily utilize electricity, liquefied petroleum gas (LPG), and firewood as energy sources, with significant variation in energy usage structure across establishments. A limited number of homestays still rely on firewood, which is associated with high carbon emissions. The average carbon footprint per large homestay is significantly higher than that of rural tourism homestays in Songkou Town, while the average carbon footprint per small homestay is relatively comparable. However, the average carbon footprint per small restaurant in Village B is considerably higher than in Songkou Town, primarily due to greater energy consumption from electricity, LPG, and firewood [55]. Since retail products included in the tourism sightseeing carbon footprint model were not considered, particularly the carbon emissions arising from food production for tourism purposes, this omission leads to an underestimation of CO2 emissions compared to the typical food consumption of local residents [60], and the calculated catering-related carbon footprint of Village B should be regarded as conservative. The carbon footprint associated with sightseeing activities remains low, as there are no large-scale energy-consuming sightseeing facilities, and most tourists explore the village on foot. A small portion of tourists use private cars or coaches within the village; however, their contribution to the total sightseeing carbon footprint is minimal. With respect to shopping-related carbon emissions, specialty stores in Village B primarily rely on electricity, resulting in relatively consistent carbon footprint levels, which remain low overall. The carbon footprint of tourism waste is mainly attributed to incineration, with a much smaller proportion originating from waste transportation. Therefore, strategies such as encouraging low-carbon diets and enhancing recycling rates could effectively mitigate the carbon footprint associated with tourism waste.
To simultaneously advance the “dual carbon” goals and the rural revitalization strategy—and in alignment with the policy directives of Guangdong Province’s “Hundred Counties, Thousand Towns, Ten Thousand Villages High-Quality Development Project” (“Hundred, Thousand and Ten Thousand Project”), the following recommendations are proposed:
(1)
Promote green mobility and reduce dependence on private cars. Establish dedicated electric shuttle bus routes serving scenic areas, and collaborate with shared mobility platforms (such as Meituan and HelloBike) to deploy shared electric bicycles. Optimize the regional transportation network by leveraging rural infrastructure upgrading plans under the “Hundred, Thousand and Ten Thousand Project”, thereby facilitating the connection of Village B with the main urban area of Guangzhou and nearby tourist destinations through low-carbon public transport lines. Simultaneously, we recommend changing the functioning models of rural tourism and improving the spatial organization of tourism infrastructure. This can be achieved by strategically locating key supporting services (such as accommodation and catering) and applying the 15 min city model, so that tourist travel distances are confined to walking range, thereby effectively reducing carbon emissions from transportation [61].
(2)
Innovate waste management strategies and enhance the resource recovery of kitchen waste by introducing small-scale bioconversion systems capable of transforming food waste into organic fertilizers for local agricultural use, thereby reducing emissions from incineration. In addition, a “Low-Carbon Tourism App” could be developed to implement a carbon credit incentive system, rewarding tourists who choose public transport or actively participate in waste sorting. These carbon points could be exchanged for consumption vouchers redeemable within the scenic area. Moreover, a pilot program for low-carbon tourism certification could be established in Village B in collaboration with the Guangdong Provincial Department of Culture and Tourism. This initiative would involve developing “Low-Carbon Rural Tourism Certification Standards” covering key aspects such as energy efficiency, waste management, and environmentally responsible tourist behavior, supported by targeted funding under the “Hundred, Thousand and Ten Thousand Project”.

5. Conclusions

This study conducted a case analysis of the carbon footprint of rural tourism in Guangdong Province, with Village B serving as a representative example. A tourism carbon footprint model for the village was developed based on the life cycle assessment (LCA) method, and quantitative calculations and analysis of the village’s rural tourism carbon footprint were conducted using empirical survey data. The main findings of the study are as follows:
(1)
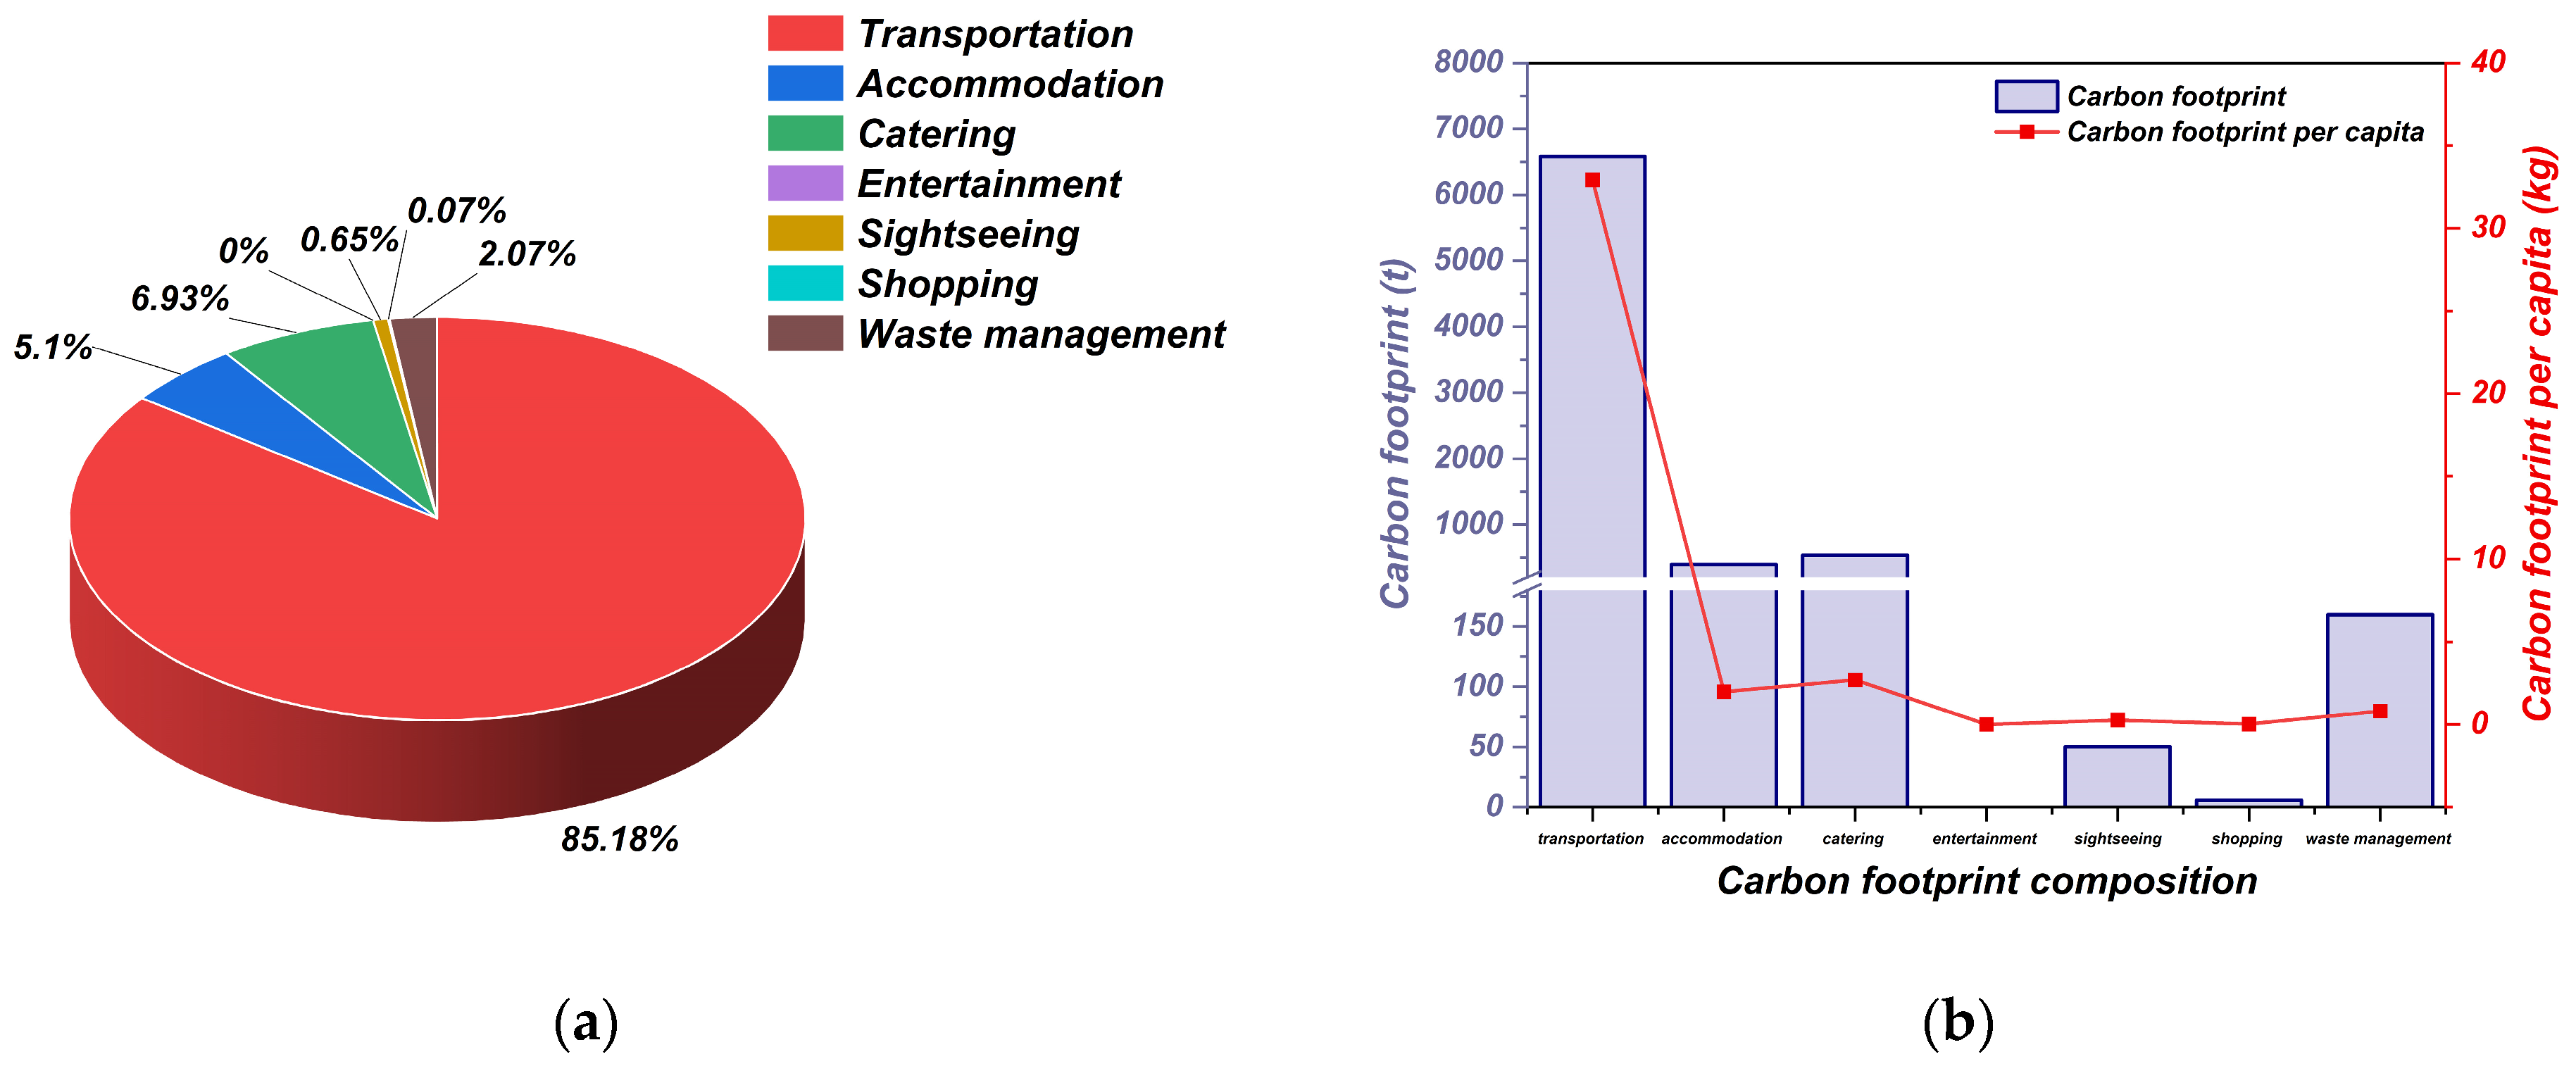
In 2024, tourism transportation constituted the largest portion of Village B’s rural tourism carbon footprint, accounting for 85.18% of the total. Tourism’s dining and accommodation accounted for 6.93% and 5.10%, respectively, while the combined carbon footprint of waste, touring, shopping, and entertainment was less than 3%. Together, transportation and dining comprised over 90% of the total carbon footprint, making them the primary sources of carbon emissions and key targets for mitigation efforts. The mismatch between the decentralized travel pattern and the limited availability of low-carbon, centralized transportation infrastructure must be addressed to reduce carbon emissions. Optimizing the transportation structure—such as expanding public transport coverage and promoting carpooling—and encouraging tourists to adopt more efficient travel modes are essential. Additionally, transitioning dining services to clean energy is imperative. This includes replacing high-carbon fuels with cleaner alternatives and offering subsidies to restaurants still relying on firewood, encouraging a shift to liquefied petroleum gas (LPG) and the gradual elimination of high-emission fuels.
(2)
In 2024, the total rural tourism carbon footprint of Village B was 7,731.23 tons, with an average per tourist carbon footprint of 38.656 kg/p/a. Compared to existing studies, this per capita value is relatively high, suggesting that the village’s capacity for low-carbon, sustainable development is at a relatively low level. Therefore, to simultaneously advance the “dual carbon” goals and rural revitalization strategy—and in alignment with the policy direction of Guangdong Province’s “Project of High-quality Development in Hundred Counties, Thousands Towns and Ten Thousand Villages” (“Hundred, Thousand and Ten Thousand Project”)—it is essential to enhance low-carbon practices across key sectors. These include strengthening energy transformation in dining services, promoting low-carbon transportation, expanding public transit infrastructure, and improving energy efficiency and emission reduction management in accommodation, catering, and waste treatment facilities.
Overall, this micro-level, data-driven assessment not only provides an empirical foundation for quantifying rural tourism carbon emissions in Guangdong Province but also offers actionable insights that can inform broader decarbonization policies. By demonstrating that transportation-related emissions dominate the carbon footprint, this study underscores the urgency of integrating low-carbon mobility planning into rural revitalization strategies. Moreover, the methodological framework can serve as a replicable model for other rural destinations throughout China, as well as for ecologically sensitive areas elsewhere. At the policy level, embedding carbon footprint assessments into regional tourism development plans, incentivizing clean energy transitions in rural businesses, and promoting environmental awareness among stakeholders will be critical steps to align rural tourism growth with national “dual carbon” goals and international climate commitments such as the Glasgow Declaration.

6. Limitations and Outlook

This study has some limitations. First, the study assumes that tourists use the same mode of transportation for both outbound and return trips. Although this assumption simplifies the calculation process, variations in transportation modes for return trips may lead to deviations in carbon footprint estimates. Due to data limitations, the catering carbon footprint model did not incorporate upstream emissions from the production of food consumed by tourists. Future research could expand the carbon emissions inventory to include supply chain emissions from livestock and other food production activities. Second, data collection was limited to the year 2024, without longitudinal or multi-year tracking. The study also assumes consistency in tourist behavior across peak and off-peak periods, without conducting comparative seasonal analysis. Future research should incorporate seasonal comparisons and conduct cross-year longitudinal studies. Additionally, the methodology could be enhanced by systematically collecting seasonal data across multiple years to enable more robust and comprehensive scenario-based analyses of seasonal variability. Moreover, this study does not comprehensively address carbon management strategies. Although the carbon footprint was quantitatively assessed, the collaborative mechanisms among stakeholders—such as local governments, tourism enterprises, and community organizations—were not systematically examined. Future studies should incorporate policy document analysis and stakeholder interviews to enrich the governance dimension of carbon footprint reductions. Future research could leverage the rural digital platform of Guangdong Province’s “Project of High-quality Development in Hundred Counties, Thousands Towns and Ten Thousand Villages” to build a dynamic carbon footprint monitoring system for Village B. Such a system could facilitate real-time monitoring of emission reduction efforts and serve as a replicable model for promoting low-carbon transitions in rural tourism.

Author Contributions

J.W.: conceptualization, formal analysis, investigation, methodology, project administration, data analysis, writing—original draft, writing—review and editing. P.W.: investigation, review and editing. M.W.: investigation, review and editing. Y.H.: project administration, methodology, supervision, writing—review and editing. J.L.: project administration, methodology, supervision, writing—review and editing. All authors have read and agreed to the published version of the manuscript.

Funding

This study was supported by the Science and Technology Program of Guangzhou [Grant No. 2023A04J2051] and the Demonstration Construction Project of “Curriculum with Ideological-Political Elements” for Graduate Students of Guangzhou University in 2022 [Grant No. 05].

Institutional Review Board Statement

Not applicable.

Informed Consent Statement

Informed consent was obtained from all subjects involved in the study.

Data Availability Statement

No supplementary data. The data presented in this study are available on request from the corresponding author. The data are not publicly available because the data in this article were obtained through a questionnaire survey. This study was supported by the respondents, but at the same time, the authors promised that the respondents’ information would not be made public.

Conflicts of Interest

The authors declare no conflicts of interest.

Appendix A

Village B Rural Tourism Carbon Footprint Survey Questionnaire
Dear Tourist Friend,
Hello!
We are students from South China Normal University. This survey aims to understand the carbon footprint of rural tourism during your visit to Village B, with the goal of providing policy recommendations for low-carbon rural tourism development. This survey is anonymous, and the collected data will be used solely for academic research. Please feel free to fill it out, as there are no right or wrong answers—just respond based on your actual situation. Your participation will provide invaluable support and help for our research.
We sincerely appreciate your time and support!
1. Your Gender:
① Male ② Female
2. Your Age:
① Under 18 ② 18–25 ③ 26–30 ④ 31–40 ⑤ 41–50 ⑥ 51–60 ⑦ Over 60
3. Your educational level:
① Junior high school and below
② High school/vocational school/technical school
③ Junior college
④ Undergraduate
⑤ Master and above
4. What is your mode of travel for this trip?
① Solo self-guided tour
② Group or family/friends self-guided tour
③ Travel agency-organized tour
④ Company-organized tour
⑤ Other: __________
5. How many people are traveling with you on this trip? (Including yourself, family, and friends): __________
6. How long will you stay in Village B?
① 1 day ② 2 days ③ 3 days ④ 4 days ⑤ 5 days ⑥ Other: __________
7. What is your departure location for this trip?
Province: __________ City: __________ District/Town: __________
8. What is the primary mode of transportation you used to travel to Village B? (Multiple choices allowed)
① Airplane
② Train/Bullet train/High-speed rail
③ Coach
④ Private car
⑤ Bus
⑥ Subway
⑦ Taxi
⑧ Other: __________
9. What is your primary mode of transportation within Village B?
① Coach
② Private car
③ Bus
④ Electric scooter
⑤ Walking
⑥ Other: __________
10. What are the main recreational activities you participated in within Village B?
__________________________________________________
Thank you for taking the time to support our research. We sincerely appreciate your help!

Appendix B

Energy-related Interviews in the Rural Tourism Destination of Village B
Dear Sir/Madam,
Hello!
We are students from South China Normal University. We sincerely appreciate your participation in this interview survey despite your busy schedule. This interview aims to study the energy consumption in the rural tourism destination of Village B, providing references for energy conservation and emission reduction in rural tourism areas. We assure you that this survey will be conducted entirely anonymously, and the collected data will be used solely for academic research. Please feel free to provide accurate responses, and we greatly appreciate your support and cooperation!
Section 1: Homestay Interview
1. Name of the homestay: __________
2. Monthly electricity bill: __________
3. Annual electricity bill: __________
4. Annual electricity consumption: __________
5. Types and amount/expenditure of energy used for lighting, air conditioning, heating, hot water supply, and cooking in the homestay:
Natural gas: __________
Coal: __________
Firewood: __________
Liquefied petroleum gas (LPG): __________
Other energy sources: __________
6. Customer sources of homestay guests: __________
7. Number of rooms: __________Number of beds: __________
8. Annual average occupancy rate: __________
9. Total number of guests per year: __________
10. Annual revenue:__________
11. Types of disposable items provided by the homestay: __________
12. Does the homestay have energy-saving and emission reduction strategies and measures?
Yes: __________
No: __________
Section 2: Catering Interview
1. Name of the farm-based restaurant/farmhouse/restaurant: __________
2. Monthly electricity bill: __________
3. Annual electricity bill: __________
4. Annual electricity consumption: __________
5. Types and amount/expenditure of energy used for food production, processing, storage, transportation, restaurant air conditioning, lighting, and cooking:
Natural gas: __________
Coal: __________
Firewood: __________
Liquefied petroleum gas (LPG): __________
Other energy sources: __________
6. Sources of customers: __________
7. Number of dining tables: __________Number of seats: __________
8. Average daily number of customers: __________
9. Seating occupancy rate: __________
10. Annual revenue: __________
11. Source of food ingredients: __________
12. Average daily amount of food waste:
13. Does the restaurant have energy-saving and emission reduction strategies and measures?
Yes: __________
No ___________
Section 3: Energy Consumption in Tourism Waste Management
1. Garbage collection sites: __________
2. Average daily total amount of garbage: __________
3. Number and frequency of garbage transport vehicles: __________
4. Amount of garbage transported per vehicle per trip: __________
5. Type and amount of energy consumed per garbage transport trip: __________
6. Total annual solid waste volume: __________

Appendix C

Table A1. Consolidated table of all symbols and their meanings.
SymbolsMeanings
C1the carbon footprint of tourism transportation (kg)
Nathe total number of tourists using transportation mode a (p)
Dathe distance traveled by transportation mode a (km)
ρathe carbon emission factor per person per kilometer for transportation mode a (kg CO2/p/km)
C2the carbon footprint of tourism accommodations (kg)
C2bthe carbon footprint of the b-th accommodation facility (kg)
Ebithe energy consumption of the i-th energy type at the b-th accommodation facility
Cithe conversion factor for converting the i-th type of energy to standard coal
EFcethe CO2 emission factor for standard coal, with an empirical value of 2.45 kg CO2/kg standard coal
C3the carbon footprint of tourism catering (kg)
Ecjthe energy consumption of the j-th type of energy at the c-th restaurant
Cjthe conversion factor for converting the j-th energy type to standard coal
C4the carbon footprint of tourism recreational activities (kg)
Edthe number of participants in recreational activity d (p)
Qdthe carbon emission factor for energy consumption for recreational activity d (kg/p)
C5the carbon footprint of tourist transportation (kg)
Nethe total number of tourists using transportation mode e (p)
Dethe distance traveled by transportation mode e (km)
ρethe carbon emission factor per person per kilometer for transportation mode e (kg CO2/p/km)
C6the carbon footprint of tourism shopping (kg)
Efkthe energy consumption of the k-th energy type at the f-th retail store
Ckthe conversion factor for converting the k-th energy type to standard coal
C7the carbon footprint of waste disposal at the tourism site (kg)
Lnthe transportation distance for the n-th types of waste (km)
ρnthe energy consumption factor for transporting the n-th waste type (kgce/t/km)
Wnthe mass of the n-th waste type transported (t)
IWnthe mass of the n-th solid waste type incinerated (t)
CCWnthe carbon content in the dry matter of the n-th waste type (%)
FCFnthe proportion of mineral carbon in the total carbon of the n-th waste type (%)
EFnthe complete combustion efficiency of the incinerator for the n-th solid waste type (%)

Appendix D

Table A2. Scenario simulations.
ScenarioC1 (t)ChangeC2 (t)ChangeC3 (t)ChangeC4 (t)ChangeC5 (t)ChangeC6 (t)ChangeC7 (t)ChangeTotal CFChange
Scenario 16585.220%394.560%535.870%00%50.160%5.750%159.670%7731.230%
Scenario 25742.46−14.68%394.560%535.870%00%41.2−17.86%5.750%159.670%6879.51−11.02%
Scenario 36532.54−0.81%394.560%535.870%00%50.47+0.62%5.750%159.670%7678.86−0.68%
Scenario 45793.77−13.66%394.560%535.870%00%43.87−12.54%5.750%159.670%6933.49−10.32%
Scenario 55977.55−10.17%315.68−19.99%428.64−20.01%00%40.13−20.00%4.64−19.3%127.68−20.04%6894.32−10.84%
Scenario 67899.23+16.63%394.560%535.870%00%60.19+20.00%5.750%159.670%8519.410.20%
Scenario 76585.220%248.83−36.94%530.46−1.01%00%50.160%5.750%159.670%7580.09−1.95%
Scenario 86585.220%248.97−36.90%535.28−0.11%00%50.160%5.750%159.670%7585.05−1.89%
Scenario 1: Primitive; Scenario 2: 20% of private car tourists are shifted to coaches; Scenario 3: 20% of coach tourists are shifted to buses; Scenario 4: 20% of private car tourists are shifted to electric vehicles; Scenario 5: A 20% reduction in the number of tourists; Scenario 6: An increase of 20% in the average travel distance; Scenario 7: 20% of liquefied petroleum gas consumption is replaced by electricity; Scenario 8: 20% of firewood consumption is replaced by electricity; C1: The carbon footprint of tourism transportation; C2: The carbon footprint of tourism accommodations; C3: The carbon footprint of tourism catering; C4: The carbon footprint of tourism recreational activities; C5: The carbon footprint of tourist sightseeing; C6: The carbon footprint of tourism shopping; C7: The carbon footprint of waste disposal at the tourism site; Total CF: The total tourism carbon footprint.
Through scenario simulation, this study quantified the impacts of different intervention measures (Scenario 1–8) on the carbon footprint of individual components (C1–C7) and the total carbon footprint (Total CF). Scenario 1 served as the baseline scenario, while the remaining scenarios simulated the effects of changes in transportation modes, energy structure adjustments, and variations in tourist numbers and travel distances on carbon emissions.
In the transportation intervention scenarios, Scenario 2 (20% of private car tourists are shifted to coaches) resulted in a 14.68% reduction in the transportation carbon footprint (C1), a 17.86% decrease in sightseeing emissions (C5), and an 11.02% reduction in total carbon emissions. This suggests that substituting private cars with coaches is highly effective in reducing both transportation and total carbon footprints, demonstrating the significant benefits of more intensive travel modes in lowering emissions. The results highlight the mitigation potential of encouraging public transport to replace private travel. In contrast, Scenario 3 (20% of coach tourists are shifted to buses) led to only a 0.81% reduction in transportation emissions, a slight increase in sightseeing emissions (+0.62%), and a mere 0.68% reduction in total emissions, suggesting that the difference in unit carbon emissions between long-distance coaches and buses is limited, with relatively low mitigation potential.
Scenario 4 (20% of private car tourists are shifted to electric vehicles) led to a 13.66% reduction in transportation emissions, a 12.54% decrease in sightseeing emissions, and a 10.32% reduction in total emissions, demonstrating the strong decarbonization potential of electric vehicles, especially in contexts where transportation accounts for a substantial share of total emissions.
Regarding demand-side management, Scenario 5 (A 20% reduction in the number of tourists) resulted in a 10.17% decrease in transportation emissions, a 19.99% reduction in accommodation emissions, a 20.01% decrease in catering emissions, a 20.00% reduction in sightseeing emissions, a 19.3% decrease in shopping emissions, and a 10.84% reduction in total emissions. These results show that large-scale demand management can have direct and quantifiable effects on emission reduction. However, this strategy may entail considerable socioeconomic costs and should be carefully evaluated in actual policy contexts.
Scenario 6 (An increase of 20% in the average travel distance) caused transportation emissions to rise by 16.63%, sightseeing emissions to increase by 20.00%, and total emissions to grow by 10.20%, underscoring the high sensitivity of overall emissions to travel distance. This finding supports the importance of promoting short-distance tourism and optimizing regional tourism networks.
In the energy structure optimization scenarios, Scenario 7 (20% of liquefied petroleum gas consumption is replaced by electricity) led to a 36.94% reduction in accommodation emissions and a 1.01% reduction in catering emissions, but only a 1.95% decrease in total carbon emissions. Similarly, Scenario 8 (20% of firewood consumption is replaced by electricity), resulting in a 36.90% reduction in accommodation emissions and a 0.11% reduction in catering emissions, with total emissions decreasing by just 1.89%. The relatively limited overall mitigation effect of both scenarios is mainly due to the dominant share of transportation emissions (C1), which makes the impact of energy structure adjustments comparatively minor.
Overall, the results highlight that the emission reduction potential in the transportation sector far exceeds that of energy substitution and demand-side control. In particular, shifting from private cars to public transport or electric vehicles represents the most effective mitigation pathway in this case study. Future research should further integrate economic analysis and uncertainty assessment to support the comprehensive formulation of low-carbon tourism policies.

References

  1. Wang, X.; Li, X. Annual Report on the Development of Rural Tourism in China (2023); Social Sciences Academic Press (CHINA): Beijing, China, 2024. [Google Scholar]
  2. United Nations World Tourism Organization (UNWTO). Tourism Unites Behind the Glasgow Declaration on Climate Action at COP26. Available online: https://www.unwto.org/news/tourism-unites-behind-the-glasgow-declaration-on-climate-action-at-cop26 (accessed on 4 November 2021).
  3. Tsutsumi, A.; Furukawa, R.; Kitamura, Y.; Itsubo, N. G20 Tourism Carbon Footprint and COVID-19 Impact. Sustainability 2024, 16, 2222. [Google Scholar] [CrossRef]
  4. Wang, S.X.; Hu, Y.Y.; He, H.; Wang, G.X. Progress and Prospects for Tourism Footprint Research. Sustainability 2017, 9, 1847. [Google Scholar] [CrossRef]
  5. Cao, R.; Mo, Y.H.; Ma, J.M. Carbon Footprint Analysis of Tourism Life Cycle: The Case of Guilin from 2011 to 2022. Sustainability 2023, 15, 7124. [Google Scholar] [CrossRef]
  6. Xiao, Q.; Zhong, Y.D.; Deng, J.Y. Carbon Footprint and Its Composition: A Comparison Between Domestic and International Tourists to Chenzhou City, China. Sustainability 2023, 15, 5670. [Google Scholar] [CrossRef]
  7. Tang, C.; Zhong, L.; Ng, P. Factors that Influence the Tourism Industry’s Carbon Emissions: A Tourism Area Life Cycle Model Perspective. Energy Policy 2017, 109, 704–718. [Google Scholar] [CrossRef]
  8. Sun, Y.Y. A framework to account for the tourism carbon footprint at island destinations. Tour. Manag. 2014, 45, 16–27. [Google Scholar] [CrossRef]
  9. Filimonau, V.; Dickinson, J.; Robbins, D. The carbon impact of short-haul tourism: A case study of UK travel to Southern France using life cycle analysis. J. Clean Prod. 2014, 64, 628–638. [Google Scholar] [CrossRef]
  10. Platts, E.J.; Keifer, H.L.; Samuels, K.L. Carbon footprints of travel to World Heritage Sites: Communicating climate to potential tourists through a consumption-based life-cycle assessment. J. Herit. Tour. 2023, 18, 407–426. [Google Scholar] [CrossRef]
  11. Dubois, G.; Ceron, J.P. Tourism/Leisure Greenhouse Gas Emissions Forecasts for 2050: Factors for Change in France. J. Sustain. Tour. 2006, 14, 172–191. [Google Scholar] [CrossRef]
  12. Xu, X.M.; Feng, C.; Droma, P.; Tan, Y.L. A carbon neutral account framework for the Qomolangma mountaineering tourism area. Environ. Dev. Sustain. 2023, 25, 14101–14130. [Google Scholar] [CrossRef]
  13. Rico, A.; Martínez-Blanco, J.; Montlleó, M.; Rodríguez, G.; Tavares, N.; Arias, A.; Oliver-Solà, J. Carbon footprint of tourism in Barcelona. Tour. Manag. 2019, 70, 491–504. [Google Scholar] [CrossRef]
  14. Neger, C.; Prettenthaler, F.; Gössling, S.; Damm, A. Carbon intensity of tourism in Austria: Estimates and policy implications. J. Outdoor Recreat. Tour. 2021, 33, 100331. [Google Scholar] [CrossRef]
  15. Li, Y.; Zhang, L. Ecological efficiency management of tourism scenic spots based on carbon footprint analysis. Int. J. Low-Carbon Technol. 2020, 15, 550–554. [Google Scholar] [CrossRef]
  16. Hernandez-Martin, R.; Padron-Avila, H. The Carbon Footprint of Airport Ground Access as Part of an Outbound Holiday Trip. Sustainability 2021, 13, 9085. [Google Scholar] [CrossRef]
  17. Luo, F.; Becken, S.; Zhong, Y. Changing travel patterns in China and ’carbon footprint’ implications for a domestic tourist destination. Tour. Manag. 2018, 65, 1–13. [Google Scholar] [CrossRef]
  18. Koiwanit, J.; Filimonau, V. Carbon footprint assessment of home-stays in Thailand. Resour. Conserv. Recycl. 2021, 164, 105123. [Google Scholar] [CrossRef]
  19. Gössling, S.; Garrod, B.; Aall, C.; Hille, J.; Peeters, P. Food management in tourism: Reducing tourism’s carbon ‘foodprint’. Tour. Manag. 2011, 32, 534–543. [Google Scholar] [CrossRef]
  20. Özgen, I.; Binboğa, G.; Güneş, S.T. An assessment of the carbon footprint of restaurants based on energy consumption: A case study of a local pizza chain in Turkey. J. Foodserv. Bus. Res. 2021, 24, 709–729. [Google Scholar] [CrossRef]
  21. Gössling, S. Global environmental consequences of tourism. Glob. Environ. Change 2002, 12, 283–302. [Google Scholar] [CrossRef]
  22. Sharp, H.; Grundius, J.; Heinonen, J. Carbon footprint of inbound tourism to Iceland: A consumption-based life-cycle assessment including direct and indirect emissions. Sustainability 2016, 8, 1147. [Google Scholar] [CrossRef]
  23. Cooper, J.A.; Mccullough, B.P. Bracketing sustainability: Carbon footprinting March Madness to rethink sustainable tourism approaches and measurements. J. Clean Prod. 2021, 318, 18. [Google Scholar] [CrossRef]
  24. Cadarso, M.Á.; Gómez, N.; López, L.A.; Tobarra, M.Á. Calculating tourism’s carbon footprint: Measuring the impact of investments. J. Clean Prod. 2016, 111, 529–537. [Google Scholar] [CrossRef]
  25. Kitamura, Y.; Ichisugi, Y.; Karkour, S.; Itsubo, N. Carbon Footprint Evaluation Based on Tourist Consumption toward Sustainable Tourism in Japan. Sustainability 2020, 12, 2219. [Google Scholar] [CrossRef]
  26. Susilorini, R.; Ismail, A.; Wastunimpuna, B.Y.A.; Wardhani, D.K.; Prameswari, L.L.N.; Amasto, A.H.; Suryono, A. Tourism Village Carbon Footprint after COVID-19 Pandemic: A Challenge to Sustainability. Sustainability 2022, 14, 2400. [Google Scholar] [CrossRef]
  27. Lenzen, M.; Sun, Y.Y.; Faturay, F.; Ting, Y.P.; Geschke, A.; Malik, A. The carbon footprint of global tourism. Nat. Clim. Change 2018, 8, 522–528. [Google Scholar] [CrossRef]
  28. Becken, S.; Patterson, M. Measuring national carbon dioxide emissions from tourism as a key step towards achieving sustainable tourism. J. Sustain. Tour. 2006, 14, 323–338. [Google Scholar] [CrossRef]
  29. Osorio, P.; Cadarso, M.A.; Tobarra, M.A.; Garcia-Alaminos, A. Carbon footprint of tourism in Spain: Covid-19 impact and a look forward to recovery. Struct. Change Econ. Dyn. 2023, 65, 303–318. [Google Scholar] [CrossRef] [PubMed]
  30. Xue, J.J. Calculation and Factors of Carbon Footprint of Tourism in Henan Province. Master’s Thesis, Yanshan University, Qinhuangdao, China, 2015. [Google Scholar]
  31. Yao, Z.; Chen, T. The Empirical Research on Tourism Carbon Emission based on the Carbon Footprint Model: A Case Study of Hainan Province. Bus. Manag. J. 2016, 38, 151–159. [Google Scholar] [CrossRef]
  32. Xiao, J.; Yu, A.; Wang, M. Carbon Footprint Evaluation in Tours: A Case Study of Zhoushan Islands. Tour. Sci. 2011, 25, 58–66. [Google Scholar] [CrossRef]
  33. Kuo, N.W.; Chen, P.H. Quantifying energy use, carbon dioxide emission, and other environmental loads from island tourism based on a life cycle assessment approach. J. Clean Prod. 2009, 17, 1324–1330. [Google Scholar] [CrossRef]
  34. Huang, H.; Wang, Z.; Song, Y. Carbon footprint and eco-efficiency of rural tourism destination under the background of rural revitalization: A case study of Huangling scenic spot in Wuyuan of Jiangxi Province. Res. Agric. Mod. 2019, 40, 683–691. [Google Scholar] [CrossRef]
  35. Zhu, L.P.; Zhou, Y.D.; Li, Q. A Coupled Study on Carbon Emission Assessment and Emission Reduction Coupling of Tourism Activities in Beautiful Countryside Taking Zhahan Village, Qiongzhong County, Hainan as an Example. Nat. Environ. Pollut. Technol. 2023, 22, 311–317. [Google Scholar] [CrossRef]
  36. Liu, J.; Lin, C.; Huang, L.; Zhu, J.H.; Wu, L.J.; Li, Y.Y. Use of Household Survey Data as a Tool to Assess the Carbon Footprint of Rural Tourist Accommodation and Related Services in China: A Case Study of Mount Qingcheng. Sustainability 2017, 9, 1680. [Google Scholar] [CrossRef]
  37. Tang, F.Q. Research on the Architectural Renovation of Guangzhou Nanping Village with the Continuation of Regional Culture. Master’s Thesis, South China University of Technology, Guangzhou, China, 2020. [Google Scholar]
  38. The Peoples’ Government of Guangzhou Municipality. Advance the “Hundred, Thousand and Ten Thousand Project” to engender “novelty” in Conghua. Available online: https://www.gz.gov.cn/zt/lhxsdxczx/bqwgc/content/mpost_9430670.html (accessed on 9 January 2024).
  39. GB/T 25890-2020; General rules for calculation of the comprehensive energy consumption. Standards Press of China: Beijing, China, 2020.
  40. Xie, Y.; Zhao, Y. The method of measuring carbon dioxide emissions in tourism on the basis of low-carbon tourism. Hum. Geogr. 2012, 27, 147–151. [Google Scholar] [CrossRef]
  41. Luo, C.L. An Empirical Study on Carbon Emission Estimation and Carbon Compensation in Rural Tourism Development—Taking SongKou Village as an Example. Master’s Thesis, Fujian Agriculture and Forestry University, Fuzhou, China, 2018. [Google Scholar]
  42. Ding, Y.L. Research on Net Carbon Emission Estimation and Carbon Compensation of Rural Tourism from the Perspective of Carbon Neutrality: An Empirical Study of Hongcun in Southern Anhui and Daxu in Hefei. Ph.D. Dissetation, Nanjing Normal University, Nanjing, China, 2015. [Google Scholar]
  43. Wang, Z.M.; Zhang, X.L.; Qiu, X.Y. Estimation of Net Carbon Emissions and Construction of Low Carbon Scenic Area Based on Carbon Neutralization—A Case Study of Jiaoshan in Zhenjiang City. J. Nanjing Norm. Univ. (Nat. Sci. Ed.) 2016, 39, 107–113. [Google Scholar] [CrossRef]
  44. Wang, X.J. Trends, Influencing Factors and Scenario Analysis of Carbon Emissions in China’s Tourism Transportation. Master’s Thesis, Central South University of Forestry and Technology, Changsha, China, 2019. [Google Scholar]
  45. Xiao, X.; Zhang, J.; Lu, J.; Zhong, S.; Yin, L. Analysis on spatial structure and scenarios of carbon dioxide emissions from tourism transportation. Acta Ecol. Sin. 2012, 32, 7540–7548. [Google Scholar] [CrossRef]
  46. Yang, X.L. Research on the Impactmechanism of Low-Carbon Travelin Daily Life Circle of Chinese County. Master’s Thesis, Southeast University, Nanjing, China, 2021. [Google Scholar]
  47. Chen, F.; Zhu, D. Theory of Research on Low-carbon City and Shanghai Empirical Analysis. Urban Dev. Stud. 2009, 16, 71–79. [Google Scholar]
  48. Intergovernmental Panel on Climate Change (IPCC). 2006 IPCC Guidelines for National Greenhouse Gas Inventories; Institute for Global Environmental Strategies: Hayama, Japan, 2006. [Google Scholar]
  49. He, J.; Liu, Y.; Li, Z.; Qiu, Z. Energy Consumption Analysis of Municipal Solid Waste Classified Transportation. Environ. Eng. 2021, 39, 136–142. [Google Scholar] [CrossRef]
  50. Zhang, X.J. Study on the Emission and Absorption of Carbon for Tourism Industry on Wutai Mountain Scenic Spot. Master’s Thesis, Shanxi University of Finance & Economics, Taiyuan, China, 2016. [Google Scholar]
  51. Fu, R. Research on Low Carbon Tourism Carbon Footprint Based on LCA and Emission Flow Chart. Master’s Thesis, Hangzhou Dianzi University, Hangzhou, China, 2023. [Google Scholar]
  52. Guo, R. Research on net carbon emission estimation and carbon compensation of rural tourism from the perspective of environmental economy: A case study of Hongcun, Anhui Province. Hubei Agric. Sci. 2022, 61, 201–206. [Google Scholar] [CrossRef]
  53. Chu, Y.M. Research on Tourism Footprints and Environmental Carrying Capacity of Baiyangdian Scenic Spot. Ph.D. Dissetation, China University of Mining and Technology, Xuzhou, China, 2020. [Google Scholar]
  54. Tu, S.Q. The Study of Tourism Carbon Footprint in Shennongjia. Master’s Thesis, Central China Normal University, Wuhan, China, 2018. [Google Scholar]
  55. Yang, L. Estimation of Carbon Emissions and Empirical Analysis of Carbon Compensation in Rural Tourism Development. Pol. J. Environ. Stud. 2025, 34, 369–382. [Google Scholar] [CrossRef] [PubMed]
  56. Jin, H.; Liu, M.; Gao, Y.Z. Dynamics Comparison of Tourism Carbon Footprint with Tourism Carbon Capacity in Shanxi Province. Sci. Technol. Ind. 2023, 23, 68–73. [Google Scholar] [CrossRef]
  57. Shang, Q. Study on Carbon Footprint in Kikungshan Scenic Spot in Henan Province. J. Zhejiang For. Sci. Technol. 2019, 39, 76–80. [Google Scholar] [CrossRef]
  58. Dong, H.Y.; Liu, Q.P.; Zhou, L.; Yu, Z.P. Dynamics Comparison of Tourism Carbon Footprint with Tourism Carbon Capacity in Jiangsu Province. Ecol. Econ. 2018, 34, 183–187. [Google Scholar] [CrossRef]
  59. Liu, X.; Pan, Y. A study of carbon emissions during a tour: A case study of a four-day guided tour in Guilin, China. J. Hosp. Tour. Manag. 2016, 29, 80–87. [Google Scholar] [CrossRef]
  60. Lochman, J.; VÁgner, J. The Nature of the Impact of Catering Facilities on Environmental Sustainability. Folia Geogr. 2022, 64, 5–26. [Google Scholar]
  61. Mocák, P.; Matlovicova, K.; Matlovic, R.; Pénzes, J.; Pachura, P.; Mishra, P.K.; Kostilníková, K.; Demková, M. 15-minute city concept as a sustainable urban development alternative: A brief outline of conceptual frameworks and Slovak cities as a case. Folia Geogr. 2022, 64, 69–89. [Google Scholar]
Figure 1. Location map of Village B.
Sustainability 17 06495 g001
Figure 2. Proportion of tourist transportation modes.
Sustainability 17 06495 g002
Figure 3. Map of departure and transportation of tourists from Guangdong Province.
Sustainability 17 06495 g003
Figure 4. Proportion of tourist sightseeing methods.
Sustainability 17 06495 g004
Figure 5. Basic carbon footprint of shopping in Village B.
Sustainability 17 06495 g005
Figure 6. Overall tourism carbon footprint in Village B. (a) The proportion of tourism carbon footprint of each part of Village B tourism; (b) the composition of tourism carbon footprint in Village B.
Sustainability 17 06495 g006
Table 1. Accounting scope, influencing factors, and accounting focus of tourism carbon footprint.
Accounting SegmentsAccounting ScopeInfluencing FactorsKey Calculation Focus
Transportation segmentThe carbon footprint generated by tourists’ round-trip transportation to and from the destination.Transportation methods (public transportation such as airplanes, trains, buses, etc. [8,9,10,11], self-driving tourism [12,13]), travel distance [14], the development level of the destination’s public transportation network (public transportation usage rate) [15], transportation connectivity [13], and types of transportation fuel [16,17], etc.Air travel (especially long-distance travel) and private transportation (such as self-driving cars).
Accommodation segmentThe carbon footprint generated by tourists’ accommodation activities during their trip, including the carbon footprint of lighting, heating, cooling, washing, and other services in the accommodation facilities.Accommodation type [15], hotel rating [13], energy utilization structure [18], etc.High-end hotels (higher than budget accommodations, with higher energy consumption and more complex services).
Catering segment.The carbon footprint generated by tourists’ dining activities during their trip, including the carbon footprint associated with food production, processing, storage, transportation, consumption, and the energy consumption process in dining establishments.Types of ingredients [19], production methods [19], energy utilization structure [20], etc.High-consumption models (such as luxury dining), meat and seafood (higher emissions than plant-based foods), industrial production, and local organic food have different emissions. Local, minimally processed foods have a lower carbon footprint.
Sightseeing segmentThe carbon footprint generated by tourists’ sightseeing activities.Energy consumption of sightseeing facilities [21], etc. High-energy consumption sightseeing facilities.
Entertainment segmentThe carbon footprint generated by tourists’ recreational activities, such as cultural events, outdoor sports, and other leisure activities.The type and scale of activities [13,14,22,23], as well as the energy consumption of equipment [21], etc.High-energy facilities (such as theme parks and ski resorts) have significantly higher carbon emissions compared to nature-based ecological tourism. Indoor activities and those involving mechanical equipment generate higher emissions than natural hiking.
Shopping segmentThe carbon footprint generated by tourists’ shopping activities during their trip, including the carbon footprint associated with the production, processing, storage, transportation of tourism products, and the energy consumption of services provided by retail stores.Product types, production methods, transportation distances and packaging materials, as well as the types of energy used by retail stores in providing services [14,24,25], etc.The carbon footprint of industrialized products transported over long distances is usually higher than that of locally crafted handmade products.
Other segmentsThe carbon footprint generated by tourism waste management (such as waste transportation and disposal) and the construction of tourism infrastructure (such as scenic area development and transportation facility construction).Types of waste, quantity, disposal methods, energy consumption for transportation and disposal, and types of infrastructure construction [26], etc.-
Table 2. Carbon emission coefficient of different modes of transport.
Transportation ModeCarbon Emission CoefficientData Sources
Coaches0.018kg CO2/p/kmWang et al. [43]
Subway0.027kg CO2/p/kmWang Xiaojuan [44]
Taxi0.25kg CO2/p/kmXiao xiao et al. [45]
Own car0.25kg CO2/p/km
Bus0.033kg CO2/p/kmYang Xiuling [46]
Table 3. Reference coefficients of standard coal for various energy sources.
Energy TypeAverage Lower Heating ValueStandard Coal Conversion Factor
Liquefied Petroleum Gas50,179 kJ/(12,000 kcal)/kg1.7143 kg standard coal per kg
Natural Gas38,931 kJ/(9310 kcal)/kg1.3300 kg standard coal/m3
Electricity (Equivalent)3596 kJ/(860 kcal)/kg0.1229 kg of standard coal per kilowatt-hour.
Firewood16,726 kJ/(4,000 kcal)/kg0.571 kg of standard coal per kg
Data sources: General Principles for Calculation of Comprehensive Energy Consumption (GB/T 2589-2020) and China Energy Statistical Yearbook (2023).
Table 4. The energy consumption of garbage transportation for different types of garbage.
Waste Transportation CategoriesEnergy Consumption Factor for Transporting WasteData Sources
Kitchen waste transportation0.10 kgce/t/kmHe Jiani et al. [49]
Other waste transportation0.13 kgce/t/km
Table 5. Basic statistics of tourist samples in Village B.
FeatureTypeFrequencyPercentage/%
GenderMale28341.0
Female40759.0
Age<1810515.2
18–25639.1
26–3010415.1
31–4016323.6
41–507010.1
51–6013619.7
>60497.1
Education levelJunior high school and below14120.4
High school/vocational school/technical school8312.0
Junior college476.8
Undergraduate29642.9
Master and above12317.8
Mode of travelSolo self-guided tour10415.1
Group or family/friends self-guided tour37954.9
Travel agency-organized tour14821.4
Company-organized tour598.6
Length of stay1 day45666.1
2 days20129.1
3 days334.8
Table 6. Carbon footprint of tourism transportation for different travel modes.
Transportation ModeNumber of Visitors (p/a)Average Travel Distance (km)Carbon Emission Coefficient
(kg CO2/p/km)
Carbon Footprint
(t/a)
Proportion of Carbon Footprint
Coache77,971.01129.60.018363.835.52%
Private Car10,9275.36111.30.256079.5792.32%
Bus4057.97180.0334.820.07%
Subway and Taxi4057.9736.6 a
20 b
0.027 c
0.25 d
48.590.74%
Taxi4637.6838.10.2588.411.34%
Total200,000--6585.22100.00%
a The average travel distance (km) for the subway in the transportation mode of subway and taxi; b the average travel distance (km) for the taxi in the transportation mode of subway and taxi; c the carbon emission coefficient (kg CO2/p/km) for the subway; d the carbon emission coefficient (kg CO2/p/km) for taxi.
Table 7. Energy consumption and carbon footprint of accommodation industry in Village B (large homestays).
Large HomestaysNumber of Beds (Units)Electricity (kWh/a)Liquefied Petroleum Gas (kg/a)Firewood (kg/a)Converted to Standard Coal Equivalent (kg/a)Total Carbon Emissions (kg/a)
A176476,5800058,572143,501
A24280,76900992724,320
Total118557,3490068,499167,821
Table 8. Energy consumption and carbon footprint of accommodation industry in Village B (small homestays).
Small HomestaysNumber of Beds (Units)Electricity (kWh/a)Liquefied Petroleum Gas (kg/a)Firewood (kg/a)Converted to Standard Coal Equivalent (kg/a)Total Carbon Emissions (kg/a)
A31737,6922401600595714,596
A4428467504781172
A56569210508802155
A654923006051482
A7653089008071976
A8550927507541848
A966462120010002450
A101022,38421096036598965
A111840,6153900566013,867
A126723115008892177
A131116,61516574027476731
A141018,15475023605781
A15662309009202254
A16667699008322038
A17536159005991466
A181739,846450910618815,161
A191013,500540101031627746
A201018,154375106034798524
A211015,846195022825590
A228646218037013143219
A2355077006241529
Household average value913,73917631721525273
Total181288,5133705665045,195110,729
Table 9. Energy consumption and carbon footprint of catering industry in Village B (large restaurants).
Large
Restaurants
Electricity (kWh/a)Liquefied Petroleum Gas (kg/a)Firewood (kg/a)Converted to Standard Coal Equivalent (kg/a)Total Carbon Emissions (kg/a)
B1149,2109690034,94985,626
Table 10. Energy consumption and carbon footprint of catering industry in Village B (small restaurants).
Small
Restaurants
Electricity (kWh/a)Liquefied Petroleum Gas (kg/a)Firewood (kg/a)Converted to Standard Coal Equivalent (kg/a)Total Carbon Emissions (kg/a)
B222,308450001045625,617
B318,61519800568213,921
B416,92318000516612,656
B514,15408100636515,593
B616,30818750521912,785
B724,6155100011,76828,832
B820,00016500528712,952
B920,15422500633415,519
B1026,154712501542937,800
Household average value20,1032920900799019,576
Total180,93126,280810071,913176,188
Table 11. Carbon footprint of sightseeing in Village B.
Sightseeing ModeNumber of Visitors (p/a)Average Travel Distance (km)Carbon Emission Coefficient
(kg CO2/p/km)
Carbon Footprint
(t/a)
Coache29,2753.60.0181.90
Private Car53,6233.60.2548.26
Walking117,101---
Total200,000--50.16
Table 12. The garbage disposal situation in Village B.
Types of WasteRecyclable WasteHazardous WasteKitchen WasteOther Waste
Collection timeAppointment time (every Sunday at 17:00)Appointment time (once a month)Appointment time (9:30 a.m.)Appointment time (9:00 a.m.–10:30 a.m.)
Collection unitResource recycling stationSanitation officeSanitation officeSanitation office
Collection methodAppointment-based collectionAppointment-based collectionAppointment-based collectionDirect recycling.
Waste flow,Resource recycling stationTemporary hazardous waste storage point in the districtSeventh Resource Thermal Power PlantSeventh Resource Thermal Power Plant
Table 13. Carbon footprint of garbage transportation in Village B.
Waste Transportation
Categories
Waste Transportation Coefficient (kgce/(t·km))Average Daily Waste Transportation
Amount (kg)
One-Way
Transportation
Distance (km)
Annual Waste Transportation
Carbon Footprint (kg)
Kitchen waste transportation0.10657.53450.62975.28
Other waste transportation0.13109.58950.6644.644
Total 3619.924
Table 14. Carbon footprint of waste incineration in Village B.
Waste Treatment CategoriesAnnual Waste
Incineration Amount (kg)
Annual Waste Incineration Carbon Footprint (kg)Waste Treatment CategoriesAnnual Waste
Incineration Amount (kg)
Composting of kitchen waste240,000133,760Composting of kitchen waste240,000
Incineration of other waste40,00022,293Incineration of other waste40,000
Disclaimer/Publisher’s Note: The statements, opinions and data contained in all publications are solely those of the individual author(s) and contributor(s) and not of MDPI and/or the editor(s). MDPI and/or the editor(s) disclaim responsibility for any injury to people or property resulting from any ideas, methods, instructions or products referred to in the content.

