Abstract
Anaerobic acidogenic fermentation presents a promising approach for sustainable carbon emission mitigation in livestock waste management, addressing critical environmental challenges in agriculture. This study systematically investigated the synergistic effects of composting-assisted pretreatment coupled with micro-aeration and methanogenesis suppression to enhance volatile fatty acid (VFA) production from swine manure supplemented with wheat straw, valorizing agricultural waste while reducing greenhouse gas emissions. The experimental protocol involved sequential optimization of pretreatment conditions (12 h composting followed by 10 min thermal pretreatment at 85 °C), operational parameters (300 mL micro-aeration and 30 mmol/L 2-bromoethanesulfonate (BES) supplementation), and their synergistic integration. The combined strategy achieved peak VFA production (5895.92 mg/L, p < 0.05), with butyric acid constituting the dominant fraction (2004.42 mg/L, p < 0.05). Enzymatic analysis demonstrated significantly higher activities of key hydrolytic enzymes (protease, α-glucosidase) and acidogenic enzymes (butyrate kinase, acetate kinase) in the synergistic treatment group compared to individual BES-supplemented or micro-aeration-only groups (p < 0.05). This integrated approach provides a technically feasible and environmentally sustainable pathway for circular resource recovery, contributing to low-carbon agriculture and waste-to-value conversion.
1. Introduction
Aerobic composting and anaerobic digestion represent conventional approaches for sanitizing livestock manure. Aerobic composting facilitates rapid thermophilic phase establishment under oxygenated conditions, effectively inactivating pathogenic microorganisms, parasitic ova, and weed seeds through sustained high-temperature exposure. Anaerobic digestion mediates the bioconversion of macromolecular organic compounds into value-added metabolites, including volatile fatty acids (VFAs), methane (CH4), and hydrogen (H2), through oxygen-depleted microbial consortia [1]. Process instability in the methanogenesis phase frequently induces VFA accumulation due to the inhibition of acetoclastic methanogenic pathways, as demonstrated by Zhong et al. and Chen [2,3]. While conventional anaerobic digestion prioritizes CH4 production, this terminal product exhibits lower economic value compared to alternative biochemicals and requires extended production cycles. Regional climatic variations, suboptimal reactor configurations, and inconsistent operational management collectively contribute to gas yield instability in full-scale applications [4]. Furthermore, unutilized gas may exacerbate greenhouse gas emissions, while indiscriminate land application of digestate carries risks of pathogen recrudescence and oviposition resurgence.
Acidogenic anaerobic fermentation has emerged as a promising biotechnological approach for converting biomass into VFAs through controlled metabolic processes. This technique, when integrated with downstream processes, enables efficient valorization of organic wastes into value-added products including industrial organic acids, bioplastics, and biofilms [5]. The fermentation efficiency predominantly depends on substrate characteristics and operational parameters. Substrate composition critically determines the bioavailability and bioconversion efficiency for acidogenic consortia. Key operational parameters encompass temperature, pH, and total solids (TS) concentration, with temperature being the predominant regulatory factor. Thermophilic conditions (>35 °C) selectively inhibit acetoclastic methanogenesis while promoting carbon dioxide (CO2)-reductive metabolic pathways, thereby facilitating acetate accumulation [6]. pH modulates microbial community dynamics and metabolic patterns, though optimal pH ranges vary depending on substrate composition and system configurations. Maintaining appropriate TS levels (4–8% for swine manure) is essential for process stability, with VFA production demonstrating positive correlation with TS concentrations within this operational range [7].
Conventional approaches utilizing raw substrates for acidogenic fermentation frequently result in suboptimal VFA yields. Recent studies have demonstrated that process intensification strategies—including substrate pretreatment, controlled micro-aeration, and additive supplementation—can significantly enhance VFA production. Yu et al. reported that oxygen dosing (50–150 mg/L per reaction cycle) induced VFA accumulation, with moderate micro-aeration (50 mg/L O2/cycle) achieving maximum yield enhancement [8]. Notably, optimal oxygenation levels vary across different substrates and reactor configurations, necessitating systematic investigation of oxygen–VFA yield relationships. The methanogenesis inhibitor 2-bromoethanesulfonate (BES) specifically binds to methyl-coenzyme M in methanogens, effectively blocking CH4 synthesis without compromising acidogenic microbial activity [9]. Conrad et al. documented complete methanogen suppression at 10 mmol/L BES [10], while Deng et al. observed altered VFA speciation profiles under BES-amended conditions, suggesting secondary metabolic pathway modulation [11].
Current research on acidogenic anaerobic fermentation lacks comprehensive investigations into the tripartite synergy of thermochemical composting pretreatment, micro-aeration, and biochemical additives. To overcome the well-documented limitations of conventional pretreatment methods—specifically suboptimal substrate conversion efficiency and unpredictable acidification dynamics—this study established a multivariate optimization platform integrating phased thermal conditioning. The experimental matrix systematically assessed (i) thermal conditioning effects at distinct composting phases with auxiliary heating gradients on soluble chemical oxygen demand (SCOD) mobilization, (ii) micro-aeration intensity modulation, and (iii) dosage optimization of BES. This multidimensional approach elucidates the operational leverage points for enhancing acidogenic potential in organic waste valorization systems.
2. Materials and Methods
2.1. Experimental Materials
Swine manure was collected from the Teaching-Research Base of Sichuan Agricultural University, with wheat straw powder commercially sourced from a national agricultural technology company (Beijing, China). The experimental workflow is schematically illustrated in Figure 1. The substrates were characterized as follows:
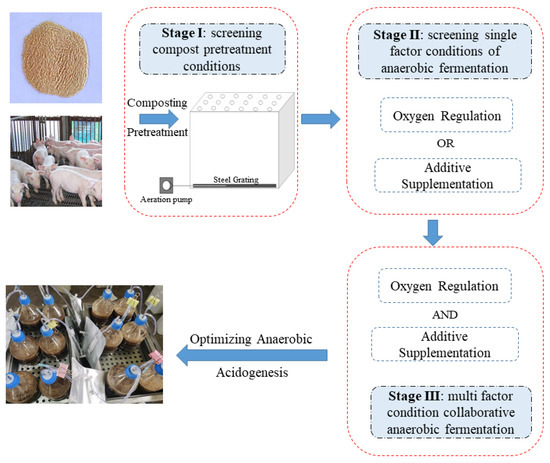
Figure 1.
Experimental process.
Swine manure: pH 6.53 ± 0.03, electrical conductivity (EC) 1.09 ± 0.03 mS/cm, moisture content 68.14 ± 0.60%, total organic carbon (TOC) 40.18 ± 1.13%, total Kjeldahl nitrogen (TKN) 1.25 ± 0.05%, TS 26.30 ± 0.01%, volatile solids (VS) 20.59 ± 0.004%.
Wheat straw (passed through 100-mesh sieve): pH 5.86 ± 0.07, EC 1.31 ± 0.16 mS/cm, moisture content 9.50 ± 0.59%, TOC 47.09 ± 0.79%, TKN 0.28 ± 0.05%, TS 90.78 ± 0.002%, vs. 79.35 ± 0.03%.
2.2. Experimental Design
The study comprised three sequential phases. Phase I involved compost pretreatment prior to anaerobic fermentation to identify optimal SCOD values, establishing baseline parameters for subsequent single-factor and multi-factor fermentation experiments. Phase II screened oxygen dosing levels and BES concentrations under the optimal SCOD conditions to optimize acidogenic performance (single-factor experiment). Phase III integrated the optimized parameters from preceding phases to determine the synergistic effects of combined pretreatment, oxygen regulation, and BES supplementation. The experimental workflow is illustrated in Figure 1.
Phase I: Compost substrates were prepared by homogenizing swine manure with wheat straw powder (total mass 35 kg) at an optimized C/N ratio (25) and moisture content (60–65%). The bioreactor system comprised an expanded polystyrene (EPS) aeration chamber equipped with dual-layer perforated pipes (upper/lower aeration networks) and surface vents to maintain dynamic oxygen supply. The experimental design included (i) seven intervention time points (0, 4, 8, 12, 16, 20, and 24 h after composting initiation), (ii) five heated groups (55 °C, 65 °C, 75 °C, 85 °C, 90 °C) and one non-heated control group maintained at ambient temperature. Each composting unit received a discrete 10 min heat treatment at one combination of the predefined intervention time point and assigned temperature, resulting in 42 unique experimental groups (7 time points × 6 temperatures). Quantitative SCOD analysis assessed substrate solubilization efficiency to identify thermal-phase pretreatment conditions maximizing acidogenic potential. Results identified 12 h composting with 85 °C/10 min treatment as optimal (SCOD 5.49 g/L; Figure S1 in Supplementary Information).
Phase II: Anaerobic fermentation substrates were collected from the central zone of compost piles showing maximum SCOD (TS 8%). Batch reactors (1.5 L working volume) operated under mesophilic conditions (35 °C) for 14 days. System integrity was verified daily via standardized pressure tests to ensure anaerobic stability. Oxygen dosing groups (O1-O5): initial oxygen injections of 100, 200, 300, 400, and 500 mL; BES concentration groups (BES1-BES5): methanogenic inhibition using 10, 20, 30, 40, and 50 mmol/L BES.
Phase III: A two-factor experimental design with three levels each for oxygen dosing and BES concentration generated nine treatment groups (Table 1), building on Phase II outcomes.

Table 1.
The two-factor, three-level combination fermentation method was grouped.
2.3. Sample Collection and Index Determination
2.3.1. Solid Sample Collection and Physicochemical Analysis
Compost samples were collected using a five-point sampling method (40–50 g per sampling point), homogenized, and divided into two aliquots, one for immediate physicochemical analysis and the other stored at −20 °C. Anaerobic fermentation samples were obtained through destructive sampling after 5 min manual homogenization of the reactor. Each 200 mL homogenate was split into two portions: one for physicochemical parameters, VFA quantification, and enzymatic assays; the other preserved at −86 °C. Temperature was monitored using calibrated mercury thermometers. pH and EC were measured with digital meters (PHS-320 pH meter, Century Fangzhou Technology, Chengdu, China; DDS-307A EC meter, INESA SCIENTIFIC INSTRUMENT Co., Ltd., Shanghai, China). Moisture content, TOC, TKN, TS, VS, and SCOD were determined according to Chinese Agricultural Industry Standard NY/T 525-2021 (Organic Fertilizers; Ministry of Agriculture and Rural Affairs of the People’s Republic of China: Beijing, China, 2021).
2.3.2. Gas Sampling and Analysis
Gas samples were collected in 200 mL dual-valve aluminum foil bags and analyzed via gas chromatography (GC-2090; Zhongkepu Instrument, Shandong, China) with thermal conductivity detection (TCD). Triplicate measurements were performed for H2, N2, CH4, and CO2. Column: XP-FFAP (100 °C isothermal); Carrier gas: ultra-high purity argon (99.999%) at 1 mL/min; detector: TCD at 100 °C; injection volume: 10 mL; runtime: 10 min; pressure parameters (MPa): TCD carrier gas 0.1, air 0.1, makeup gas 0.1, H2 0.1, ignition air 0.1.
2.3.3. VFA Quantification
The total VFA accumulation and composition (including acetic acid (AA), propionic acid (PA), butyric acid (BA), isobutyric acid (IBA), valeric acid (VA), and isovaleric acid (IVA)) were determined using the crotonic acid internal standard method [12]. A standard stock solution containing 9.1 g/L AA, 3.7 g/L PA, 1.765 g/L BA/IBA, and 1.985 g/L VA/IVA was prepared in ultrapure water. Standard working solutions were prepared by mixing appropriate aliquots (0.2–1.0 mL) of stock solution with 25% (w/v) metaphosphoric acid (0.2 mL) and 210 mmol/L crotonic acid (60 μL), followed by 30 min incubation at 4 °C and centrifugation (12,000× g, 10 min). The supernatant was diluted with methanol (1:9 v/v) and filtered through 0.22 μm organic membranes prior to GC analysis. Sample pretreatment followed identical procedures with adjusted reagent volumes (1 mL supernatant + 0.2 mL metaphosphoric acid + 23.3 μL crotonic acid).
GC analysis was performed on an XP-FFAP column with argon carrier gas (1 mL/min). The temperature program initiated at 100 °C (hold 0.5 min) and ramped at 30 °C/min to 190 °C (hold 1 min). Flame ionization detector parameters: 250 °C detector temperature, 40 mL/min H2 flow, 400 mL/min air flow. Injection volume was 1 μL in splitless mode at 220 °C. All samples were analyzed in triplicate, with calibration curves presented in Table S1 (Supplementary Information).
2.3.4. Key Enzyme Activity Determination
Enzyme activities (α-glucosidase, protease, acetate kinase, butyrate kinase, and CoA-transferase) were quantified using commercial ELISA kits (Meimian Industrial, Jiangsu, China) according to manufacturer protocols. Absorbance measurements at 450 nm were performed in triplicate using a microplate reader (Varioskan LUX; Thermo Fisher Scientific, Waltham, MA, USA). Enzyme concentrations were calculated from standard curves (Figure S2 in Supplementary Information) derived from reference standards provided in each kit.
2.4. Data Analysis
Data preprocessing was performed using Microsoft Excel (Version 2012), with results expressed as mean ± standard deviation (SD). Statistical analyses were conducted with SPSS Statistics (Version 20.0) through the following protocol: (1) one-way analysis of variance (ANOVA) with Fisher’s least significant difference (LSD) post hoc test for homogeneous variance groups; (2) Welch’s ANOVA with Games–Howell multiple comparisons for heteroscedastic data; (3) two-way ANOVA with interaction effect analysis. Statistical significance thresholds were set at p < 0.05 (significant) and p < 0.01 (highly significant). Data visualization was implemented in OriginPro (Version 2017) with 95% confidence interval error bars.
3. Results and Discussion
3.1. Screening Initial Oxygen Dosing Levels for Gas Reduction and VFA Accumulation
Figure 2a–d reveals that high initial substrate availability triggered intensive gas production (ranging from 1355–1870 mL) during the first seven days of fermentation across all treatment groups. Among them, the O3 group showed the lowest cumulative gas yield (1355 mL) in this initial stage. After day 7, gas production dropped steeply to 270–50 mL; notably, the O1, O2, and O3 groups converged at the same minimum value of 50 mL, likely due to substrate exhaustion and subsequent attenuation of microbial metabolism [13,14,15]. Throughout the process, the gas mixture consisted of N2, CO2, CH4, and H2. Significantly, the O3 group had the lowest CH4 content (1.12 ± 0.27%), which was statistically lower (p < 0.01) than non-O2 groups, indicating inhibited methanogenesis. This finding aligns with the previously reported homoacetogenic pathway, where acetyl-CoA synthase facilitates the conversion of H2 and CO2 into acetate [16] and corroborates methane suppression mechanisms observed in analogous systems [8].
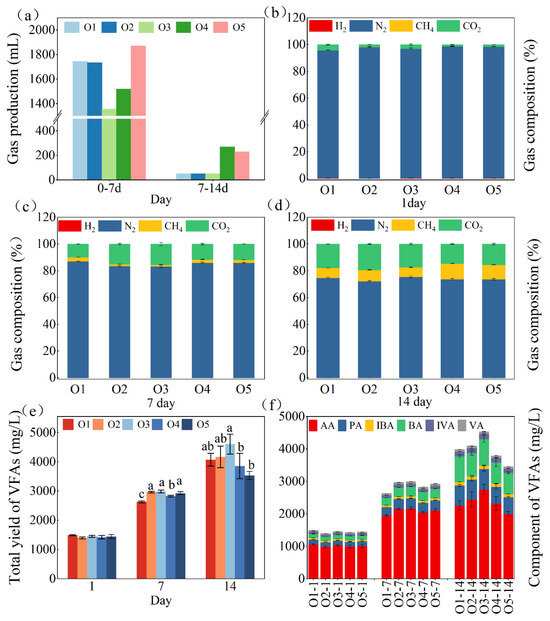
Figure 2.
Dynamics of gas production and VFA accumulation under varying initial oxygen levels. (a) Total gas production. (b) Day 1 gas composition. (c) Day 7 gas composition. (d) Day 14 gas composition. (e) Cumulative VFA yield. (f) VFA compositional profile. Values followed by different letters are statistically significant at p < 0.05.
As illustrated in Figure 2e, all experimental groups experienced a continuous increase in VFA production. The O3 group outperformed others in acidogenesis, accumulating significantly more VFA by day 7 compared to the O1 and O4 groups (p < 0.01). VFA production peaked on day 14, with the O3 group reaching a maximum accumulation; this value differed significantly from those of the O4 and O5 groups (p < 0.05). Figure 2f depicts the compositional changes in VFA components. The O3 group maintained superior AA production throughout the fermentation process, showing statistically significant differences compared to groups O1 and O4 on day 7 (p < 0.01), and to groups O5, O1, and O4 on day 14 (p < 0.05). Additionally, it accumulated significantly more IBA (107.83 ± 5.46 mg/L) than the O2 and O5 groups at the end of the process (p < 0.05).
In summary, the experimental results strongly suggest that an optimal oxygen dosage of 300 mL substantially boosts VFA biosynthesis efficiency. Such optimized oxygenation preferentially promotes the formation of AA and IBA.
3.2. Screening BES Supplementation Levels for Suppressed Gas Emissions and Enhanced VFA Yield
Figure 3a–d illustrates the gas production patterns during fermentation. The total gas volumes of all groups varied from 143 to 251 mL, with most production (143–222 mL) occurring within the first seven days. The BES3 group had the lowest cumulative gas production in both stages: 143 mL during the peak period and no production after day 7. Gas composition analysis showed that N2 and CO2 were the main components throughout the process, and methane was not detected. As fermentation progressed, the gas composition changed: the proportion of CO2 rose to 34–44% by day 14, while that of N2 decreased from 98% initially to 55–66%. The BES3 group had the lowest CO2 levels at all sampling times (p < 0.01). This suppression was due to two factors: (1) BES specifically inhibited the activity of methanogenic archaea, and (2) the accumulation of SCOD diverted metabolic flux towards acidogenesis. These results are consistent with how microbial communities respond to methanogenesis inhibitors [17], indicating that 30 mmol/L BES most effectively redirects biomass from gas production to VFA synthesis.
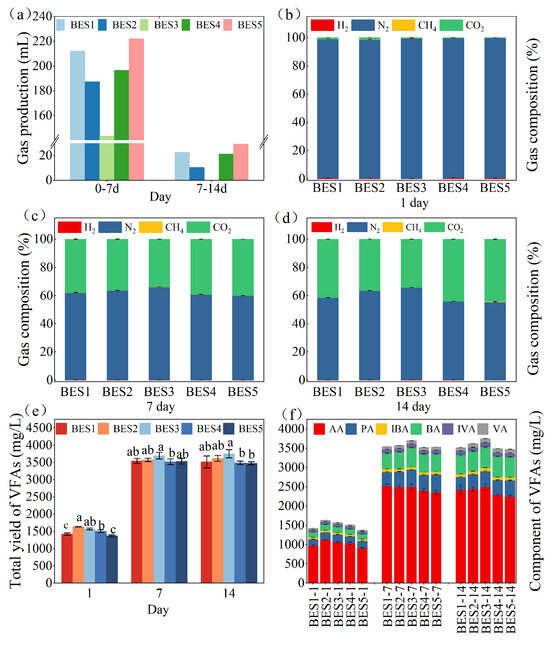
Figure 3.
Dynamics of gas production and VFA accumulation under different BES addition fermentation. (a) Total gas production. (b) Day 1 gas composition. (c) Day 7 gas composition. (d) Day 14 gas composition. (e) Cumulative VFA yield. (f) VFA compositional profile. Values followed by different letters are statistically significant at p < 0.05.
Figure 3e,f show different VFA accumulation trends during the two-phase fermentation. All groups rapidly synthesized VFAs (3522.44–3696.14 mg/L) within seven days, followed by a stable phase. The BES3 group (with 30 mmol/L BES) consistently accumulated more total VFA than the BES4 group (p < 0.05). Compositional analysis indicated that AA was the major VFA component, peaking at day 7 and then fluctuating slightly. Although AA concentrations decreased by 7.89–106.96 mg/L from day 7 to 14 in all groups, the BES3 group had the smallest decrease and maintained the highest levels of individual VFA components.
Dose–response analysis determined that 30 mmol/L BES was the optimal concentration for maximizing VFA yields. Metabolic flux analysis revealed that each VFA component had a saturation point. Once a particular VFA (such as AA) reached its peak concentration, carbon flux shifted to other components. This metabolic shift mechanism explains the observed negative correlation between the decrease in AA and the increase in other VFAs after day 7.
3.3. Effect of Combining BES and Micro-Aeration on the Fermentation Process
3.3.1. Physicochemical Changes
Building on preliminary experimental findings, a two-factor, three-level, full factorial experimental design was employed. Three total VFA concentration gradients that followed a normal distribution were selected from single-factor experiments. The changes in physicochemical parameters across the experimental groups are depicted in Figure 4.
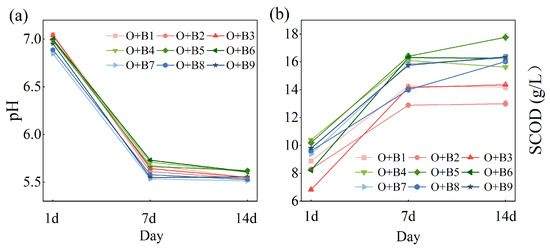
Figure 4.
Changes in physicochemical indicators under different initial oxygen and BES addition combinations of fermentation methods. (a) Change in pH over time. (b) Change in soluble chemical oxygen demand over time.
The pH values decreased steadily throughout the fermentation process. In the first 7 days, corresponding to the peak acidogenic accumulation phase, all groups experienced a rapid pH drop. Thereafter, the rate of pH decrease slowed significantly in the subsequent 7-day period. By day 14, the pH values stabilized within the range of 5.51–5.62. The O + B7 group had the lowest pH (5.51 ± 0.01), which was significantly different from other treatments (p < 0.05). The SCOD profiles showed a characteristic two-phase pattern, with an initial increase followed by stabilization. SCOD concentrations increased from initial levels of 6.83–10.40 g/L (day 1) to final values of 13.00–17.77 g/L (day 14). Notably, the O + B5 group accumulated significantly more SCOD (17.77 ± 0.26 g/L) compared to other groups (p < 0.01). This can be explained by two mechanisms: (1) aeration inhibits the activity of methanogenic archaea and enhances aerobic respiratory metabolism pathways in certain microbial communities [18,19,20]; (2) as previous studies [21,22] have shown, BES inhibits methanogens, accelerating organic hydrolysis.
3.3.2. Change in Gas Component Proportions
Figure 5a illustrates the cumulative gas production under co-fermentation conditions with different initial oxygen dosages and BES supplementation levels. In the initial phase (0–4 days), all groups experienced a rapid increase in gas generation. From day 8 onwards, the O + B4 group had the highest total cumulative gas production (1420 mL), while the O + B3 group had the lowest (1015 mL).
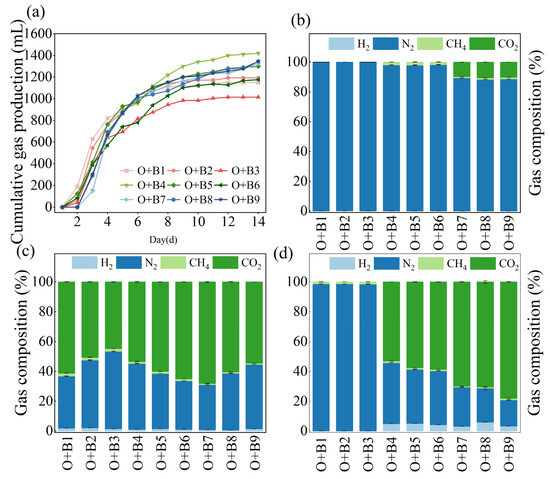
Figure 5.
Changes in gas composition ratio under different initial oxygen and BES addition combinations in fermentation methods. (a) Cumulative gas production under different initial oxygen and BES addition combinations of fermentation methods. (b) Gas composition ratio in each group on the first day of fermentation. (c) Gas composition ratio in each group on the 7th day of fermentation. (d) Gas composition ratio in each group on the 14th day of fermentation.
As depicted in Figure S3 in the Supplementary Information (daily monitoring from days 2–6 and 8–13) and Figure 5b–d (sampling days 1, 7, 14), the gas was mainly composed of N2 and CO2, with N2 being the predominant component during the early fermentation stage. Between days 2 and 7, the proportion of CO2 increased in all treatments, becoming the dominant component and fluctuating stably within certain ranges. Starting from day 8, in groups O + B1, O + B2, and O + B3, accelerated substrate depletion led to a decrease in the CO2 fraction and a re-emergence of N2 as the main component. Notably, the H2 content showed distinct temporal trends in the late fermentation stage (days 12–14). Groups O + B4 to O + B9 showed a gradual accumulation of H2, with proportions ranging from 2% to 6%. Across all groups, the CH4 content remained consistently low (2%) throughout the process.
A comparative analysis showed that oxygen-aerated treatments with BES supplementation had cumulative gas production similar to that of oxygen-aerated systems alone. However, the combined oxygen–BES treatment completely suppressed methane production. This can be attributed to two inhibitory mechanisms: (1) oxygen-mediated suppression of methanogenic activity and (2) BES-induced blockage of methyl-coenzyme M reductase in methanogens. This synergistic inhibition likely disrupted hydrogenotrophic pathways, resulting in increased H2 accumulation (3.2–5.8%). Additionally, the acidic environment created by VFA accumulation may further influence microbial metabolism through two pathways: (1) inhibition of VFA-utilizing syntrophic bacteria and (2) a metabolic shift towards hydrogenogenic pathways in acid-tolerant microorganisms. This hypothesis is consistent with previous reports on pH-mediated metabolic redirection in anaerobic systems [23,24].
3.3.3. Variations in Acid-Producing Efficiency
Figure 6 presents the dynamic trends of VFA accumulation under various combinations of initial oxygenation levels and BES dosages. In the first seven days of fermentation, all treatment groups witnessed a rapid increase in VFA levels, with concentrations rising from 872–1550 mg/L to 3961–4986 mg/L. After this period, only the O + B5 and O + B7 groups continued to accumulate VFA, while the others stabilized. By day 14, the final cumulative VFA production ranged from 4136 to 5896 mg/L, with the O + B5 group achieving the highest accumulation (5895.92 ± 69.54 mg/L), which was significantly greater than that of other treatments (p < 0.05). This finding is in line with known microbial metabolic concepts, where alkaline conditions promote organic hydrolysis, and neutral pH values are conducive to acidogenesis and VFA accumulation [25,26].
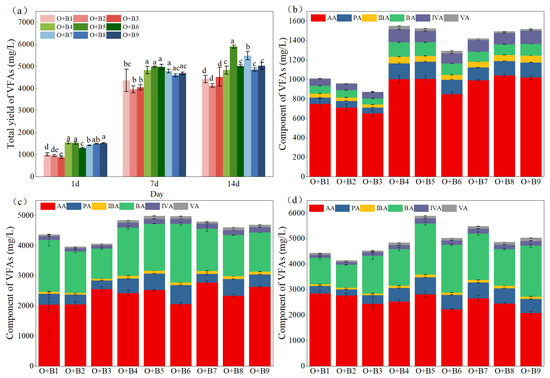
Figure 6.
Changes in acid production efficiency under different initial oxygen and BES addition combinations of fermentation methods. (a) Changes in the cumulative yield of VFA. (b) VFA Components in each group on the first day of fermentation. (c) VFA Components in each group on the 7th day of fermentation. (d) VFA components in each group on the 14th day of fermentation. Values followed by different letters are statistically significant at p < 0.05.
The analysis of VFA species showed distinct temporal patterns. During the early fermentation stage (days 0–7), the O + B1, O + B2, and O + B3 groups had significantly lower accumulation of individual components compared to other groups (p < 0.05). AA and BA were the major components, reaching 2037.86–2780.21 mg/L and 997.63–1951.61 mg/L, respectively. Notably, the O + B7 group achieved the highest AA accumulation (2780.21 ± 49.85 mg/L), which was significantly higher than most groups, except O + B9 (p < 0.05), while the O + B6 group had the highest BA production (1951.60 ± 44.78 mg/L, p < 0.01 compared to other groups). By day 14, the O + B1 group had the highest AA accumulation (2853.67 ± 100.52 mg/L, p < 0.01 compared to most groups), and the O + B5 group had the highest BA accumulation (2004.42 ± 66.99 mg/L, p < 0.05 compared to the majority of groups). The concentrations of secondary VFA components peaked by day 7 and then fluctuated minimally.
3.3.4. Interactive Effects of Physicochemical Properties
As shown in Table S2 (Supplementary Information), the experimental setup employed a two-way factorial design with three oxygenation levels (200, 300, 400 mL) and three BES dosages (20, 30, 40 mmol/L) as fixed factors. The study evaluated three aspects: (1) the main effects of the oxygenation level, (2) the main effects of the BES dosage, and (3) their interaction effects. Two-way ANOVA results showed significant interaction effects between oxygenation and BES treatments for all measured parameters (p < 0.05), suggesting that the combined application of these factors elicited synergistic responses in the system, which differed from the effects of individual factors.
In the main effects analysis, the oxygenation level had a predominant influence on pH (partial eta-squared, η2 = 0.98), electrical conductivity (EC, η2 = 0.90), and soluble chemical oxygen demand (SCOD, η2 = 0.97). In contrast, the BES dosage had a relatively limited impact on SCOD (η2 = 0.36). Both factors had comparable effects on the proportions of H2, N2, and CO2. However, the oxygenation level was the primary determinant of CH4 content (η2 = 0.97) compared to the BES dosage (η2 = 0.59). Regarding acidogenesis, the oxygenation level mainly regulated total VFA accumulation (η2 = 0.81), especially PA (η2 = 0.98), IBA (η2 = 0.89), IVA (η2 = 0.92), and VA (η2 = 0.88). The BES dosage specifically controlled AA production (η2 = 0.78), and both factors had similar effects on BA generation (η2 = 0.94 for oxygenation and η2 = 0.84 for BES).
3.4. Effect of Different Fermentation Modes on Key Metabolic Enzyme Contents
To explore acidogenesis patterns under various fermentation modes, the groups with the highest VFA accumulation (O3, BES3, and O + B5) were chosen for metabolic enzyme activity analysis (Figure 7).
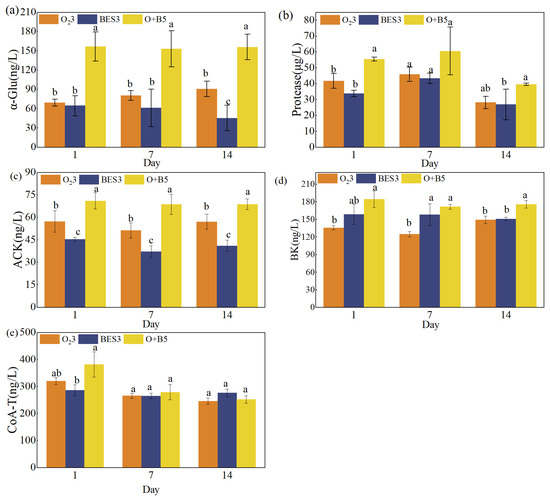
Figure 7.
Changes in the concentration of key metabolic enzymes in different fermentation methods. (a) α-Glu; (b) protease; (c) ACK; (d) BK; (e) CoA-T. Values followed by different letters are statistically significant at p < 0.05.
The concentrations of α-Glu and protease represented the degradation capacities of carbohydrates and proteins, respectively. During the entire fermentation process, the O + B5 group consistently had significantly higher α-Glu levels (156.83 ± 22.74 ng/L; p < 0.05) than other treatments. At day 14, the α-Glu concentration in the O3 group (69.36 ± 5.52 ng/L) was higher than that in the BES3 group (p < 0.05). Protease activity in all groups followed a unimodal trend. On day 1, the O + B5 group showed the highest protease activity (55.49 ± 1.36 μg/L; p < 0.05), and the O3 group outperformed the BES3 group (p < 0.05). By day 14, the O + B5 group still maintained significantly higher protease levels than the BES3 group (p < 0.05). These results imply that supplementing oxygen and BES can synergistically enhance the activity of hydrolytic enzymes, likely by activating microorganisms, thus accelerating substrate hydrolysis and organic acid production.
ACK and BK activities were measured to assess acidogenesis dynamics. ACK levels remained relatively stable throughout fermentation. The O + B5 group had significantly higher ACK activity than other groups (p < 0.05), and the O3 group had higher activity than the BES3 group (p < 0.05). The increased ACK activity in the O + B5 group probably promoted the conversion of acetyl-phosphate to AA [27]. BK analysis showed that the O + B5 group reached the highest concentration (184.41 ± 14.24 ng/L) on day 1 (p < 0.01 compared to O3). By day 7, both the BES3 group (157.97 ± 18.70 ng/L) and the O + B5 group (171.64 ± 3.93 ng/L) had higher BK levels than the O3 group (p < 0.05). At day 14, the O + B5 group still had the highest BK levels (175.87 ± 6.67 ng/L; p < 0.05), which was consistent with its superior BA production.
CoA-T analysis indicated that on day 1, the O3 group (320.71 ± 12.47 ng/L) and the O + B5 group (382.39 ± 46.70 ng/L) had higher initial levels (p < 0.01 compared to BES3). All groups experienced a decrease in CoA-T activity from day 1 to day 7, reaching similar levels. By day 14, the BES3 group showed a slight recovery in CoA-T activity, while the O3 and O + B5 groups showed a gradual decline. The oxygen-induced oxidative stress [23,28] and BES-mediated alterations in redox balance [23,29] may account for these patterns of CoA-T activity.
In conclusion, our findings show that the combination of oxygen exposure (300 mL) and BES supplementation (30 mmol/L) optimizes acidogenic performance through three synergistic mechanisms: (1) enhancing the activity of hydrolytic enzymes for more efficient substrate degradation, (2) increasing acidogenic kinase activity to redirect metabolic flux, and (3) regulating the redox balance through the complementary interactions of oxygen and BES.
3.5. Correlation Analysis Between Acid-Producing Efficiency and Environmental Factors Under Different Fermentation Modes
Spearman’s rank correlation analysis was conducted to explore the relationships between VFA accumulation and operational parameters in various fermentation modes (Figure 8). The main results uncovered diverse correlation patterns:
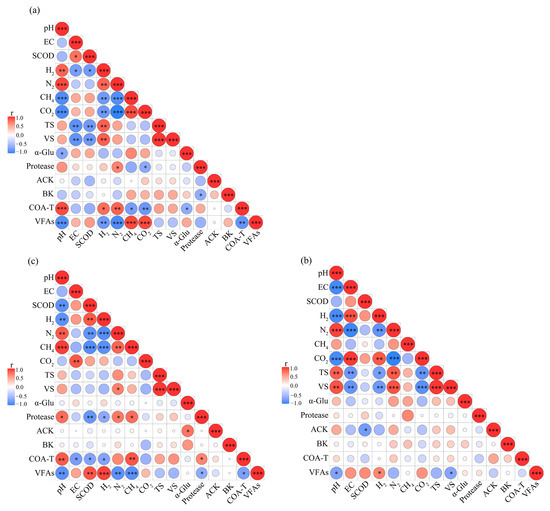
Figure 8.
Analysis results of Spearman correlation coefficient between acid production efficiency and environmental factors under different fermentation methods. (a) O3 group; (b) BES3 group; (c) O + B5 group. Note: * means significant at p = 0.05 level, ** means significant at p = 0.01 level, and *** means significant at p = 0.001 level.
In the O3 group, VFAs had a strong negative correlation with N2 (p < 0.001) and significant negative relationships with H2 and CoA-T (p < 0.01). In contrast, positive correlations were found with CH4 and CO2 (p < 0.001). For the BES3 group, no strong correlations were detected (p > 0.01). This is probably because BES inhibited methanogens, accelerating the completion of the acidogenic phase and establishing system equilibrium. Moderate correlations between VFAs and VS, as well as between VFAs and H2, were observed (p < 0.05). The O + B5 regime presented the most intricate interaction network: VFAs were negatively correlated with CH4 (p < 0.001), pH (p < 0.01), N2 (p < 0.01), protease (p < 0.05), and CoA-T (p < 0.05), while positive correlations were identified with H2 (p < 0.001) and SCOD (p < 0.01).
Multivariate analysis determined that six key parameters (pH, SCOD, H2, N2, CH4, CO2) had strong associations with VFAs across all treatments. This indicates their crucial roles in regulating acidogenesis. The combined O + B5 treatment, in particular, enhanced these interparameter relationships through the joint action of oxygen-mediated microbial selection and BES-induced metabolic pathway regulation.
4. Conclusions
The experimental outcomes showed that pretreating the substrate by composting the core material for 12 h, followed by a 10 min thermal treatment at 85 °C, significantly improved the subsequent anaerobic acidogenic performance. The most effective integrated approach consisted of 12 h compost pretreatment with 85 °C thermal treatment, in combination with 300 mL of aeration and 30 mmol/L of BES supplementation. Under these conditions, the integrated strategy of controlled aeration and BES supplementation provided synergistic advantages: it accelerated the accumulation of volatile fatty acids (VFAs), shortened the duration of the acidogenic phase, and effectively suppressed methane production. Specifically, the combination of 300 mL of oxygen supply and 30 mmol/L of BES addition led to a higher VFA yield than groups with BES supplementation alone or oxygen-supplied groups. Additionally, an initial aeration of 200 mL together with 40 mmol/L of BES supplementation was especially effective in reducing cumulative greenhouse gas emissions. These experimental results achieved the highest VFA productivity. This research illustrates how integrating pretreatment, oxygen regulation, and metabolic inhibitors can deliberately redirect carbon flow in livestock wastewater treatment systems, presenting a multi-objective solution for enhancing acidogenic efficiency and controlling environmental impacts.
Supplementary Materials
The following supporting information can be downloaded at: https://www.mdpi.com/article/10.3390/su17146494/s1, Table S1: VFA standard solution concentrations; Table S2: Inter-subject effects of different initial oxygen flux and BES addition on physicochemical properties; Figure S1: Changes in SCOD in compost-assisted thermal pretreatment; Figure S2: Standard curve for α-Glu; Protease; ACK; BK and CoA-T; Figure S3: Daily gas composition profiles.
Author Contributions
Data curation, Z.G. and H.Y.; Writing—original draft, Y.W.; Writing—review & editing, D.J. and X.H.; Project administration, L.B. All authors have read and agreed to the published version of the manuscript.
Funding
This research was funded by Sichuan Province Science and Technology Support Program, grant number 2021ZDZX0012-02, Sichuan Swine Innovation Team Construction Project of National Modern Agricultural Industry Technology System of China, grant number sccxtd-2025-08-06.
Institutional Review Board Statement
Not applicable.
Informed Consent Statement
Not applicable.
Data Availability Statement
Data is contained within the article or Supplementary Material.
Conflicts of Interest
The authors declare no conflict of interest.
References
- Yadav, M.; Joshi, C.; Paritosh, K.; Thakur, J.; Pareek, N.; Masakapalli, S.K.; Vivekanand, V. Reprint of Organic waste conversion through anaerobic digestion: A critical insight into the metabolic pathways and microbial interactions. Metab. Eng. 2022, 71, 62–76. [Google Scholar] [CrossRef]
- Zhong, Y.; Deng, Q.; Zhang, P.; Wang, J.; Wang, R.; Zeng, Z.; Deng, S. Sulfonic acid functionalized hydrophobic mesoporous biochar: Design, preparation and acid-catalytic properties. Fuel 2019, 240, 270–277. [Google Scholar] [CrossRef]
- Chen, N. Study on Preparation of Rice Husk-Based Solid Acid and Catalytic Hydrolysis of Corn Cob to Promote Sugar and Volatile Fatty Acid Production. Master’s Thesis, Beijing Forestry University, Beijing, China, 2021. (In Chinese). [Google Scholar]
- Yao, Y.; Huang, G.; An, C.; Chen, X.; Zhang, P.; Xin, X.; Shen, J.; Agnew, J. Anaerobic digestion of livestock manure in cold regions: Technological advancements and global impacts. Renew. Sustain. Energy Rev. 2020, 119, 109494. [Google Scholar] [CrossRef]
- Valentino, F.; Munarin, G.; Biasiolo, M.; Cavinato, C.; Bolzonella, D.; Pavan, P. Enhancing volatile fatty acids (VFA) production from food waste in a two-phases pilot-scale anaerobic digestion process. J. Environ. Chem. Eng. 2021, 9, 106062. [Google Scholar] [CrossRef]
- Ni, R.; Xu, C.; Shi, X.; Yang, S.; Li, L.; Peng, X.; Song, L. Acetoclastic methanogenesis pathway stability despite the high microbial taxonomic variability in the transition from acidogenesis to methanogenesis during food waste anaerobic digestion. J. Clean. Prod. 2022, 372, 133758. [Google Scholar] [CrossRef]
- Chang, H.; Li, H.; Yan, Z. The effect of total solid concentration on swine manure continuous anaerobic fermentation under medium temperature. J. Shaanxi Univ. Sci. Technol. 2017, 35, 27–31. (In Chinese) [Google Scholar]
- Yu, N.; Guo, B.; Zhang, Y.; Zhang, L.; Zhou, Y.; Liu, Y. Different micro-aeration rates facilitate production of different end-products from source-diverted blackwater. Water Res. 2020, 177, 115783. [Google Scholar] [CrossRef]
- Qiu, S.; Xia, W.; Xu, J.; Li, Z.; Ge, S. Impacts of 2-bromoethanesulfonic sodium on methanogenesis: Methanogen metabolism and community structure. Water Res. 2023, 230, 119527. [Google Scholar] [CrossRef]
- Conrad, R.; Klose, M. Selective inhibition of reactions involved in methanogenesis and fatty acid production on rice roots. FEMS Microbiol. Ecol. 2000, 34, 27–34. [Google Scholar] [CrossRef]
- Deng, Z.; Peng, J.; Song, Y.; Yuan, L. Effect of 2-Bromoethane Sulfonate on Operational Performance and Microorganism Structure of Anaerobic Baffled Reactor. J. Environ. Eng. 2012, 2, 461–467. (In Chinese) [Google Scholar] [CrossRef]
- Zhang, R.N.; Li, H.; Tang, J.Y.; Wu, C.M.; Luo, Y.H. The Determination of the Concentration of Short Chain Fatty Acids in the Intestinal Digesta and Serum of Pigs. Bio-101 2021, e2003671. (In Chinese) [Google Scholar] [CrossRef]
- Liu, Y.; Wu, Z.; Lv, Y.; Jiang, L.; Wei, Y.; Li, Y.Y.; Liu, J. Recovery of an acidified food waste anaerobic digestion reactor via NH4+-N and trace metals addition: Performance, microbial community response, and mechanisms. J. Clean. Prod. 2023, 425, 138978. [Google Scholar] [CrossRef]
- Rani, J.; Dhoble, A.S. Adaptability and diversity of core microbiome in evaluating the effect of digested versus raw manure in anaerobic digestion of rice straw. Fuel 2024, 357, 130010. [Google Scholar] [CrossRef]
- Wicker, R.J.; Daneshvar, E.; Patel, A.; Dhar, B.R.; Bhatnagar, A. Production of biomethane, biohydrogen, and volatile fatty acids from Nordic phytoplankton biomass grown in blended wastewater. Chem. Eng. J. 2024, 479, 147809. [Google Scholar] [CrossRef]
- Zhang, L. Directional Optimization of Acetic Acid Production from Anaerobic Fermentation of Peanut Meal by Homoacetogens/nZVl. Master’s Thesis, Guangzhou University, Guangzhou, China, 2021. (In Chinese). [Google Scholar]
- Li, J.; Chang, S.; Liu, F. Effect of different pretreatment methods on fermentative hydrogen production of excess sludge. J. Harbin Inst. Technol. 2011, 43, 45–50. (In Chinese) [Google Scholar]
- Chen, Q.; Wu, W.; Qi, D.; Ding, Y.; Zhao, Z. Review on microaeration-based anaerobic digestion: State of the art, challenges, and prospectives. Sci. Total Environ. 2020, 710, 136388. [Google Scholar] [CrossRef] [PubMed]
- Liu, K.; Lv, L.; Li, W.; Wang, X.; Han, M.; Ren, Z.; Gao, W.; Wang, P.; Liu, X.; Zhang, G. Micro-aeration and leachate recirculation for the acceleration of landfill stabilization: Enhanced hydrolytic acidification by facultative bacteria. Bioresour. Technol. 2023, 387, 129615. [Google Scholar] [CrossRef]
- Zhang, Z.; Xi, H.; Yu, Y.; Wu, C.; Yang, Y.; Guo, Z.; Zhou, Y. Coupling of membrane-based bubbleless micro-aeration for 2,4-dinitrophenol degradation in a hydrolysis acidification reactor. Water Res. 2022, 212, 118119. [Google Scholar] [CrossRef] [PubMed]
- Chidthaisong, A.; Conrad, R. Specificity of chloroform, 2-bromoethanesulfonate and fluoroacetate to inhibit methanogenesis and other anaerobic processes in anoxic rice field soil. Soil. Biol. Biochem. 2020, 32, 977–988. [Google Scholar] [CrossRef]
- Zinder, S.H.; Anguish, T.; Cardwell, S.C. Selective Inhibition by 2-Bromoethanesulfonate of Methanogenesis from Acetate in a Thermophilic Anaerobic Digestor. Appl. Environ. Microbiol. 1984, 47, 1343–1345. [Google Scholar] [CrossRef]
- Fu, S.; Lian, S.; Angelidaki, I.; Guo, R. Micro-aeration: An attractive strategy to facilitate anaerobic digestion. Trends Biotechnol. 2023, 41, 714–726. [Google Scholar] [CrossRef] [PubMed]
- Ghimire, A.; Frunzo, L.; Pontoni, L.; d’Antonio, G.; Lens, P.N.L.; Esposito, G.; Pirozzi, F. Dark fermentation of complex waste biomass for biohydrogen production by pretreated thermophilic anaerobic digestate. Environ. Manag. 2015, 152, 43–48. [Google Scholar] [CrossRef]
- Chen, Y.; Jiang, S.; Yuan, H.; Zhou, Q.; Gu, G. Hydrolysis and acidification of waste activated sludge at different pHs. Water Res. 2007, 41, 683–689. [Google Scholar] [CrossRef] [PubMed]
- Jankowska, E.; Chwialkowska, J.; Stodolny, M.; Oleskowicz-Popiel, P. Volatile fatty acids production during mixed culture fermentation-The impact of substrate complexity and pH. Chem. Eng. J. 2017, 326, 901–910. [Google Scholar] [CrossRef]
- Wang, H.; Zeng, S.; Pan, X.; Liu, L.; Chen, Y.; Tang, J.; Luo, F. Bioelectrochemically assisting anaerobic digestion enhanced methane production under low-temperature. Renew. Energy 2022, 194, 1071–1083. [Google Scholar] [CrossRef]
- Jezierski, A.; Drozd, J.; Jerzykiewicz, M.; Chen, Y.; Kaye, K. EPR in the environmental control: Copper complexes and free radicals in soil and municipal solid waste compost. Appl. Magn. Reson. 1998, 14, 275–282. [Google Scholar] [CrossRef]
- Nguyen, D.; Khanal, S.K. A little breath of fresh air into an anaerobic system: How microaeration facilitates anaerobic digestion process. Biotechnol. Adv. 2018, 36, 1971–1983. [Google Scholar] [CrossRef]
Disclaimer/Publisher’s Note: The statements, opinions and data contained in all publications are solely those of the individual author(s) and contributor(s) and not of MDPI and/or the editor(s). MDPI and/or the editor(s) disclaim responsibility for any injury to people or property resulting from any ideas, methods, instructions or products referred to in the content. |
© 2025 by the authors. Licensee MDPI, Basel, Switzerland. This article is an open access article distributed under the terms and conditions of the Creative Commons Attribution (CC BY) license (https://creativecommons.org/licenses/by/4.0/).