Abstract
Rapid urbanization has exacerbated the urban heat island effect, posing a significant threat to human health and urban ecosystems. While numerous studies have demonstrated that urban morphology significantly influences land surface temperatures (LSTs), few have systematically explored the impact and contribution of urban morphology on LST across different functional zones. Therefore, this study takes Xi’an as a case and employs an interpretable CatBoost-SHAP machine learning model to evaluate the nonlinear influence of building landscape features on LST in different functional zones during summer. The results indicate the following: (1) The highest LST in the study area reached 52.68 °C, while the lowest was 21.68 °C. High-temperature areas were predominantly concentrated in the urban center and industrial zones with dense buildings, whereas areas around water bodies and green spaces exhibited relatively lower temperatures. (2) SHAP analysis revealed that landscape indicators exerted the most substantial impact across all functional zones, with green space zones contributing up to 62%. Among these, fractional vegetation coverage (FVC), as a core landscape factor, served as the primary cooling factor in all six functional zones and consistently demonstrated a negative effect. (3) Population density (POP) exhibited a generally high SHAP contribution across all functional zones, showing a positive correlation. Its effect was most pronounced in commercial zones, accounting for 16%. When POP ranged between 0 and 250 people, the warming effect was particularly prominent. (4) The mean building height (MBH) constituted a major influencing factor in most functional zones, especially in residential zones, where the SHAP value reached 0.7643. Within the range of 10–20 m, the SHAP value increased sharply, indicating a significant warming effect. (5) This study proposes targeted cooling strategies tailored to six functional zones, providing a scientific basis for formulating targeted mitigation strategies for different functional zones to alleviate the urban heat island effect.
1. Introduction
With the rapid advancement of urbanization, the physical structure, ecological pattern, and climate system of global cities are undergoing continuous transformation, posing increasingly severe environmental challenges [1]. Among these challenges, the urban heat island (UHI) effect stands out as a significant microclimate issue resulting from urban expansion. It is characterized by higher temperatures in urban areas compared to surrounding rural regions [2]. This phenomenon primarily arises from the substitution of natural surfaces with impervious materials, which leads to heat accumulation and restricted latent heat dissipation, thereby exacerbating surface warming [3]. In China, rapidly urbanizing megacities such as Xi’an are experiencing intensified UHI superimposition effects, significantly undermining ecological resilience and impeding sustainable development. The UHI effect not only compromises thermal comfort and public health but also increases energy consumption and carbon emissions, posing a serious threat to urban sustainability [4]. Consequently, elucidating the driving mechanisms of the UHI effect has become a critical focus in urban climate regulation and sustainable development research.
To capture the characteristic differences of the urban heat island effect across various regions, previous studies have predominantly utilized spatial grids as the analysis unit to investigate its relationship with land surface temperatures (LSTs). However, such rigidly defined spatial units exhibit limited applicability in practical urban planning [5]. In contrast, urban functional zones, which serve as fundamental planning units, typically possess similar spatial forms and human activity patterns within the same type of area. Consequently, they are regarded as ideal classification units for studying the UHI effect. Existing research has demonstrated that LST varies significantly among different functional zones [6]. Therefore, analyzing the UHI effect using urban functional zones as the analysis unit can facilitate the development of more targeted and operational urban planning strategies aimed at optimizing the urban thermal environment [7]. Prior studies employing functional zone classification have primarily focused on examining the spatial distribution characteristics of the UHI effect across different functional zones. For example, residential zones often display higher temperatures and pronounced heat accumulation, whereas green spaces and parks exhibit substantial cooling effects [8]. Compared to single-functional zones, composite functional zones tend to demonstrate a stronger warming trend [9]. Despite these studies revealing the spatial distribution patterns of LST, effective cooling strategies tailored to different functional zones remain an area requiring further in-depth exploration.
A comprehensive understanding of the primary influencing indicators and regulatory mechanisms of the UHI effect serves as the foundation for developing scientifically grounded response strategies. Urban morphology constitutes a core indicator impacting the UHI effect and has long been a focal point of research [10]. Early studies predominantly concentrated on 2D morphological indicators, such as land cover types and the spatial distribution of green spaces, which LSTs influence by influencing energy balance and water exchange processes. An increase in impervious surfaces typically intensifies heat accumulation, whereas green spaces and water bodies contribute to temperature reduction [11]. Furthermore, the spatial connectivity and fragmentation characteristics of green spaces are closely associated with local temperature variations [12]. However, 2D morphological indicators exhibit limitations in capturing the complexity of urban space. As research advances, 3D morphological indicators have increasingly garnered attention [13]. Certain studies have highlighted that high-rise buildings can obstruct direct radiation during the day, thereby reducing surface temperatures, but may exacerbate heat accumulation at night [14,15]. The sky view indicator (SVF) has also been found to exhibit a nonlinear hump-shaped relationship with LST [16]. Given the substantial variability in urban morphology across different functional zones [17], the same indicator may manifest entirely distinct or even opposing thermal effects in varying areas [18]. Consequently, investigating the mechanisms of urban morphology within different functional zones can enhance our understanding of the spatial heterogeneity of the UHI effect.
When investigating the indicators influencing the urban heat island effect, many existing studies commonly utilize linear regression methods, such as ordinary least squares (OLS) [19]. Linear regression methods are typically employed to model the relationship between LST and urban morphology; however, they exhibit significant limitations in addressing nonlinear relationships, variable interaction effects, and multicollinearity [20]. To address these limitations, an increasing number of studies have adopted machine learning approaches, which have confirmed the pervasive nonlinear relationships among variables associated with the UHI effect [21]. For instance, machine learning models such as random forest (RF), gradient boosting decision tree (GBDT), and extreme gradient boosting (XGBoost) have been extensively applied in urban thermal environment research [22,23], demonstrating superior modeling capabilities and prediction accuracy [24]. The advantage of these nonlinear models lies in their ability to flexibly capture complex nonlinear relationships without requiring pre-specified assumptions about the relationships between variables [25]. This study employs the classification boosting (CatBoost) machine learning method to investigate the nonlinear relationship between urban morphology and LST. As a novel ensemble learning algorithm, CatBoost provides efficient computational performance and robust predictive performance [26], and it has been successfully applied in fields such as weather forecasting, soil moisture estimation, and ecological simulation [27,28]. However, its application in UHI research remains relatively limited. Although machine learning enhances predictive capabilities, its “black box” nature presents challenges for explaining the influence mechanisms of variables, which is critical for policy-making and policy-planning practices [29]. To improve model interpretability, this study introduces the SHapley Additive exPlanations (SHAPs) method to quantify the contribution direction and intensity of each variable to the prediction results [30]. The integration of CatBoost and SHAP enhances model transparency at both global and local scales, further revealing the nonlinear effects and interaction relationships of urban morphology indicators on LSTs.
This study takes the central urban area of Xi’an as a case study. As the historical starting point of the Silk Road, Xi’an has undergone rapid urban expansion in recent years, accompanied by increasingly severe heat stress and frequent extreme high-temperature events [31]. The primary objective of this study is to employ an interpretable machine learning model to investigate the differential mechanisms and nonlinear influences of urban morphology on LST across various functional zones during summer. The specific aims are as follows: (1) to evaluate the intensity and spatial characteristics of the UHI effect in different functional zones during summer through surface temperature inversion; (2) to utilize the CatBoost-SHAP model to identify and quantify the nonlinear impacts and interactions of urban morphology indicators on the UHI effect within different functional zones; (3) to propose targeted cooling strategies for urban morphology optimization in different functional zones based on the research findings. This study is expected to provide theoretical support and practical guidance for UHI mitigation in Xi’an and other rapidly urbanizing cities.
2. Materials and Methods
2.1. Materials
2.1.1. Study Area
Xi’an, the capital of Shaanxi Province, is categorized as a megacity in the “Basic Situation of Population in Super-large and Large Cities of the Seventh National Population Census” published by the National Bureau of Statistics. Spanning an area of approximately 10,108 square kilometers, Xi’an had a permanent resident population of 13.0782 million as of the end of 2023, with an urbanization rate of 79.88%. The high level of urbanization and rapid economic growth have substantially heightened the risk of urban heatwaves. Situated in the Guanzhong Plain and encircled by mountains, Xi’an exhibits a closed topography and a relatively low average annual wind speed, resulting in a pronounced heat accumulation effect, particularly during summer months. The average temperature in July reaches 27.8 °C, while the extreme maximum temperature can soar to 43.3 °C. Consequently, elucidating the driving mechanisms of the urban heat island effect across different functional zones holds significant implications for optimizing the urban thermal environment. This study focuses on the central urban area of Xi’an, encompassing Xincheng District, Beilin District, Lianhu District, Yanta District, Weiyang District, and Baqiao District. Despite accounting for less than 9% of the city’s total land area, this region accommodates over half of the city’s permanent residents [32,33]. As shown in Figure 1.
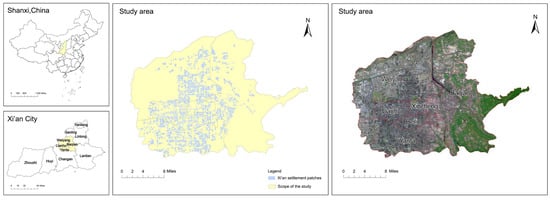
Figure 1.
Study area.
2.1.2. Datasets
The dataset used in this study includes Landsat 8 remote sensing images, road network data, POI data, vector data of buildings, and high-resolution population data. Land surface temperature (LST) extraction is based on Landsat 8/9 images from the United States Geological Survey (USGS). Road data mainly come from OpenStreetMap (https://www.openstreetmap.org), supplemented by Baidu Map data, and a complete road network is constructed using ArcGIS 10.8 software, with street segments manually delineated. POI data also come from Baidu Map (https://map.baidu.com), extracting names, categories, and spatial location information. After removing duplicates and handling missing values, the classification system is unified, and kernel density analysis and spatial clustering methods are used to identify the spatial distribution characteristics of functional areas. The processed POI data are fused with road network and land use data for urban functional area division, and they are compared with the Third National Land Survey’s data for verification. When extracting two-dimensional and three-dimensional building form indicators of the city, this study obtains vector data such as building outlines from the Baidu platform, and after topological cleaning and attribute assignment using ArcGIS tools, the average height and coverage rate of buildings are calculated. High-resolution population data come from the Figshare dataset, and they are used to obtain the fine spatial distribution of the population. Specific information about each dataset and its sources can be found in Table 1.

Table 1.
Data source and description.
2.1.3. The Delineation and Allocation of Urban Functional Zones
This study integrates POI data with road networks and land use data, and it conducts a comparative verification with the data from the Third National Land Survey. The study area is systematically divided into six main urban functional zones: residential area, industrial area, commercial area, public service area, green area, and transportation service area. Different from traditional spatial grids or homogeneous zoning methods, the delineation of functional zones more accurately captures the internal spatial structure of the city and helps to more effectively combine the analysis of heat island effect with urban planning practice [8]. As shown in Table 2.
Table 2.
Description of the UFZs.
2.2. Method
This research framework comprises three primary stages. First, urban functional zones are systematically delineated by integrating data from the Third National Land Survey, remote sensing imagery, and road network datasets. Second, the land surface temperature (LST) is extracted from remote sensing images, and its spatial distribution characteristics are comprehensively analyzed. Finally, an urban form indicator system is established, and Spearman’s correlation analysis is employed to assess the relationship between urban form and LST within each functional zone. Subsequently, the CatBoost nonlinear machine learning model is utilized to quantify the thermal effect contributions of urban form indicators to LSTs, while the SHAP method is applied to interpret the model’s outputs and identify dominant indicators. Based on these analyses, the most significant urban form characteristics influencing the LST in each functional zone are determined, thereby providing a foundation for developing precise and efficient urban cooling strategies. As shown in Figure 2.
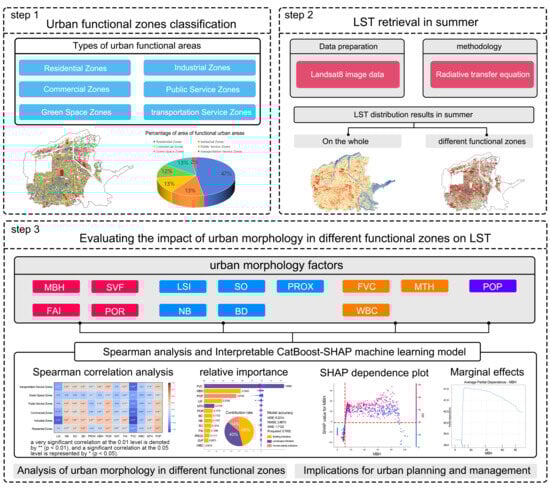
Figure 2.
Research framework.
2.2.1. LST Retrieval
Currently, surface temperature retrieval algorithms primarily encompass three categories: the radiative transfer equation, the single-window algorithm, and the split-window algorithm [34]. Owing to the instability of parameter settings in Landsat 8 OLI_TIRS, the single-window algorithm struggles to effectively assess atmospheric conditions with high water vapor content in Xi’an during the summer. In contrast, the radiative transfer equation (RTE) algorithm exhibits higher accuracy under such conditions [35,36]. Consequently, this study employed the RTE method within ENVI 5.6 software to retrieve land surface temperature (LST) from Landsat 8/9 data. Initially, the thermal infrared radiation received by the satellite sensor is calculated, as presented in Equation (1):
represents the brightness of the thermal infrared radiation received by the sensor. Here, is the surface emissivity, is the physical surface temperature, and is the blackbody radiation brightness of the TIR band. is the atmospheric transmittance of the TIR band, represents the atmospheric upwelling radiance, and represents the atmospheric downwelling radiance.
Solving Equation (1) yields the following result, and subsequently, by applying the inverse function of Planck’s law, the calculation formula for blackbody radiation intensity can be derived as follows:
Finally, the LST is expressed as obtained by the inverse function of Planck’s formula:
Here, and represent constants with values of 774.89 W/(× sr × μm) and 1321.08 K, respectively.
2.2.2. The Quantification of Urban Form
In order to systematically explore the driving mechanism of the urban heat island effect, this study constructed a multi-dimensional index system for architectural landscape forms. Architectural landscape characteristics refer to the comprehensive features of the urban physical environment jointly shaped by architectural forms and surrounding land cover. It is based on the theories of urban morphology and landscape ecology, emphasizing the combined influence of architectural structures and natural elements on the urban thermal environment. The selection of index factors follows the principles of theoretical significance, data availability, and wide application in the existing literature [37,38,39], covering 14 influencing index factors, which are overall divided into three categories: architectural form, landscape characteristics, and human activities. Given the intricate influence of architectural form on the thermal environment, architectural indicators were further subdivided into four 3D indicators and five 2D indicators. The 3D architectural indicators include mean building height (MBH), frontal area index (FAI), sky view indicator (SVF), and building porosity (POR), which collectively describe the spatial configuration of the built environment and its regulatory effects on ventilation and heat accumulation. The 2D architectural indicators comprise the length-to-width ratio (LSI), number of buildings (NB), building orientation (SO), building density (BD), and building proximity (PROX), reflecting the compactness and morphological distribution of urban spatial layouts. The selected landscape indicators include vegetation coverage (FVC), water body coverage (WBC), and mean tree height (MTH), which quantify the capacity of natural elements to modulate the local microclimate. Specifically, FVC is calculated based on Landsat 8 satellite images using the Normalized Vegetation Index (NDVI) and estimated using a binary pixel model. The image data undergoes radiation correction and atmospheric correction processing. WBC is derived from OpenStreetMap (OSM) vector data, which is rasterized and uniformly resampled to a spatial resolution of 30 m to ensure consistency with other datasets. The processing of these spatial data is mainly accomplished using ArcMap 10.7. Additionally, population density (POP) was chosen as a human activity indicator, representing the spatial distribution of socio-economic activities and providing insights into its potential impact on the thermal environment. As shown in Table 3.
Table 3.
The quantification and characterization of urban form.
2.2.3. Spearman Correlation Analysis
In this study, to investigate the correlation between urban morphology and surface temperature, Spearman correlation analysis was utilized. The Spearman correlation coefficient is a non-parametric statistical measure that is appropriate for assessing monotonic relationships between variables. It is especially effective when the data distribution is non-normal or when there exists a nonlinear relationship [46].
The correlation analysis calculation is based on the sample point data of each factor and the land surface temperature (LST) within the study area. First, all variables are standardized to ensure comparability on a consistent scale. Second, the ranks of each variable pair (X and Y) are determined, and the Spearman rank correlation coefficient is subsequently calculated using the following formula:
Among them, the Spearman correlation coefficient has a value range from −1 to 1. A positive value indicates a positive correlation, a negative value indicates a negative correlation, and 0 indicates no correlation. is the rank difference of the observed values for each team, and n is the number of observed values [47].
To test the significance of the correlation results, a two-tailed test was conducted to assess whether ρ was significantly different from zero. The significance level was set at α = 0.05, indicating that if the p-value was less than 0.05, the correlation between the variables would be considered statistically significant. Additionally, to more intuitively visualize the differences in correlations between each factor and the land surface temperature (LST) across different functional areas, a heatmap-based correlation matrix was utilized to analyze the influence of various architectural landscape features within each functional area.
2.2.4. Using Interpretable CatBoost-SHAP Machine Learning
CatBoost is a machine learning algorithm based on gradient boosting decision trees. As a powerful nonlinear model, it is capable of effectively capturing complex nonlinear relationships among variables [26]. It incorporates an advanced enhancement algorithm specifically designed for efficiently handling categorical features, thereby reducing the workload associated with feature preprocessing while preserving critical information [29]. CatBoost is widely recognized for its high accuracy and robustness, representing an optimized model that builds upon the strengths of XGBoost and LightGBM [48]. The computation process involves four distinct steps:
(1) In the model initialization stage, a constant is set as the initial prediction value to minimize the loss function, as shown in Equation (5).
(2) Additive Model: This model is constructed in a stepwise fashion. At each stage, a new weak learner, specifically a decision tree, is incorporated to update the existing model. The updating process at the mth stage is presented in Equation (6).
Here, is the learning rate, and is the new tree trained based on the residuals of the previous model.
(3) Gradient Calculation: In each iteration, the residuals, specifically the negative first-order gradients of the loss function, are computed based on the current model’s prediction results, as presented in Formula (7).
(4) Prediction: The final prediction is the sum of the initial prediction and the contributions of all trees, as shown in Equation (8):
Among them, M represents the total number of trees, and is the final prediction [18].
Although nonlinear machine learning models exhibit excellent predictive performance, their interpretability is often constrained by the “black-box” characteristic. To enhance model transparency, this paper introduces the SHAP method. SHAP is grounded in the Shapley value theory from cooperative game theory, where each feature is treated as a player in the game, and the model’s output is regarded as the game’s outcome. By calculating the SHAP value, it quantifies the contribution of each feature to the final prediction result. This method establishes an additive explanation framework, decomposing the prediction value for each sample into the contribution values of individual features. As such, it provides strong local interpretability. Currently, SHAP has been extensively applied across various domains, including thermal comfort prediction [49]. Its calculation formula is presented below:
Here, s represents the subset of all N elements excluding feature i, which is the prediction based on the feature subset s; is the number of features in subset s; and is the total number of elements.
3. Results
3.1. Urban Functional Zoning and the Spatial Pattern of Surface Temperature
The study area consists of a total of 16,155 spatial units. Using an unsupervised clustering method based on POI, land use, and road network characteristics (As shown in Figure 3), the study area was divided into six functional zones, including residential zones, commercial zones, industrial zones, public service zones, green land zones, and transportation service zones. Among them, residential zones, commercial zones, and industrial zones account for 47%, 13%, and 13% of the total area, respectively. Public service zones, green space zones, and transportation service zones make up 12%, 13%, and 2%, respectively. Residential zones are mainly distributed in the city center and newly developed areas around it, while commercial and industrial zones are concentrated along major roads and in economic development zones. Residential zones have the largest number, accounting for 47% of all units, and they are a mixture of high-density and low-rise residences. Transportation service zones have the smallest proportion at 5%, and they are mainly composed of transportation hubs, parking lots, and rail transit facilities. The northwest direction of the study area, which includes important historical sites such as Han Chang’an City, is subject to strict protection and development restrictions, and thus, there are no large buildings. As shown in Figure 4.
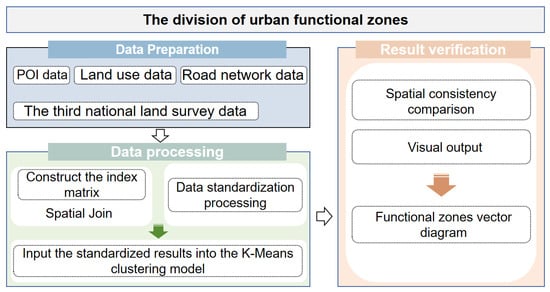
Figure 3.
Urban functional zone division.
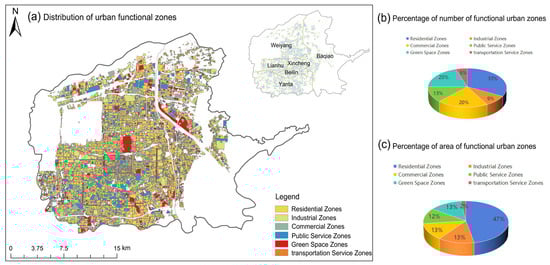
Figure 4.
The spatial distribution of various functional area types in Xi’an.
Figure 5 shows the distribution of land surface temperatures (LSTs) in the study area. The maximum LST reaches 52.68 °C, while the minimum LST is 21.68 °C. Higher LST values mainly occur in densely populated zones with tall and compact buildings. Due to the limited insulation building materials and vegetation coverage, these zones exhibit a strong urban heat island (UHI) effect. In contrast, lower LST values are found near rivers, lakes, urban parks, and other zones rich in vegetation. The right side of the figure shows the spatial distribution of LST in urban functional zones. In comparison, high-temperature zones are concentrated in the dense urban core and industrial zones, while low-temperature zones are typically located near water bodies and green spaces.
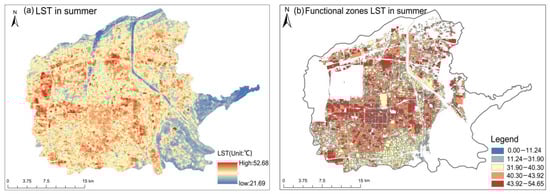
Figure 5.
Spatial distribution of surface temperature in Xi’an.
3.2. Correlation Analysis of Urban Form and LST
We utilized Spearman’s correlation analysis to investigate the relationships between urban form factors and LST. The results revealed significant variations among different functional zones. In industrial and transportation zones, building density (BD), average building height (MBH), and building proximity (PROX) exhibited strong positive correlations with LST, with correlation coefficients exceeding 0.2. This finding suggests that the concentration of high-rise buildings may intensify the UHI. The sky view factor (SVF) demonstrated varying impacts across regions. Specifically, in industrial zones, SVF showed a significant positive correlation (r = 0.15), indicating that reduced sky openness might hinder heat dissipation and exacerbate the local thermal environment. Conversely, vegetation coverage (FVC) was negatively correlated with LSTs in all zones, with the strongest negative correlation observed in industrial zones (r = −0.52), underscoring the critical role of vegetation in mitigating the UHI. The water coverage rate (WBC) exhibited weak correlations with LSTs in most regions, suggesting that its cooling effect is highly context-dependent. Population (POP) displayed a significant positive correlation with LST in industrial zones (r = 0.43), reflecting the potential influence of densely populated zones on increased building density and human activity intensity, which contribute to elevated surface temperatures. Overall, compact and high-rise urban forms tend to worsen thermal conditions, while vegetation and water bodies provide some degree of thermal relief, albeit with effects varying by functional zones. As shown in Figure 6.
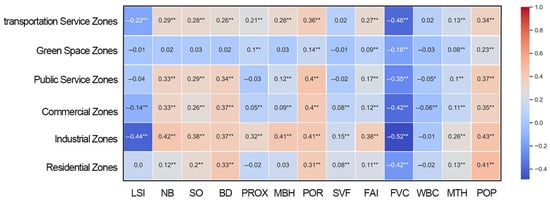
Figure 6.
The correlation between the urban form and LST of all functional zones (a very significant correlation at the 0.01 level is denoted by ** (p < 0.01), and a significant correlation at the 0.05 level is represented by * (p < 0.05)).
3.3. The Influence of Urban Form on LST in Different Functional Zones
3.3.1. The Ranking of the Importance of Urban Form Factors
We employed the CatBoost-SHAP model system to conduct a systematic assessment of the influence of urban form indicators on LST in different urban functional areas. Among them, the SHAP bar chart shows the average absolute contribution value of each variable to the model’s prediction results, which is used to measure the importance of the variables. The SHAP beeswarm plots further reveal the specific impact direction of variables on the prediction results. Each point represents a sample, and the color indicates the magnitude of the feature value (red indicates a high value, and blue indicates a low value). The x-axis reflects the SHAP value, which represents the direction and magnitude of the feature’s impact on the prediction. Points to the left of zero indicate that the feature has a negative impact on the result for that specific value, while points to the right indicate a positive contribution. The research results show that, in all functional areas, FVC is always the most significant factor, ranking first in the SHAP importance ranking. At the same time, the high values of FVC mainly correspond to negative SHAP values, demonstrating a stable cooling effect. The landscape indicators as a whole show a strong influence, especially in the green areas, contributing up to 62% to the total model contribution, which can be clearly seen in the SHAP pie chart. POP shows a continuous positive impact on LSTs for all functional zones, and its influence is most obvious in the commercial zones, accounting for 16% of the total contribution. This indicates that densely populated areas are more prone to heat accumulation, leading to an increase in surface temperature. Among the indicators related to buildings, MBH plays a crucial role, especially in residential zones, with an average absolute SHAP value of 0.7643. According to the SHAP beeswarm chart, its positive impact means that greater vertical development will exacerbate heat accumulation, resulting in a higher LST. POR is particularly prominent in industrial zones and transportation service zones, with average SHAP values of 0.4305 and 0.3850, respectively. The beeswarm chart shows that higher POR values are mainly associated with positive SHAP values, indicating that the greater the openness of the space, the more likely it is to cause warming in areas with less vegetation or less shading. In industrial zones, the beeswarm chart shows that higher LSI values are often consistent with negative SHAP values, indicating that more complex plot boundaries are conducive to ventilation and heat dissipation, thereby reducing LST. Compared to most functional zones, the SHAP values of BD, WBC, and SVF are relatively low, meaning that they have limited direct impact on LST, and these factors may indirectly affect temperature through interactions with other variables. As shown in Figure 7.
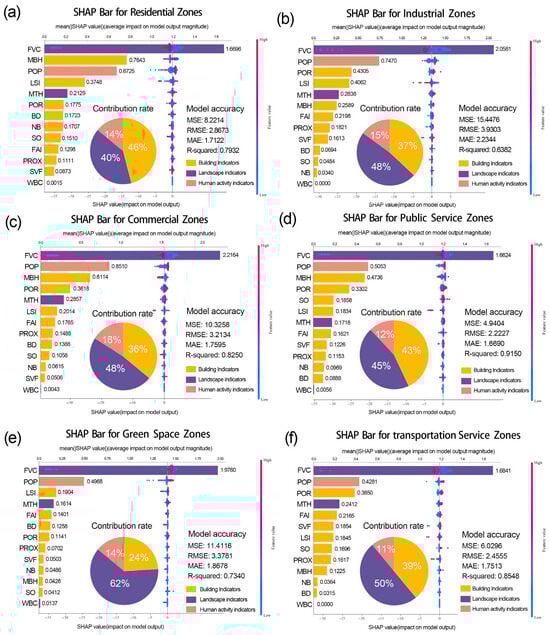
Figure 7.
SHAP values and contribution rates of urban form indicators.
3.3.2. Nonlinear Effects and Interactions of Dominant Factors
The influence of urban form on surface temperature is not isolated but rather interdependent and subject to complex interactions. To comprehensively uncover its nonlinear effects and collaborative mechanisms, this study utilizes SHAP dependence plots for analysis across different urban functional zones. In these plots, the x-axis represents the range of variable values, the left y-axis indicates the SHAP values (where positive values signify warming effects and negative values denote cooling effects), and the right y-axis corresponds to an additional variable. The color gradient, ranging from blue (low values) to red (high values), illustrates the distribution of this variable. The variations in point colors elucidate the interaction effects among variables.
In residential zones, MBH exhibits a significant nonlinear warming effect on LST, as illustrated in Figure 8b. When MBH increases from 10 m to approximately 20 m, the SHAP value rises sharply, leading to a notable increase in LST. Subsequently, the effect stabilizes and slightly diminishes when MBH exceeds 80 m, potentially due to shading effects and enhanced airflow from high-rise buildings, which mitigates heat accumulation. Additionally, there is a synergistic interaction between MBH and BD. When BD is below 20%, a higher BD tends to alleviate the warming effect caused by MBH. Conversely, when BD exceeds 20%, the combined influence of MBH and BD significantly raises the LST, reflecting the compounded thermal impact of high-density, high-rise urban development. LSI on LST demonstrates a peak characteristic, as shown in Figure 8d. As LSI increases, the SHAP value rises, reaching a peak around 0.1, and then, it gradually declines, suggesting that highly irregular land parcel shapes may enhance air circulation and thereby reduce surface temperature. In industrial zones, POR is approximately linearly positively correlated with SHAP values, as depicted in Figure 8g, indicating that increased building porosity leads to higher LSTs, likely due to the absence of vegetation and shading. This warming effect is more pronounced in densely populated areas, highlighting the combined influence of impervious surfaces and human activities. By contrast, LSI exhibits a consistently negative correlation with SHAP values in industrial areas, as demonstrated in Figure 8h, implying that more irregular or fragmented spatial structures contribute to lower temperatures, possibly through improved ventilation and reduced heat retention.
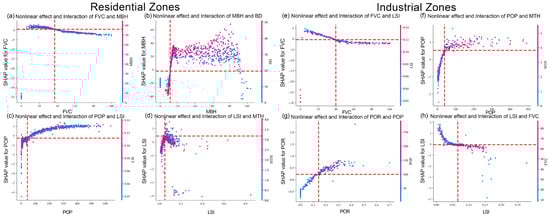
Figure 8.
Dependency graph of the main urban form factors for residential and industrial zones.
In commercial zones, MBH exhibits a significant “inverted U-shaped” nonlinear relationship with LST, as shown in Figure 9c. When MBH is within the range of 10–20 m, the warming effect is most pronounced. Beyond this range, the SHAP value gradually decreases, suggesting that taller buildings may mitigate the urban heat island effect through enhanced ventilation or shading effects. The relationship between POR and LST demonstrates an initially decreasing and then increasing trend, as illustrated in Figure 9d. When POR exceeds 0.1, the SHAP value rises significantly. In areas with high MBH, an increase in POR amplifies the warming effect, indicating that structural ventilation spaces play a critical role in shaping the thermal environment of high-density, high-rise developments. In public service zones, FVC shows a more linear and stable influence on LST, as depicted in Figure 9e. As FVC increases, the SHAP value gradually decreases, reflecting its continuous cooling capacity. Furthermore, there is a significant interaction between FVC and POP, as demonstrated in Figure 9f. When population density is below 250 people/0.1 ha, higher levels of FVC are more effective in suppressing the warming effect induced by POP. POR exhibits a stable linear positive correlation with LST in this area, as presented in Figure 9h, suggesting that open spaces with larger building spacing and looser layouts are more likely to accumulate heat and have reduced capacity to regulate the thermal environment.
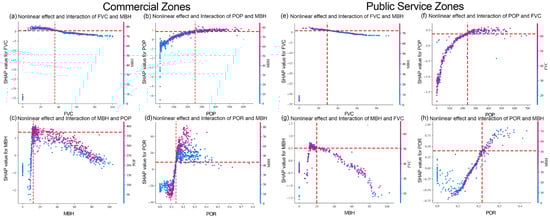
Figure 9.
Dependency graph of the main urban form factors of commercial and public service zones.
In green space zones, POP exhibits a typical logarithmic growth trend with LSTs, as shown in Figure 10b. When the population density is below 150 people/0.1 ha, the warming effect is pronounced, while in high-density areas, the marginal effect tends to saturate, indicating a clear threshold effect of human activities on temperature regulation. LSI demonstrates an inverted “U”-shaped nonlinear response, as illustrated in Figure 10c. Before LSI increases to approximately 0.1, the SHAP value rises significantly, suggesting that the initial increase in building complexity promotes heat accumulation. Beyond this threshold, ventilation and shading mechanisms may begin to take effect, causing the SHAP value to decline and reflecting the dual role of building morphology in regulating the local microclimate. The influence of MTH on LST shows a first decreasing and then increasing trend, with a significant interaction observed with the windward cross-sectional area index (FAI). When MTH is less than 2 m, a higher FAI significantly enhances the thermal effect, leading to an increase in LSTs. Conversely, when MTH exceeds 2 m, a higher FAI contributes to cooling, indicating that the synergy between vegetation height and density plays a critical role in thermal regulation. In transportation service zones, the response relationships among variables are more complex. The impact of POR on LSTs exhibits a peak-shaped trend, as presented in Figure 10g. Before POR increases to approximately 0.2, the SHAP value rises rapidly, and then, it gradually decreases, suggesting that moderate building porosity can enhance heat storage and release.
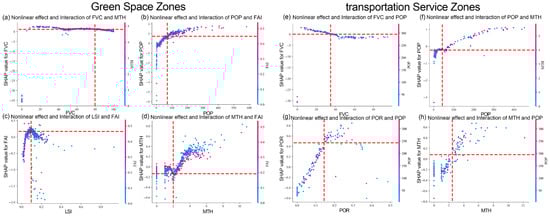
Figure 10.
Dependency graph of the main urban form factors of green space and transportation service zones.
3.4. Analysis of Multi-Factor Effects in a Single Sample
To comprehensively understand the synergistic effects of urban form at the sample level, this study utilizes SHAP force plots to visually analyze the combination of multiple urban form factors in typical samples, thereby evaluating their potential for optimizing the thermal environment. SHAP force plots can intuitively illustrate the prediction logic of the model for individual samples, clarifying the specific contribution direction and influence intensity of each variable in the results. In these plots, the direction of the arrows indicates whether the variable has a positive or negative impact on the prediction result, while the length of the arrows reflects the degree of influence. Specifically, red represents the warming effect, and blue represents the cooling effect.
In residential zones, FVC at 65.14% significantly reduces LST, serving as the primary cooling indicator, which aligns with the conclusion drawn from the SHAP bar chart. Meanwhile, the LSI at 0.02 exhibits a slight cooling effect, suggesting that lower complexity in land parcel shapes may enhance heat diffusion. MBH at 58.80 m and BD at 29.65% jointly contribute to an increase in LST, indicating that the morphology of high-rise and high-density buildings enhances heat accumulation. In industrial zones, FVC at 60.67% and PROX at 21.46% jointly play a cooling role. Conversely, POP at 253.5 people/0.1 ha, SVF at 0.62, and FAI at 0.35 all positively influence LST, demonstrating that human activity intensity and high sky openness in industrial zones are closely associated with increased LST. In commercial zones, POP at 371.75 people/0.1 ha is the dominant warming indicator, while FVC at only 18% has a limited cooling effect. However, MBH at 63 m and MTH at 1 m jointly form a cooling mechanism, indicating that high-rise buildings and low tree heights positively mitigate heat accumulation. In public service zones, FVC at 38.86% is at a medium-to-low level, showing an insignificant regulatory effect on temperature and even a slight warming tendency. By contrast, POP at 30.5 people/0.1 ha and POR at 0.03, among other factors, jointly contribute to a lower LST due to low human activity intensity and high spatial enclosure. In green space zones, this sample achieves 100% FVC but exhibits a slight warming trend overall due to indicators such as POR at 0.2 and LSI at 0.09. Meanwhile, POR at 6.00 and MTH at 1.83 play a certain cooling role. In transportation service zones, POP at 347 people/0.1 ha and FVC at only 28.55% jointly cause a significant increase in LST, while POR at 0.04 and SO at 0 have a weak regulatory effect on the thermal environment. The results indicate that these areas are prone to strong heat island effects under conditions of dense human flow and insufficient greenery. As shown in Figure 11.
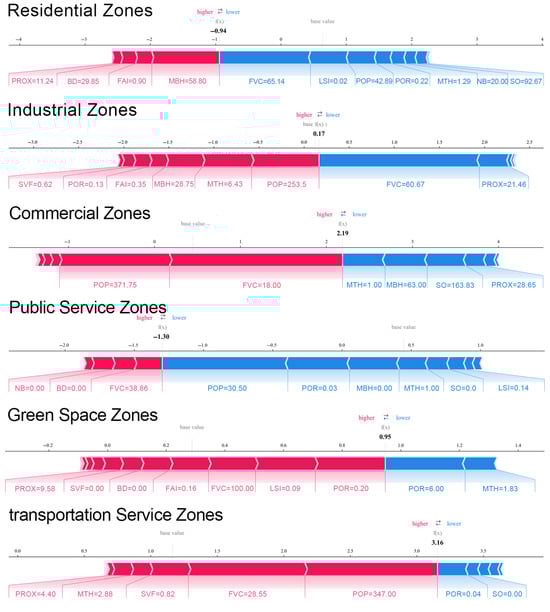
Figure 11.
The SHAP force plot of LST in different functional zones under the influence of urban form.
4. Discussion
4.1. The Influence of Urban Form on the Heat Island Effect in Different Urban Functional Zones
This study employed the CatBoost-SHAP machine learning framework to systematically assess the influence of urban morphological indicators on LST across different functional zones, thereby uncovering the spatial heterogeneity and nonlinear characteristics of the heat island effect formation mechanism. The CatBoost model demonstrates superior performance compared to traditional regression methods in addressing high-dimensional and nonlinear problems [26]. Furthermore, its integrated SHAP interpretation framework significantly enhances the model’s interpretability, offering a robust foundation for identifying key driving factors [18].
The analysis results indicate that fractional vegetation coverage (FVC) serves as the predominant cooling indicator across all functional areas, with its SHAP value consistently ranking first and remaining negative. In commercial zones, the FVC dependence plot exhibits a saturation trend, where the cooling effect diminishes after approximately 40%. This suggests that in high-vegetation areas, thermal regulation capacity may depend more on spatial configuration than on absolute vegetation quantity. This finding aligns with the research findings of Teo et al. regarding urban core areas [50].
The influence of architectural form indicators exhibits pronounced nonlinear characteristics. Taking the average building height (MBH) as an example, it demonstrates a significant nonlinear relationship with LSTs in most functional areas. In the commercial zone’s dependency plot, MBH shows a U-shaped relationship with LSTs, with a turning point around 20 m. This indicates that low-rise buildings exacerbate heat accumulation, while high-rise buildings may achieve cooling effects through shading and enhanced vertical ventilation. Building density (BD) contributes significantly to LST in commercial and industrial zones, with a more pronounced warming effect. Conversely, the sky view factor (SVF) has a positive influence on the LST of industrial zones, suggesting that higher degrees of sky openness do not always contribute to cooling, possibly due to increased exposed ground surface areas that intensify heat accumulation. As an indicator of spatial openness, building porosity (POR) exhibits a linear positive relationship with LST in industrial zones, indicating that areas with loose spatial structures but insufficient vegetation experience significantly enhanced thermal effects. He et al.’s research in Guangzhou-Foshan also highlighted that open spaces lacking greenery are more prone to forming high-temperature zones [51]. In commercial zones, the relationship between POR and LST demonstrates threshold characteristics, suggesting that moderate openness combined with vegetation is more conducive to temperature regulation. The ratio of perimeter to area (LSI), which reflects the complexity of spatial boundaries, exerts a negative influence on LSTs in most functional zones, indicating that irregularly shaped plots may promote air circulation and alleviate heat accumulation. This conclusion aligns with Ruda et al.’s findings that complex forms enhance ventilation potential [52].
Among the landscape indicators, the average tree height (MTH) exhibits a significant positive influence, with its strongest effect on LST observed in industrial zones. This implies that relying solely on tall trees without incorporating ground cover or shrub layers may not be sufficient for effectively providing shading and cooling effects. POP generally demonstrates a positive impact across all functional zones, particularly in industrial zones, indicating a strong correlation between human activity intensity and heat emissions. This finding aligns with the “thermal human disturbance” mechanism proposed by Jiang et al., emphasizing the importance of integrating human factors into thermal environment regulation [53].
In conclusion, the response mechanisms of different functional zones to urban form and the thermal environment exhibit both commonalities and differences. Landscape indicators consistently demonstrate a cooling effect across all functional zones, whereas architectural form factors reveal significant functional dependence. This suggests that when developing heat mitigation strategies, the distinct characteristics of each functional zone should be thoroughly considered to facilitate site-specific and functionally differentiated climate-adaptive urban design.
4.2. The Cooling Effect of Urban Morphology in Different Functional Areas
To further investigate the influence of urban architectural and landscape forms on LSTs across different functional zones, this study conducted an in-depth analysis of the marginal effects of the top four main contributing variables. The results indicate that FVC consistently demonstrates a stable negative impact across all functional areas, thereby confirming its role as the predominant cooling factor. POP is generally positively correlated with LST, exhibiting a more pronounced influence in areas characterized by intensive human activities. In contrast, the impact patterns of urban form indicators such as MBH, POR, and LSI in different functional zones reveal nonlinearity and variability.
In residential zones, FVC exhibits a linear negative correlation with LST. When the coverage rate increases from 20% to 70%, LST decreases by approximately 3.3 °C. MBH demonstrates an inverted U-shaped relationship with LST, with a significant temperature increase occurring within the 9–12 m range. Beyond this threshold, a mitigation trend emerges, indicating that high-rise buildings can play a cooling role through shading and enhanced ventilation. LSI also follows an inverted U-shaped pattern, with a peak around 0.045, suggesting that moderately complex land parcel structures help reduce heat accumulation. In industrial zones, POR shows a linear positive correlation with LST. Within the 0–0.3 range, the temperature increase is approximately 1.1 °C, indicating that an overly dense layout is not conducive to heat regulation. Although FVC still has a cooling effect, it tends to saturate when the coverage rate exceeds 60%. POP positively influences the LST, with a temperature increase of approximately 2.1 °C within the 0–150 people/0.1 ha range, after which it stabilizes. In commercial zones, MBH demonstrates an inverted U-shaped relationship with the LST, peaking at around 12 m and suggesting that high-rise buildings can mitigate the heat effect. When POR is less than 0.025, its impact is limited; however, the warming effect rapidly intensifies beyond this value, indicating the combined warming effect of structural density and poor ventilation. FVC remains the dominant cooling factor, providing a cooling effect of over 4.6 °C within the 10–70% range, which is significant. In public service areas, FVC and LST exhibit a nearly linear relationship, with a stable cooling effect. POP shows a positive correlation with LST, with a more pronounced warming effect below 400 people/0.1 ha, highlighting the impact of human activities on the thermal environment. When POR exceeds 0.1125, the LST increases linearly, suggesting that overly large building spacing is not conducive to cooling in the absence of sufficient greenery. In green space zones, FVC demonstrates a strong overall cooling effect, though there is fluctuation within the 45–55% range, possibly related to vegetation configuration. LSI and LST exhibit an inverted U-shaped relationship, with a peak at around 0.096, reflecting the combined effect of boundary complexity and ventilation efficiency. When MTH exceeds 2 m, it shows a positive correlation with LST, with a clear warming trend. This indicates that relying solely on tall trees without the support of lower vegetation may lead to a heat-blocking effect. In transportation service zones, the cooling effect of FVC remains significant, though the marginal effect weakens after 45%. POR and LST demonstrate a peak-shaped relationship, with the strongest warming effect occurring around 0.25, after which it slightly decreases, suggesting that moderate openness is beneficial for heat release, while excessive openness becomes a warming factor in the absence of sufficient greenery. The positive correlation between the MTH and LST is more pronounced in transportation service zones. When MTH increases from 0.7 to 5 m, LST rises by nearly 0.7 °C, indicating that large trees are less effective in providing cooling. As shown in Figure 12.
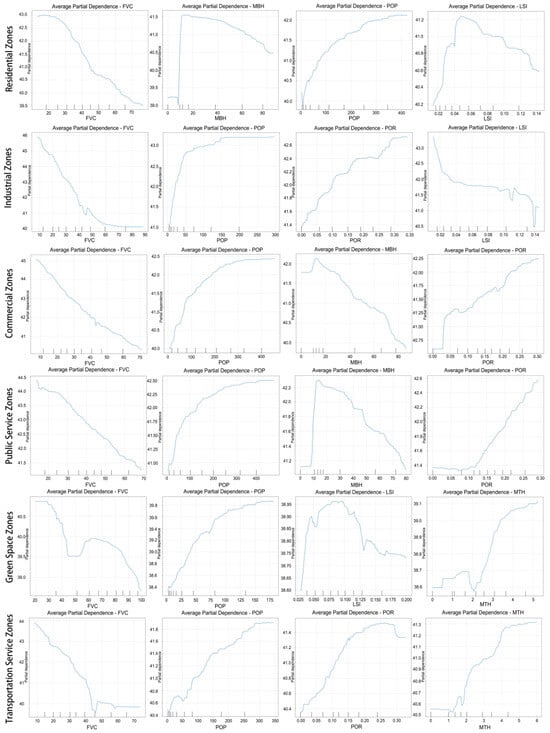
Figure 12.
The marginal effects of the urban forms of major cities in different functional zones.
4.3. Strategies and Suggestions for Optimizing the Thermal Environment in Urban Planning
With the rapid advancement of urbanization, an increasing number of urban residents are facing the intensifying urban heat island effect. This study examines the impact of architectural and landscape forms in different urban functional zones on LSTs and proposes targeted optimization strategies for architectural and landscape form zoning. By adopting urban functional zones as analytical units, the practical significance of the research findings is strengthened, providing a replicable reference for urban managers and planners to implement refined thermal environment intervention measures.
This study offers operational recommendations for urban thermal environment regulation by identifying the specific mechanisms of urban form indicators on LSTs across different urban functional zones: (1) In residential zones, FVC significantly reduces LST within the range of 20% to 70%, with a temperature difference of up to 3.3 °C. Therefore, it is suggested to increase the green coverage rate; reasonably control the building height, avoiding heights within the range of 9 to 12 m; and optimize the complexity of the boundary structure of the plot to improve ventilation conditions in order to achieve an effective cooling effect. (2) In industrial zones, LST rapidly increases when POR is between 0 and 0.3, with a temperature rise exceeding 1.1 °C. It is suggested to regulate spatial openness by reasonably controlling the distance between factories and increasing greenery, while avoiding large-scale uncovered hard paving areas. (3) In commercial zones, the LST exhibits the strongest increase when MBH is within the range of 10 to 12 m, but it tends to decrease beyond this range. It is recommended to reserve ventilation corridors between medium-rise and high-rise buildings to enhance shading and air convection efficiency. (4) In public service zones, FVC demonstrates a stable linear negative correlation with LST, with a reduction of approximately 0.8 °C for every 10% increase in FVC. Therefore, in densely populated areas such as hospitals and schools, it is recommended to allocate more than 30% of green space during the initial stage of site planning and prioritize the configuration of a multi-layered green plant system combining trees and shrubs. (5) In green space zones, LST significantly increases when MTH exceeds 2 m, suggesting that relying solely on tall trees may not be sufficient for achieving cooling effects. It is recommended to increase the proportion of lower-level vegetation to create a synergistic effect of shading and evapotranspiration between the tree canopy and ground-level greenery. (6) In transportation service zones, the heat accumulation effect is most pronounced when POR is approximately 0.25. It is recommended to control the openness of station squares and parking areas within this threshold and implement measures such as installing shading canopies at their boundaries to alleviate the LST and reduce the risk of heat retention.
In conclusion, this research has elucidated the complex mechanisms and interactions between urban morphology across various functional zones and LSTs. The findings suggest that heat mitigation strategies should avoid a one-size-fits-all approach and instead be tailored to address the distinct thermal characteristics and functional requirements of each urban functional zone. While this study uses Xi’an as a case example, the research framework developed exhibits strong generalizability and can be applied to the analysis of urban thermal environments globally, thereby providing theoretical support for formulating scientifically grounded urban thermal environment management strategies in diverse regions. As shown in Table 4.
Table 4.
Cooling strategies for different functional zones.
4.4. Limitations and Future Prospects
This study provides valuable references for understanding the urban thermal environment and optimizing strategies to alleviate the heat island effect based on the architectural landscape characteristics of urban functional areas. However, it also has some notable limitations. Firstly, the LST data used in this study were derived from a single summer Landsat image. Although summer is the peak period of urban heat island intensity, relying solely on a single summer image may not fully reflect the dynamic changes in the thermal conditions throughout the season. Future research should consider using multi-temporal or averaged LST images from multiple summer dates to enhance the robustness, consistency, and temporal representativeness of the data. Secondly, the dataset used covers multiple time periods from 2020 to 2023. Although this method helps comprehensively cover the data, the time inconsistency between the datasets may reduce the accuracy and representativeness of the analysis. In future research, clearly identifying the specific acquisition years of each dataset and applying time coordination techniques will help address this limitation. Thirdly, this study examined the impact of urban form characteristics on the LST of a single city. Although the research results provide insights for specific locations, their universality is still limited. Future research should extend the analysis to multiple cities in different climate backgrounds to evaluate the universality and adaptability of the observed patterns. Comparative analysis across urban environments will deepen the understanding of the relationship between regional thermal response and urban form characteristics. In summary, these advancements will enhance the policy relevance and practical applicability of the research results, providing more comprehensive insights for researchers, urban planners, and climate adaptation policy makers.
5. Conclusions
This study takes the central urban area of Xi’an as the research object and, based on the CatBoost-SHAP machine learning model, investigates the nonlinear impact of urban morphology in different functional zones on surface temperature during summer. The main conclusions are as follows: (1) Among all functional zones, residential zones have the widest distribution, covering 47% of the total area, followed by commercial and industrial zones, each occupying 13%. The highest land surface temperature (LST) in the study area reached 52.68 °C, while the lowest was 21.68 °C. High-temperature areas were predominantly distributed in densely built-up central cities and industrial zones, whereas temperatures around water bodies and green spaces were relatively lower. (2) SHAP analysis reveals that landscape indicators exert the most significant influence across all functional zones, with green space zones contributing up to 62%. FVC, as the core landscape indicator, serves as the primary cooling indicator in all six functional zones and consistently exhibits a negative effect. In commercial zones, the SHAP value is the highest, reaching 2.2164. (3) POP demonstrates a generally high SHAP contribution across all functional zones and shows a positive correlation, with the most pronounced effect observed in commercial zones, accounting for 16%. When POP ranges between 0 and 250 people, the warming effect is particularly prominent, after which it tends to stabilize. (4) MBH constitutes a major influencing indicator in most functional zones, especially in residential zones, where the SHAP value reaches 0.7643. The dependency plot illustrates a distinct “inverted U-shaped” nonlinear trend, with the SHAP value rising sharply within the range of 10–20 m, indicating a significant warming effect. (5) Future urban planning will propose targeted cooling strategies based on different functional zones. In residential zones, priority will be given to increasing small pocket parks and community green nodes; in industrial zones, the distance between factories will be controlled, and greenery will be increased to regulate the openness of the space; in commercial zones, the influence of the average building height (MBH) will be noted to enhance ventilation; in public service zones, green space will be increased; in park green zones, the regulating effect of the average tree height (MTH) will be considered; in transportation service zones, the influence of building porosity (POR) will be noted. This study, through interpretable machine learning analysis, provides a novel perspective for understanding the driving mechanisms of the thermal environment in different urban functional zones and offers a scientific basis for formulating more targeted urban thermal environment optimization strategies, thereby enhancing the adaptability and resilience of cities in the context of climate change.
Author Contributions
Conceptualization, J.X. and L.X.; methodology, J.X. and L.X.; formal analysis, J.X., L.X., C.L. and M.Z.; data curation, C.L. and M.Z.; writing—original draft preparation, J.X.; writing—review and editing, J.X., L.X. and C.L.; visualization, L.X. and C.L.; supervision, X.W.; project administration, X.W. All authors have read and agreed to the published version of the manuscript.
Funding
This research received no external funding.
Data Availability Statement
Data are available with the corresponding author and can be shared upon reasonable request.
Conflicts of Interest
The authors declare no conflicts of interest.
References
- Li, B.; Zhang, Y.; Zhao, S.; Zhao, L.; Wang, M.; Pei, H. Urban Heat Island Effect in Different Sizes from a 3D Perspective: A Case Study in the Beijing–Tianjin–Hebei Region. Land 2025, 14, 463. [Google Scholar] [CrossRef]
- Fischer, E.; Detommaso, M.; Martinico, F.; Nocera, F.; Costanzo, V. A risk index for assessing heat stress mitigation strategies: An application in the Mediterranean context. J. Clean. Prod. 2022, 346, 131210. [Google Scholar] [CrossRef]
- Li, J.; Song, C.; Cao, L.; Zhu, F.; Meng, X.; Wu, J. Impacts of landscape structure on surface urban heat islands: A case study of Shanghai, China. Remote Sens. Environ. 2011, 115, 3249–3263. [Google Scholar] [CrossRef]
- Heaviside, C.; Vardoulakis, S.; Cai, X.M. Attribution of mortality to the urban heat island during heatwaves in the West Midlands, UK. Environ. Health 2016, 15 (Suppl. 1), S27. [Google Scholar] [CrossRef]
- Tang, L.; Zhan, Q.; Fan, Y.; Liu, H.; Fan, Z. Exploring the impacts of greenspace spatial patterns on land surface temperature across different urban functional zones: A case study in Wuhan metropolitan area, China. Ecol. Indic. 2023, 146, 109787. [Google Scholar] [CrossRef]
- Zhao, K.; Ning, Z.; Xu, C.; Li, X.; Huang, X.; Wu, J. How do driving Indicators affect the diurnal variation of land surface temperature across different urban functional blocks? A case study of Xi’an, China. Sustain. Cities Soc. 2024, 114, 105738. [Google Scholar] [CrossRef]
- Li, H.; Li, Y.; Wang, T.; Wang, Z.; Gao, M.; Shen, H. Quantifying 3D building form effects on urban land surface temperature and modeling seasonal correlation patterns. Build. Environ. 2021, 204, 108132. [Google Scholar] [CrossRef]
- Fang, H.; Guo, S.; Yang, C.; Yuan, B.; Li, C.; Pan, X.; Tang, P.; Du, P. Influence of urban functional zone change on land surface temperature using multi-source geospatial data: A case study in Nanjing City, China. Sustain. Cities Soc. 2024, 115, 105874. [Google Scholar] [CrossRef]
- Wang, L.; Li, R.; Jia, J.; Zhai, Y.; Tian, Y.; Xu, D.; Chen, Y.; Zhang, X.; Ren, Z.; Ye, Z.; et al. Integrating morphology and vitality to quantify seasonal contributions of urban functional zones to thermal environment. Sustain. Cities Soc. 2025, 120, 106136. [Google Scholar] [CrossRef]
- Wu, Y.; Hou, H.; Wang, R.; Murayama, Y.; Wang, L.; Hu, T. Effects of landscape patterns on the morphological evolution of surface urban heat island in Hangzhou during 2000–2020. Sustain. Cities Soc. 2022, 79, 103717. [Google Scholar] [CrossRef]
- Morabito, M.; Crisci, A.; Guerri, G.; Messeri, A.; Congedo, L.; Munafò, M. Surface urban heat islands in Italian metropolitan cities: Tree cover and impervious surface influences. Sci. Total Environ. 2021, 751, 142334. [Google Scholar] [CrossRef] [PubMed]
- Turner, M.G. Landscape ecology: What is the state of the science? Annu. Rev. Ecol. Evol. Syst. 2005, 36, 319–344. [Google Scholar] [CrossRef]
- Chen, J.; Wang, K.; Du, P.; Zang, Y.; Zhang, P.; Xia, J.; Chen, C.; Yu, Z. Quantifying the main and interactive effects of the dominant Indicators on the diurnal cycles of land surface temperature in typical urban functional zones. Sustain. Cities Soc. 2024, 114, 105727. [Google Scholar] [CrossRef]
- Zhou, Y.; Zhao, H.; Mao, S.; Zhang, G.; Jin, Y.; Luo, Y.; Huo, W.; Pan, Z.; An, P.; Lun, F. Exploring surface urban heat island (SUHI) intensity and its implications based on urban 3D neighborhood metrics: An investigation of 57 Chinese cities. Sci. Total Environ. 2022, 847, 157662. [Google Scholar] [CrossRef]
- Shao, L.; Liao, W.; Li, P.; Luo, M.; Xiong, X.; Liu, X. Drivers of global surface urban heat islands: Surface property, climate background, and 2D/3D urban morphologies. Build. Environ. 2023, 242, 110581. [Google Scholar] [CrossRef]
- Cao, S.; Weng, Q.; Lu, L. Distinctive roles of two- and three-dimensional urban structures in surface urban heat islands over the conterminous United States. Urban Clim. 2022, 44, 101230. [Google Scholar] [CrossRef]
- Hong, C.; Qu, Z.; Xiao, R.; Wang, Z.; Yang, Y.; Qian, J.; Zhang, C.; Zhang, Y.; Li, X.; Dong, Z.; et al. Vertical thermal environment investigation in different urban zones (LCZ4/LCZ6/LCZA) and heat mitigation evaluation: Field measurements and numerical simulations. Build. Environ. 2024, 262, 111840. [Google Scholar] [CrossRef]
- Liu, Q.; Hang, T.; Wu, Y. Unveiling differential impacts of multidimensional urban morphology on heat island effect across local climate zones: Interpretable CatBoost-SHAP machine learning model. Build. Environ. 2025, 270, 112574. [Google Scholar] [CrossRef]
- Yin, C.; Yuan, M.; Lu, Y.; Huang, Y.; Liu, Y. Effects of urban form on the urban heat island effect based on spatial regression model. Sci. Total Environ. 2018, 634, 696–704. [Google Scholar] [CrossRef]
- Kim, S.W.; Brown, R.D. Urban heat island (UHI) intensity and magnitude estimations: A systematic literature review. Sci. Total Environ. 2021, 779, 146389. [Google Scholar] [CrossRef]
- Liu, Y.; An, Z.; Ming, Y. Simulating influences of land use/land cover composition and configuration on urban heat island using machine learning. Sustain. Cities Soc. 2024, 108, 105482. [Google Scholar] [CrossRef]
- Liu, Y.; Zhang, W.; Liu, W.; Tan, Z.; Hu, S.; Ao, Z.; Li, J.; Xing, H. Exploring the seasonal effects of urban morphology on land surface temperature in urban functional zones. Sustain. Cities Soc. 2024, 103, 105268. [Google Scholar] [CrossRef]
- He, J.; Shi, Y.; Xu, L.; Lu, Z.; Feng, M.; Tang, J.; Guo, X. Exploring the scale effect of urban thermal environment through XGBoost model. Sustain. Cities Soc. 2024, 114, 105763. [Google Scholar] [CrossRef]
- Jato-Espino, D.; Manchado, C.; Roldán-Valcarce, A.; Moscardó, V. ArcUHI: A GIS add-in for automated modelling of the Urban Heat Island effect through machine learning. Urban Clim. 2022, 44, 101203. [Google Scholar] [CrossRef]
- Zhang, M.; Hou, T.; Ma, Y.; Liang, M.; Yang, J.; Sun, F.; Wang, E. Nonlinear effects of human settlements on seasonal land surface temperature variations at the block scale: A case study of the central urban area of Chengdu. Land 2025, 14, 693. [Google Scholar] [CrossRef]
- Lyu, H.M.; Yin, Z.Y. Flood susceptibility prediction using tree-based machine learning models in the GBA. Sustain. Cities Soc. 2023, 97, 104744. [Google Scholar] [CrossRef]
- Zhang, L.; Chen, Y.; Yan, Z. Predicting the short-term electricity demand based on the weather variables using a hybrid CatBoost-PPSO model. J. Build. Eng. 2023, 71, 106432. [Google Scholar] [CrossRef]
- Huang, G.; Wu, L.; Ma, X.; Zhang, W.; Fan, J.; Yu, X.; Zeng, W.; Zhou, H. Evaluation of CatBoost method for prediction of reference evapotranspiration in humid regions. J. Hydrol. 2019, 574, 1029–1041. [Google Scholar] [CrossRef]
- Guo, R.; Yang, B.; Guo, Y.; Li, H.; Li, Z.; Zhou, B.; Hong, B.; Wang, F. Machine learning-based prediction of outdoor thermal comfort: Combining Bayesian optimization and the SHAP model. Build. Environ. 2024, 254, 111301. [Google Scholar] [CrossRef]
- Liu, Q.; Wang, J.; Bai, B. Unveiling nonlinear effects of built environment attributes on urban heat resilience using interpretable machine learning. Urban Clim. 2024, 56, 102046. [Google Scholar] [CrossRef]
- Li, L.; Zha, Y. Population exposure to extreme heat in China: Frequency, intensity, duration and temporal trends. Sustain. Cities Soc. 2020, 60, 102282. [Google Scholar] [CrossRef]
- Wu, T.; Wang, X.; Xuan, L.; Yan, Z.; Wang, C.; Du, C.; Su, Y.; Duan, J.; Yu, K. How to plan urban parks and the surrounding buildings to maximize the cooling effect: A case study in Xi’an, China. Land 2024, 13, 1117. [Google Scholar] [CrossRef]
- Liu, K.; Zhou, D.; Qi, Y.; Zhang, M.; Ren, Y.; Wei, Y.; Wang, J. Exploring the complex effects and their spatial associations of the built environment on the vitality of community life circles using an eXtreme Gradient Boosting–SHapley Additive exPlanations approach: A case study of Xi’an. Buildings 2025, 15, 1372. [Google Scholar] [CrossRef]
- Tang, B.H.; Zhan, C.; Li, Z.L.; Wu, H.; Tang, R. Estimation of land surface temperature from MODIS data for the atmosphere with air temperature inversion profile. IEEE J. Sel. Top. Appl. Earth Obs. Remote Sens. 2016, 10, 2976–2983. [Google Scholar] [CrossRef]
- Barsi, J.A.; Schott, J.R.; Palluconi, F.D.; Hook, S.J. Validation of a web-based atmospheric correction tool for single thermal band instruments. Earth Obs. Syst. X 2005, 5882, 136–142. [Google Scholar] [CrossRef]
- Jiang, L.; Liu, S.; Liu, C.; Feng, Y. How do urban spatial patterns influence the river cooling effect? A case study of the Huangpu Riverfront in Shanghai, China. Sustain. Cities Soc. 2021, 69, 102835. [Google Scholar] [CrossRef]
- Yang, J.; Yang, Y.; Sun, D.; Jin, C.; Xiao, X. Influence of urban morphological characteristics on thermal environment. Sustain. Cities Soc. 2021, 72, 103045. [Google Scholar] [CrossRef]
- Huang, X.; Wang, Y. Investigating the effects of 3D urban morphology on the surface urban heat island effect in urban functional zones by using high-resolution remote sensing data: A case study of Wuhan, Central China. ISPRS J. Photogramm. Remote Sens. 2019, 152, 119–131. [Google Scholar] [CrossRef]
- Gao, Y.; Zhao, J.; Yu, K. Effects of block morphology on the surface thermal environment and the corresponding planning strategy using the geographically weighted regression model. Build. Environ. 2022, 216, 109037. [Google Scholar] [CrossRef]
- Wu, W.B.; Yu, Z.W.; Ma, J.; Zhao, B. Quantifying the influence of 2D and 3D urban morphology on the thermal environment across climatic zones. Landsc. Urban Plan. 2022, 226, 104499. [Google Scholar] [CrossRef]
- Lin, L.; Zhao, Y.; Zhao, J.; Wang, D. Comprehensively assessing seasonal variations in the impact of urban greenspace morphology on urban heat island effects: A multidimensional analysis. Sustain. Cities Soc. 2025, 118, 106014. [Google Scholar] [CrossRef]
- Li, R.; Huang, C.; Xin, W.; Ye, J.; Zhang, X.; Qu, R.; Wang, J.; Yuan, L.; Yao, J. Data-driven optimization reveals the impact of Urban Heat Island effect on the retrofit potential of building envelopes. Build. Environ. 2025, 269, 112367. [Google Scholar] [CrossRef]
- Li, Y.; Wang, S.; Zhang, S.; Wei, M.; Chen, Y.; Huang, X.; Zhou, R. The creation of multi-level urban ecological cooling network to alleviate the urban heat island effect. Sustain. Cities Soc. 2024, 114, 105786. [Google Scholar] [CrossRef]
- Ding, Z.; Gu, J.; Zeng, D.; Wang, X. Effects of ‘Inhaling’ and ‘Exhaling’ of buildings in three-dimensional built environment on Land Surface Temperature. Build. Environ. 2023, 246, 110930. [Google Scholar] [CrossRef]
- Dale, B.; Dananto, M.; Kifle, B. Dynamics of land use land cover change and its effect on urban heat island in Halaba Kulito Town. Heliyon 2025, 11, e41689. [Google Scholar] [CrossRef]
- Cao, W.; Zhou, W.; Yu, W.; Wu, T. Combined effects of urban forests on land surface temperature and PM2.5 pollution in the winter and summer. Sustain. Cities Soc. 2025, 104, 105309. [Google Scholar] [CrossRef]
- Bai, Y.; Wang, K.; Ren, Y.; Li, M.; Ji, R.; Wu, X.; Yan, H.; Lin, T.; Zhang, G.; Zhou, X.; et al. 3D compact form as the key role in the cooling effect of greenspace landscape pattern. Ecol. Indic. 2024, 160, 111776. [Google Scholar] [CrossRef]
- Zhang, Y.; Zhao, Z.; Zheng, J. CatBoost: A new approach for estimating daily reference crop evapotranspiration in arid and semi-arid regions of Northern China. J. Hydrol. 2020, 588, 125087. [Google Scholar] [CrossRef]
- Zheng, G.; Zhang, Y.; Yue, X.; Li, K. Interpretable prediction of thermal sensation for elderly people based on data sampling, machine learning and SHapley Additive exPlanations (SHAP). Build. Environ. 2023, 242, 110602. [Google Scholar] [CrossRef]
- Teo, Y.H.; Makani, M.A.B.H.; Wang, W.; Liu, L.; Yap, J.H.; Cheong, K.H. Urban heat island mitigation: GIS-based analysis for a tropical city Singapore. Int. J. Environ. Res. Public Health 2022, 19, 11917. [Google Scholar] [CrossRef]
- He, X.; Yuan, Q.; Qin, Y.; Lu, J.; Li, G. Analysis of surface urban heat island in the Guangzhou-Foshan metropolitan area based on local climate zones. Land 2024, 13, 1626. [Google Scholar] [CrossRef]
- Sarria, F.R.; Delgado, M.G.; Ramos, J.S.; Amores, T.P.; Félix, J.L.; Domínguez, S.Á. Assessing urban ventilation in common street morphologies for climate-responsive design toward effective outdoor space regeneration. Sustainability 2024, 16, 6861. [Google Scholar] [CrossRef]
- Qian, J.; Zhang, L.; Schlink, U.; Hu, X.; Meng, Q.; Gao, J. Impact of urban land use and anthropogenic heat on winter and summer outdoor thermal comfort in Beijing. Urban Clim. 2025, 59, 102306. [Google Scholar] [CrossRef]
Disclaimer/Publisher’s Note: The statements, opinions and data contained in all publications are solely those of the individual author(s) and contributor(s) and not of MDPI and/or the editor(s). MDPI and/or the editor(s) disclaim responsibility for any injury to people or property resulting from any ideas, methods, instructions or products referred to in the content. |
© 2025 by the authors. Licensee MDPI, Basel, Switzerland. This article is an open access article distributed under the terms and conditions of the Creative Commons Attribution (CC BY) license (https://creativecommons.org/licenses/by/4.0/).