Article

Towards Energy Efficiency in Existing Buildings: A Dynamic Simulation Framework for Analysing and Reducing Climate Change Impacts

by
Camilla Lops
*,
Valentina D’Agostino
,
Samantha Di Loreto
and
Sergio Montelpare
Department of Engineering and Geology, University G. d’Annunzio of Chieti-Pescara, 65122 Pescara, Italy
*
Author to whom correspondence should be addressed.
Sustainability 2025, 17(14), 6485; https://doi.org/10.3390/su17146485
Submission received: 13 June 2025 / Revised: 1 July 2025 / Accepted: 8 July 2025 / Published: 16 July 2025

Abstract

This research presents a multi-scale framework designed for assessing the energy performance and climate vulnerability of three existing residential buildings in a small Central Italian municipality. By integrating dynamic energy simulations with high-resolution climate projections, the study investigated how the selected building typologies responded to changing environmental conditions. Validation against Energy Performance Certificates (EPCs) confirmed the framework’s robustness in accurately capturing energy consumption patterns and assessing retrofit potential. The results revealed a general reduction in heating demand accompanied by an increase in cooling requirements under future climate scenarios, with notable differences across building types. The reinforced concrete building showed greater sensitivity to rising temperatures, particularly in cooling demand, likely due to its lower thermal inertia. In contrast, masonry buildings achieved more substantial energy savings following retrofit interventions, reflecting their initially poorer thermal performance and outdated systems. Retrofit measures yielded significant energy reductions, especially in older masonry structures, with savings reaching up to 44%, underscoring the necessity of customised retrofit strategies. The validated methodology supports future wider applicability in regional energy planning and aligns with integrated initiatives aimed at balancing climate adaptation and cultural heritage preservation.

1. Introduction

Climate change has long been one of the most pressing global challenges, continuously monitored and assessed by the international scientific community. Human activities, particularly greenhouse gas emissions, have driven a global surface temperature increase of approximately 1.1 °C above pre-industrial levels (1850–1900) during the period of 2011–2020, as reported by the Intergovernmental Panel on Climate Change (IPCC) [1]. Projections also suggest a substantial further increase in global temperatures over both the short and long term, with prolonged and potentially irreversible impacts on the climate system that may persist for centuries or even millennia. Among the main contributors to these emissions, the energy sector plays a dominant role through fossil fuel production and consumption patterns that span Europe’s major economic domains: industrial operations, transportation networks, and residential building stock. Within this broader context, the building sector represents a major area of concern, accounting for approximately 40% of the European Union’s final energy consumption and 36% of its energy-related greenhouse gas emissions [2]. Moreover, nearly 75% of the existing building stock fails to meet modern energy efficiency standards, and estimates suggest that between 85% and 95% of these structures will still be in use by 2050. Specifically, natural gas, primarily used for space heating, makes up around 42% of the residential sector’s energy demand [2].
The environmental significance of the building sector is paralleled by its heightened sensitivity to climate change impacts. While buildings play a substantial role in emissions and energy consumption, they are also increasingly affected by global warming. Rising temperatures and shifting climatic patterns are altering their operational conditions, influencing both energy performance and occupants’ comfort. As a result, restoration and energy retrofit strategies must increasingly incorporate projected climate conditions rather than rely solely on historical data [3]. Accurately interpreting climate projections, in fact, is essential to assess the risks posed by climate change and to develop effective adaptation and mitigation strategies that promote both environmental sustainability and occupant well-being.
In response to these pressing challenges, Europe has taken a leading role in global climate action, emphasising the need for rapid emissions reductions and enhanced resilience across all sectors. By establishing such ambitious targets, including a 55% reduction in greenhouse gas emissions by 2030 (compared to 1990 levels) and climate neutrality by 2050, the EU has placed a strong emphasis on the expansion of renewable energy sources and significant improvements in energy efficiency [4]. Within this strategic framework, the existing building stock has emerged as a critical area of intervention due to its considerable environmental footprint and inherent vulnerability to climate change. Energy performance has become, in fact, a central concern in both European and national climate agendas, as demonstrated by the latest revision of the Energy Performance of Buildings Directive (EPBD) [5]. This is especially relevant for historic centres and small towns, which are often characterised by a high concentration of architecturally valuable and culturally significant buildings that must be preserved while improving their energy efficiency.
Against the backdrop of increasing climate pressures and the urgent need for sustainable adaptation in the built environment, the existing literature increasingly focuses on energy efficiency assessments and retrofit strategies within the building sector. However, despite the growing body of research, most studies concentrate on individual buildings (both residential and non-residential) typically situated in large urban centres [6,7,8,9]. While these contributions are undoubtedly valuable, they do not adequately reflect the Italian context, which is characterised by a dense network of small municipalities and a highly diverse building stock in terms of typology and construction periods. Moreover, a common limitation across much of the existing research is the reliance on historical or current climate data, with relatively few studies explicitly integrating future climate change scenarios, especially concerning envelope retrofit strategies applied in non-metropolitan contexts [10,11,12,13].
This paper aims to address these gaps. Specifically, it offers an original contribution by evaluating both the energy performance and the vulnerability to future climate conditions of various types of existing residential buildings located in a small municipality in Central Italy. The selected case studies—three buildings differing in construction period and material characteristics—are representative of the heterogeneous building stock typically found in small Italian towns, often underrepresented in large-scale energy assessments. A unifying feature of these buildings is their deliberate selection from the residential sector, reflecting the reality that buildings within historic city centres are predominantly residential. In fact, approximately 81% of the occupied building stock in such areas consists of residential structures, as reported by [14].
Moreover, the paper adopts a dual-level methodological framework that integrates both simplified and detailed dynamic energy simulations with high-resolution climate data. This includes reliable Typical Meteorological Year (TMY) datasets representing past, present, and projected climate conditions for the years 2030, 2050, and 2070. This approach allows for the assessment of buildings’ sensitivity to climate change phenomena, highlighting both their potential and limitations. Energy Performance Certificates (EPCs) are employed to validate the simulation results and to analyse the actual energy consumption profiles of the selected buildings. In addition, the work evaluates the effectiveness of low-invasive retrofit interventions, offering a comprehensive understanding of each case study’s adaptive capacity and its potential for future-oriented energy performance improvements. This multi-perspective approach, applied to a territorial context that has so far received limited attention, provides new insights into the energy performance and climate resilience of small-scale Italian buildings, thereby expanding the current body of knowledge.
Beyond the immediate scope of the building-level analysis, the methodology presented in this paper lays the foundation for scaling up to wider spatial contexts, such as neighbourhoods, historic centres, and entire urban territories. This approach directly supports the energy analysis component of the national research project GENESIS, “Seismic risk management for the touristic valorisation of the historical centres of Southern Italy [15,16,17,18]. As part of an integrated, multi-scale method to risk assessment and heritage protection, the study’s insights will inform the development of the GENESIS platform, contributing to its objective of supporting cost-effective, data-driven interventions that harmonise structural safety, energy efficiency, and cultural preservation.
The paper is organised as follows: after this brief introduction, which establishes the research background and innovative contributions, Section 2 presents the contextual framework. Section 3 describes the materials and methods, detailing the adopted analytical approach. Section 4 provides comprehensive descriptions of the selected case studies, emphasising critical elements necessary for energy modelling. Section 5 presents and compares the findings, analysing key results and discussing their broader implications for the field. Finally, Section 6 synthesises the main outcomes and identifies directions for future research.

2. Background

The vast majority of the EU building stock dates back to before the 1960s, a period in which sustainability was not yet a design priority and energy regulations were absent [19]. This historical construction pattern presents significant contemporary challenges, particularly in countries like Italy, where over 60% of residential buildings are more than 45 years old, predating the first national energy-saving regulation [20]. Moreover, this issue is especially critical in small towns and historical centres, where buildings typically lack both insulation and passive design features aimed at minimising energy consumption [8]. As a result, they often perform poorly year-round, especially during peak winter and summer conditions. With rising temperatures and increasingly frequent heatwaves predicted in the coming decades, energy demands for indoor climate control are expected to shift dramatically, exacerbating existing inefficiencies [21,22,23,24].
Recognising the urgency of improving the performance of the existing heritage, the 2024 Annual Report on Energy Efficiency by the Italian National Agency for New Technologies Energy and Sustainable Economic Development (ENEA from the Italian acronym) underscores significant progress in reducing national energy consumption [25]. However, it also stresses the need to accelerate retrofitting initiatives, particularly in light of data from the 2024 APE Report [26], which shows that nearly 48% of certified buildings remain in the lowest energy classes (F and G). These inefficiencies are most prevalent in small towns and rural areas, where investment and regulatory oversight tend to be lower. To reduce such disparities, Italy has launched national strategies specifically aimed at enhancing sustainability in small municipalities [27], allocating dedicated resources to improve energy efficiency, safeguard public assets, and preserve vulnerable territories. In this context, large-scale retrofitting emerges as a strategic means of reducing environmental impact while improving residents’ quality of life.
Addressing the complexities of this challenge requires advanced, multi-scale energy modelling methodologies. An increasingly adopted approach involves the use of high-resolution simulations or empirical data from individual buildings to define representative archetypes, which can then inform broader assessments at the neighbourhood or district level [28]. These archetypes facilitate large-scale simulation and help prioritise interventions across diverse building portfolios [29,30]. A central tool in this analytical process is the Energy Performance Certificate, which serves two crucial functions. First, EPCs provide a reference point for validating simulation models by comparing predicted performance with real-world data. Second, the growing availability of EPC datasets has transformed energy performance research by offering extensive insight into energy usage patterns and classification trends [29,31].
To further advance the use of EPCs in this context, the latest revision of the EPBD promotes the harmonisation of the European EPC framework through the creation of shared databases and enhanced interoperability. This effort addresses long-standing challenges—such as inconsistent data formats, divergent calculation methods, and limited cross-country comparability—thereby significantly increasing the strategic value of EPCs in planning and policy-making processes [32,33,34,35].
Parallel to these data-centric approaches, the integration of representative climate data is essential for accurate energy modelling. Numerous studies, in fact, have stressed the critical role of reliable meteorological inputs in dynamic simulations [3,36,37,38]. Yet this requirement is often overlooked due to the limited availability of high-resolution or forward-looking climate data. Neglecting future scenarios can result in significant inaccuracies in projected heating and cooling demands, ultimately reducing the effectiveness of retrofit strategies. To address this, TMYs derived from Regional Climate Models (RCMs) such as CORDEX provide a statistically robust representation of current and future conditions [39]. Incorporating TMYs across different time horizons (e.g., 2030, 2050, 2070) allows for long-term performance evaluations, climate risk assessments, and scenario-based planning that can guide the selection of resilient retrofit measures.
By combining EPC datasets with TMY-informed simulations, practitioners can not only evaluate current building performance but also anticipate future vulnerabilities and quantify the long-term benefits of retrofitting. This integrated approach extends beyond individual buildings, supporting urban-scale planning through GIS-based tools that visualise energy demand and performance concerning the local climate and built fabric [31,40,41,42,43]. Incorporating circular economy principles (e.g., local reuse or recycling of materials) into these strategies further strengthens the sustainability of retrofit interventions, increasing the lifecycle of construction components and reducing the environmental footprint of renovation efforts. When circularity indicators are embedded within energy modelling frameworks and spatial tools like Geographic Information Systems (GIS) and Building Information Modelling (BIM), they enable a more holistic understanding of material and waste flows across the urban scale [44,45,46,47,48,49,50,51,52,53,54,55,56]. This combined perspective fosters the development of more targeted, resource-efficient, and climate-responsive renovation strategies, ultimately enhancing the impact of energy policies and contributing to the sustainable transformation of the built environment.

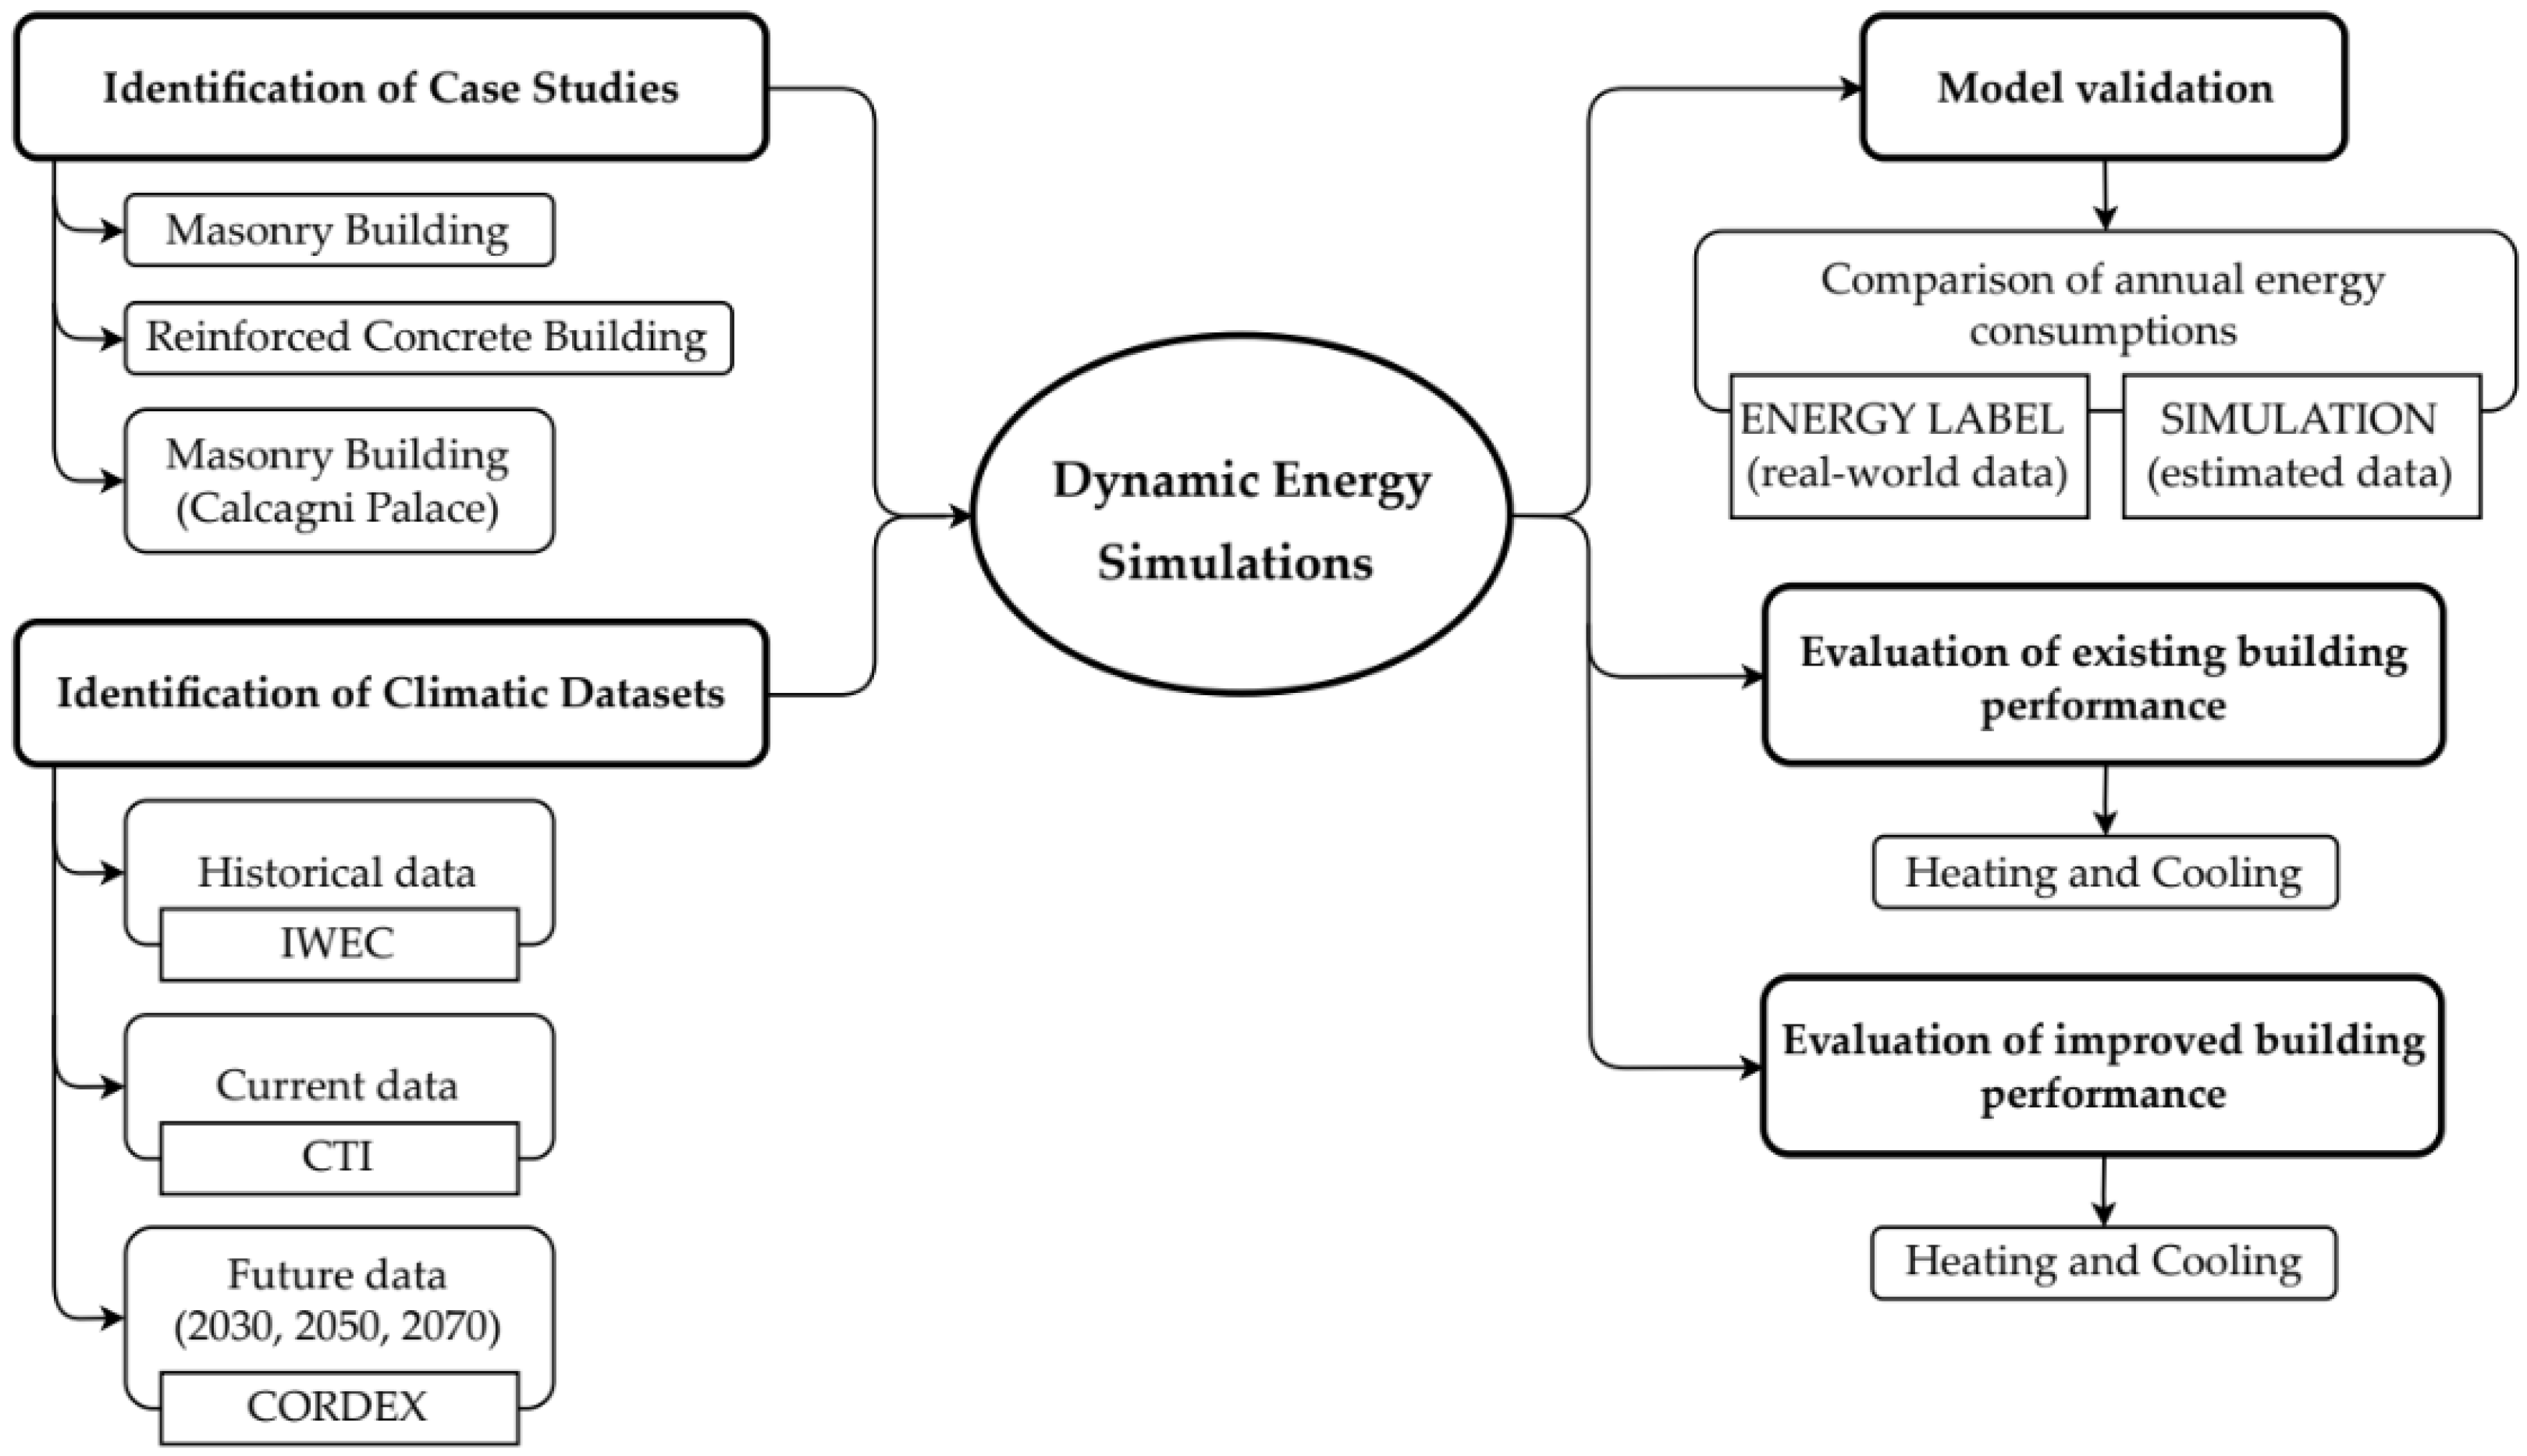
3. Materials and Methods

The current section presents a comprehensive overview of the selected methodology, outlining its main phases. A flowchart illustrating the overall approach is shown in Figure 1 and the specific phases are provided in the following subsections.

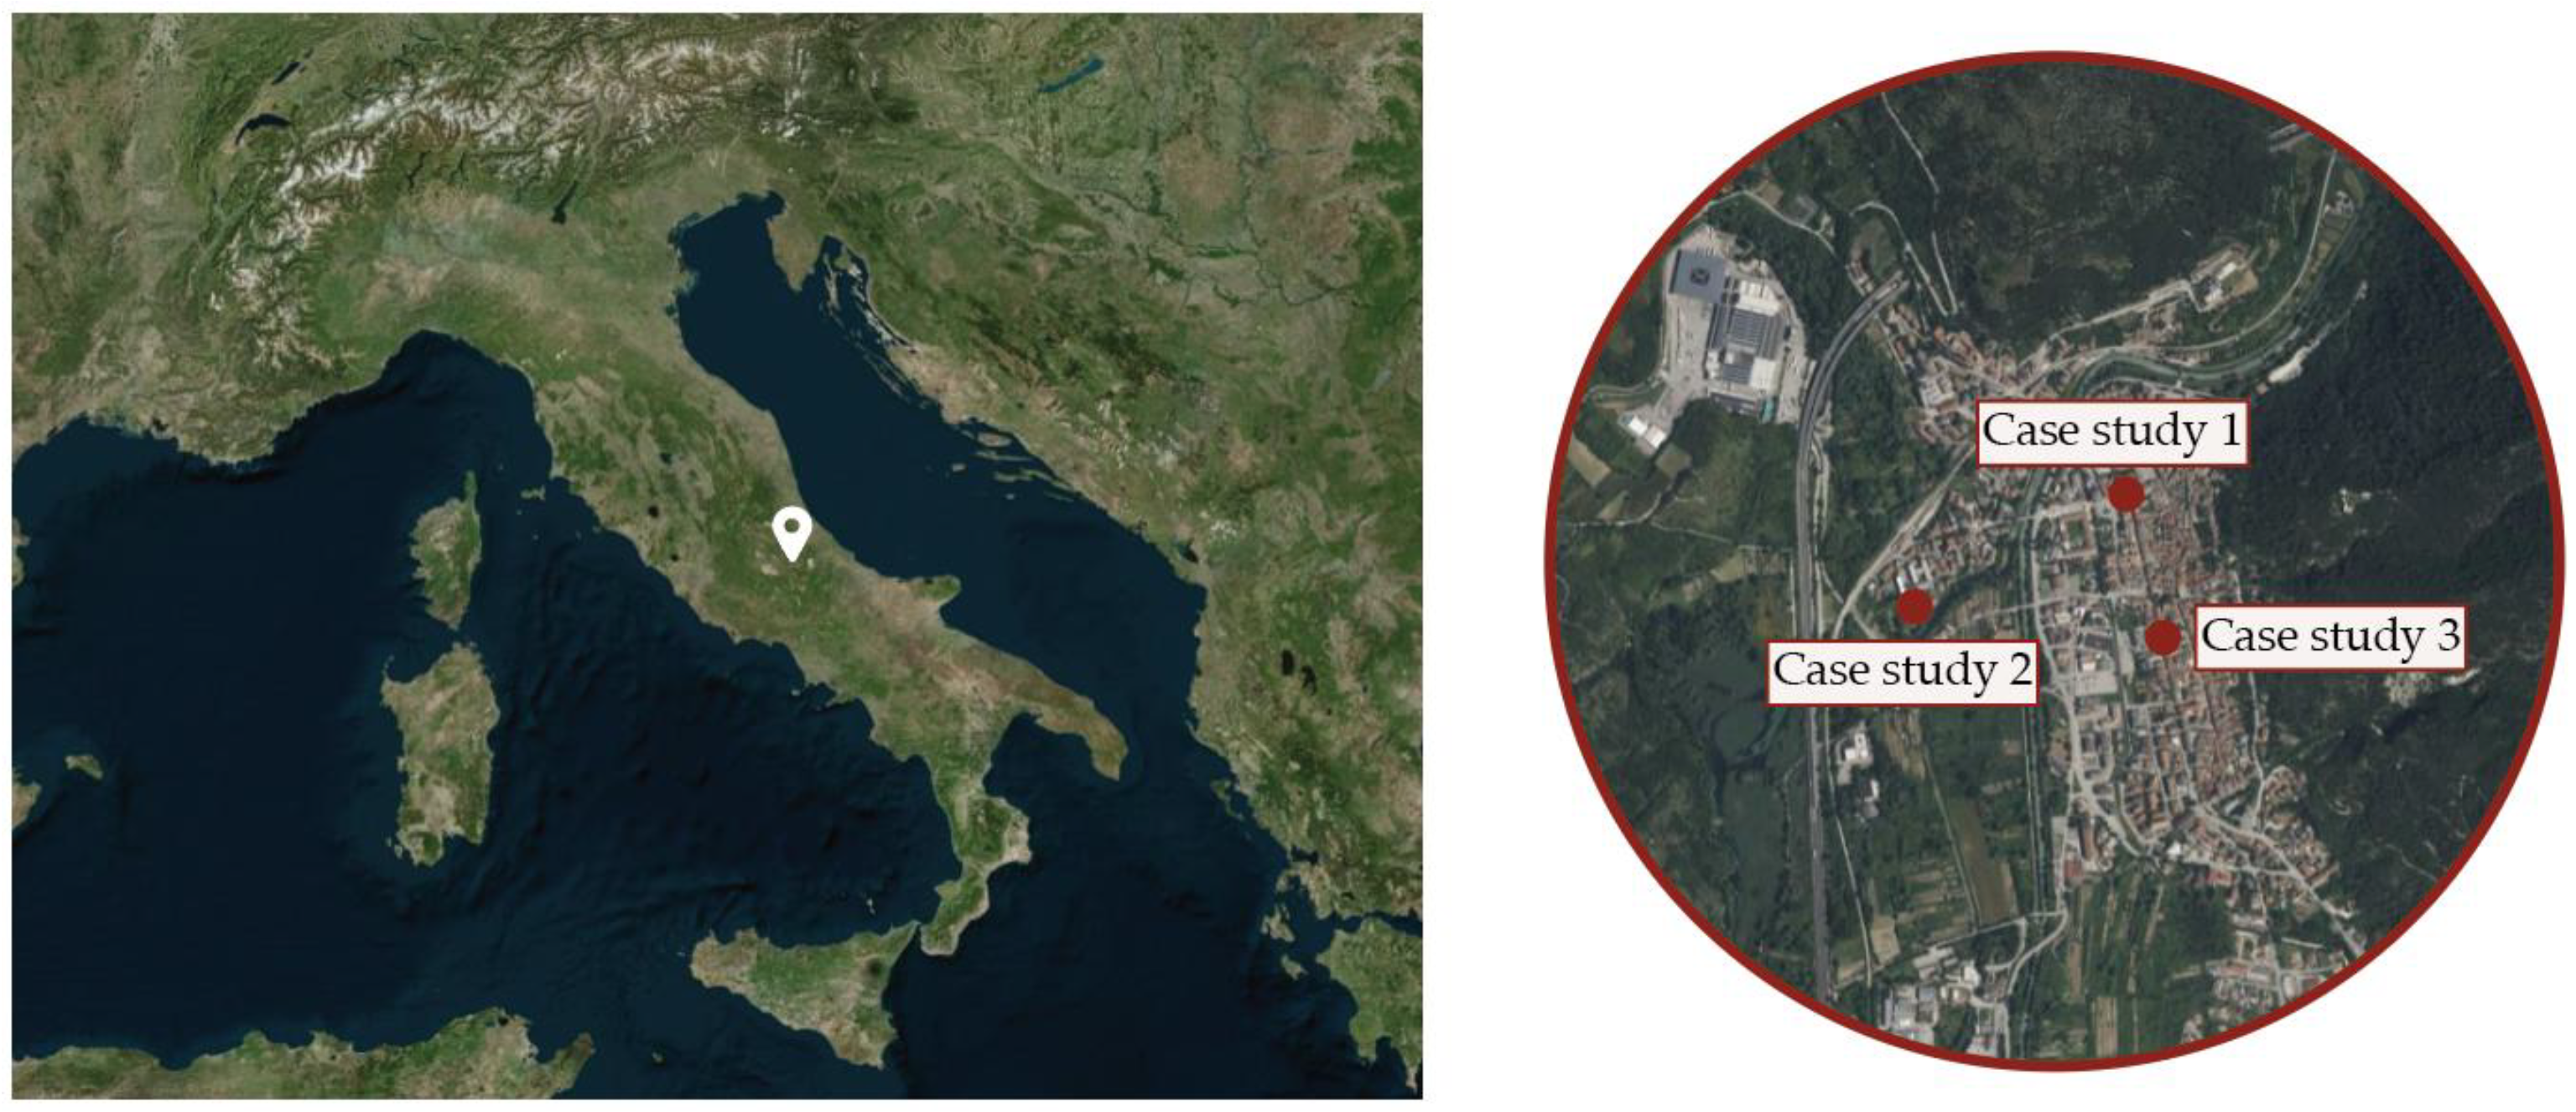
3.1. Identification of Case Studies and Climatic Datasets

The chosen case studies encompass a wide range of construction periods and architectural typologies, offering a snapshot of both the local building stock and, more generally, the typical forms commonly found throughout Italy. Specifically, the study focused on two masonry buildings and one reinforced concrete structure, located in Popoli, Central Italy. These buildings were modelled and their energy performance was evaluated through dynamic simulations under historical, current, and projected climate conditions.
The initial validation phase employed a historical TMY derived from the International Weather for Energy Calculations (IWEC) dataset in accordance with standard practices in building energy assessment. Present-day conditions were simulated using weather data provided by the Italian Thermotechnical Committee (CTI from the Italian name), based on measurements collected between 2007 and 2010 for the specific location. Finally, to explore future performance scenarios, weather files were developed adopting the Coordinated Regional Climate Downscaling Experiment (CORDEX) framework. Thus, TMYs were generated to reflect three distinct time horizons: short-term (2030), mid-term (2050), and long-term (2070). These future climate datasets offer a reliable and comprehensive basis for evaluating building performance within the framework of climate change adaptation.

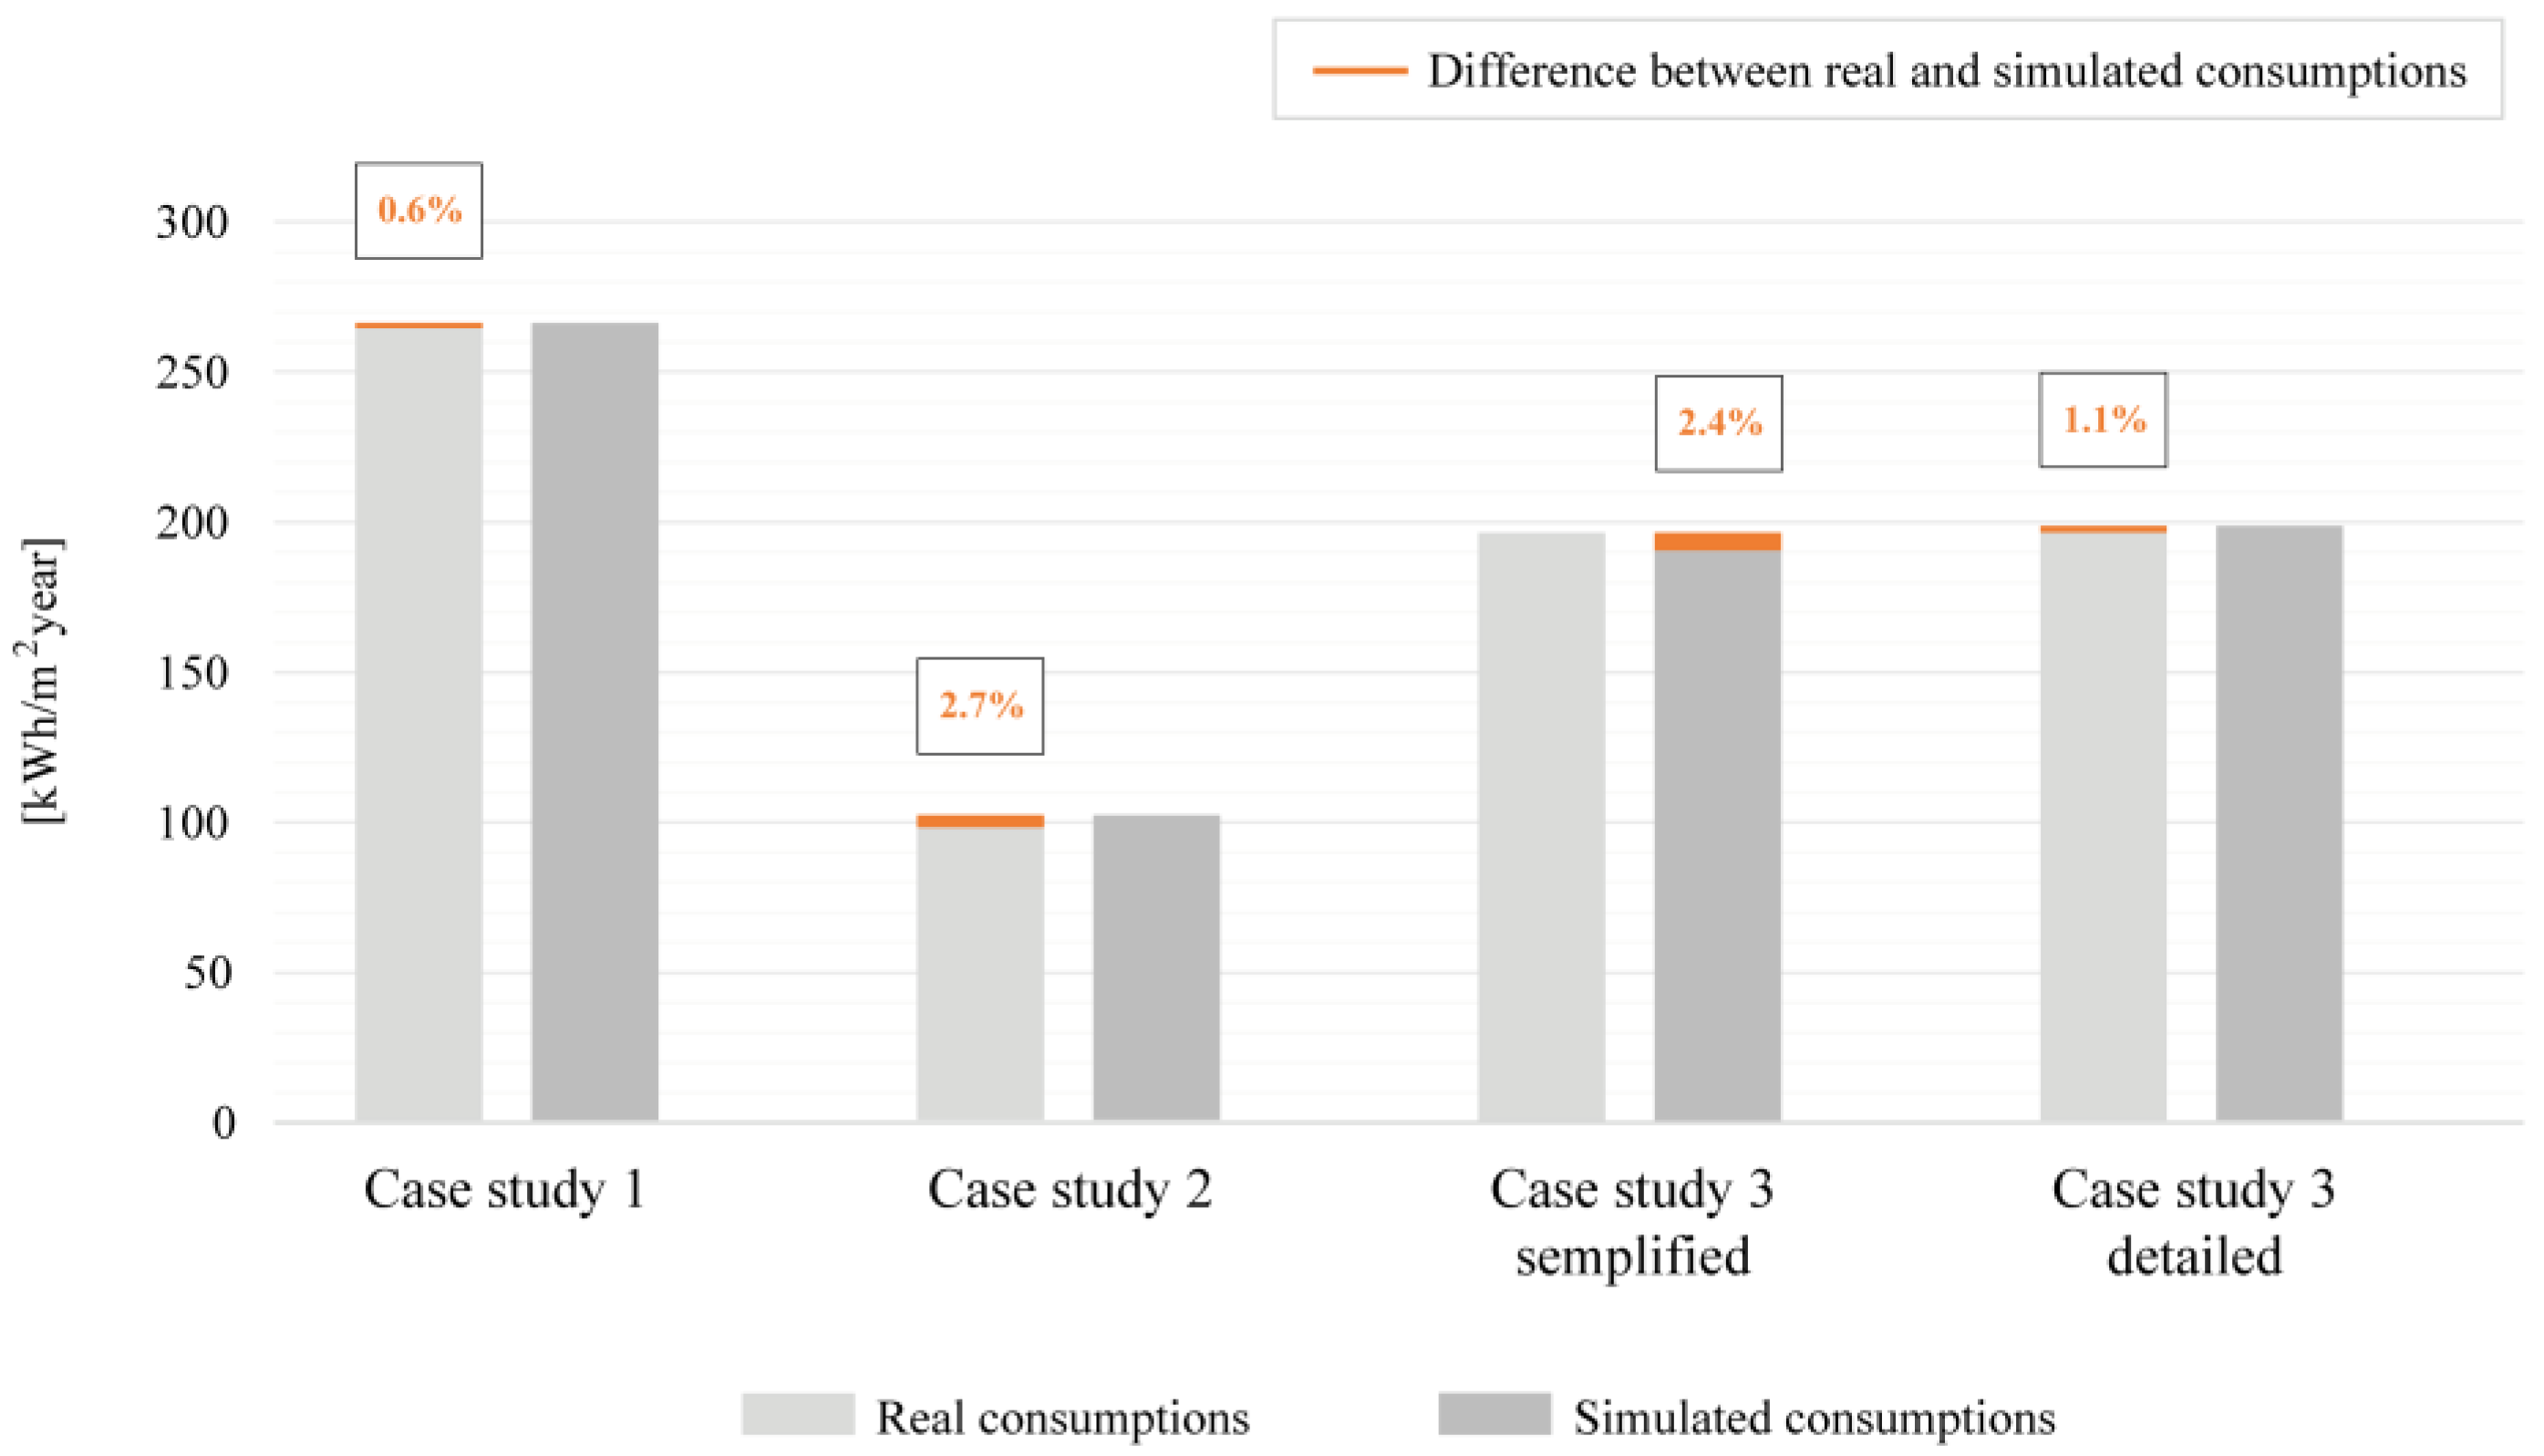
3.2. Model Validation

To ensure the accuracy and reliability of the simulation models, a preliminary validation phase was conducted by comparing the simulated annual energy consumption with empirical data derived from EPCs associated with the selected case studies. This approach leverages EPCs as a reference point, aligning predicted performance with documented energy usage and supporting the credibility of the modelling framework.
The analysis focused specifically on heating and domestic hot water (DHW) services as these were the only energy end-uses consistently available across all three buildings. The energy consumption was normalised by the usable floor area and the models were deemed valid if the difference between simulated and measured values fell within a ±5% margin, an accepted threshold in building performance modelling as recommended by various studies in the literature and established guidelines in this sector [57,58,59]. While this value is generally considered acceptable for annual energy calibration, it is important to underline that such an error margin may introduce a degree of uncertainty in long-term energy forecasts. However, given the comparative nature of the study, the impact of this uncertainty was expected to remain limited. Applying the same modelling assumptions and validation criteria across all case studies ensured internal consistency, allowing meaningful comparisons of relative performance trends even if slight discrepancies may have persisted in the absolute values.
Finally, it should be noted that this validation was limited to annual energy consumption [kWh] only as power demand peak [kW] data were not available from the EPCs for comparison.

3.3. Case Studies’ Simulations in Their Current Versions

The energy behaviour of the case studies was evaluated through dynamic simulations conducted using EnergyPlus (version 8.9), with DesignBuilder (version 6.1.0) as the user interface. These tools were selected for their proven effectiveness in modelling building energy behaviour under variable climatic conditions.
The analysis focused solely on space heating and cooling demands as these are the most sensitive to climate variations. DHW consumption was excluded from the results, given that its variation across different climate scenarios and retrofit interventions was found to be minimal. Moreover, DHW has a limited impact on the overall thermal load and therefore does not significantly influence retrofit prioritisation. Energy consumption values were, also in this case, normalised by usable floor area and expressed in kWh/m2 year, allowing for consistent comparison across buildings of different sizes and construction types. The simulations were carried out under both current and future climate conditions, enabling the assessment of their performance over time in response to projected climate change. This phase of analysis established a baseline energy profile for each case study, serving as a reference point for assessing the effectiveness of proposed retrofit strategies in later stages. Additionally, it enabled the assessment of each building’s sensitivity to evolving climatic conditions.

3.4. Case Studies’ Simulations After the Energy Retrofit
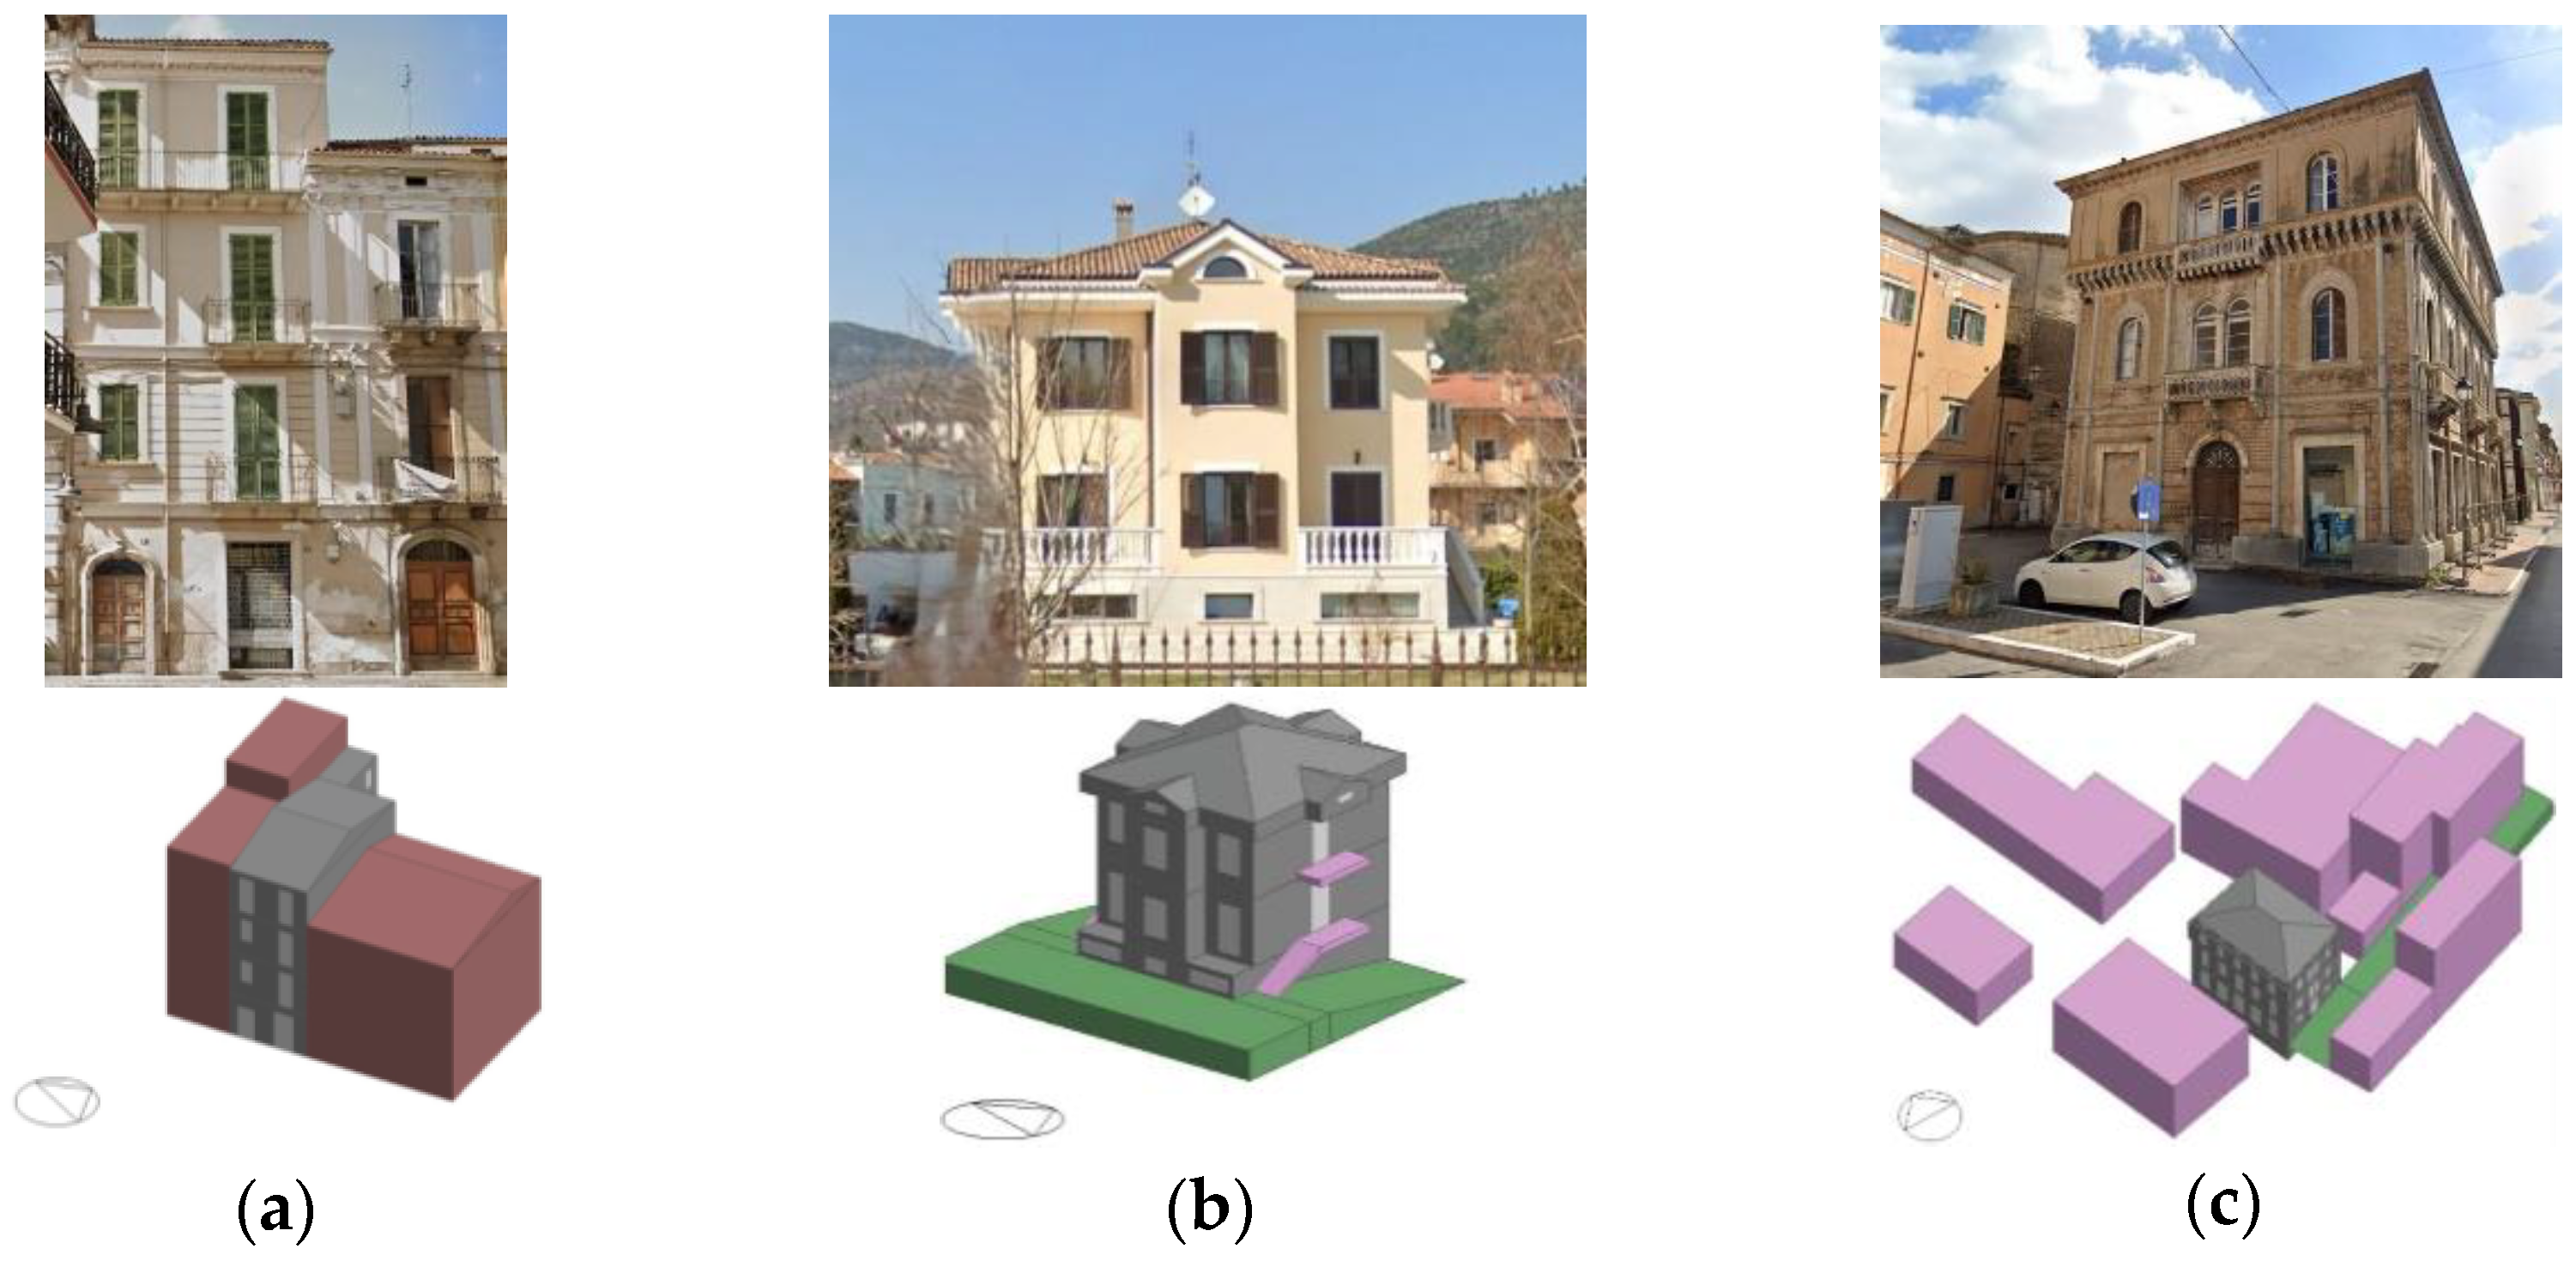
After characterising the case studies in their existing conditions, targeted energy retrofit interventions were proposed and evaluated through additional dynamic simulations. As in the baseline analysis, each case study was assessed under both current (CTI data) and projected future climate scenarios for 2030, 2050, and 2070, based on the CORDEX framework.
The proposed retrofit measures focused exclusively on enhancing the thermal performance of the buildings and included upgrades to their envelope, such as adding external insulation and replacing windows. This choice was driven by both methodological clarity and practical relevance: given that the building envelope is the primary component responsible for thermal exchanges, improving its performance represents one of the most effective and widely adopted strategies for reducing energy consumption [12]. In particular, such measures can significantly decrease heating demand in colder climates [60,61] and cooling loads in warmer ones [62,63,64,65]. Furthermore, the selected interventions were also tailored to the specific characteristics of each case study, balancing energy efficiency gains with implementation feasibility, particularly in the context of historic masonry structures and more modern reinforced concrete buildings.
For each building, the energy demand for heating and cooling in the retrofitted scenarios was compared against the corresponding pre-retrofit baseline. Results were presented in both absolute terms and as percentage reductions, allowing for a detailed evaluation of energy savings and building responsiveness to the implemented strategies under different climate conditions. This comparative approach provided key insights into the effectiveness and scalability of the retrofit solutions, particularly in the context of climate adaptation across diverse building typologies.

4. Case Studies

The reference buildings selected for this study are located in Popoli, a small town in the Province of Pescara. The area experiences a Mediterranean climate, characterised by mild winters and hot, sunny summers. According to the Köppen–Geiger climate classification system [66], Popoli falls under the humid subtropical climate category, designated as Cfa. In this system, “C” denotes a warm temperate climate, “f” indicates fully humid conditions with no dry season, and “a” signifies hot summers. Furthermore, based on Italy’s national climate zoning (determined by heating degree days [67]) Popoli is classified within Climate Zone D.
The analysed buildings span various construction periods and typologies, representing a substantial portion of the local building stock and, more broadly, typical structures found throughout Italy. Although the selected case studies differed in typology and construction characteristics, certain parameters were standardised in the simulations to allow for a more general analysis of energy performance. Specifically, uniform values for metabolic rates, fresh air requirements, and internal heat gains were applied across all buildings, based on typical occupancy and usage profiles commonly adopted in residential energy modelling. This simplification ensured consistency and enabled a controlled comparison focused on envelope performance under equivalent internal conditions. However, it is acknowledged that such assumptions may not fully reflect real usage patterns, particularly in older masonry structures, which often feature irregular ventilation habits, varying occupancy levels, and differing technical systems. This approach aligns with the authors’ intention to provide a broad overview of existing building stock performance rather than a highly specialised analysis of individual case studies and thus excludes building-specific usage data or calibrated simulations based on monitored conditions.
The geographical location of Popoli and the case study buildings are illustrated in Figure 2 while Figure 3 provides representative photographs of each case and a 3D axonometric view of the generated models. Additional details regarding the reference buildings are provided in the subsections that follow.
The EnergyPlus simulations were conducted using a time step of two per hour, selected as a balanced compromise between computational efficiency and result accuracy. Air temperature was selected as the control variable for thermal regulation. For all case studies, the same simulation settings were applied to ensure consistency and comparability. Specifically, the full exterior solar distribution model was adopted as it provides a suitable trade-off between accuracy and computational demand when modelling solar gains. A simplified sky diffuse radiation model was also considered to represent sky conditions across all simulations.

4.1. Case Study 1: Masonry Building

The first case study focused on a four-storey masonry building located in the historic centre of Popoli (42°10′23″ N, 13°49′56″ E). Selected for its representativeness, the building is part of a row house complex. Although the exact construction date is unknown, it is estimated to have been built around 1900, in line with neighbouring structures. Due to limited available documentation, several parameters, such as the construction period and the stratigraphy of building components, were reasonably estimated using established criteria. Geometric and architectural features were defined through photographs from real estate listings, supplemented by data from online sources and relevant databases. The building comprises four floors arranged around a central staircase, with a total area of approximately 300 m2. Each floor has a similar layout of about 60 m2, and a typical floor-to-floor height of 3.31 m, except for the ground floor, which is slightly higher at 3.55 m.
The characteristics of the building envelope were defined based on data from similar neighbouring structures with available information. Table 1 presents the thermal properties of building components, categorised by typology. In addition to these thermal parameters, the internal areal heat capacity of the walls was also considered. This value, which reflects the thermal inertia of the construction materials, ranges from 70.20 to 79.40 kJ/m2K depending on the specific wall typologies present in the case study.
The glazed surfaces feature aluminium-framed windows with double panes and a transmittance value (U-value) equal to 2.70 W/m2K, as referenced from the TABULA web tool [68]. Linear thermal bridges at junctions were modelled using the default settings and values provided in DesignBuilder, in accordance with the specifications outlined in Standard [69]. The specifications of the Heating, Ventilation, and Air Conditioning (HVAC) system were likewise estimated through comparative analysis with similar buildings.
The only verified information pertains to the residential unit located on the second and third floors, which is equipped with an independent heating system with radiators, a DHW system, and uses natural gas as the primary energy source. The efficiency rates of the HVAC and DHW systems are 0.76 and 0.43, respectively. The residential unit is classified as Energy Class F, with a documented combined annual energy consumption for heating and DHW systems of 264.12 kWh/m2.
A simplified modelling approach was adopted, incorporating several building-wide parameters in addition to the previously described input data. These parameters included a heating setpoint temperature of 20 °C for all thermal zones, a metabolic factor of 0.90, a minimum fresh air supply of 10 L/s per person, and an infiltration rate of 0.70 air changes per hour. Furthermore, its general lighting system was designed using suspended luminaires, with a normalised power density of 5.0 W/m2 per 100 lux. The radiant and visible fractions were set to 0.42 and 0.18, respectively.
The model aimed to accurately represent the building’s external envelope and orientation while internal partitions were omitted. Each floor was modelled as a single homogeneous thermal zone, with occupancy rates assigned according to Table 2. Internal staircases were represented as floor openings in the corresponding slabs and balconies were excluded due to their negligible influence on thermal performance. Adjacent buildings were modelled as adiabatic blocks—depicted in purple in Figure 3a—with material properties equivalent to the building’s rendered stone masonry walls.

4.2. Case Study 2: Reinforced Concrete Building

The second case study examined a four-story reinforced concrete frame building, selected for its representativeness, located just outside the historic centre of Popoli (42°10′10″ N, 13°49′39″ E). Due to limited available information, certain parameters, including the building geometry and window details, were consistently derived or estimated using the previously mentioned criteria.
The structure is a detached single-family residence, constructed in 2000. The geometric and architectural details were defined using real estate listing photographs and supplemented with data from online sources and databases. The structure comprises four floors with a total area of approximately 450 m2. All levels are served by a central staircase, except for the basement, which has an independent entrance. The ground floor and first floor layouts are uniform, with areas of 108 m2 and 102 m2 and floor-to-floor heights of 3.37 m and 3.11 m, respectively. The attic floor, with its pitched roof, and the basement have slightly different layouts, with areas of approximately 130 m2 and 113 m2 and floor-to-floor heights of 3.10 m (maximum height) and 2.60 m, respectively.
The building envelope characteristics are known and summarised in Table 3, which presents the thermal properties of the various components, categorised by type. The internal areal heat capacity of the walls is equal to 45.30 kJ/m2K. The windows feature aluminium frames with double glazing and a transmittance value of 3 W/m2K, based on reference values from the TABULA web tool, and thermal bridging has been accounted for as in the previous case.
Data regarding the HVAC system details and energy consumption are available for this building. Specifically, it is equipped with a condensing boiler serving the entire structure, providing both heating (through radiant floor systems) and domestic hot water, with natural gas as the energy source. The efficiency rates of the HVAC and DHW systems are 0.83 and 0.81, respectively. Regarding the energy classification of the residential unit, documented combined annual energy consumption for heating and DHW systems is 99.90 kWh/m2.
Also in this case, a simplified modelling approach was adopted, incorporating the following building parameters into the previously described input data: a heating setpoint temperature of 20 °C for all thermal zones, a metabolic factor of 0.90, a minimum fresh air requirement of 10 L/s per person, and an infiltration rate of 0.70 air changes per hour. Moreover, the lighting system was designed using suspended luminaires, with a normalised power density of 5.0 W/m2 per 100 lux, and the radiant and visible fractions were set to 0.42 and 0.18, respectively.
As the building is exclusively residential and habitable across all levels, each floor was assigned the same thermal zone type (Domestic Circulation) with the respective occupancy rate as reported in Table 2. Internal staircases were represented as floor openings in their specific slabs. Additionally, both balconies and external stairs were modelled as standard component blocks (shown as pink elements in Figure 3b) to account for their potential shading influence on the building. Ground adjacency modelling was necessary due to the existing elevation difference and was implemented using the specific component block.

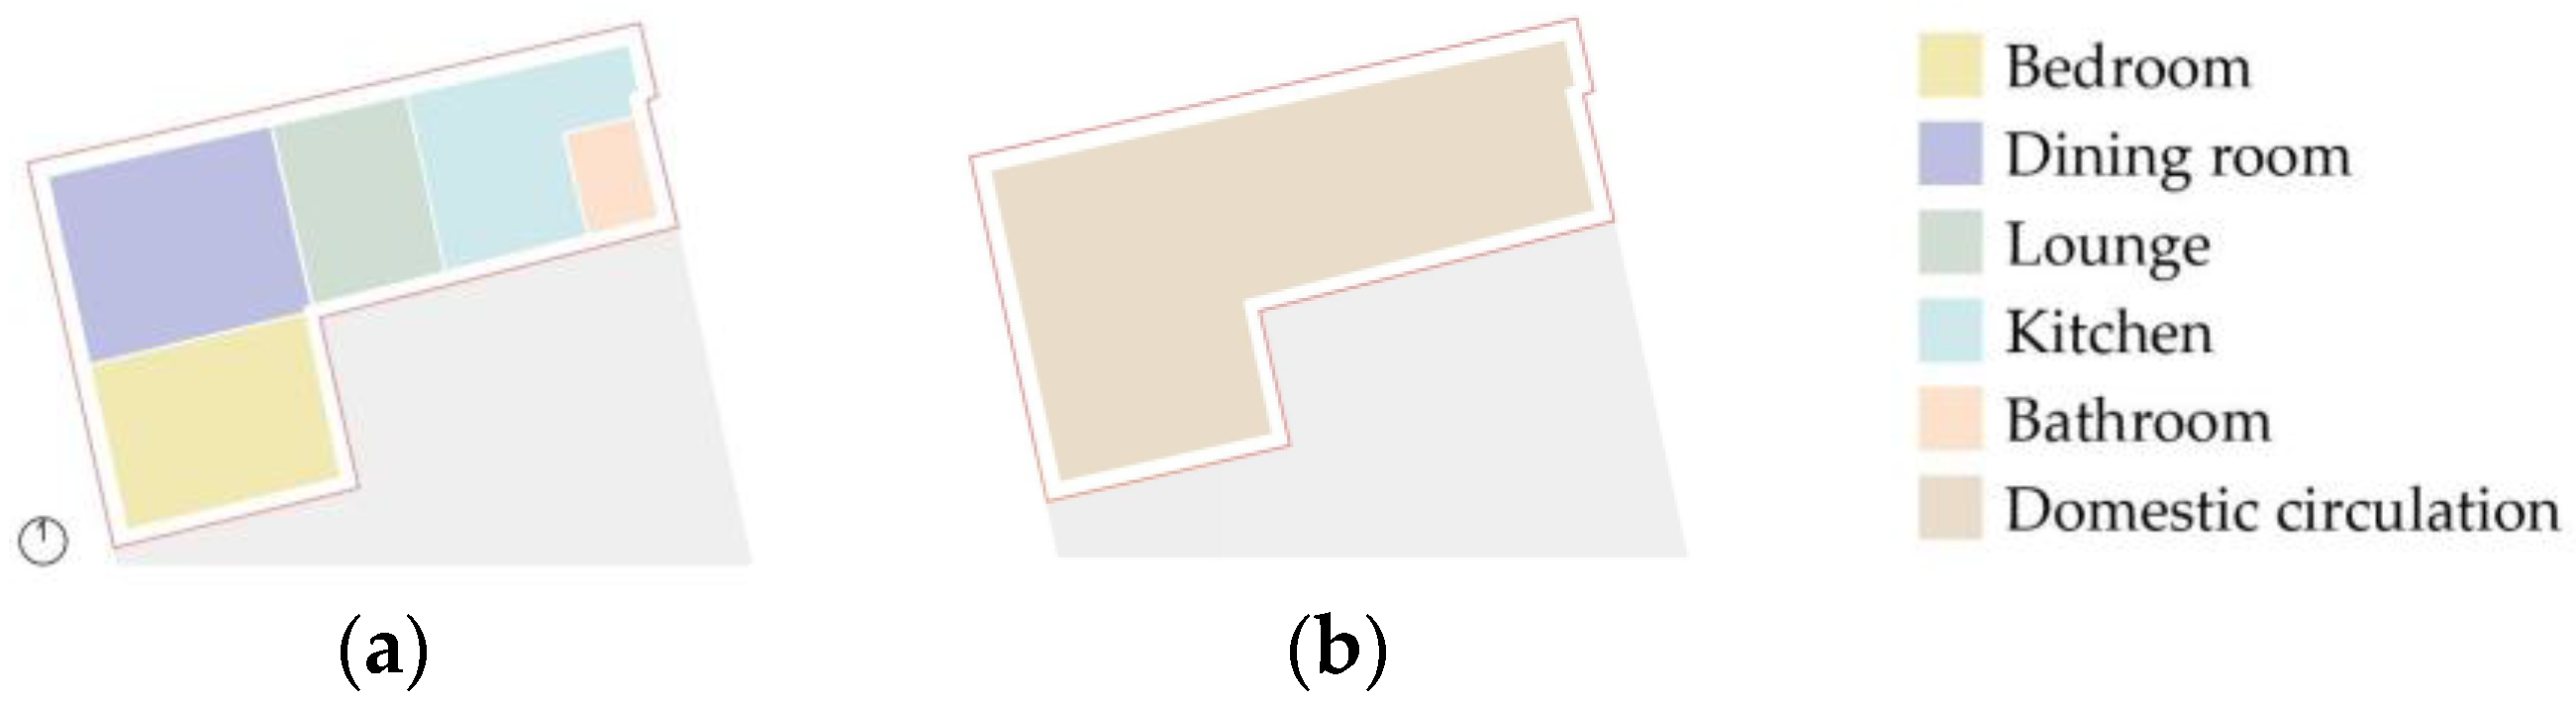
4.3. Case Study 3: The Calcagni Palace

The last case study examined the Calcagni palace, a five-story masonry building located in the historic centre of Popoli (42°10′13″ N, 13°49′59″ E), chosen for its historical and cultural significance. The wealth of available documentation and the building’s heritage value allowed for a more in-depth analysis compared to the previous two cases.
Constructed in 1900, the building is a detached palace comprising five floors and covering a total area of approximately 870 m2. All floors are served by an internal staircase located on the east side, except for the basement, which has an internal staircase on the west side. The floor plans are relatively uniform, with variations in the dimensions of external walls and internal partitions. Similarly, the floor-to-floor heights differ for each level, spanning from 4.30 m to 2.40 m.
The structure consists of a basement used as a cellar, a ground floor containing commercial spaces and storage rooms, and first and second floors divided into residential sub-units. As previously noted, the availability of verified information enabled a detailed modelling approach to be applied to the entire building, followed by a simplified one. This process included the incorporation of internal partitions and the definition of all existing thermal zones along with their respective service systems. Internal staircases were represented as floor openings while existing balconies were excluded from the model due to their negligible impact on the case study. In contrast, nearby buildings were incorporated as standard component blocks (the pink elements in Figure 3c) to account for their potential shading influence on the case study. Also here, the adjacency with the sloping terrain was modelled using a dedicated component block. Although the entire building was generated, the analysis focused exclusively on a residential unit located on the second floor. This approach not only ensured consistency with the other case studies but also reflected common practice in apartment-style buildings, where traditional EPCs are typically issued for individual units.
The residential unit’s boundaries are defined vertically by external and internal walls separating it from the stairwell and the adjacent unit, with internal partitions dividing the living spaces, while horizontally, the boundaries consist of the second floor and attic floor slabs, respectively. Table 4 summarises the thermal properties of building components, categorised by type. As in the previous cases, the presence of thermal bridging has been accounted for in the analysis. The internal areal heat capacity of the walls ranges from 62.20 to 63.90 kJ/m2K, reflecting the thermal inertia associated with the specific wall typologies considered. The windows feature wooden frames with single glazing and a transmittance value of 4.83 W/m2K, based on reference values from the TABULA web tool. A standard boiler for both radiator heating and domestic hot water serves the unit, using natural gas as the energy source. The efficiency rates of the HVAC and DHW systems are 0.57 and 0.46, respectively. Furthermore, the unit is classified as Energy Class F, with a combined annual consumption for heating and DHW systems of 196.19 kWh/m2. In detail, the selected apartment comprises five rooms: an entrance hall, kitchen, bathroom, living room, and bedroom. Given the detailed modelling approach, each room represents a distinct thermal zone assigned with corresponding activity and occupancy rates as reported in Table 5.
Moreover, the following parameters were considered in addition to the previously described input data: a heating setpoint temperature of 18 °C for all thermal zones except the entrance hall (21 °C), a metabolic factor of 0.90, a minimum fresh air requirement of 10 L/s per person for all thermal zones, increased to 12 L/s per person in bathroom and kitchen areas, and an infiltration rate of 0.70 air changes per hour. The lighting system was composed of suspended luminaires, with a normalised power density of 5.0 W/m2 per 100 lux and a radiant and visible fraction equal to 0.42 and 0.18, respectively.
The apartment was also analysed through a simplified approach (the same adopted for the other case studies). Thus, the internal partitions dividing the unit’s spaces were deleted and the boundaries separating it from external areas were maintained. Figure 4 illustrates the differences between the configurations used for detailed and simplified modelling. The potential error introduced by this simplification is justified by the advantage of restoring the useful area for heating and cooling calculations that influence consumption metrics. Indeed, when expressing consumption in kWh/m2, maintaining consistent reference surface areas for comparing the two models and validating them against actual consumption data is crucial.
The only discrepancy in settings between the detailed and simplified modelling approaches lay in the homogenisation of all thermal zones into a single one (Domestic Circulation) with an occupancy rate as reported in Table 2. For this single thermal zone, the following parameters were implemented: a heating setpoint temperature of 18 °C, a metabolic factor of 0.90, a minimum fresh air requirement of 10 L/s per person, and an infiltration rate of 0.70 air changes per hour. All other characteristics relating to external walls, floor slabs, considered internal partitions, window components, and existing systems remained unchanged from the detailed approach.

4.4. Energy-Efficient Solutions for the Reference Buildings

A key phase of the study involved hypothesising targeted interventions aimed at reducing the total energy consumption values of the case studies and assessing their impacts under varying climatic conditions. While the interventions were tailored to the specific context of each case study, they consistently focused solely on the building envelope, both opaque and transparent components, excluding any modifications to technical systems or equipment.
The first step involved assessing the compliance of the building envelope components (external walls and windows) with the thermal transmittance thresholds required for energy requalification in the Popoli climatic zone. This evaluation was conducted following the criteria outlined in [70], which specify the minimum performance standards for retrofit interventions. Specifically, the reference transmittance limits are 0.32 W/m2K for opaque components (walls) and 1.80 W/m2K for transparent ones (windows). These thresholds are based on current national regulations for thermal performance in Climate Zone D, as established by Italian Legislative Decree 26/2015 and its subsequent updates. The comparison between the measured and reference values confirmed significant non-compliance, particularly for Case Studies 1 and 3. As older masonry structures built before the implementation of modern energy efficiency regulations, these buildings are especially vulnerable in terms of thermal performance, exhibiting U-values well above current limits. Although the reinforced concrete building (Case Study 2) also falls short of meeting the prescribed standards, its envelope demonstrates relatively better performance, likely due to its more recent construction and partial alignment with updated regulatory requirements.
Accordingly, the improved U-values adopted in the simulation scenarios were aligned with these regulatory benchmarks. This ensured that the proposed retrofit measured not only met the legal minimum requirements but also represented technically and economically viable targets consistent with typical retrofit practices. For windows, the assessment focused solely on the transmittance of the glazed portion as it served as a reliable proxy for overall thermal performance.
Based on these considerations, the restorative measures identified for the case studies differed between reinforced concrete and masonry buildings. For the reinforced concrete building, a 0.04 m thick external wood fibre insulation was selected. In contrast, for the masonry buildings, thermal plaster composed of aerogel and hydraulic lime was applied, with thicknesses of 0.08 m for Case Study 1 and 0.07 m for Case Study 3. This approach was chosen to respect the cultural and architectural value of historical buildings, where external envelope interventions are not permitted, thereby ensuring the preservation of their heritage. Table 6 summarises the comparison of envelope component transmittance values before and after restoration.

5. Results and Discussion

5.1. Climatic Data Adopted for Simulation

As outlined in Section 3.1, the present study aimed to evaluate the impact of varying climatic conditions on different case study configurations. The goal was twofold: to assess their vulnerability to climate change and evaluate the effectiveness of proposed energy retrofit strategies. To this end, simulations were conducted adopting a range of weather datasets—historical, current, and future.
The first dataset was the IWEC typical meteorological year [71], selected for the validation phase. This dataset comprises hourly weather data collected over an 11-year experimental campaign from 1959 to 1970. Measurements were taken at a meteorological station (42°85′00″ N latitude and 14°20′00″ E longitude), using standard meteorological instruments to record key climatic variables including air temperature, wind speed at 10 m above ground level, relative humidity, and solar radiation. For current climate conditions, data were sourced from TMY files developed by the CTI, which has been producing updated and standardised climate databases for Italian locations since 2016 [72]. The dataset used in this study includes hourly records from 2007 to 2010, collected at a station positioned at 42°28′00″ N and 14°13′00″ E. The CTI dataset, available for free download, provides hourly records of several key meteorological variables essential for building energy simulations, including air temperature; direct, diffuse, and global solar irradiance on a horizontal plane; relative humidity; partial vapor pressure; and wind speed. These data were collected using automated weather monitoring systems designed to meet national and international measurement standards, ensuring reliable input for dynamic energy simulation.
Finally, future weather conditions were estimated using the CORDEX RCM [73]. This model enables the generation of reliable climate projections, which are essential for evaluating building thermal performance under evolving climatic scenarios. Further details regarding the methodology and input parameters used to produce future TMY files are provided in [36]. In this study, the CNRM-ALADIN [74] model—a limited-area, bi-spectral model developed by the Centre National de Recherches Météorologiques (CNRM) and available through the Euro-CORDEX platform—was selected to generate future climate files for dynamic simulation. The data, available at 3 h intervals, were extracted for a location at 42°28′57″ N and 14°08′07″ E. The Representative Concentration Pathway (RCP) 4.5 scenario was chosen as it aligns with moderate greenhouse gas reduction targets consistent with national climate policies. Using these settings, three TMY files were generated to simulate the climatic conditions expected in the years 2030, 2050, and 2070.

5.2. Validation of the Case Study Models

The validation process was carried out by verifying that the energy consumption predicted by dynamic simulations closely matched actual measured data, ensuring that any discrepancies remained within an acceptable range. The results of these comparisons are presented in Figure 5. As shown, the deviation between measured and simulated values was below 5% across all case studies, with errors ranging from a minimum of 0.6% to a maximum of 2.7%, thereby confirming the reliability of the simulation models for further analysis. Specifically for Case Study 3, the residential unit in the Calcagni palace, the detailed and simplified models were evaluated. While both models proved to be suitable, the detailed model demonstrated higher accuracy and lower susceptibility to error, as expected. This was primarily due to the geometric approximations present in the simplified model. Given these considerations, all subsequent analyses will be based on the detailed model of the residential unit.

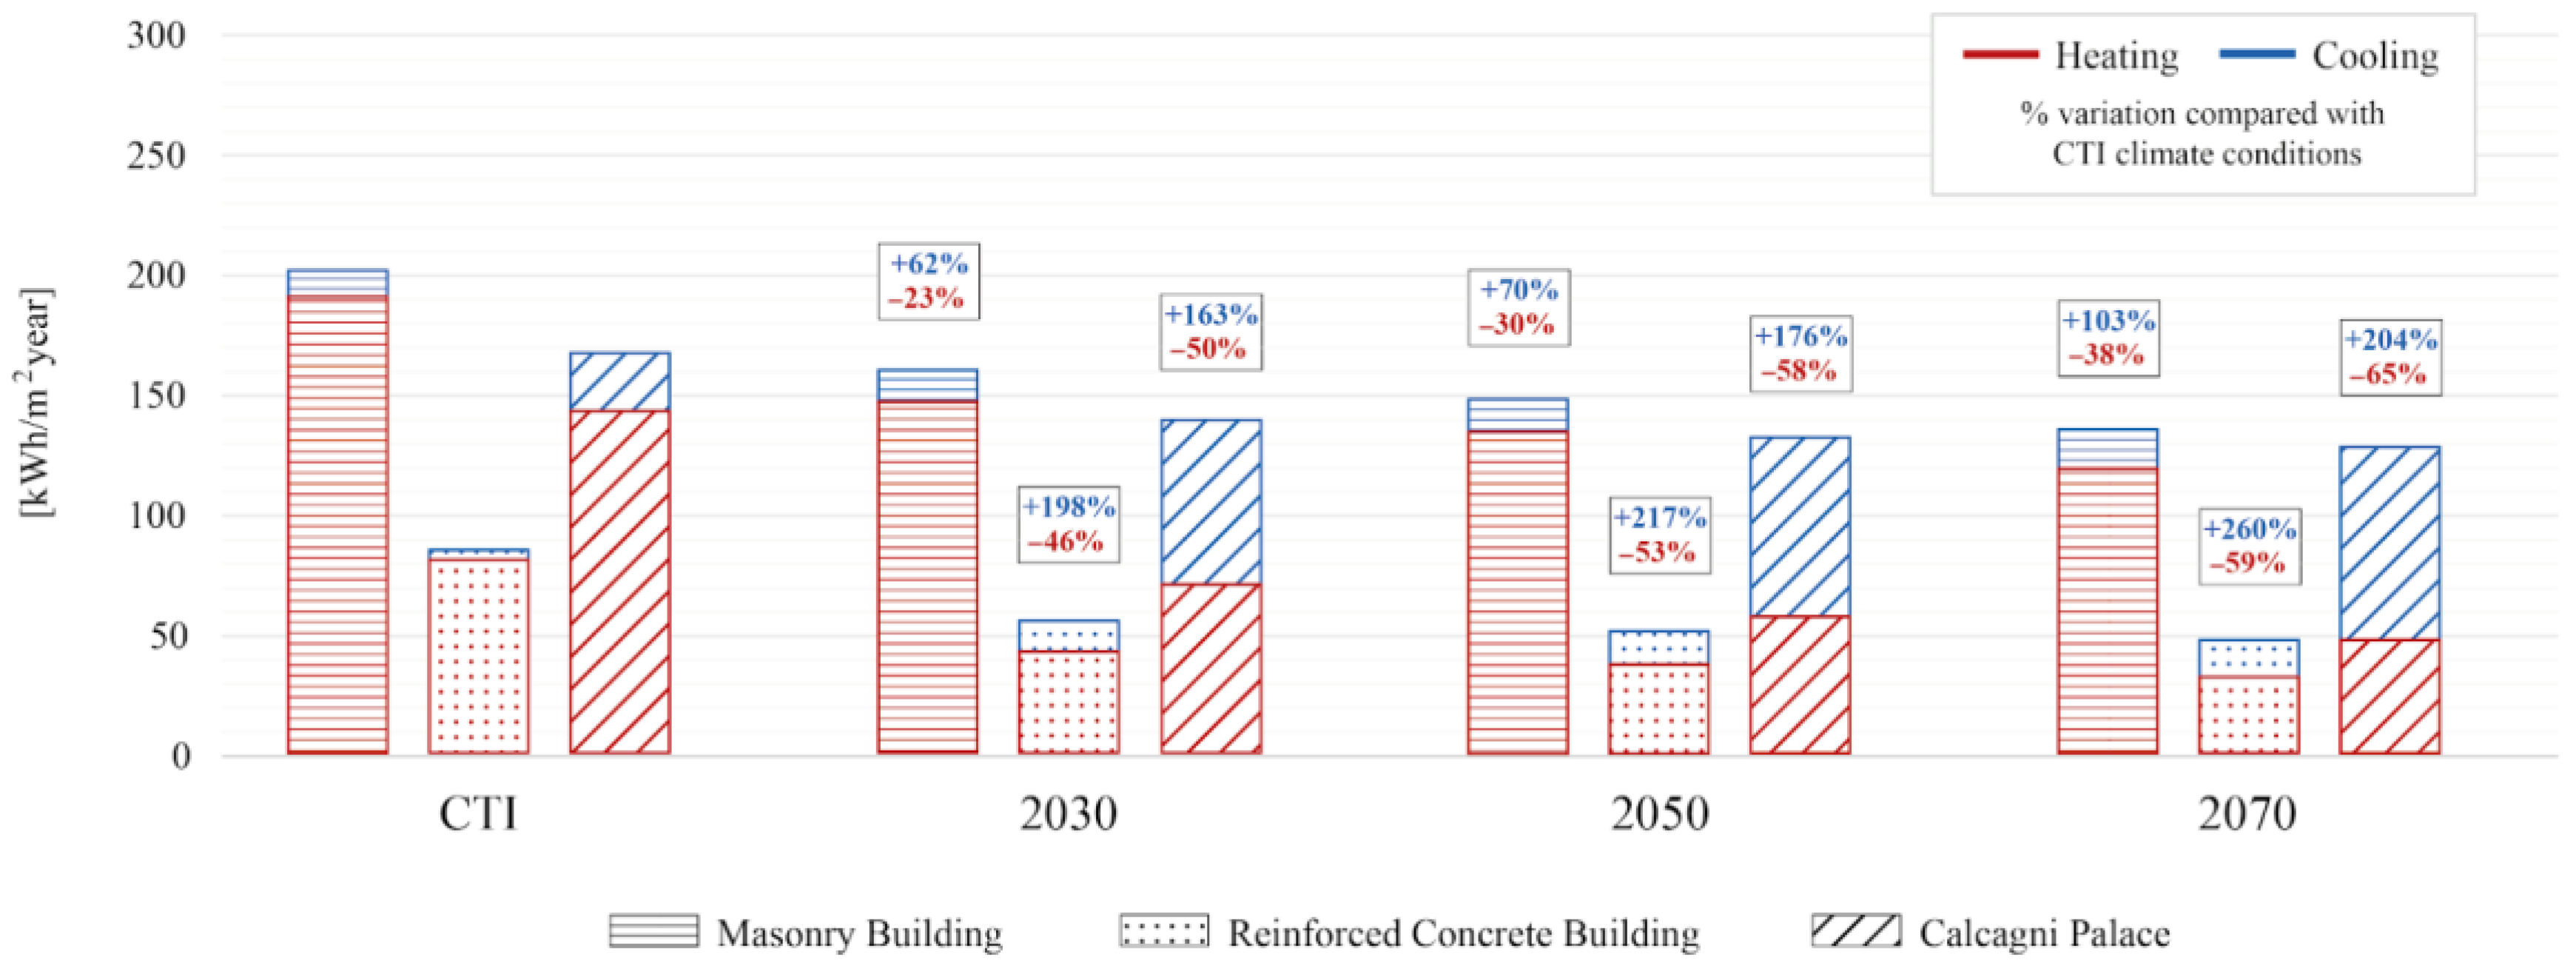
5.3. Dynamic Energy Simulations—Current Version

Once the models were validated and proven capable of accurately simulating the real behaviour of the case studies, dynamic energy analyses were conducted to assess the climate vulnerability of the reference buildings in their current state. Figure 6 illustrates the heating and cooling energy demands under various climate scenarios. Overall, the results revealed consistent consumption trends across all three buildings when transitioning from current to future climatic conditions. Specifically, simulations based on projected climate data showed a gradual decrease in heating demand (red portion of the bars) accompanied by a corresponding increase in cooling requirements (blue portion). This shift corresponded to increasing outdoor temperatures, with annual means rising from 15.50 °C under current conditions to 16.00 °C, 16.30 °C, and 17.00 °C in 2030, 2050, and 2070, respectively. The most significant changes were observed in minimum temperatures, which increased from 6.42 °C to 7.92 °C, 9.95 °C, and 10.76 °C, substantially reducing heating needs. Maximum temperatures exhibited only slight increases (from 25.61 °C currently to 25.93 °C by 2070), resulting in a rise in cooling demand.
Although the overarching trends were similar, each building exhibited distinct percentage variations in energy consumption, indicating differing levels of sensitivity to climate change. Heating demand was projected to decrease across all case studies by 23–38% in the masonry structure (Case Study 1), 46–59% in the reinforced concrete building (Case Study 2), and 50–65% in the Calcagni palace unit (Case Study 3). Conversely, cooling demand increased significantly, especially in Case Study 2, with a rise of up to 260%, compared to 103% and 204% in Case Studies 1 and 3, respectively. These shifts resulted in overall energy use reductions ranging from 20–32% for Case Study 1, 34–43% for Case Study 2, and 17–23% for Case Study 3, underscoring the varying degrees of vulnerability among the buildings.
These findings align with broader trends identified in the literature for areas characterised by Mediterranean or similar climates, which report a general decrease in heating demand, ranging from 31% to 57%, and a substantial increase in cooling needs, from 99% up to 380%, under future climate conditions [75,76,77]. Moreover, such trends can be extended to other climatic zones: in cold regions, heating energy use may decrease by as much as 58% [78,79,80], while in hot climates, cooling demand increases can reach up to 790% [81,82]. However, the overall impact on total energy consumption remains strongly influenced by local climate.
A comparative analysis of the three case studies highlights notable differences in their responses to future climate conditions. When analysing the first two buildings, the masonry structure consistently exhibited smaller percentage changes in energy consumption than the reinforced concrete building. This suggests that it is generally less sensitive to climatic variations and, therefore, less vulnerable to the impacts of climate change. Additionally, while cooling-related percentage increases exceeded those for heating in both buildings, heating demand continued to dominate overall energy consumption due to its significantly larger share. As the data show, heating loads were consistently an order of magnitude higher than cooling loads across all scenarios, which was in line with the climatic characteristics and elevation of Popoli. Accordingly, retrofit strategies focused primarily on reducing heating demand by enhancing the building envelope and lowering thermal transmittance.
In the case of the Calcagni palace (Case Study 3), the percentage reduction in total energy consumption under future climate scenarios was smaller than in the other two cases. At first glance, this could suggest a lower sensitivity to climate change. However, a closer examination reveals that the building experienced larger variations in heating demand across all future scenarios compared to the other two case studies. Its cooling demand increased more significantly than in the first case study and approached the levels seen in the second. This indicates a higher responsiveness to climatic inputs than the masonry structure, despite similarities in construction type.
The relatively smaller change in total energy consumption for Case Study 3 was instead attributed to the evolving balance between heating and cooling demands. In the first two buildings, heating remains the dominant energy component, and thus its fluctuations heavily influence overall trends. In contrast, for the Calcagni palace, heating dominates only under current climate conditions (CTI dataset). In future scenarios, cooling demand gradually becomes more significant, equalling heating demand by 2030 and surpassing it by 2050 and 2070. As a result, in this case, total energy variation is more significantly influenced by cooling, in contrast to the other buildings, where—despite a sharp increase—cooling contributes less to total energy use compared to heating. Therefore, despite its higher climatic sensitivity, the Calcagni palace exhibits smaller overall percentage changes in total energy consumption. Nonetheless, the retrofit strategies for this building, as with the other case studies, prioritised reducing heating demand, reflecting the predominant heating requirements imposed by the climatic conditions and elevation of Popoli.

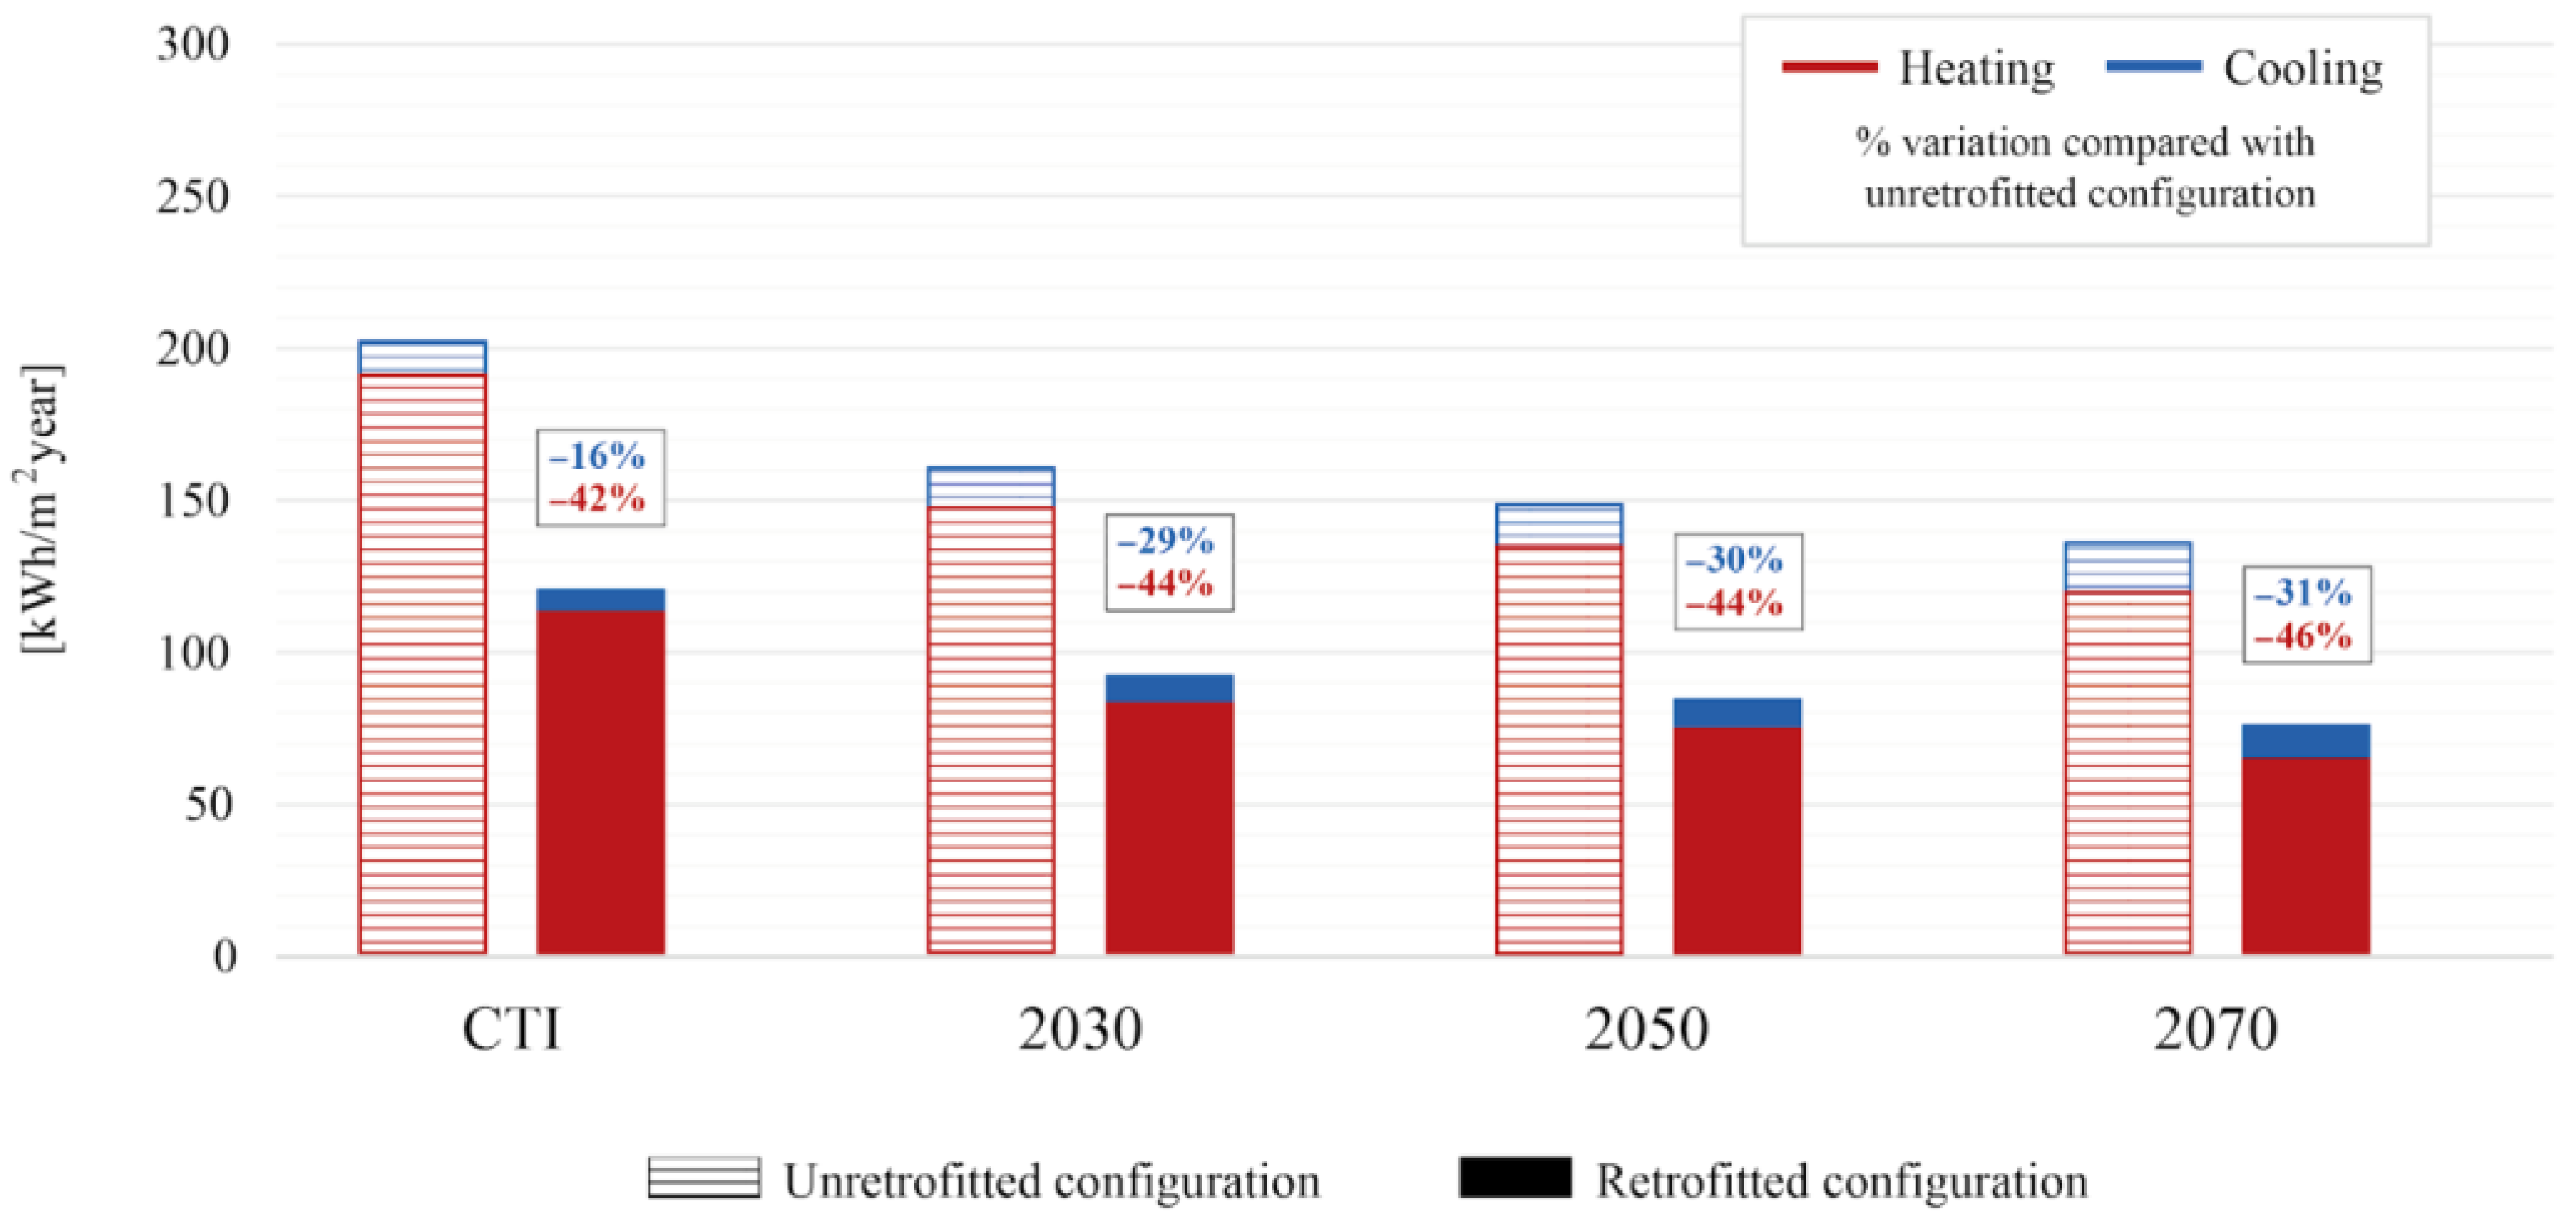
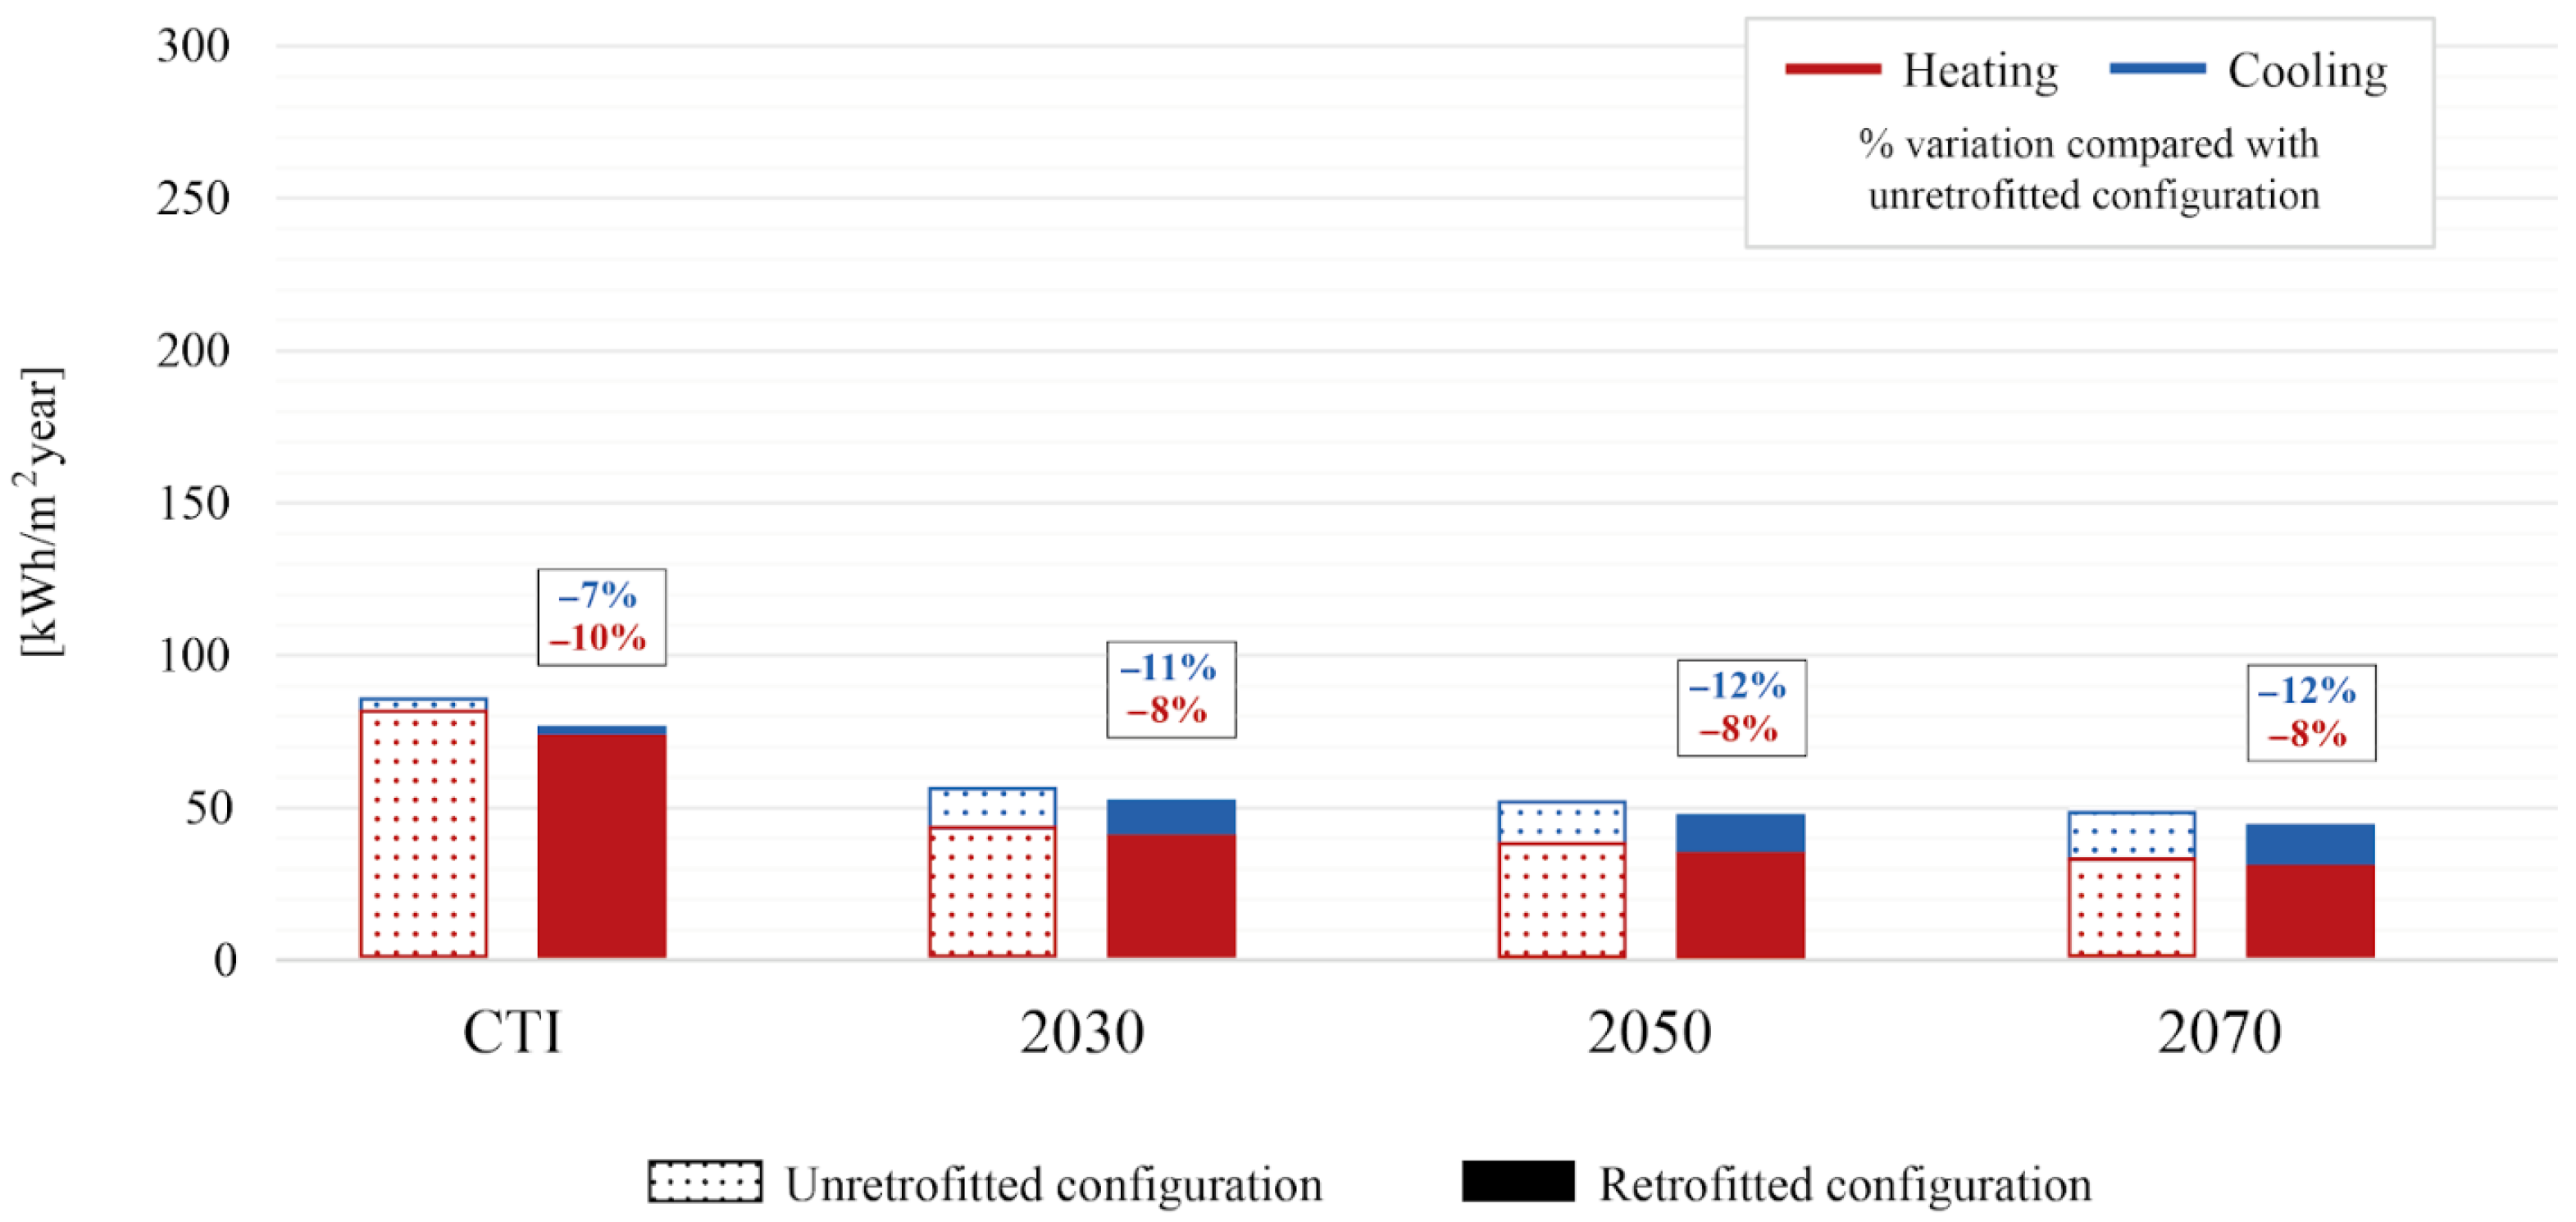
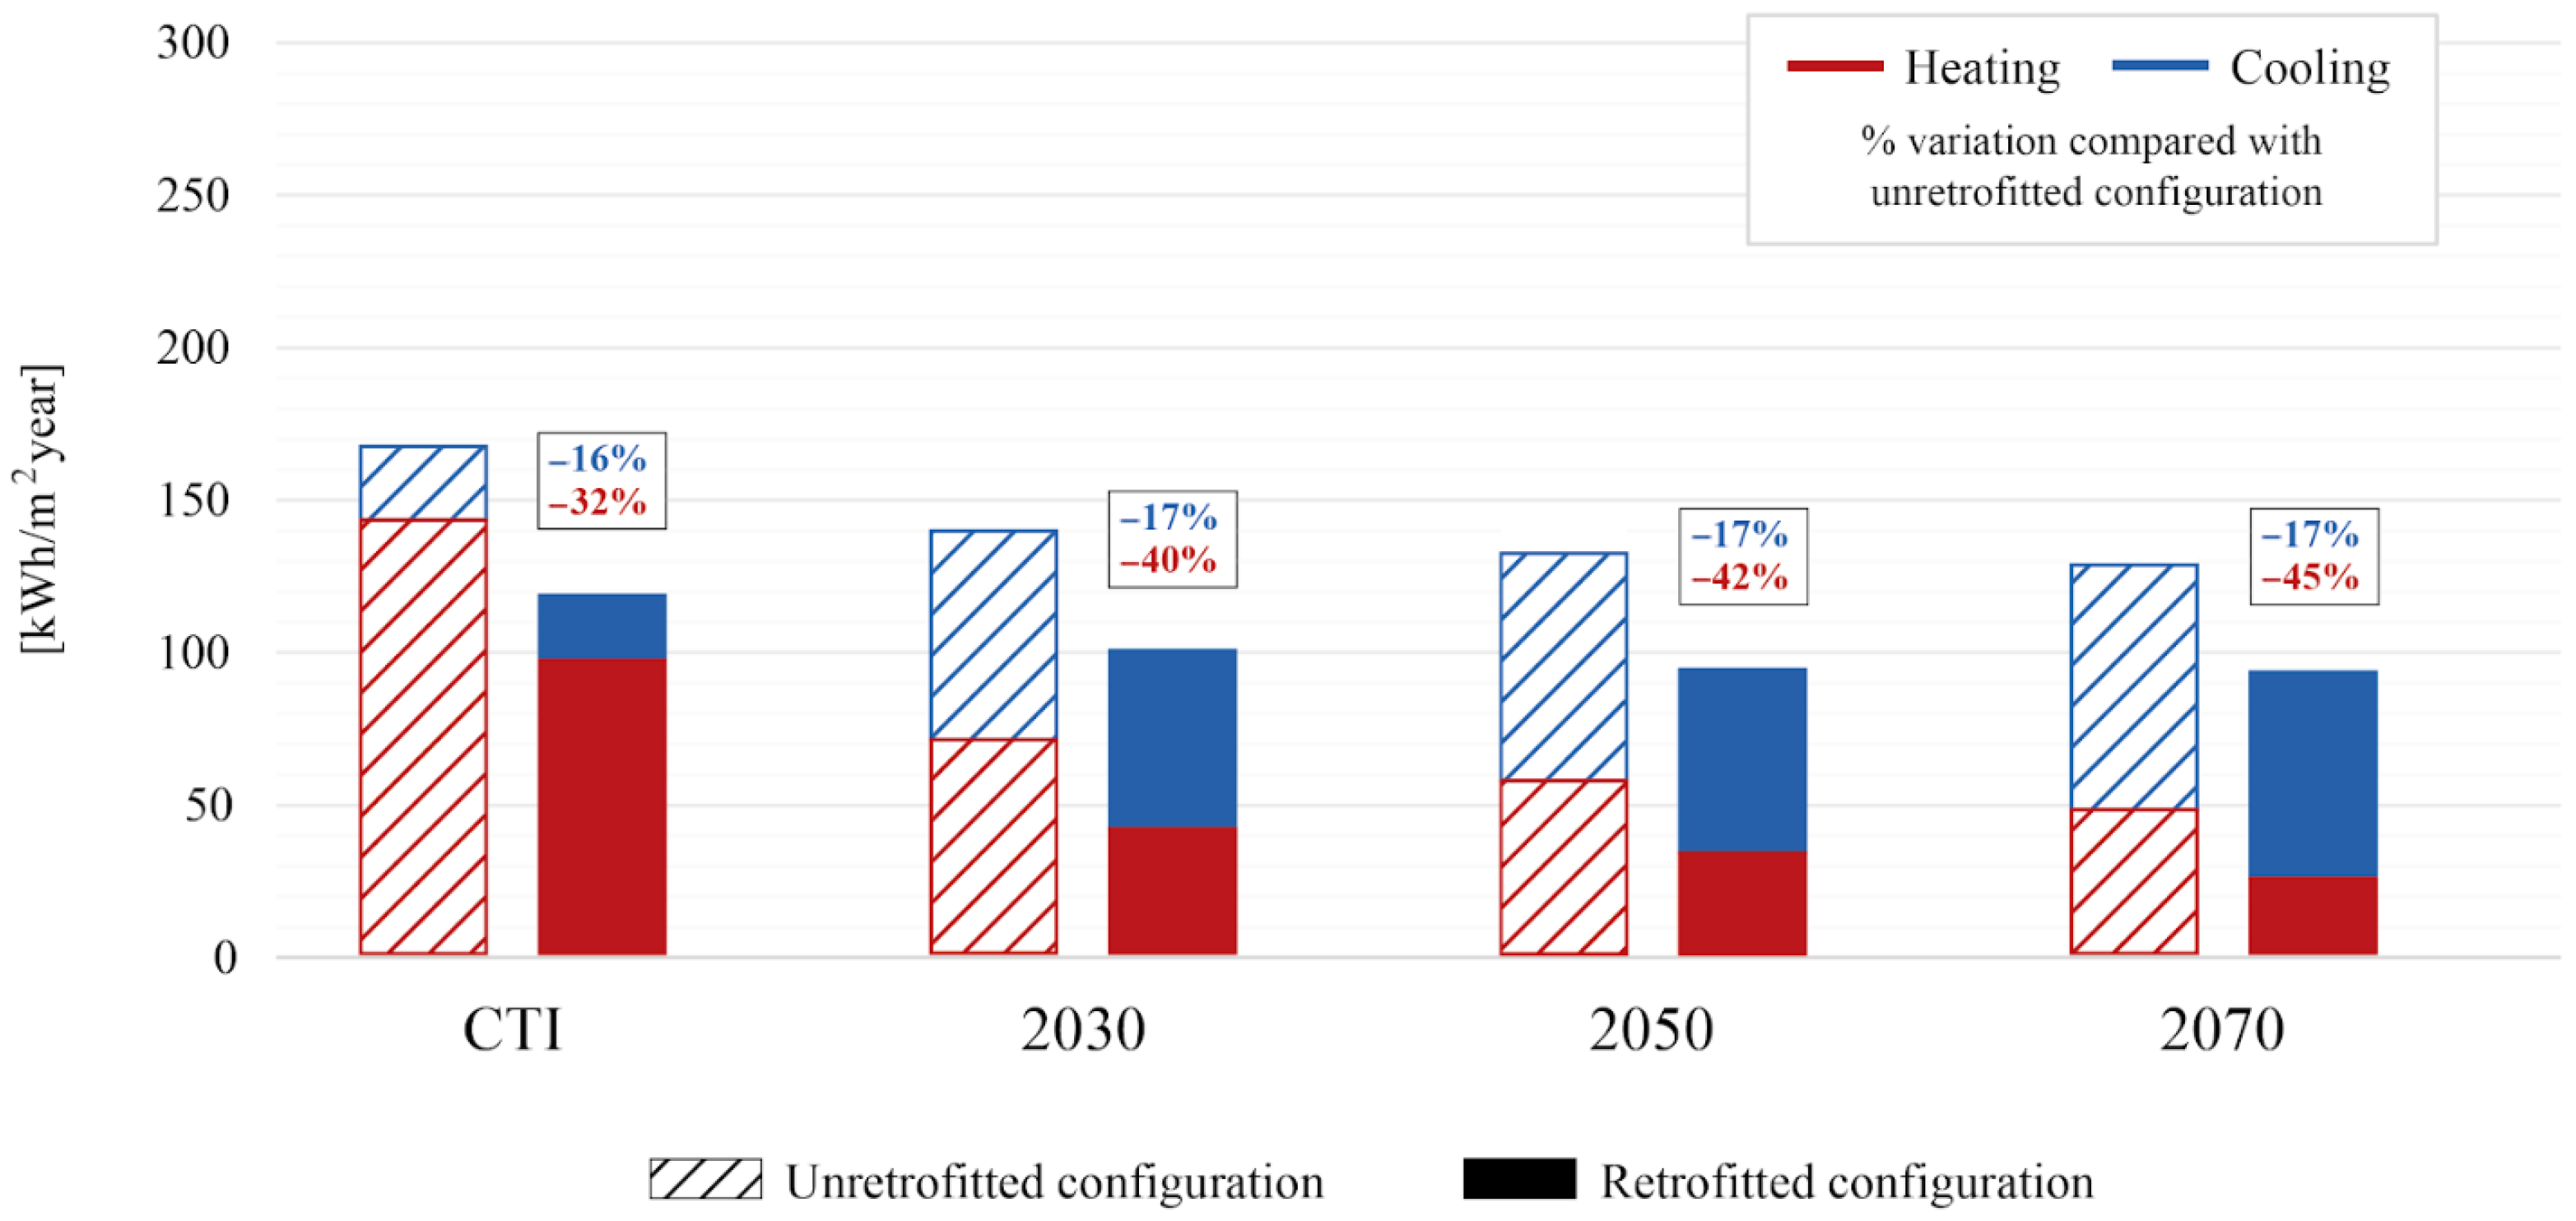
5.4. Dynamic Energy Simulations—Energy-Efficient Version

Figure 7, Figure 8 and Figure 9 illustrate the changes in estimated heating and cooling energy demand after implementing the proposed retrofit measures, under each climate scenario, for the three case studies. Overall, the interventions resulted in consistent energy savings across all buildings and climatic conditions. Heating demand was reduced by up to 46% in Case Study 1, 10% in Case Study 2, and 45% in Case Study 3. While cooling need reductions were less pronounced, they remained significant, reaching 31%, 12%, and 17%, respectively. These improvements led to total energy savings of up to 44% in Case Study 1, 9% in Case Study 2, and 29% in Case Study 3. The benefits resulting from envelope retrofitting were consistent with trends identified in other studies conducted in contexts also characterised by a Mediterranean climate. In particular, they reflected the tendency for a greater reduction in heating-related energy consumption compared to cooling, with reported decreases of up to 78% and 55%, respectively [77,83,84,85,86].
The obtained results point to several important conclusions. The masonry buildings achieved the greatest overall savings, indicating that the retrofit strategies offer a strong balance between cost and performance improvement in such contexts. In contrast, the relatively modest 10% reduction in the reinforced concrete building suggests limited cost-effectiveness for certain measures—such as window replacement and external insulation—when applied to already efficient structures. This outcome is largely attributable to the construction period and initial performance level of the reinforced concrete building, completed in 2000—a time when energy efficiency had already become a recognised priority in European and national policy. As detailed in Table 3, the building envelope already incorporates cork insulation in the external walls. Furthermore, a high-efficiency condensing boiler and underfloor heating system contribute to its solid baseline performance, leaving less room for improvement through retrofitting. The same cannot be said for the two masonry buildings, both located in a historic city centre and dating to the early 20th century—well before the introduction of energy efficiency standards. As indicated in Table 1 and Table 4, their envelopes are thermally poor, with U-values far exceeding current limits. Neither includes insulation, and their mechanical systems are significantly less efficient than those of the reinforced concrete building. These characteristics explain the substantial energy savings achieved through retrofitting.
Construction differences among the three buildings also shed light on another key observation. Before retrofitting (Figure 6), all case studies showed increasing cooling demand under future climate scenarios. However, this increment was consistently greater in the reinforced concrete building compared to the two masonry structures. This discrepancy likely reflected shifts in construction practices over time. Modern methods often use lightweight, insulated materials that improve winter performance while minimising wall thickness. However, these materials tend to lower the building’s thermal inertia, thereby diminishing its capacity to buffer and delay heat transfer during summer conditions. This reduction in thermal inertia is evident in the lower internal areal heat capacity, which limits the building elements’ ability to absorb and release heat in response to indoor thermal fluctuations. Such behaviour was observed in Case Study 2, which showed a significantly lower value of this parameter compared to the higher values found in masonry buildings, indicating a reduced ability to moderate internal temperatures during periods of heat stress.

6. Conclusions

This study provided an integrated approach for evaluating the energy performance and climate change vulnerability of existing residential buildings with a focus on three representative case studies located in a small municipality in Central Italy. By combining detailed dynamic energy simulations with high-resolution climatic datasets for current and future scenarios, the analysis offered a nuanced understanding of how different building typologies respond to projected climate conditions. The dual-level methodological framework developed in this study, validated through EPCs, proved effective in capturing both energy usage trends and retrofit potential across diverse construction types.
The key findings reveal consistent patterns across all three buildings, with heating demand projected to decrease and cooling need to increase under future climate scenarios. However, the degree of variation differs notably by building typology. The reinforced concrete structure, despite its relatively recent construction and higher baseline efficiency, exhibited the highest sensitivity to rising temperatures, especially in terms of cooling demand. This was likely due to its reduced thermal inertia, a byproduct of modern construction practices. Conversely, the masonry buildings showed greater overall energy savings after retrofit interventions, largely due to their thermally poor envelopes and inefficient systems, which provided substantial opportunities for improvement.
Retrofitting measures, particularly those aimed at reducing heating loads, proved effective across all scenarios, though their cost-effectiveness varies significantly by building type. The masonry structures achieved up to 44% total energy savings while the reinforced concrete building saw limited gains, underscoring the importance of tailoring intervention strategies to each building’s characteristics and existing performance level.
Beyond the specific findings of the case studies, this research aimed to contribute to the development of a scalable and multi-level methodology for assessing energy performance and climate vulnerability. By integrating detailed building-level analyses with broader planning efforts, the study enhanced its relevance for national and regional initiatives such as the GENESIS project, which seeks to promote the coexistence of long-term climate adaptation goals and the preservation of cultural heritage.
In this context and building on the outcomes of the research, several promising directions emerge for future work. First, the proposed methodological framework could be expanded to include a larger and more diverse sample of buildings within the municipality of Popoli and in other similar urban contexts. This would support a broader assessment of energy vulnerability and help guide retrofit strategies on a more comprehensive territorial scale. Integrating socioeconomic parameters—such as investment costs, payback periods, and occupant affordability—would further refine the approach, allowing for a more balanced evaluation of the energy, environmental, and economic impacts of retrofitting interventions. As the methodology is scaled up to larger building samples across multiple municipalities and climatic zones, regression analyses and statistical tests will be implemented to establish robust correlations between climatic variables, building typologies, and energy performance variations. This statistical framework will enable the quantification of retrofit effectiveness through confidence intervals, significance testing, and variance analysis, providing a more rigorous foundation for evidence-based policy recommendations and intervention prioritisation strategies. Applying the methodology in different climatic zones would also enhance its generalisability and offer insight into regional-specific vulnerabilities and adaptation strategies. In addition, future studies could benefit from incorporating dynamic user behaviour and occupancy profiles into the energy modelling process, which would improve the precision of the simulations, particularly for buildings with variable usage patterns. Finally, the development of GIS-based planning tools informed by this approach could provide valuable instruments for municipalities, enabling the spatial visualisation of building-level energy performance and vulnerability and supporting targeted policy-making at the urban and regional levels.

Author Contributions

Conceptualisation, C.L., V.D. and S.D.L.; methodology, C.L. and S.D.L.; software, V.D.; validation, S.M.; formal analysis, C.L., V.D. and S.D.L.; investigation, C.L., V.D. and S.D.L.; resources, C.L. and V.D.; data curation, C.L., V.D. and S.D.L.; writing—original draft preparation, C.L., V.D. and S.D.L.; visualisation, C.L., V.D. and S.D.L.; supervision, S.M.; project administration, S.M.; funding acquisition, S.M. All authors have read and agreed to the published version of the manuscript.

Funding

The study presented in this article was funded by the Project GENESIS: seismic risk manaGEmeNt for the touristic valorisation of thE hiStorIcal centers of Southern Italy. PON MIUR \u201CResearch and Innovation\u201D 2014\u20132020 and FSC. D.D. 13 July 2017 n. 1735. Industrial research and experimental development projects in the 12 Smart Specialization areas. Specialization area: Cultural Heritage. Project Code ARS01_00883. The opinions and conclusions presented by the authors do not necessarily reflect those of the funding agency.

Institutional Review Board Statement

Not applicable.

Informed Consent Statement

Not applicable.

Data Availability Statement

The original contributions presented in this study are included in the article. Further inquiries can be directed to the corresponding author.

Acknowledgments

The authors would like to express their sincere gratitude to the Municipality of Popoli, as well as to architects Matteo Acerbo and Leontina Vannini, for their valuable support and collaboration.

Conflicts of Interest

The authors declare no conflicts of interest.

Abbreviations

The following abbreviations are used in this manuscript:
IPCCIntergovernmental Panel on Climate Change
EPBDEnergy Performance of Buildings Directive
TMYTypical Meteorological Year
EPCEnergy Performance Certificate
ENEAAgenzia Nazionale per le Nuove Tecnologie, l’Energia e lo Sviluppo Economico Sostenibile
RCMRegional Climate Model
GISGeographic Information Systems
BIMBuilding Information Modelling
IWECInternational Weather for Energy Calculations
CTIItalian Thermotechnical Committee
CORDEXCoordinated Regional Climate Downscaling Experiment
HVACHeating, Ventilation, and Air Conditioning System
DHWDomestic Hot Water System
λThermal Conductivity [W/mK]
UThermal Transmittance [W/m2K]
CNRMCentre National de Recherches Météorologiques
RCPRepresentative Concentration Pathway

References

  1. IPCC. Summary for Policymakers: Synthesis Report. In Climate Change 2023: Synthesis Report. Contribution of Working Groups I, II and III to the Sixth Assessment Report of the Intergovernmental Panel on Climate Change; IPCC: Geneva, Switzerland, 2023; pp. 1–34. [Google Scholar]
  2. Consiglio dell’Unione Europea. Pronti per il 55%: Per Edifici più Verdi nell’UE [Internet]. Available online: https://www.consilium.europa.eu/it/infographics/fit-for-55-making-buildings-in-the-eu-greener/#0 (accessed on 10 May 2025).
  3. Lops, C.; Serpilli, F.; D’Alessandro, V.; Montelpare, S. Climate Change and Building Renovation: The Impact of Historical, Current, and Future Climatic Files on a School in Central Italy. Appl. Sci. 2024, 14, 9067. [Google Scholar] [CrossRef]
  4. European Union. Reducing Carbon Emissions: EU Objectives and Policies [Internet]. 2018. Available online: https://www.europarl.europa.eu/topics/it/article/20180305STO99003/ridurre-le-emissioni-di-anidride-carbonica-obiettivi-e-azioni-dell-ue#obiettivi-dellue-in-materia-di-cambiamenti-climatici-e-green-deal-europeo-3 (accessed on 10 May 2025).
  5. EU. Directive (EU) 2024/1275 of the European Parliament and of the Council of 24 April 2024 on the Energy Performance of Buildings (Recast) (Text with EEA Relevance). Available online: https://eur-lex.europa.eu/eli/dir/2024/1275/oj/eng (accessed on 10 May 2025).
  6. Beccali, M.; Cellura, M.; Fontana, M.; Longo, S.; Mistretta, M. Energy retrofit of a single-family house: Life cycle net energy saving and environmental benefits. Renew. Sustain. Energy Rev. 2013, 27, 283–293. [Google Scholar] [CrossRef]
  7. Ferrari, S.; Beccali, M. Energy-environmental and cost assessment of a set of strategies for retrofitting a public building toward nearly zero-energy building target. Sustain. Cities Soc. 2017, 32, 226–234. [Google Scholar] [CrossRef]
  8. Battista, G.; de Lieto Vollaro, E.; Ocłoń, P.; de Lieto Vollaro, R. Retrofit Analysis of a Historical Building in an Architectural Constrained Area: A Case Study in Rome, Italy. Appl. Sci. 2022, 12, 12305. [Google Scholar] [CrossRef]
  9. Carletti, C.; Piselli, C.; Sciurpi, F. Are Design Strategies for High-Performance Buildings Really Effective? Results from One Year of Monitoring of Indoor Microclimate and Envelope Performance of a Newly Built nZEB House in Central Italy. Energies 2024, 17, 741. [Google Scholar] [CrossRef]
  10. Mancini, F.; Cecconi, M.; De Sanctis, F.; Beltotto, A. Energy Retrofit of a Historic Building Using Simplified Dynamic Energy Modeling. Energy Procedia 2016, 101, 1119–1126. [Google Scholar] [CrossRef]
  11. Gagliano, A.; Nocera, F.; Patania, F.; Detomaso, M.; Sapienza, V. Deploy energy-efficient technologies in the restoration of a traditional building in the historical center of Catania (Italy). Energy Procedia 2014, 62, 62–71. [Google Scholar] [CrossRef]
  12. Brunoro, S. Passive Envelope Measures for Improving Energy Efficiency in the Energy Retrofit of Buildings in Italy. Buildings 2024, 14, 2128. [Google Scholar] [CrossRef]
  13. Ciulla, G.; Galatioto, A.; Ricciu, R. Energy and economic analysis and feasibility of retrofit actions in Italian residential historical buildings. Energy Build. 2016, 128, 649–659. [Google Scholar] [CrossRef]
  14. Associazione Nazionale Centri Storico Artistici. CENTRI STORICI E FUTURO DEL PAESE—Indagine Nazionale Sulla Situazione dei Centri Storici; Associazione Nazionale Centri Storico Artistici: Gubbio, Italy, 2017; pp. 1–136. [Google Scholar]
  15. Cantagallo, C.; Cianchino, G.; Sangiorgio, V.; Masciotta, M.G.; Pierantozzi, M.; Lops, C.; Di Loreto, S.; Brando, G.; Spacone, E. GENESIS: A Web-Based Platform for Managing the Seismic Risk of Historic Centres of Southern Italy. In REHABEND 2024—Construction Pathology, Rehabilitation Technology and Heritage Management; University of Cantabria—Building Technology R&D Group: Santander, Spain, 2024; pp. 2522–2530. [Google Scholar]
  16. Cantagallo, C.; Cianchino, G.; Masciotta, M.G.; Palumbo, D.; Pepe, M.; Cangelmi, L.; Spacone, E. Documentation and rapid assessment of the health status of historic centers by the use of 360-degree videos and G.I.S. In Proceedings of the VIPERC2024: 3rd International Conference on Visual Pattern Extraction and Recognition for Cultural Heritage Understanding, Bari, Italy, 1 September 2024. Volume 3838. [Google Scholar]
  17. Cantagallo, C.; Sangiorgio, V. An IT Tool for Managing Seismic Risk and Energy Performance of the Building Stock in Southern Italy. In Proceedings of the 11th International Conference of Ar.Tec. (Scientific Society of Architectural Engineering), Palermo, Italy, 12–15 June 2024; pp. 103–114. [Google Scholar]
  18. Cianchino, G.; Cantagallo, C.; Masciotta, M.G.; Caroprese, L.; Pepe, M.; Brando, G.; Spacone, E. Multiscale Data Acquisition of Historic Centers: A Hierarchical Approach for Enhancing Urban Conservation and Planning. Prot. Hist. Constr. Lect. NOTES Civ. Eng. 2025, 2, 28–35. [Google Scholar]
  19. Buildings Performance Institute Europe (BPIE). State of the Building Stock-Briefing. 2012. Available online: https://www.bpie.eu/wp-content/uploads/2017/12/State-of-the-building-stock-briefing_Dic6.pdf (accessed on 10 May 2025).
  20. ENEA. La Consistenza del Parco Immobiliare Nazionale; ENEA: Rome, Italy, 2024. [Google Scholar]
  21. Mancini, F.; Lo Basso, G. How Climate Change Affects the Building Energy Consumptions Due to Cooling, Heating, and Electricity Demands of Italian Residential Sector. Energies 2020, 13, 410. [Google Scholar] [CrossRef]
  22. Dodoo, A.; Gustavsson, L.; Bonakdar, F. Effects of future climate change scenarios on overheating risk and primary energy use for Swedish residential buildings. Energy Procedia 2014, 61, 1179–1182. [Google Scholar] [CrossRef]
  23. Ciancio, V.; Salata, F.; Falasca, S.; Curci, G.; Golasi, I.; de Wilde, P. Energy demands of buildings in the framework of climate change: An investigation across Europe. Sustain. Cities Soc. 2020, 60, 102213. [Google Scholar] [CrossRef]
  24. Cellura, M.; Guarino, F.; Longo, S.; Tumminia, G. Climate change and the building sector: Modelling and energy implications to an office building in southern Europe. Energy Sustain. Dev. 2018, 45, 46–65. [Google Scholar] [CrossRef]
  25. ENEA. Rapporto Annuale Sull’efficienza Energetica [Internet]. 2024. Available online: https://www.efficienzaenergetica.enea.it/pubblicazioni/raee-rapporto-annuale-sull-efficienza-energetica/rapporto-annuale-sull-efficienza-energetica-2024.html (accessed on 13 May 2025).
  26. ENEA. DU per l’Efficienza E. In III—Rapporto Annuale Sulla Certificazione Energetica Degli Edifici; ENEA: Rome, Italy, 2024; pp. 1–284. Available online: https://www.efficienzaenergetica.enea.it/component/jdownloads/?task=download.send&id=671&Itemid=101 (accessed on 13 May 2025).
  27. DPR. DECRETO DEL PRESIDENTE DEL CONSIGLIO DEI MINISTRI—Predisposizione del Piano Nazionale per la Riqualificazione dei Piccoli Comuni. [Internet]. Available online: https://www.ancrel.it/include/vis_allegato.php?id=2712 (accessed on 13 May 2025).
  28. Ferrando, M.; Causone, F.; Hong, T.; Chen, Y. Urban Building Energy Modeling (UBEM) Tools: A State-of-the-Art Review of bottom-up physics-based approaches. Sustain. Cities Soc. 2020, 62, 102408. [Google Scholar] [CrossRef]
  29. He, Y.; Pan, J.; Debnath, R.; Bardhan, R.; Cullen, L.; Jenkins, M.G.; Mackie, E.; Hawker, G.; Parry, I. Energy Mapping of Existing Building Stock in Cambridge using Energy Performance Certificates and Thermal Infrared Imagery. Environ. Data Sci. 2024, 3, e44. [Google Scholar] [CrossRef]
  30. Filippín, C.; Flores Larsen, S.; Ricard, F. Improvement of energy performance metrics for the retrofit of the built environment. Adaptation to climate change and mitigation of energy poverty. Energy Build. 2018, 165, 399–415. [Google Scholar] [CrossRef]
  31. Mutani, G.; Todeschi, V. GIS-based urban energy modelling and energy efficiency scenarios using the energy performance certificate database. Energy Effic. 2021, 14, 47. [Google Scholar] [CrossRef]
  32. BPIE. Energy Performance Certificates Across the UE—A Mapping of National Approaches [Internet]. 2014. Available online: https://www.bpie.eu/publication/energy-performance-certificates-across-the-eu/ (accessed on 13 May 2025).
  33. Volt, J.; Zuhaib, S.; Schmatzberger, S.; Toth, Z. Energy Performance Certificates: Assessing Their Status and Potential. Proj eXTENDing Energy Perform Assess Certif Schemes via a Modul Approach [Internet]; (Grant Agreement No. 847056):52. 2020. Available online: https://www.bpie.eu/wp-content/uploads/2020/06/X-TENDO-REPORT_FINAL_200519_pages.pdf (accessed on 13 May 2025).
  34. ESREI. Energy Performance Certificates—Limits and Outlooks of a European Tool [Internet]. 2023. Available online: https://o-immobilierdurable.fr/energy-performance-certificates-limits-and-outlook-of-a-european-tool/ (accessed on 13 May 2025).
  35. Ruggieri, G.; Maduta, C.; Melica, G. Progress on the Implementation of Energy Performance Certificates in EU [Internet]. Eur 31730 En. 2023. Available online: https://publications.jrc.ec.europa.eu/repository/handle/JRC135473 (accessed on 13 May 2025).
  36. Lops, C.; Di Loreto, S.; Pierantozzi, M.; Montelpare, S. Double-Skin Façades for Building Retrofitting and Climate Change: A Case Study in Central Italy. Appl. Sci. 2023, 13, 7629. [Google Scholar] [CrossRef]
  37. Serpilli, F.; Lops, C.; Pierantozzi, M.; Montelpare, S. Energy Performance and Thermal Comfort Assessment of an Educational Building in Northern Italy: The Importance of Climatic Files in Energy Simulations. E3S Web Conf. 2024, 523, 04004. [Google Scholar] [CrossRef]
  38. Lupato, G.; Manzn, M. Italian TRYs: New Weather Data Impact on Building Energy Simulations. Energy Build. 2019, 185, 287–303. [Google Scholar] [CrossRef]
  39. Yuan, J.; Jiao, Z.; Xiao, X.; Emura, K.; Farnham, C. Impact of future climate change on energy consumption in residential buildings: A case study for representative cities in Japan. Energy Rep. 2024, 11, 1675–1692. [Google Scholar] [CrossRef]
  40. Chen, L.; Zheng, Y.; Yu, J.; Peng, Y.; Li, R.; Han, S. A GIS-Based Approach for Urban Building Energy Modeling under Climate Change with High Spatial and Temporal Resolution. Energies 2024, 17, 4313. [Google Scholar] [CrossRef]
  41. Di Loreto, S.; Sangiorgio, V.; Bagagli, M.; Montelpare, S. Multi-criteria approach for the energy and environmental impact evaluation in urban districts in the central Mediterranean area. Sustain. Cities Soc. 2025, 120, 106179. [Google Scholar] [CrossRef]
  42. Beltrán-Velamazán, C.; Monzón-Chavarrías, M.; López-Mesa, B. A new approach for national-scale Building Energy Models based on Energy Performance Certificates in European countries: The case of Spain. Heliyon 2024, 10, e25473. [Google Scholar] [CrossRef] [PubMed]
  43. Bjelland, D.; Brozovsky, J.; Hrynyszyn, B.D. Systematic review: Upscaling energy retrofitting to the multi-building level. Renew. Sustain. Energy Rev. 2024, 198, 114402. [Google Scholar] [CrossRef]
  44. Fernandes, J.B.; Ferrão, P.C.; Silvestre, J.D.; Costa, A.A.; Göswein, V. Advancing Circular Economy in the Existing Building Stock: A Methodology to Support Building Characterisation for Sustainable Refurbishment Design. Acta Polytech. CTU Proc. 2022, 38, 599–605. [Google Scholar] [CrossRef]
  45. AlJaber, A.; Alasmari, E.; Martinez-Vazquez, P.; Baniotopoulos, C. Life Cycle Cost in Circular Economy of Buildings by Applying Building Information Modeling (BIM): A State of the Art. Buildings 2023, 13, 1858. [Google Scholar] [CrossRef]
  46. Copeland, S.; Bilec, M. Buildings as material banks using RFID and building information modeling in a circular economy. Procedia CIRP 2020, 90, 143–147. [Google Scholar] [CrossRef]
  47. Ma, L.; Ghorbani, Y.; Kongar-Syuryun, C.B.; Khayrutdinov, M.M.; Klyuev, R.V.; Petenko, A.; Brigida, V. Dynamics of backfill compressive strength obtained from enrichment tails for the circular waste management. Resour. Conserv. Recycl. Adv. 2024, 23, 200224. [Google Scholar] [CrossRef]
  48. Amudjie, J.; Chan, A.P.C.; Darko, A.; Debrah, C.; Agyekum, K. CircularBIM: Future needs at the convergence of building information modelling and the circular economy. Autom. Constr. 2025, 176, 106250. [Google Scholar] [CrossRef]
  49. Cinquepalmi, F.; Paris, S.; Pennacchia, E.; Tiburcio, V.A. Efficiency and Sustainability: The Role of Digitization in Re-Inhabiting the Existing Building Stock. Energies 2023, 16, 3613. [Google Scholar] [CrossRef]
  50. Honic, M.; Ferschin, P.; Breitfuss, D.; Cencic, O.; Gourlis, G.; Kovacic, I.; De Wolf, C. Framework for the assessment of the existing building stock through BIM and GIS. Dev. Built Environ. 2023, 13, 100110. [Google Scholar] [CrossRef]
  51. Pomponi, F.; Moncaster, A. Circular economy for the built environment: A research framework. J. Clean. Prod. 2017, 143, 710–718. [Google Scholar] [CrossRef]
  52. Bragança, L.; Cvetkovska, M.; Askar, R.; Ungureanu, V. Creating a Roadmap Towards Circularity in the Built Environment; Springer: Cham, Switzerland, 2023; pp. 1–420. [Google Scholar]
  53. Dervishaj, A.; Fonsati, A.; Hernández Vargas, J.; Gudmundsson, K. Modelling Precast Concrete for a Circular Economy in the Built Environment. In Proceedings of the 41st Conference on Education and Research in Computer Aided Architectural Design in Europe (eCAADe 2023), Graz, Austria, 18–23 September 2023; Volume 2, pp. 177–186. [Google Scholar] [CrossRef]
  54. Chang, Y.T.; Sierra, E.M.; Hsieh, S.H. Combining BIM & GIS Information to Simulate Circularity of Building Stocks in a City—A Case Study of Taipei City. IOP Conf. Ser. Earth Environ. Sci. 2022, 1122, 012025. [Google Scholar] [CrossRef]
  55. Caldas, L.R.; Silva, M.V.; Silva, V.P.; Carvalho, M.T.M.; Filho, R.D.T. How Different Tools Contribute to Climate Change Mitigation in a Circular Building Environment?—A Systematic Literature Review. Sustainability 2022, 14, 3759. [Google Scholar] [CrossRef]
  56. Cheng, Q.; Tayeh, B.A.; Abu Aisheh, Y.I.; Alaloul, W.S.; Aldahdooh, Z.A. Leveraging BIM for Sustainable Construction: Benefits, Barriers, and Best Practices. Sustainability 2024, 16, 7654. [Google Scholar] [CrossRef]
  57. ANSI/ASHRAE. ASHRAE Guideline 14-2002 Measurement of Energy and Demand Savings; American Society of Heating, Refrigerating and Air-Conditioning Engineers: Atlanta, GA, USA, 2002; pp. 1–170. [Google Scholar]
  58. Ruiz, G.R.; Bandera, C.F. Validation of calibrated energy models: Common errors. Energies 2017, 10, 1587. [Google Scholar] [CrossRef]
  59. Zuhaib, S.; Hajdukiewicz, M.; Goggins, J. Application of a staged automated calibration methodology to a partially-retrofitted university building energy model. J. Build. Eng. 2019, 26, 100866. [Google Scholar] [CrossRef]
  60. Charles, A.; Maref, W.; Ouellet-Plamondon, C.M. Case study of the upgrade of an existing office building for low energy consumption and low carbon emissions. Energy Build. 2019, 183, 151–160. [Google Scholar] [CrossRef]
  61. Çomakli, K.; Yüksel, B. Optimum insulation thickness of external walls for energy saving. Appl. Therm. Eng. 2003, 23, 473–479. [Google Scholar] [CrossRef]
  62. Saikia, P.; Pancholi, M.; Sood, D.; Rakshit, D. Dynamic optimization of multi-retrofit building envelope for enhanced energy performance with a case study in hot Indian climate. Energy 2020, 197, 117263. [Google Scholar] [CrossRef]
  63. Surendran, V.M.; Irulappan, C.; Jeyasingh, V.; Ramalingam, V. Thermal Performance Assessment of Envelope Retrofits for Existing School Buildings in a Hot–Humid Climate: A Case Study in Chennai, India. Buildings 2023, 13, 1103. [Google Scholar] [CrossRef]
  64. Azam, U.; Farooq, M.; Munir, M.A.; Riaz, F.; Sultan, M.; Rehman, A.U.; Imran, M. Modelling Framework for Reducing Energy Loads to Achieve Net-Zero Energy Building in Semi-Arid Climate: A Case Study. Buildings 2023, 13, 2695. [Google Scholar] [CrossRef]
  65. Kharseh, M.; Al-Khawaja, M.; Hassani, F. Comparison between different measures to reduce cooling requirements of residential building in cooling-dominated environment. Energy Build. 2015, 88, 409–412. [Google Scholar] [CrossRef]
  66. Peel, M.C.; Finlayson, B.L.; McMahon, T.A. Updated World Map of the Köppen-Geiger Climate Classification. Hydrol. Earth Syst. Sci. 2007, 11, 1633–1644. [Google Scholar] [CrossRef]
  67. Decreto del Presidente della Repubblica 26 Agosto 1993, n. 412_Regolamento Recante Norme per la Progettazione, l’installazione, l’esercizio e la Manutenzione degli Impianti Termici degli Edifici ai Fini del Contenimento dei Consumi di Energia, in Attuazione dell’art. 4, Comma 4, della Legge 9 Gennaio 1991, n. 10. Available online: https://www.normattiva.it/uri-res/N2Ls?urn:nir:presidente.repubblica:decreto:1993-08-26;412 (accessed on 15 May 2025).
  68. TABULA WebTool [Internet]. Available online: http://webtool.building-typology.eu (accessed on 20 April 2025).
  69. BRE 6 IP 1/06; Assessing the Effects of Thermal Bridging at Junctions and Around Openings in the External Elements of Buildings. BRE: Watford, UK, 2006.
  70. Decreto Interministeriale 26 Giugno 2015—Applicazione delle Metodologie di Calcolo delle Prestazioni Energetiche e Definizione delle Prescrizioni e dei Requisiti Minimi Degli Edifice. 2015. Available online: https://www.mimit.gov.it/index.php/it/normativa/decreti-interministeriali/decreto-interministeriale-26-giugno-2015-adeguamento-linee-guida-nazionali-per-la-certificazione-energetica-degli-edifici (accessed on 20 April 2025).
  71. American Society of Heating Refrigeration and Air Conditioning Engineers (ASHRAE). International Weather for Energy Calculations (IWEC Weather Files); ASHRAE: Atlanta, GA, USA, 2001. [Google Scholar]
  72. Murano, G.; Corrado, V.; Dirutigliano, D. The New Italian Climatic Data and their Effect in the Calculation of the Energy Performance of Buildings. Energy Procedia 2016, 101, 153–160. [Google Scholar] [CrossRef]
  73. Giorgi, F.; Jones, C.; Asrar, G. Addressing climate information needs at the regional level: The CORDEX framework. World Meteorol. Organ. Bull. 2019, 58, 175. [Google Scholar]
  74. Bubnovà, R. Integration of the Fully Elastic Equations Cast in the Hydrostatic Pressure Terrain-Following Coordinate in the Framework of the ARPAGE/Aladin NWP SYstem. Am. Meteorol. Soc. 1995, 123, 515–535. [Google Scholar]
  75. Tootkaboni, M.P.; Ballarini, I.; Corrado, V. Analysing the future energy performance of residential buildings in the most populated Italian climatic zone: A study of climate change impacts. Energy Rep. 2021, 7, 8548–8560. [Google Scholar] [CrossRef]
  76. D’Agostino, D.; Parker, D.; Epifani, I.; Crawley, D.; Lawrie, L. How will future climate impact the design and performance of nearly zero energy buildings (NZEBs)? Energy 2022, 240, 122479. [Google Scholar] [CrossRef]
  77. Tomrukcu, G.; Ashrafian, T. Climate-resilient building energy efficiency retrofit: Evaluating climate change impacts on residential buildings. Energy Build. 2024, 316, 114315. [Google Scholar] [CrossRef]
  78. Frank, T. Climate change impacts on building heating and cooling energy demand in Switzerland. Energy Build. 2005, 37, 1175–1185. [Google Scholar] [CrossRef]
  79. Jylhä, K.; Jokisalo, J.; Ruosteenoja, K.; Pilli-Sihvola, K.; Kalamees, T.; Seitola, T.; Mäkelä, H.M.; Hyvönen, R.; Laapas, M.; Drebs, A. Energy demand for the heating and cooling of residential houses in Finland in a changing climate. Energy Build. 2015, 99, 104–116. [Google Scholar] [CrossRef]
  80. Ayikoe Tettey, U.Y.; Gustavsson, L. Energy savings and overheating risk of deep energy renovation of a multi-storey residential building in a cold climate under climate change. Energy 2020, 202, 117578. [Google Scholar] [CrossRef]
  81. Huang, K.T.; Hwang, R.L. Future trends of residential building cooling energy and passive adaptation measures to counteract climate change: The case of Taiwan. Appl. Energy 2016, 184, 1230–1240. [Google Scholar] [CrossRef]
  82. Flores-Larsen, S.; Filippín, C.; Barea, G. Impact of climate change on energy use and bioclimatic design of residential buildings in the 21st century in Argentina. Energy Build. 2019, 184, 216–229. [Google Scholar] [CrossRef]
  83. D’Agostino, D.; Congedo, P.M.; Albanese, P.M.; Rubino, A.; Baglivo, C. Impact of climate change on the energy performance of building envelopes and implications on energy regulations across Europe. Energy 2024, 288, 129886. [Google Scholar] [CrossRef]
  84. De Masi, R.F.; Gigante, A.; Ruggiero, S.; Vanoli, G.P. Impact of weather data and climate change projections in the refurbishment design of residential buildings in cooling dominated climate. Appl. Energy 2021, 303, 117584. [Google Scholar] [CrossRef]
  85. Evangelisti, L.; Guattari, C.; Gori, P. Energy retrofit strategies for residential building envelopes: An Italian case study of an early-50s building. Sustain. 2015, 7, 10445–10460. [Google Scholar] [CrossRef]
  86. Carletti, C.; Cellai, G.; Piarangioli, L.; Riccomi, A.; Sciurpi, F. Simulation of the energy performance of building archetypes according to Italian regulations, with the identification of up-grading solutions based on cost-benefit analysis in relation to climate change. E3S Web Conf. 2024, 523, 01006. [Google Scholar] [CrossRef]
Figure 1. Flowchart of the methodology adopted in this research.
Sustainability 17 06485 g001
Figure 2. Localisation of Popoli and the selected case studies.
Sustainability 17 06485 g002
Figure 3. Main elevations and energy models of Case Study 1 (a), Case Study 2 (b), and Case Study 3 (c). The purple elements represent adjacent buildings, the green indicate the terrain, and the pink denote neighbouring buildings.
Sustainability 17 06485 g003
Figure 4. Representation of detailed modelling approach (a) and simplified modelling approach (b).
Sustainability 17 06485 g004
Figure 5. Model validation, achieved by comparing real and simulated energy consumption.
Sustainability 17 06485 g005
Figure 6. Cooling and heating consumption for the selected case studies (existing configuration) and climatic files.
Sustainability 17 06485 g006
Figure 7. Estimated variations in heating and cooling energy demand following the proposed retrofit measures for Case Study 1.
Sustainability 17 06485 g007
Figure 8. Estimated variations in heating and cooling energy demand following the proposed retrofit measures for Case Study 2.
Sustainability 17 06485 g008
Figure 9. Estimated variations in heating and cooling energy demand following the proposed retrofit measures for Case Study 3.
Sustainability 17 06485 g009
Table 1. Description of the building envelope components for Case Study 1, along with their thermal properties. For each layer, the thickness, thermal conductivity (λ), and thermal transmittance (U) are provided.
Sustainability 17 06485 i001Building Envelope Components (Exterior to Interior Progression)
External walls—0.50 m (U = 2.23 W/m2K): 0.02 m plaster (λ = 0.90 W/mK) + 0.46 m stone masonry (λ = 2.02 W/mK) + 0.02 m plaster (λ = 0.70 W/mK).
External walls—0.90 m (U = 1.55 W/m2K): 0.02 m plaster (λ = 0.90 W/mK) + 0.86 m stone masonry (λ = 2.02 W/mK) + 0.02 m plaster (λ = 0.70 W/mK).
External walls—0.70 m (U = 1.83 W/m2K): 0.02 m plaster (λ = 0.90 W/mK) + 0.66 m stone masonry (λ = 2.02 W/mK) + 0.02 m plaster (λ = 0.70 W/mK).
External walls—0.30 m (U = 2.86 W/m2K): 0.02 m plaster (λ = 0.90 W/mK) + 0.26 m stone masonry (λ = 2.02 W/mK) + 0.02 m plaster (λ = 0.70 W/mK).
Double glazed windows (U = 2.70 W/m2K): 0.006 m single clear glazing (λ = 0.90 W/mK) + 0.02 m air gap (λ = 0.03 W/mK) + 0.01 m single clear glazing (λ = 0.90 W/mK).
Ground floor slab (U = 1.41 W/m2K): 0.20 m coarse gravel without clay (λ = 1.20 W/mK) + 0.10 m lightweight concrete (λ = 0.33 W/mK) + 0.03 m cement mortar (λ = 1.40 W/mK) + 0.01 m stoneware flooring (λ = 1.47 W/mK).
Interfloor slabs (U = 0.61 W/m2K): 0.02 m plaster (λ = 0.90 W/mK) + 0.07 m clay block slab (λ = 0.25 W/mK) + 0.15 m lightweight concrete (λ = 0.15 W/mK) + 0.02 m cement mortar (λ = 1.40 W/mK) + 0.01 m stoneware flooring (λ = 1.47 W/mK).
Attic floor and flat roof slabs (U = 0.49 W/m2K): 0.02 m waterproofing membrane (λ = 0.23 W/mK) + 0.07 m cement mortar (λ = 1.40 W/mK) + 0.20 m lightweight concrete (λ = 0.15 W/mK) + 0.07 m clay block slab (λ = 0.25 W/mK) + 0.02 m plaster (λ = 0.90 W/mK).
External roof (U = 2.82 W/m2K): 0.015 m earthenware roofing tiles (λ = 1.00 W/mK) + 0.03 m wooden planking (λ = 0.15 W/mK).
Table 2. Description of the main parameters associated with each thermal zone in Case Study 1.
SpaceThermal Zone TypeOccupation
(People/m2)
Ground floorCommon circulation areas0.0196
First floorDomestic Circulation0.0155
Second floorDomestic Circulation0.0155
Third floorDomestic Circulation0.0155
Unoccupied atticSemi-external unconditioned area-
Table 3. Description of the building envelope components for Case Study 2, along with their thermal properties. For each layer, the thickness, thermal conductivity (λ), and thermal transmittance (U) are provided.
Sustainability 17 06485 i002Building Envelope Components (Exterior to Interior Progression)
0.34 m External walls (U = 0.45 W/m2K): 0.01 m plaster (λ = 0.90 W/mK) + 0.15 m hollow bricks (λ = 0.21 W/mK) + 0.01 m plaster (λ = 0.90 W/mK) + 0.04 m cork insulation (λ = 0.05 W/mK) + 0.02 air gap (λ = 0.30 W/mK) + 0.10 bricks (λ = 0.30 W/mK) + 0.01 m plaster (λ = 0.70 W/mK).
Double glazed windows (U = 3.00 W/m2K): 0.01 m single clear glazing (λ = 0.90 W/mK) + 0.01 m air gap (λ = 0.03 W/mK) + 0.01 m single clear glazing (λ = 0.90 W/mK).
Basement floor slab (U = 1.41 W/m2K): 0.20 m coarse gravel without clay (λ = 1.20 W/mK) + 0.10 m lightweight concrete (λ = 0.33 W/mK) + 0.03 m cement mortar (λ = 1.40 W/mK) + 0.01 m stoneware flooring (λ = 1.47 W/mK).
Ground floor and first floor slabs (U = 0.48 W/m2K): 0.02 m plaster (λ = 0.70 W/mK) + 0.24 m clay block slab (λ = 0.60 W/mK) + 0.05 m radiant floor heating system panel (λ = 0.04 W/mK) + 0.06 m self-leveling radiant floor screed (λ = 1.00 W/mK) + 0.01 m afrormosia parquet flooring (λ = 0.18 W/mK).
Attic floor slab (U = 1.63 W/m2K): 0.02 m plaster (λ = 0.90 W/mK) + 0.24 m clay block slab (λ = 0.90 W/mK) + 0.05 m standard screed (λ = 1.06 W/mK) + 0.01 m stoneware flooring (λ = 1.47 W/mK).
External roof (U = 0.56 W/m2K): 0.01 m earthenware roofing tiles (λ = 1.00 W/mK) + 0.04 m wooden planking (λ = 0.18 W/mK) + 0.01 m breathable membrane (λ = 0.23 W/mK) + 0.04 m wooden planking (λ = 0.18 W/mK) + 0.04 m cork insulation (λ = 0.05 W/mK) + 0.03 m lime-cement mortar (λ = 0.90 W/mK) + 0.24 m clay block slab (λ = 0.75 W/mK) + 0.02 m cement mortar (λ = 1.40 W/mK).
Table 4. Description of the building envelope components for Case Study 3, along with their thermal properties. For each layer, the thickness, thermal conductivity (λ), and thermal transmittance (U) are provided.
Sustainability 17 06485 i003Building Envelope Components (Exterior to Interior Progression)
1.00 m External walls (U = 0.64 W/m2K): 0.98 m solid clay bricks (λ = 0.72 W/mK) + 0.015 m plaster (λ = 0.70 W/mK).
0.95 m External walls (U = 0.67 W/m2K): 0.93 m solid clay bricks (λ = 0.72 W/mK) + 0.015 m plaster (λ = 0.70 W/mK).
0.55 m External walls (U = 1.07 W/m2K): 0.53 m solid clay bricks (λ = 0.72 W/mK) + 0.015 m plaster (λ = 0.70 W/mK).
0.40 m External walls (U = 1.38 W/m2K): 0.38 m solid clay bricks (λ = 0.72 W/mK) + 0.015 m plaster (λ = 0.70 W/mK).
0.60 m External walls (U = 0.99 W/m2K): 0.58 m solid clay bricks (λ = 0.72 W/mK) + 0.015 m plaster (λ = 0.70 W/mK).
0.30 m Partitions (U = 1.49 W/m2K): 0.02 m plaster (λ = 0.70 W/mK) + 0.26 m solid clay bricks (λ = 0.72 W/mK) + 0.02 m plaster (λ = 0.70 W/mK).
0.22 m Partitions (U = 1.78 W/m2K): 0.02 m plaster (λ = 0.70 W/mK) + 0.18 m solid clay bricks (λ = 0.72 W/mK) + 0.02 m plaster (λ = 0.70 W/mK).
0.10 m Partitions (U = 1.63 W/m2K): 0.02 m plaster (λ = 0.70 W/mK) + 0.08 m solid clay bricks (λ = 0.72 W/mK) + 0.02 m plaster (λ = 0.70 W/mK).
Single glazed windows (U = 4.83 W/m2K): 0.01 m single clear glazing (λ = 0.15 W/mK).
Second floor slab (U = 1.18 W/m2K): 0.01 m plaster (λ = 0.70 W/mK) + 0.06 m clay block slab (λ = 0.25 W/mK) + 0.09 m lightweight concrete (λ = 0.33 W/mK) + 0.05 m 2% reinforced concrete (λ = 2.50 W/mK) + 0.02 m cement mortar (λ = 1.40 W/mK) + 0.02 m stoneware flooring (λ = 1.47 W/mK).
Attic floor slab (U = 0.92 W/m2K): 0.03 m cement mortar (λ = 1.40 W/mK) + 0.09 m lightweight concrete (λ = 0.15 W/mK) + 0.06 m clay block slab (λ = 0.35 W/mK) + 0.02 m plaster (λ = 0.90 W/mK).
Table 5. Description of the main parameters associated with each thermal zone in Case Study 3.
SpaceThermal Zone TypeOccupation
(People/m2)
EntranceDomestic Lounge0.0188
KitchenDomestic Kitchen0.0237
BathroomDomestic Bathroom0.0187
Dining/Living RoomDomestic Dining Room0.0169
BedroomDomestic Bedroom0.0229
Table 6. Transmittance values referred to the existing and energy improved configurations.
Building ComponentsU-Values (W/m2K)
Unretrofitted Version
U-Values (W/m2K)
Retrofitted Version
Case study 1 0.50 m External walls2.230.31
0.90 m External walls1.550.29
0.70 m External walls1.830.30
0.30 m External walls2.860.32
Triple glazed windows2.701.73
Case study 2 0.34 m External walls0.450.30
Triple glazed windows31.73
Case study 3 1.00 m External walls0.640.25
0.95 m External walls0.670.26
0.55 m External walls1.070.30
0.40 m External walls1.380.32
0.60 m External walls0.990.29
Triple glazed windows4.831.76
Disclaimer/Publisher’s Note: The statements, opinions and data contained in all publications are solely those of the individual author(s) and contributor(s) and not of MDPI and/or the editor(s). MDPI and/or the editor(s) disclaim responsibility for any injury to people or property resulting from any ideas, methods, instructions or products referred to in the content.

