1. Introduction
Agricultural land plays a central role in achieving sustainable development goals related to food security, environmental stewardship, and rural resilience. As a finite and immobile resource, land must be allocated and governed in a way that balances economic efficiency with social and ecological considerations. In the European Union (EU), this balance is increasingly shaped by the Green Deal, the Farm to Fork Strategy, and the Common Agricultural Policy (CAP), all of which stress biodiversity protection, climate adaptation, and generational renewal. In this context, land markets are no longer viewed solely through the lens of productivity or ownership, but also as tools to promote long-term sustainability and spatial equity.
Poland’s land governance framework reflects a strong legal orientation toward farmland protection and family farming. Since the 2016 amendment of the Act on Shaping the Agricultural System, the state has imposed significant controls on land acquisition, introducing area limits, buyer eligibility criteria, and restrictions on land transfers. At the same time, the management of state-owned land through the Agricultural Property Stock of the State Treasury (WRSP) has shifted from open-market sales to long-term leasing. While these policies have reduced speculative pressures and preserved land for agricultural use, they may also constrain market fluidity and hinder young farmers’ access to land, especially in regions facing demographic decline and farm fragmentation.
The literature increasingly emphasizes the importance of understanding spatial and institutional dimensions of land price formation. Yet empirical research linking regional economic conditions, environmental variables, and policy instruments to actual land price dynamics remains limited, particularly in post-transition economies such as Poland. Furthermore, few studies integrate econometric modeling with spatial analysis to assess how land values are influenced by neighboring regions or reflect broader structural change. As land continues to serve both as a productive asset and a vehicle for policy implementation, a deeper understanding of these dynamics is essential.
This paper addresses these gaps by analyzing land market trends in Poland from 2009 to 2023 using robust fixed effects and spatial panel models. It investigates the influence of macroeconomic development, agricultural intensity, land quality, and spatial spillovers on agricultural land prices. In parallel, it evaluates public land management practices—particularly the leasing and sale of WRSP land—and the growing role of non-market transfers such as donations and inheritances. The results are interpreted in light of EU policy goals and sustainability theory, with a focus on identifying structural constraints and proposing targeted reforms for inclusive and climate-resilient land governance.
2. Materials and Methods
This empirical element of the paper is based on a comprehensive analysis of empirical data characterizing the agricultural land market in Poland between 2009 and 2023. The primary objective is to identify and quantify the economic and demographic factors influencing land prices with a particular focus on the impact of institutional reforms, farm structure, and macroeconomic conditions. The methodology was designed to ensure the economic validity of the research in line with the discipline’s standards and the scope of sustainable development, and current Eurostat data (2024) from countries like the Netherlands and Malta illustrate how urban sprawl and amenity-based demand contribute to exceptional land price levels.
The demographic composition of the rural population and structural characteristics of landholding patterns significantly influence land prices. Aging farming populations, generational turnover, and land fragmentation are particularly salient in Eastern Europe, where evolving land market institutions and capital inflows have contributed to price convergence with Western European levels—Sustainability (2024). In contrast, regions with stagnating populations or weak demand—such as parts of rural Romania or Appalachia in the US—tend to exhibit subdued price growth and sluggish land market activity.
Macroeconomic variables, including interest rates, inflation, and commodity price trends, exert a growing influence on land prices, particularly as farmland is increasingly viewed as a financial asset. Recent data from the USDA ERS (2024) and Iowa State University (2024) indicate that in the US, low interest rates and strong yields have driven land value appreciation in high-productivity regions. However, rising interest rates and declining commodity prices are beginning to temper this growth, pointing to the sensitivity of land markets to broader economic conditions.
Significant regional variation persists within and between the EU and the US. In 2022, the average price of one hectare of arable land in the EU was €10,578, with national averages ranging from €3700 in Croatia to over €230,000 in Malta, Eurostat data (2024). While land markets in Western Europe are relatively mature, Eastern European regions are experiencing accelerated price growth due to institutional reforms and foreign investment, contributing to a convergence in land values—Sustainability (2024). Similarly, in the US, the Corn Belt continues to lead in terms of land value due to persistent yield advantages and strong market demand—USDA ERS (2024).
The determinants of agricultural land prices span natural productivity, infrastructure, policy frameworks, and macroeconomic environments. While universal factors such as soil quality and market proximity exert consistent influence, regional divergences remain pronounced due to differing policy impacts, demographic conditions, and levels of market maturity. As land markets become increasingly integrated into broader economic and investment systems, understanding the nuanced interactions among these factors is essential for designing equitable and efficient land policies.
2.1. Methodological Approach and Research Strategy
The research will employ a quantitative panel data approach to analyze the determinants of agricultural land prices across Polish NUTS 2 regions (voivodeships) over time. This strategy allows for the exploration of both cross-sectional and temporal variation, which is particularly relevant given Poland’s post-accession dynamics and ongoing structural transformation in agriculture.
The model will incorporate key explanatory variables identified in the literature, including the following:
Natural factors, such as soil quality and land productivity;
Economic variables, such as proximity to urban centers, infrastructure density, and macroeconomic indicators;
Policy influences, particularly the capitalization of EU Common Agricultural Policy (CAP) subsidies;
Demographic and structural conditions, including farm fragmentation, generational change, and rural population dynamics;
Non-agricultural pressures, such as urbanization and land-use conversion potential.
Data sources will include the Central Statistical Office of Poland (GUS), the Agency for Restructuring and Modernisation of Agriculture (ARiMR), National Center for Agricultural Support (KOWR), Ministry of Agriculture and Rural Development, Institute of Agricultural and Food Economics (IERiGŻ-PIB), Eurostat, and regional land transaction records.
Spatial econometric techniques may be employed to account for spatial dependence on land prices, given that land markets often exhibit regional spillover effects. Temporal fixed effects will help control for macroeconomic shocks and policy shifts over the period studied.
The aim of this study is to identify and quantify the regional determinants of agricultural land prices in Poland, with a particular focus on the roles of agroecological potential, market accessibility, policy support, demographic shifts, and urban development pressures. The study seeks to assess the extent to which these factors vary across regions and over time, and to what degree they mirror broader European trends in land market convergence.
The empirical analysis of the determinants of agricultural land prices in Poland was conducted using panel econometric methods, with particular attention to the potential spatial dependence across regions. The modeling strategy followed a structured sequence to ensure robustness and to appropriately test for the presence and nature of spatial effects. The choice of panel data models was driven by the objective to control for unobserved heterogeneity across regions and over time. Fixed effects and random effects specifications were compared using the Hausman test to ensure model consistency and efficiency. For spatial analysis, spatial lag (SAR), spatial error (SEM), and spatial Durbin models (SDM) were estimated to capture potential spatial dependence in land price determinants. The spatial weighting matrix was constructed using a contiguity-based criterion (first-order Queen contiguity), which reflects geographic adjacency among voivodeships and aligns with known regional interactions in agricultural land markets. Robustness of spatial model selection was evaluated using Lagrange Multiplier diagnostics and log-likelihood comparison, while the SDM was tested for potential simplification to SAR or SEM using Wald and LR tests.
2.1.1. Model Specification
The analysis began with the estimation of a conventional panel data regression model that excluded spatial components. This baseline specification incorporated region-fixed effects to control for unobserved heterogeneity across voivodeships and time-fixed effects to account for macroeconomic shocks and policy changes. The model (FE) took the following form:
where
Pit denoted the agricultural land price in region
i at time
t,
Xit represented a vector of explanatory variables (such as soil quality, subsidies, and infrastructure),
α (alpha) and
δ (delta) captured region- and time-specific effects, respectively, and
ε (epsilon) is the error term. This model served as a benchmark to identify the primary non-spatial determinants and assess the model’s basic performance.
Following the estimation of the non-spatial model, the residuals were examined for spatial dependence using Local Moran’s I statistic—Anselin (1988) [
1]. Local Moran’s I is a spatial autocorrelation measure that identifies clusters and spatial outliers by comparing the value of a variable at a location with its neighbors. The formula for Local Moran’s I is as follows:
where
Ii represents the local autocorrelation at location
i,
xi is the value at that location,
is the mean, and
wij are the spatial weights. Clusters of similar values increase global spatial autocorrelation, while spatial outliers reduce it.
A statistically significant value of Moran’s I indicated that the residuals exhibited spatial autocorrelation, suggesting that land prices in one region were influenced by those in neighboring regions. This result violated the assumption of independent disturbances, thereby justifying the application of spatial econometric techniques.
2.1.2. Spatial Panel Model Specification
Once spatial dependence was confirmed, the analysis proceeded with the estimation of spatial panel regression models, which extended the standard framework to account for spatial interdependencies. Three primary spatial specifications were considered:
- I.
Spatial Autoregressive Model (SAR)
The SAR model included a spatial lag of the dependent variable:
where
W was the spatial weights matrix and
ρ (rho) was the spatial autoregressive coefficient. This model was used to capture direct spatial spillovers in land prices, reflecting the possibility that pricing behavior in one region influenced neighboring regions.
- II.
Spatial Error Model (SEM)
The SEM accounted for spatial autocorrelation in the error term,
uit:
This specification assumed that unobserved factors affecting land prices were spatially correlated—an appropriate model where omitted regional influences or institutional characteristics were likely to exhibit spatial clustering.
- III.
Spatial Durbin Model (SDM)
The SDM incorporated spatial lags of both the dependent and independent variables:
This more general model was employed to test whether both land prices and their determinants exhibited spatial interdependence. Given its flexibility, the SDM served as the starting point for model comparison and simplification. LeSage & Pace (2009) [
2].
2.2. Model Selection and Estimation Strategy
Model selection was guided by formal statistical tests, including Wald and Likelihood Ratio tests, to assess whether the SDM could be simplified to SAR or SEM forms. In addition, the Hausman test was used to determine whether fixed or random effects were more appropriate, with fixed effects being preferred due to their robustness in controlling for unobserved heterogeneity, which is especially important in policy-focused research.
The spatial weights matrix W was constructed using the k-nearest neighbor criterion, which defines each region’s neighbors based on geographic proximity to its k-nearest counterparts. As a robustness check, first-order queen contiguity and inverse distance matrices were also applied to verify the sensitivity of results to alternative spatial relationship specifications.
Models were estimated using maximum likelihood (ML) or generalized method of moments (GMM), depending on the structure of the spatial process and the presence of potential endogeneity in the regressors—Elhorst (2014) [
3]. All statistical analyses were performed using R (version 4.3.1) with spatial econometric packages (e.g., spdep, splm). Descriptive statistics and diagnostics were computed using standard libraries in R.
The selection of explanatory variables was guided by a multidimensional conceptual framework grounded in land economics theory and empirical findings from the literature on agricultural land markets. The goal was to capture both demand- and supply-side influences on land prices, with consideration for structural, economic, environmental, demographic, and policy-related determinants. The dependent variable in the analysis was the average transaction price of agricultural land (in thousands of PLN per hectare), observed annually across Poland’s 16 voivodeships between 2009 and 2023, based on data from the Ministry of Agriculture and Regional Development.
The explanatory variables were grouped into seven thematic categories, each representing a distinct mechanism influencing land values.
To capture the dynamics of land trading behavior, three indicators were included: the Agricultural Turnover Ratio (ATR), the Per Capita Land Turnover Value (LTV), and the Land Withdrawal Ratio (LWR). The ATR measured the frequency of agricultural land transactions relative to regional areas, while the LTV quantified the monetary value of land sales per rural inhabitant. These variables reflected the liquidity of the land market and the intensity of demand, with higher values expected to be associated with elevated land prices due to increased competition and speculative interest—Ciaian et al. (2010) [
4]. Finally, LWR was incorporated to capture the degree of agricultural land loss due to urbanization, degradation, or policy-induced transitions. The expected effect of this variable was ambiguous: while reduced land supply might drive up prices, land withdrawal could also reflect declining agricultural viability or environmental degradation.
Structural aspects of land use and farm organization were represented by the Average Farm Size (AFS) and the Agricultural Land Share (ALS). The former captured the degree of agricultural consolidation, with larger farms often indicating commercialized and capital-intensive agriculture. The latter reflected the proportion of land dedicated to farming, which served as a proxy for regional specialization and agrarian infrastructure. Both variables were anticipated to be positively associated with land prices due to scale economies and land use optimization—Kilian et al. (2012) [
5].
The regional economic environment was represented by GDP per Capita (GDP) and Gross Value Added in Agriculture (GVA). GDP per capita was used as an indicator of general economic development and purchasing power, likely influencing the attractiveness of land as an investment or development asset. Conversely, a high GVA share could suggest a reliance on traditional agricultural activity, which may dampen land price growth in the absence of diversification opportunities. Thus, while GDP was expected to have a positive effect, the expected direction of GVA was negative—Latruffe & Le Mouël (2009) [
6].
The Soil Quality Index (SQI) was included to represent land productivity and long-term agricultural potential. This index, calculated as a weighted average of arable land quality, served as a fundamental determinant of land value, as regions with more fertile soils typically yield higher returns and attract greater investment interest—Plantinga et al. (2002) [
7].
Demographic conditions were proxied by Population Density (PDN) and Net Migration (NMG). PDN captured the intensity of rural settlement and proximity to urban agglomerations, both of which may create upward pressure on land prices due to competing uses. NMG measured the regional net migration balance and served as an indicator of local economic and social attractiveness. Both variables were expected to be positively associated with land values, particularly in regions experiencing urban expansion or rural inflows.
Given the central role of EU agricultural subsidies in shaping land markets, two variables were included to measure policy influence: Direct Payments per Capita (DPC) and Direct Payment Applications (DPA). These reflected, respectively, the financial scale and institutional reach of the EU’s Common Agricultural Policy (CAP). Subsidies are often capitalized into land values, especially where markets are competitive and subsidies are perceived as stable revenue streams—Ciaian et al. (2010) [
4]; Latruffe & Le Mouël (2009) [
6].
2.3. Approach to Model Specification
The initial model included all variables listed above, as each contributed to a theoretically sound and empirically relevant framework. The inclusion of these indicators allowed for a comprehensive examination of the determinants of agricultural land prices across Poland’s regions during a period characterized by EU integration, structural transformation, and changing demographic and economic conditions.
The descriptive statistics of the selected variables—calculated across Poland’s 16 voivodeships for the years 2009 to 2023—revealed considerable spatial and temporal heterogeneity, consistent with the structural diversity and evolving dynamics of the Polish agricultural land market (
Table 1 and
Table 2). The variation observed across indicators supported the suitability of panel data techniques and justified the subsequent exploration of spatial effects in the regression framework.
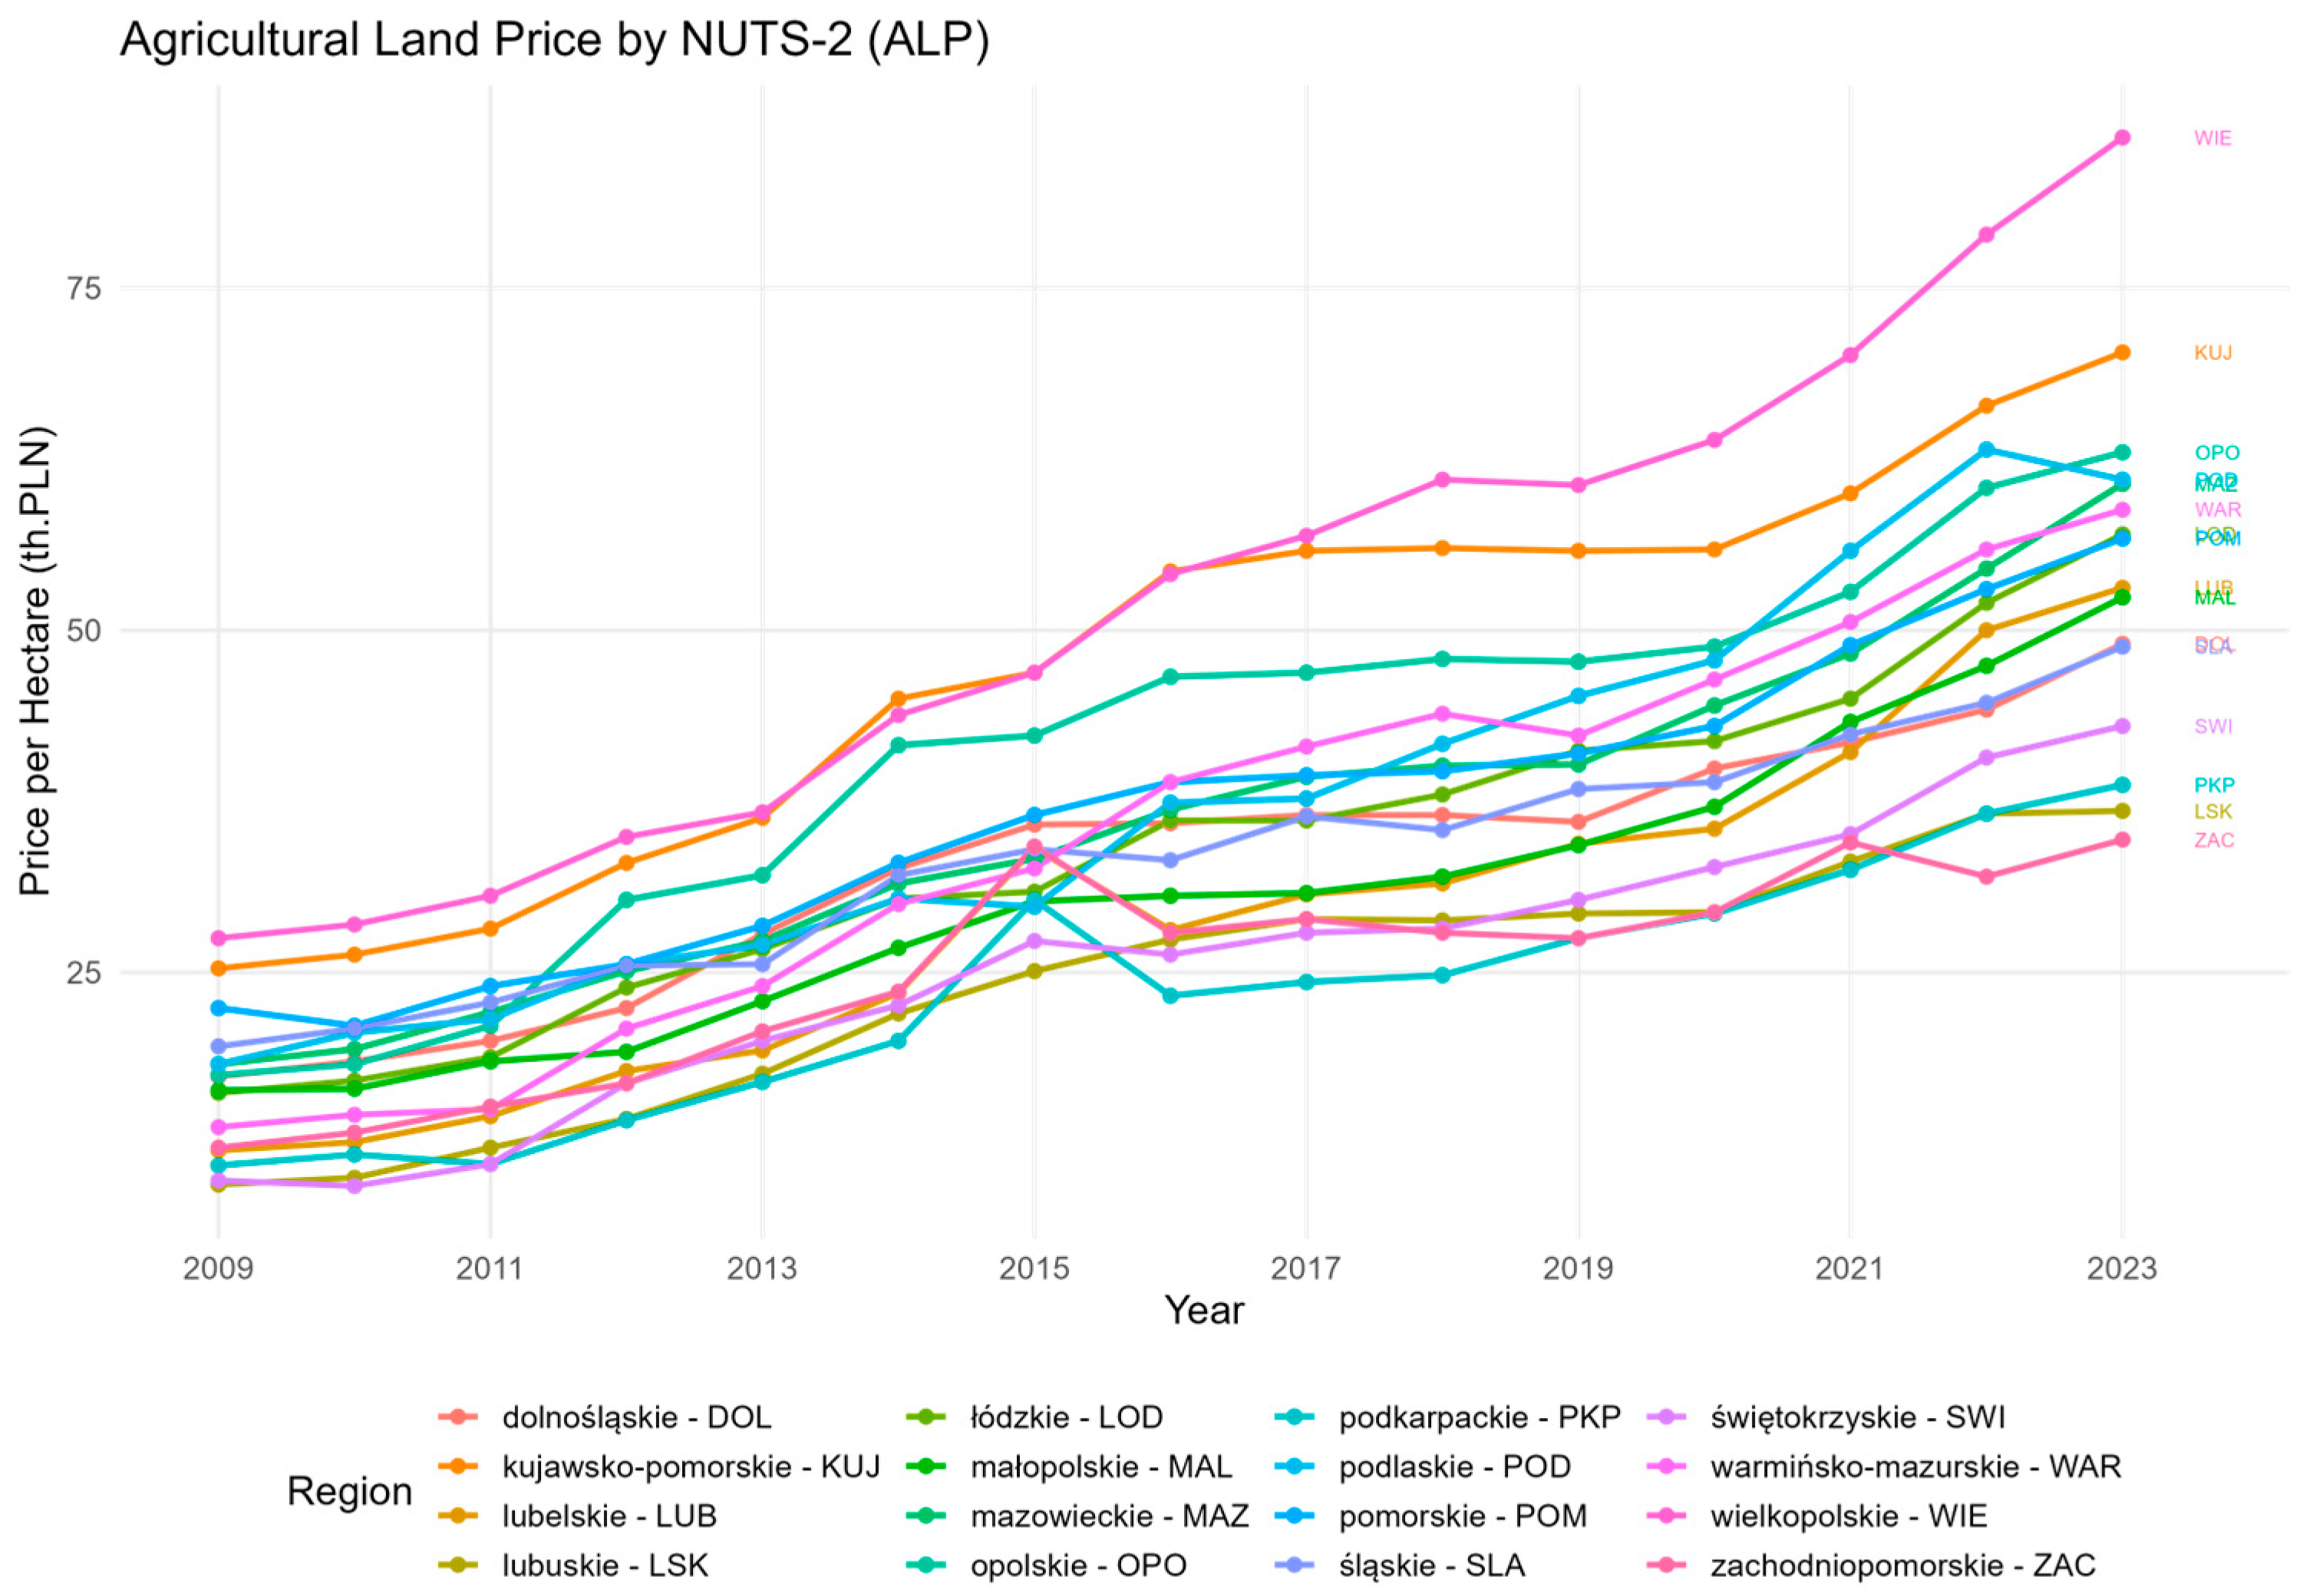
The Agricultural Land Price (ALP), measured as the average transaction price of agricultural land in thousand PLN per hectare, served as the dependent variable. It exhibited pronounced variation both across regions and over time. Regional averages ranged from just over 23,000 PLN to more than 52,000 PLN per hectare, with a sample mean slightly above 34,000 PLN. The distribution reflected structural disparities in land quality, accessibility, and market pressure. Temporally, a clear upward trend was observed, particularly after 2015, aligning with enhanced investor interest, land consolidation processes, and the deepening of CAP implementation (
Figure 1).
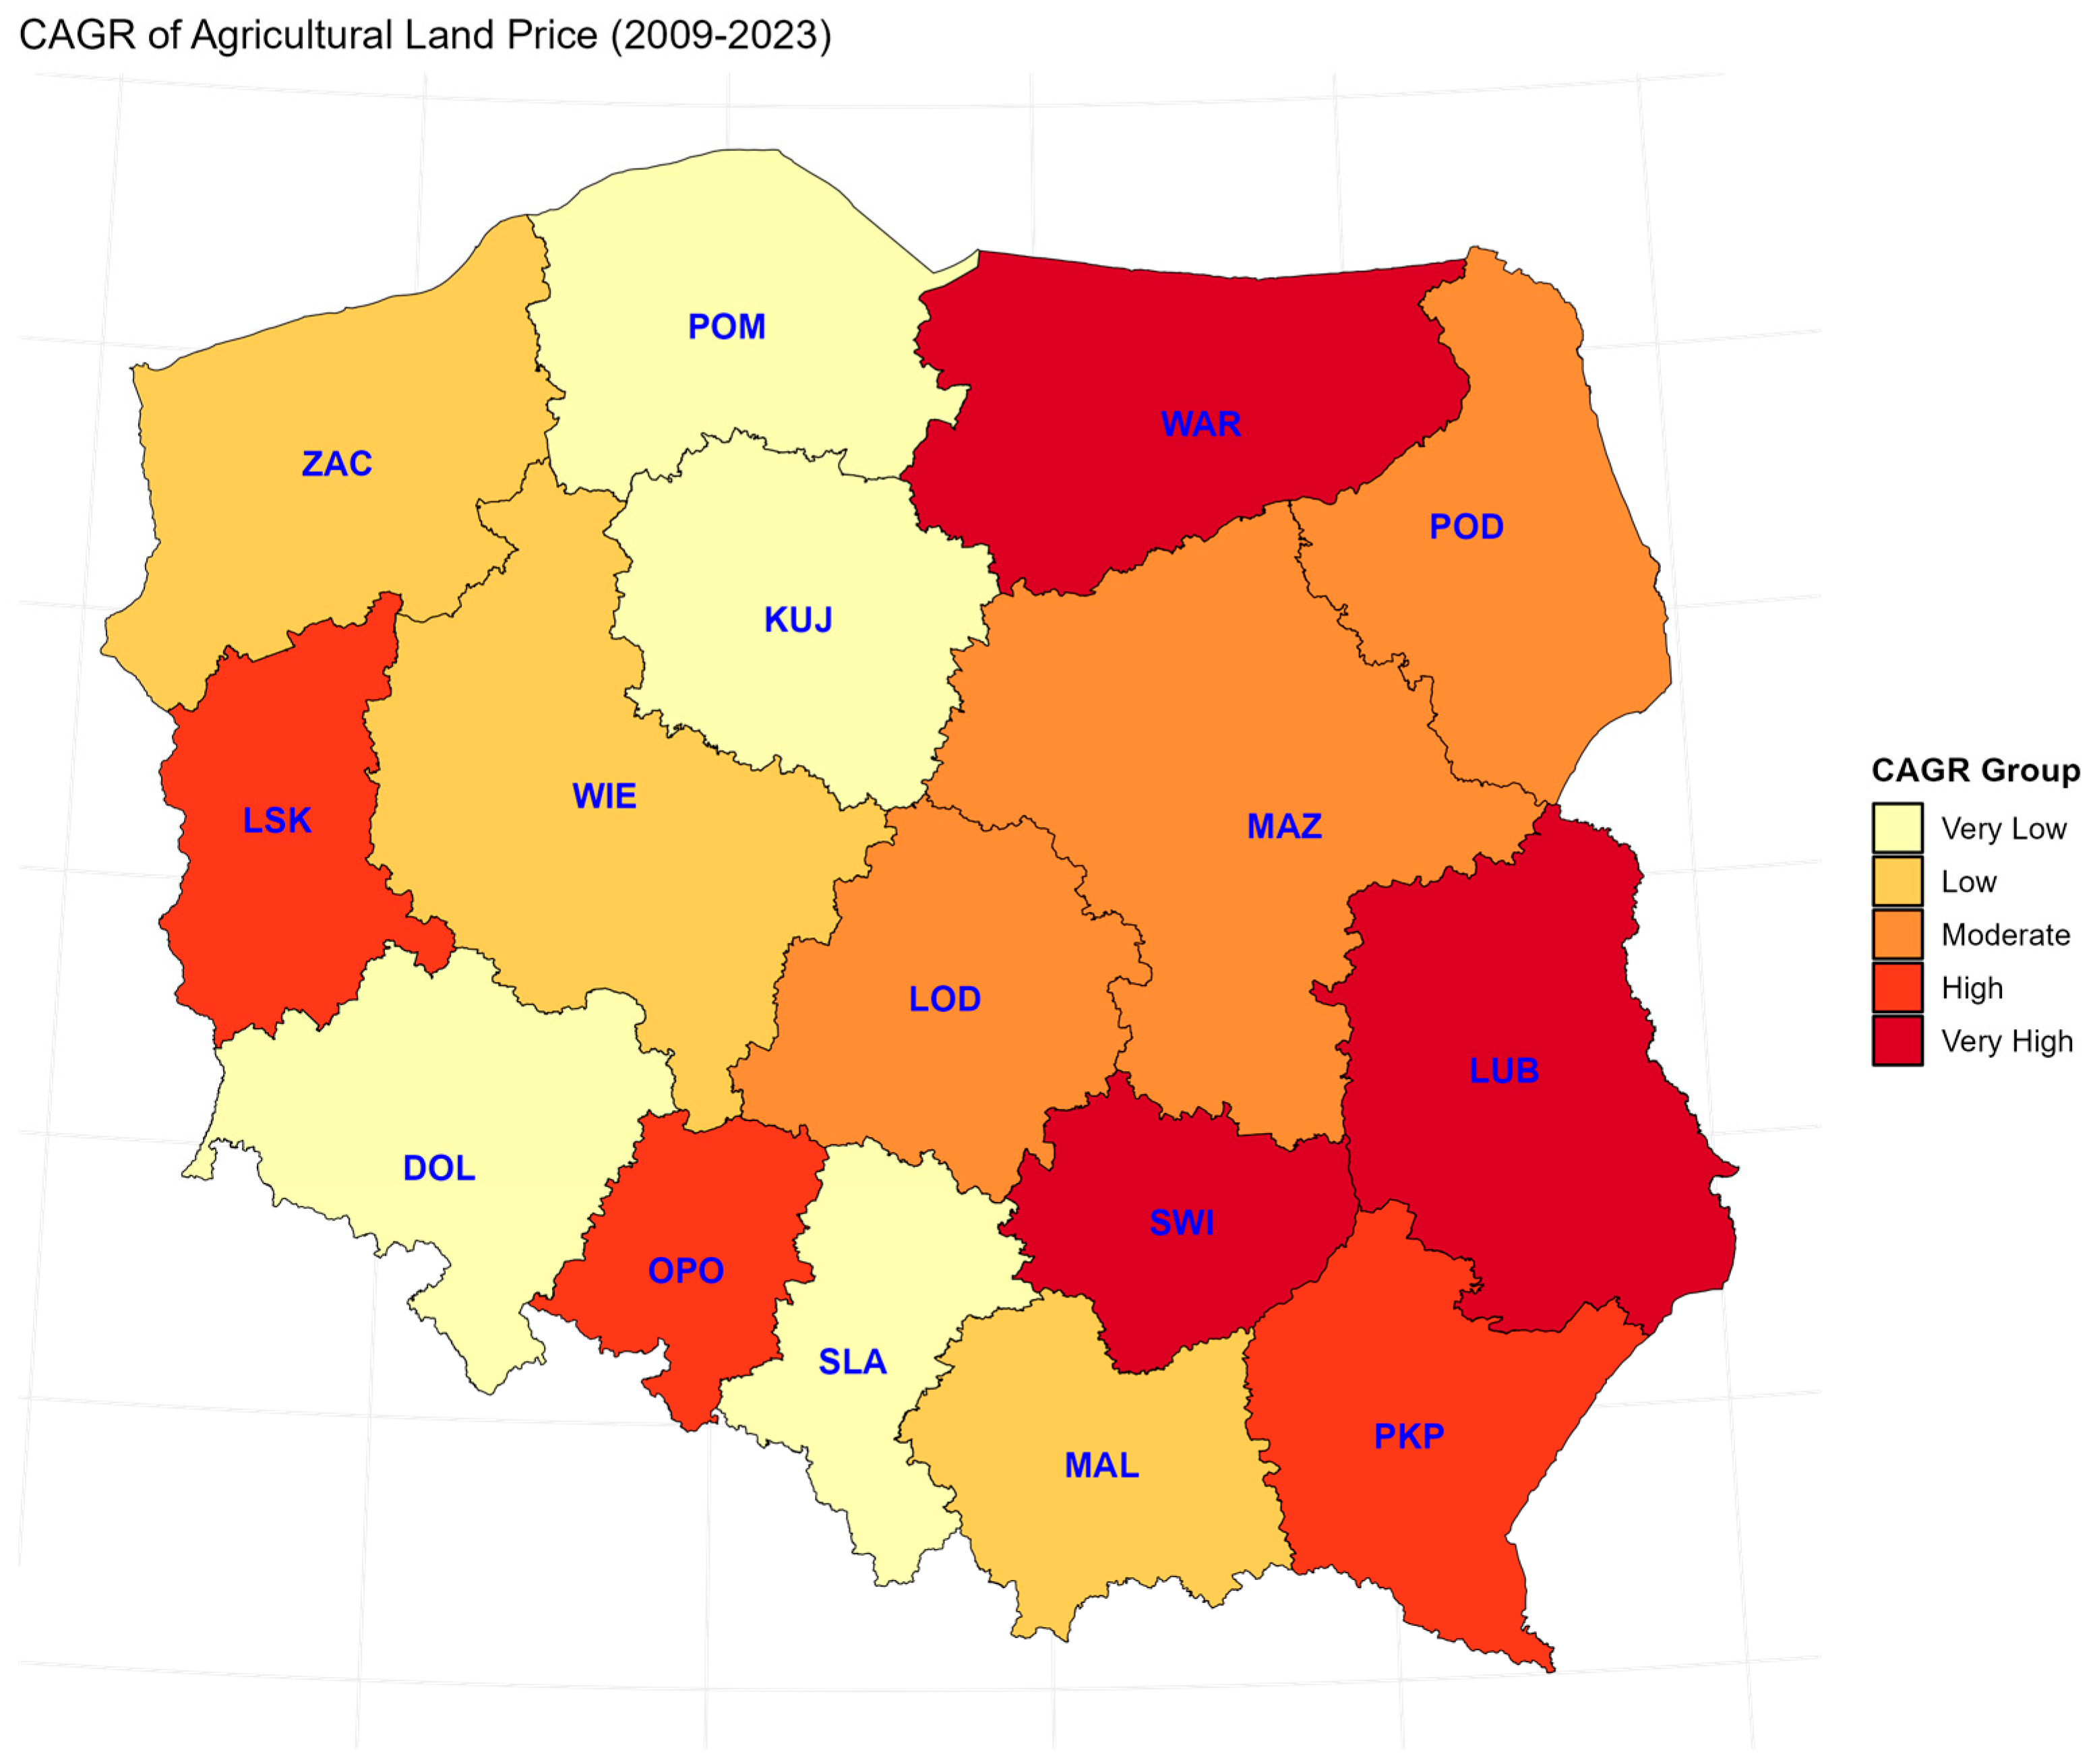
The map (
Figure 2) presents the compound annual growth rate (CAGR) of agricultural land prices across Polish voivodeships between 2009 and 2023. The results reveal substantial regional disparities. Voivodeships such as Lubelskie, Świętokrzyskie, and Warmińsko-Mazurskie recorded very high growth rates, while regions like Dolnośląskie and Kujawsko-Pomorskie experienced very low growth. This spatial heterogeneity likely reflects differences in land market dynamics, agricultural potential, and broader economic development patterns. The categorization into five groups (from very low to very high CAGR) highlights these contrasts and provides insights into regional policy considerations regarding agricultural land markets.
Three indicators captured market liquidity and transactional dynamics. The Agricultural Turnover Ratio (ATR) ranged from 2.5‰ to 7.8‰, with a mean of 4.7‰, indicating moderate variation in land sale volumes. The Per Capita Land Turnover Value (LTV), reflecting the monetary value of land sales per rural resident, demonstrated higher dispersion—from approximately 341 PLN to 1396 PLN—with a mean of 868 PLN. This signaled that in some regions, land market activity constituted a substantial share of rural economic turnover. The Land Withdrawal Ratio (LWR), indicating the share of land removed from agricultural use, also varied meaningfully, capturing regional differences in urbanization pressure or structural decline.
The Average Farm Size (AFS) ranged from 4 to over 31 hectares, with a mean of 13.6 hectares, revealing stark differences in farm structure between the highly fragmented holdings in southern Poland and the more consolidated farms in the northwestern and western regions. The Agricultural Land Share (ALS), denoting the proportion of regional area under agricultural use, averaged 59% and ranged from 41% to 71%. These structural indicators highlighted the persistence of both smallholder systems and large-scale commercial operations across different voivodeships.
The Gross Domestic Product per capita (GDP) exhibited substantial variation—from approximately 37,000 PLN to over 82,000 PLN—with a sample mean near 48,000 PLN. This spread pointed to pronounced disparities in regional economic development and purchasing power. The Gross Value Added in Agriculture (GVA), measured as a share of total regional GDP, averaged 3.5% but ranged from below 1% to nearly 7.7%. This indicator underscored the declining but still regionally important role of agriculture in the broader economic structure, particularly in less diversified economies.
The Soil Quality Index (SQI), a weighted measure of arable land productivity, varied modestly but meaningfully—from 1.51 to 2.15—with a mean of approximately 1.84. As expected, this variable was more stable over time and more differentiated across space, reflecting natural agroecological endowments that are largely exogenous to market or policy dynamics.
Population Density (PDN) averaged around 56 persons per square kilometer, but ranged widely—from sparsely populated rural areas (24/km2) to more urbanized zones (128/km2). This variability captured different levels of land pressure and potential for urban encroachment. Net Migration (NMG) exhibited the largest relative variation, with values from approximately –5000 to +12,000 people per year (scaled regionally). This measure highlighted demographic dynamism or decline, suggesting that land markets may also reflect broader population shifts.
Two variables captured the extent of CAP-related policy support. Direct Payments per Capita (DPC) ranged from 141 PLN to over 1075 PLN, with a mean of about 510 PLN. Direct Payment Applications (DPA), measured per 10 rural inhabitants, varied from 450 to over 1700. These indicators confirmed heterogeneous participation in EU support schemes, influenced by both administrative uptake and structural eligibility. Their regional stability over time suggested institutional inertia or path dependence in policy engagement.
The descriptive profiles of the explanatory variables revealed a complex mosaic of regional characteristics shaping agricultural land price formation in Poland. The data supported the presence of both structural and temporal heterogeneity—reflected in disparities in economic development, demographic vitality, farm structure, and land use intensity. These patterns underscored the need for a panel econometric approach that accounted for both fixed regional traits and evolving dynamics. Moreover, the observed spatial variation in key variables justified the incorporation of spatial econometric models to capture interregional spillovers and spatial autocorrelation in land price behavior.
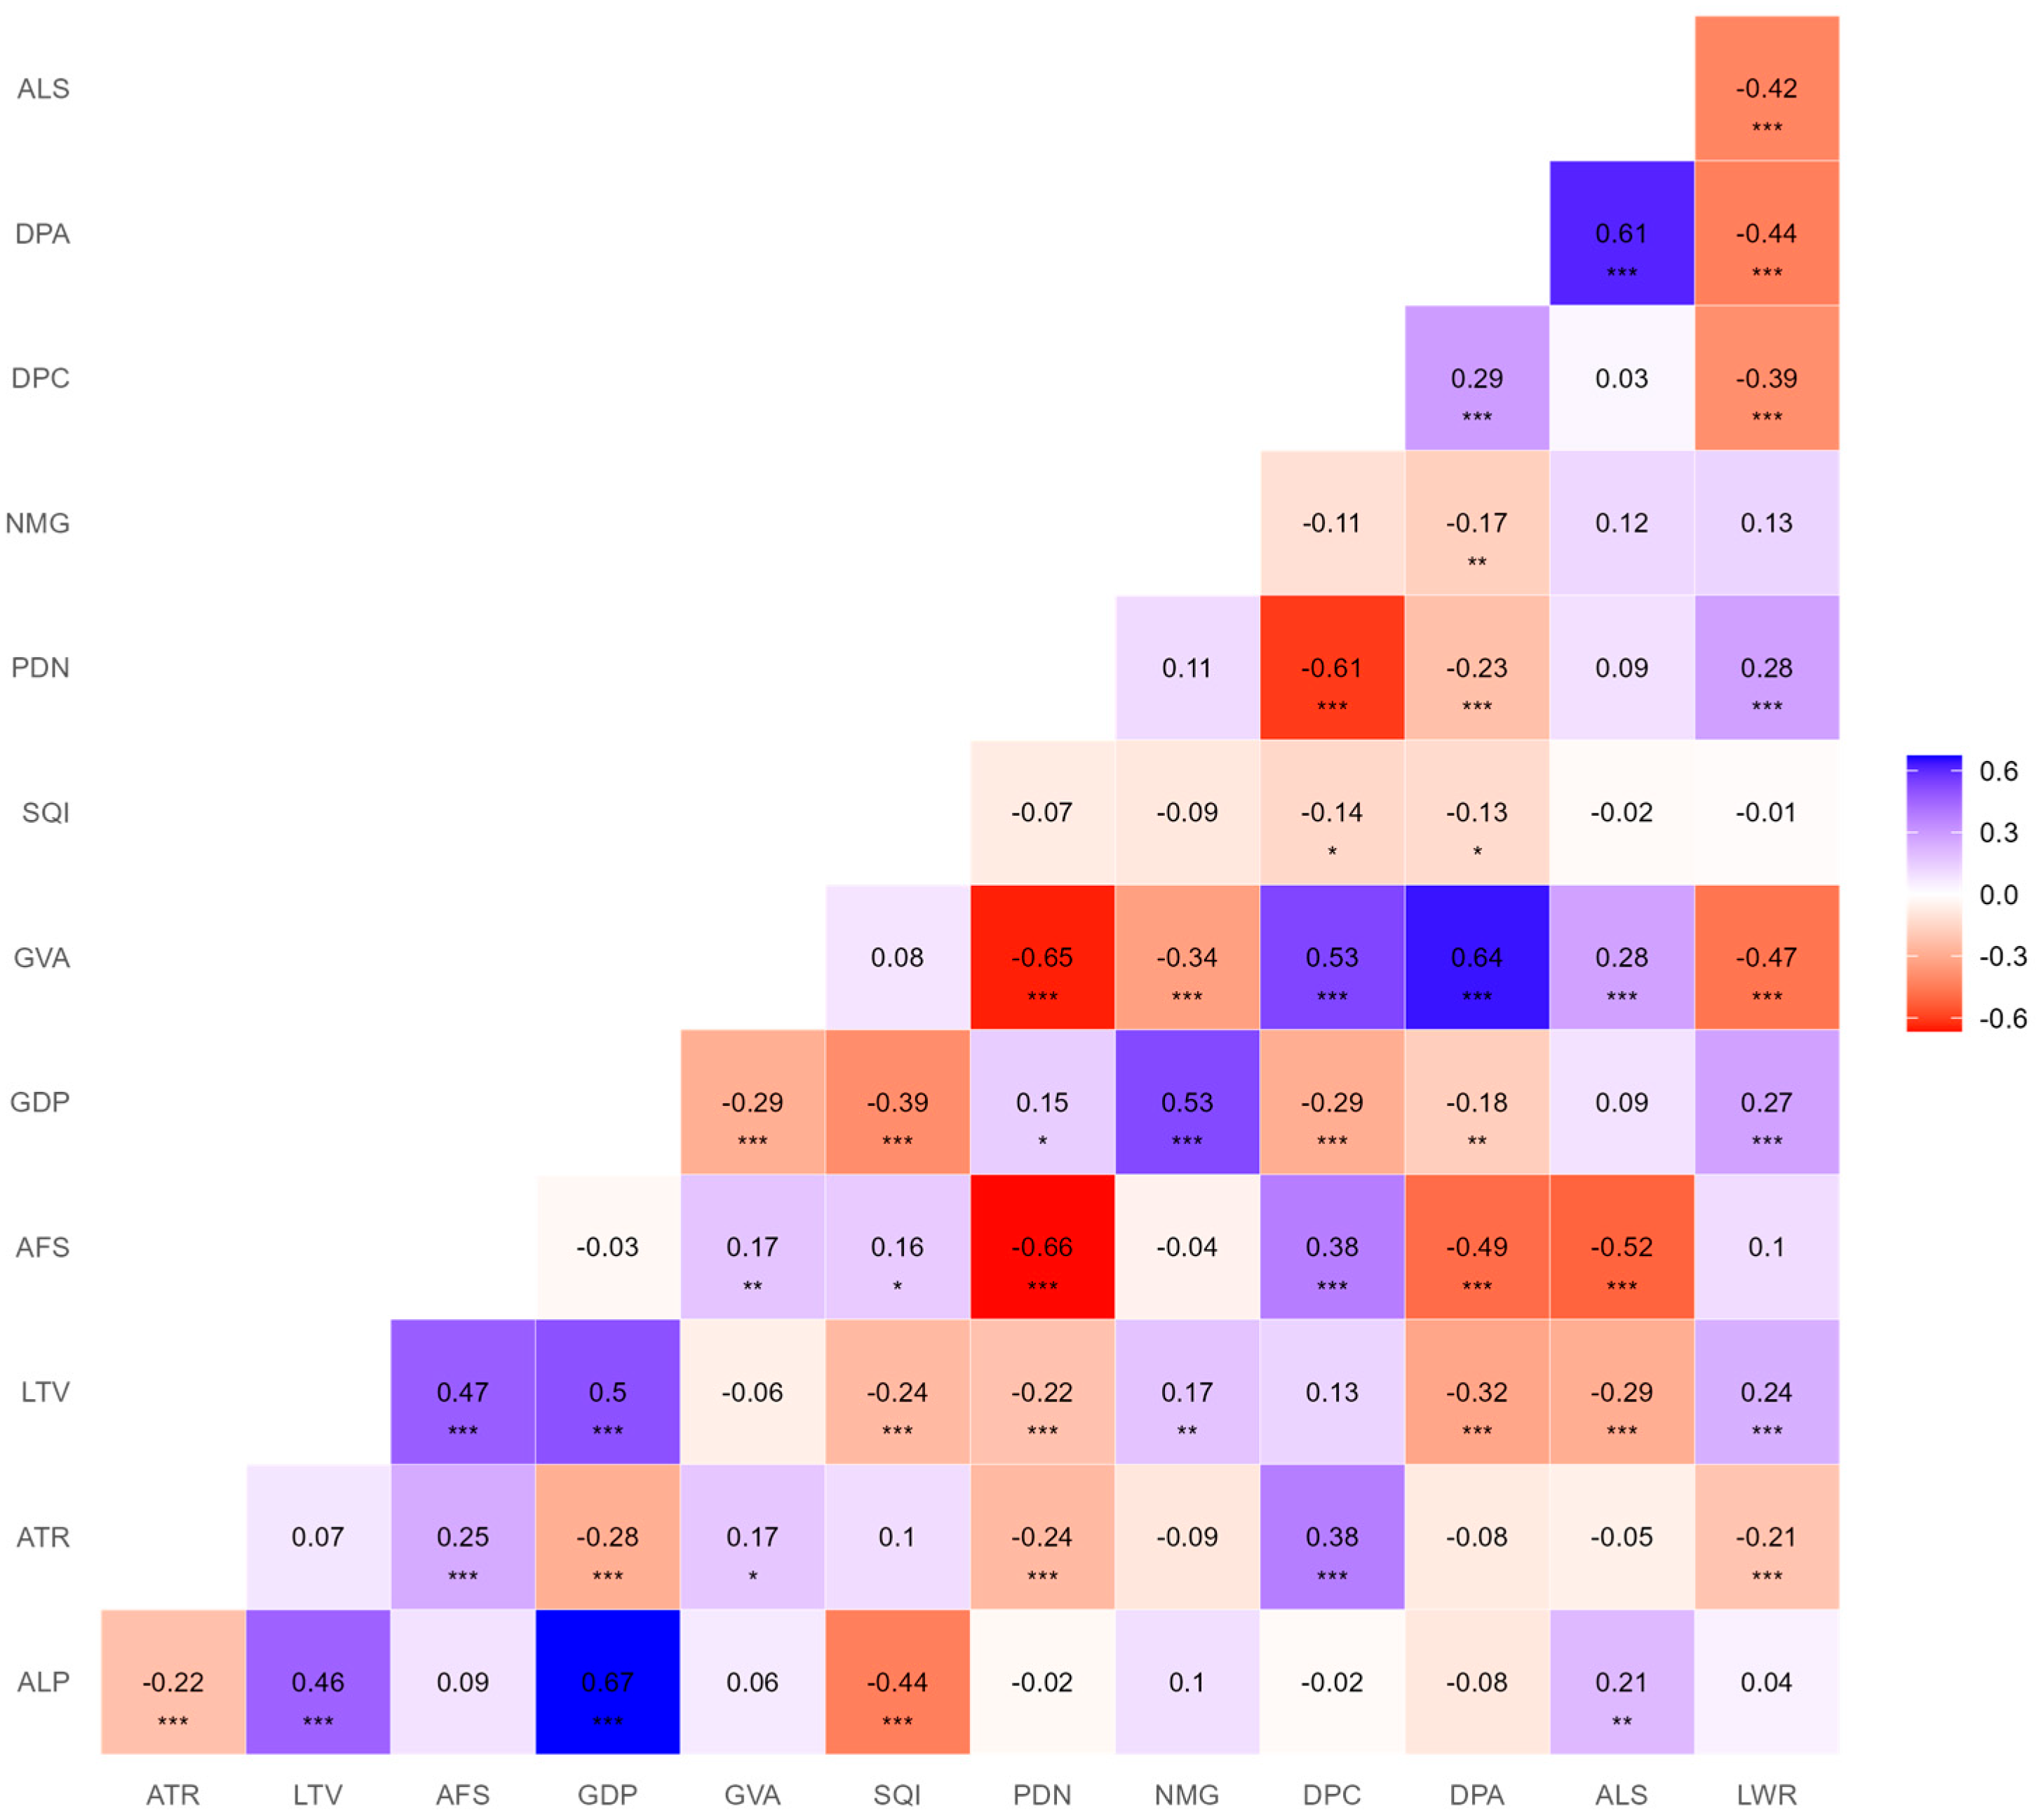
The specification of the empirical model required careful consideration of both theoretical relevance and empirical robustness. While the initial framework included a comprehensive set of explanatory variables covering structural, demographic, economic, policy, and environmental dimensions, the correlation matrix (
Figure 3) and variance inflation factor (VIF) diagnostics indicated potential multicollinearity among several indicators. In particular, strong correlations were observed between policy-related variables—Direct Payment Applications (DPA) and Direct Payments per Capita (DPC)—as well as between economic (GDP) and demographic (PDN) variables. Additionally, certain structural indicators, such as Average Farm Size (AFS) and Agricultural Land Share (ALS), displayed significant overlaps or weak individual explanatory power when considered alongside more dominant predictors.
To improve the efficiency and interpretability of the model, a reduced specification was adopted that aimed to balance parsimony with conceptual completeness. Variables that were highly correlated, statistically redundant, or theoretically ambiguous were excluded. Specifically, DPC was dropped due to its collinearity with DPA and Gross Value Added from agriculture (GVA). Similarly, Net Migration (NMG) and Land Withdrawal Ratio (LWR) were removed due to weak explanatory value and interpretational challenges, while the Land Turnover Value (LTV) was excluded due to its direct correlation with the dependent variable (ALP) and limited independent contribution.
The final model retained eight explanatory variables capturing the most salient structural, market, economic, and policy dimensions: GDP per capita (GDP), Gross Value Added in Agriculture (GVA), Soil Quality Index (SQI), Agricultural Turnover Ratio (ATR), Population Density (PDN), Average Farm Size (AFS), Direct Payment Applications (DPA), and Agricultural Land Share (ALS). The model was estimated using a fixed effects panel regression with robust standard errors to control for unobserved heterogeneity and heteroskedasticity across Poland’s 16 voivodeships over the 15-year period from 2009 to 2023.
The selected model specification demonstrated both statistical rigor and substantive relevance in explaining regional variation in agricultural land prices in Poland. By incorporating fixed effects, the model effectively controlled for unobserved, time-invariant regional characteristics, ensuring that the estimated relationships captured true within-region dynamics over time. Furthermore, robust standard errors were employed to correct for potential heteroskedasticity and serial correlation, enhancing the reliability of inference. With an R2 of 0.87, the model accounted for a substantial portion of the variance in land prices, indicating strong explanatory power and adequacy.
The final specification retained a carefully curated set of variables, each representing distinct conceptual dimensions relevant to land price formation. These included indicators of regional affluence (GDP per capita), agricultural specialization (GVA), inherent land productivity (Soil Quality Index), market activity (Agricultural Turnover Ratio), and structural or policy-related factors (such as Average Farm Size, Direct Payment Applications, and Agricultural Land Share). By systematically excluding empirically weak or theoretically redundant predictors, the model addressed concerns related to multicollinearity and provided a clearer, more interpretable picture of the underlying price determinants.
While the spatial econometric framework provides important insights into spatial interdependencies, it is subject to several limitations. First, the analysis is constrained by data availability at the NUTS-2 (voivodeship) level, which may mask intraregional heterogeneity and spatial spillovers within smaller administrative units. The use of aggregated data limits the precision of spatial dependence estimates and may lead to scale-related biases. Second, the temporal scope of the dataset (2006–2021) reflects limitations in consistent land price reporting and harmonized regional indicators over time, potentially affecting model robustness. Third, the spatial modeling assumes stationarity and exogeneity of explanatory variables across space and time, which may not fully capture dynamic adjustments in regional land markets. Finally, spatial weights based on contiguity reflect geographic proximity but may omit functional relationships such as market flows or commuting patterns.
3. Results
3.1. Land Market Conditions and Trends in Poland
The agricultural land market in Poland has a dual structure: a private segment involving inter-neighborhood transactions and a public segment centered on the turnover of state-owned land from the Agricultural Property Stock (WRSP). These segments differ in ownership, legal frameworks, and access conditions. Since the early 1990s, market reforms enabled private land trade, while state land was redistributed through leases or sales managed by agencies like AWRSP and later KOWR, initiating a more structured land allocation process.
The 2016 reform introduced tighter rules to prevent speculative purchases and support family farming. Buyers had to meet new criteria, including agricultural qualifications and local residency. A key measure allowed KOWR to reclaim up to 30% of leased land from large holdings (over 428 hectares) to redistribute to smaller farms. By 2021, many lessees rejected the revised terms, leading to widespread contract terminations and the return of land to WRSP resources.
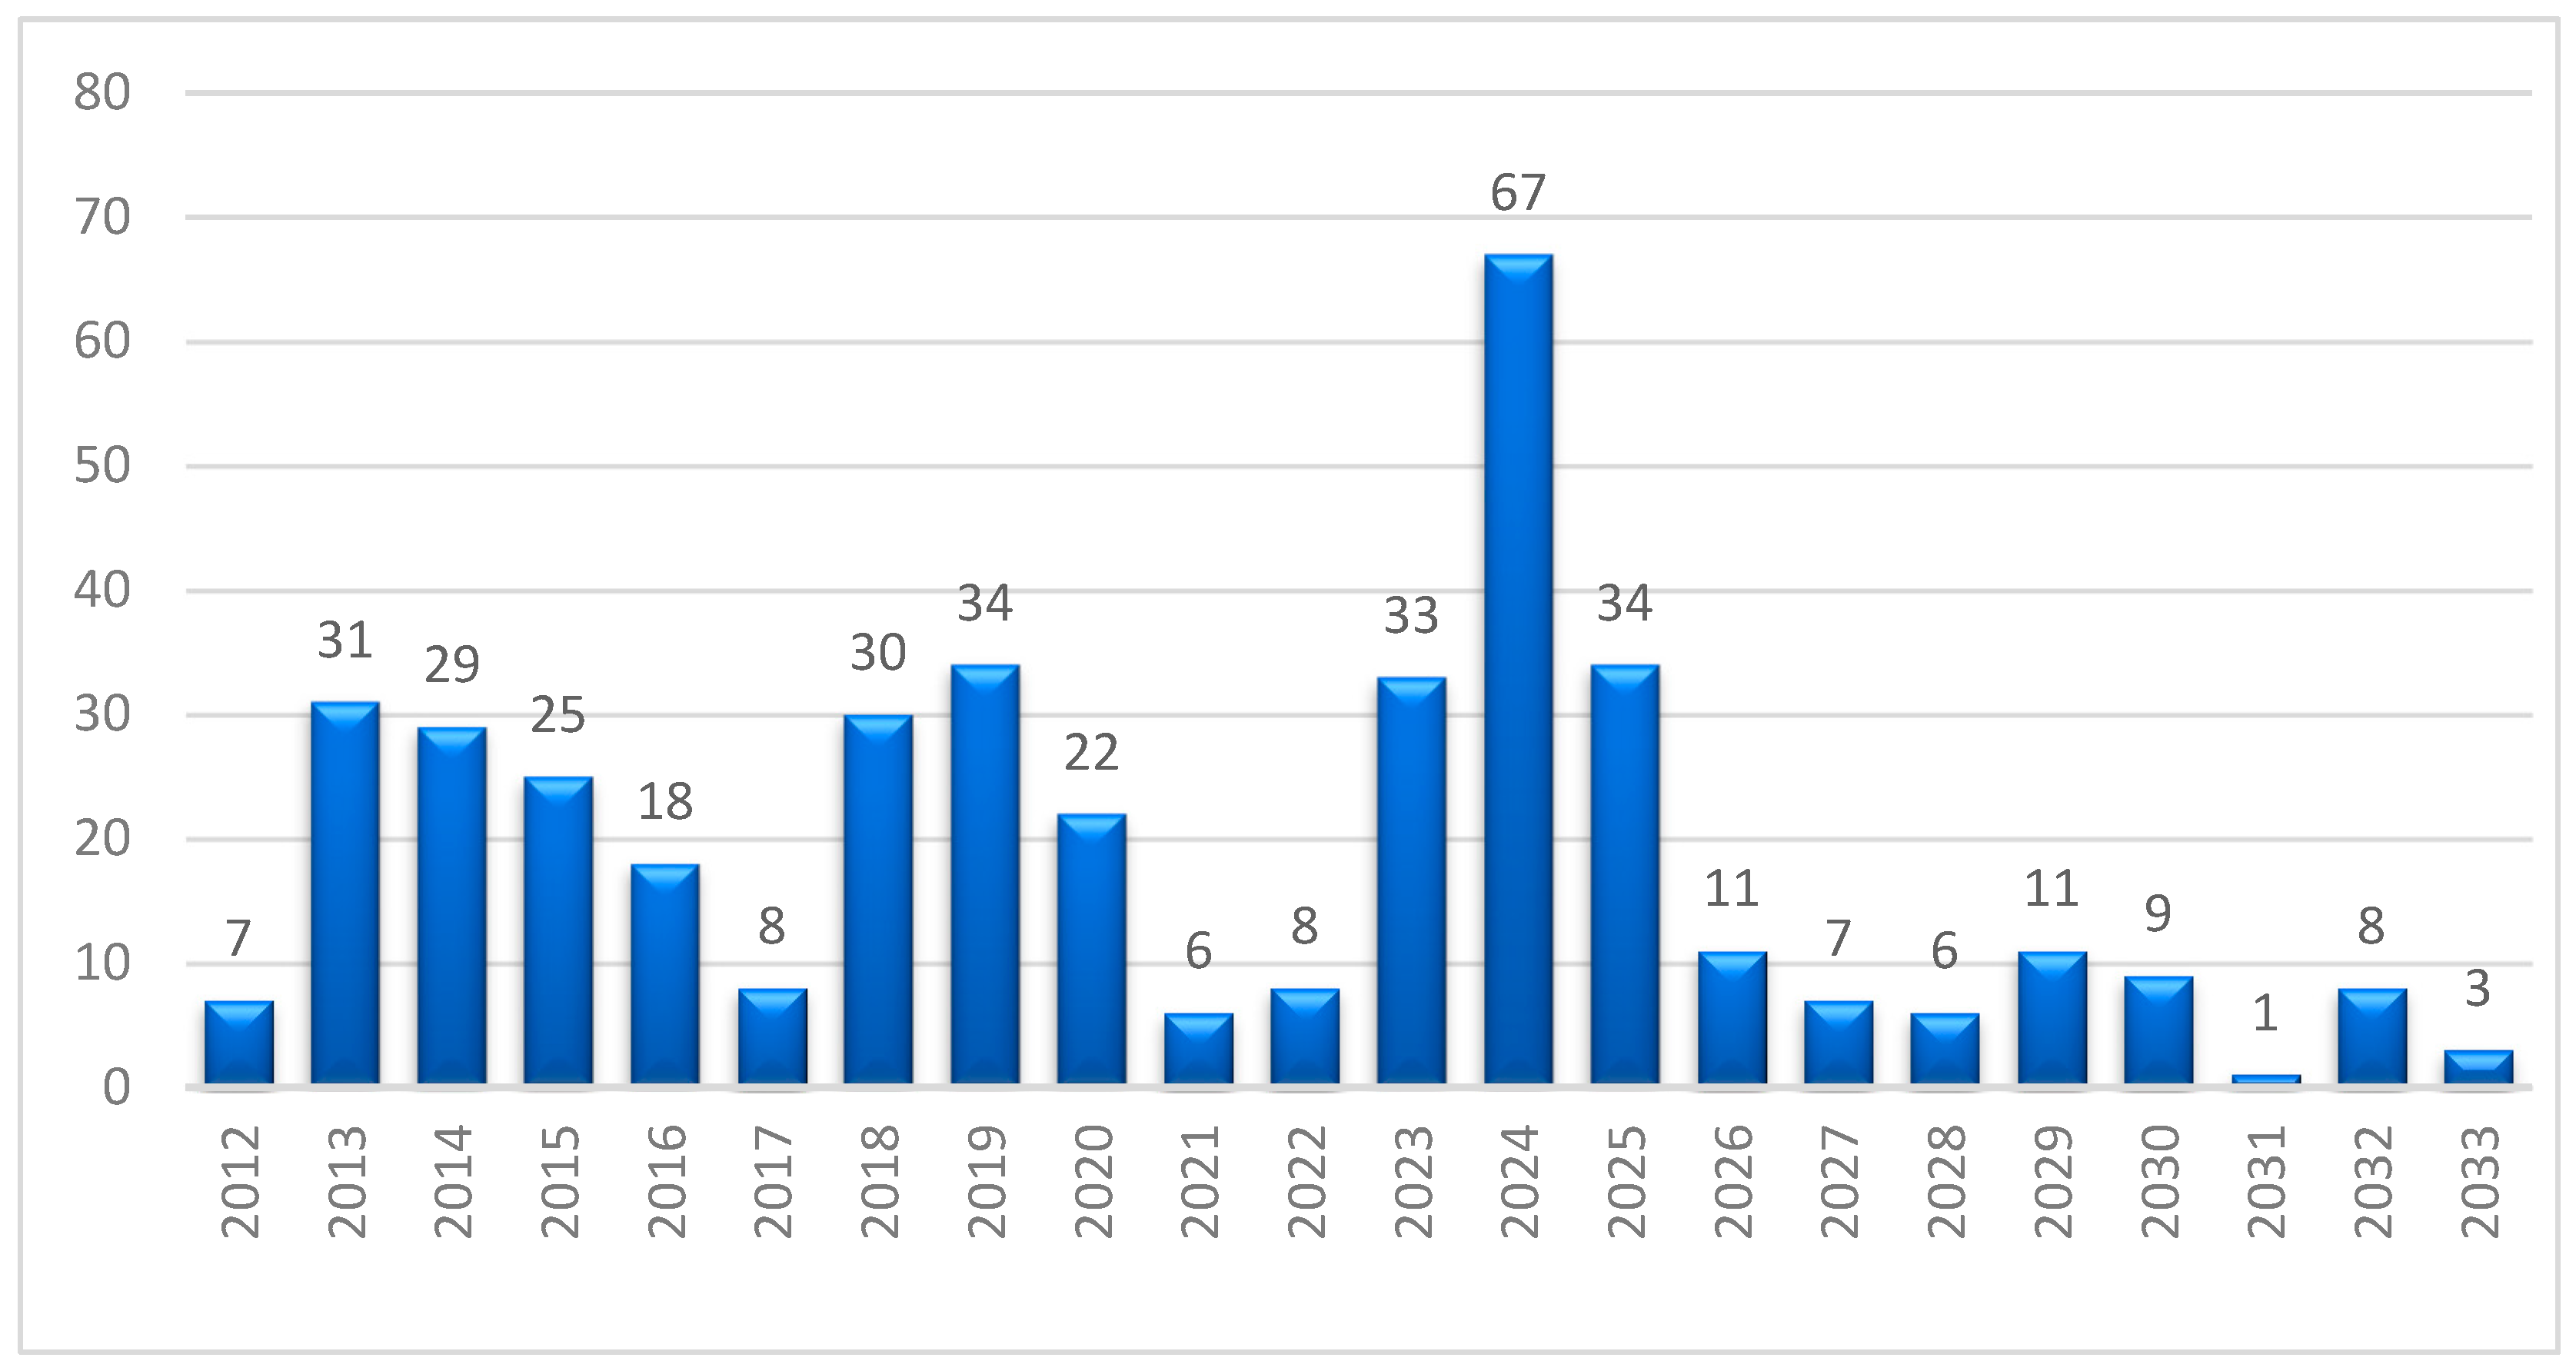
Figure 4 shows time series data from 2012 to 2033 on expired agricultural land leases under the WRSP system that were not renewed due to the tenant’s refusal to accept the post-2016 condition requiring the exclusion of 30% of the leased land. This reform targeted large holdings (over 428 ha) to enable redistribution to smaller family farms.
Non-renewals rose steadily—from 7 in 2012 to 34 in 2018, then sharply to 67 in 2024. The largest increase occurred between 2023 and 2024, nearly doubling in one year. Projections indicate continued high levels above 30 per year until 2027, stabilizing near 3 by 2033 as older leases expire.
The data confirms KOWR’s growing role in reclaiming and reallocating land from long-term leaseholders. While this shift creates opportunities for small farms, it also carries short-term risks of underuse. Overall, it reflects a strategic transition toward more equitable and sustainable land policy.
Figure 5 shows the structure of WRSP land remaining as of the end of 2023, totaling about 188,000 hectares, categorized by planned future use.
Most of this land—142.34 thousand hectares (75.7%)—is intended for continued agricultural use, reflecting policy priorities focused on family farming and food security. The remaining 24.3% is set aside for other or undefined purposes:
18.36 thousand ha (9.8%) lack a specified use, pointing to planning or legal gaps.
12.80 thousand ha (6.8%) are allocated for afforestation.
8.28 thousand ha (4.4%) serve various other functions.
6.22 thousand ha (3.3%) are designated for construction and services.
This structure underscores both the agricultural focus of WRSP land and the rising demand from environmental and development sectors. The significant share of land without a defined purpose calls for improved planning to ensure sustainable, socially beneficial outcomes. Balancing farming needs with broader sustainability goals remains a key governance challenge.
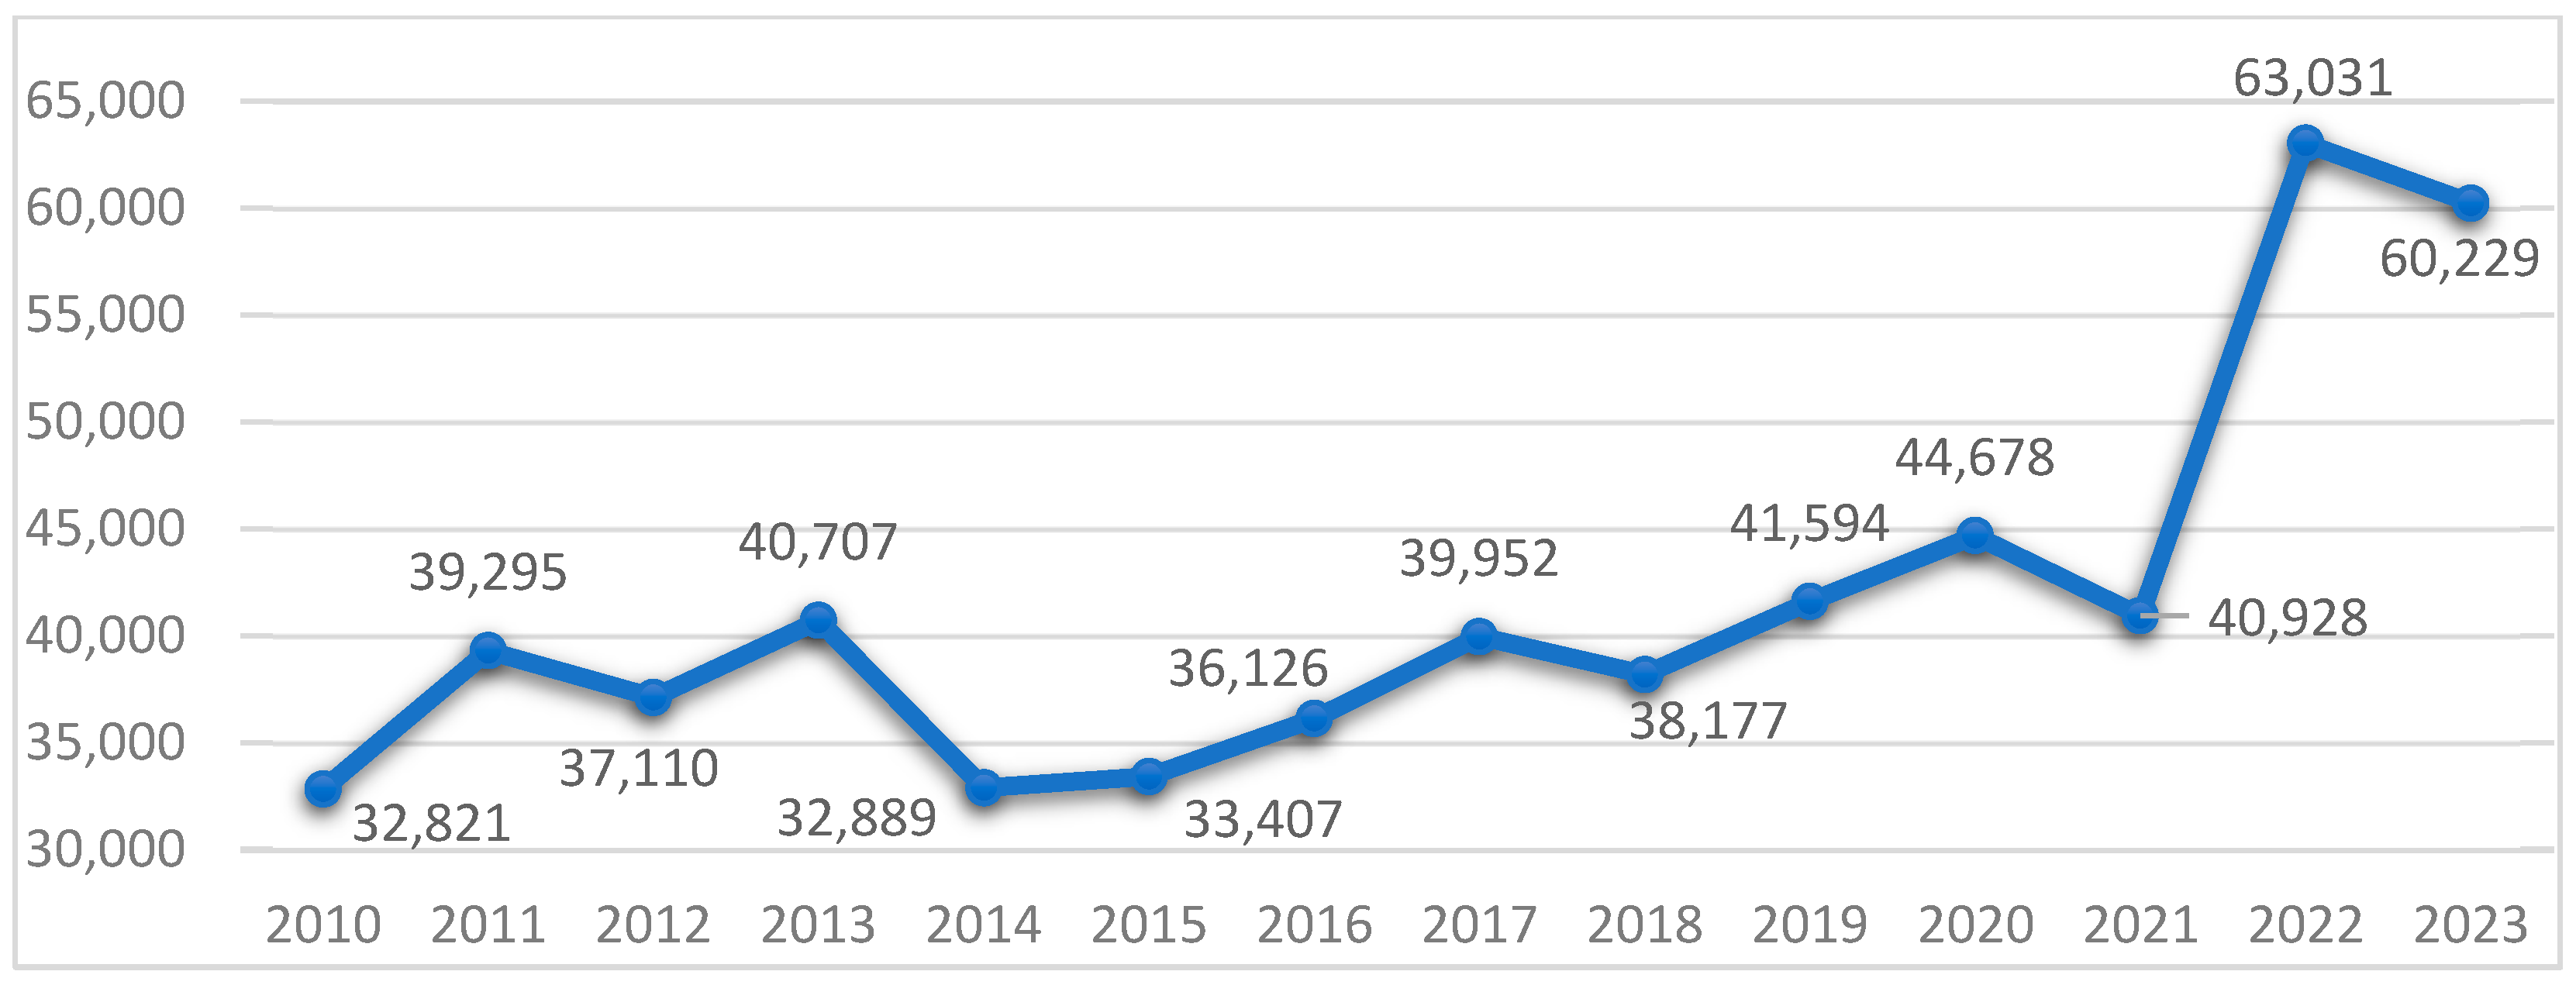
Figure 6 illustrates the evolution of average agricultural income per household in Poland from 2010 to 2023, showing a generally upward trajectory with key periods of volatility and acceleration. Early in the decade, income fluctuated, rising from PLN 32,821 in 2010 to a peak of PLN 40,707 in 2013, before dropping to PLN 32,889 in 2014. These shifts likely reflected changes in global commodity markets and adjustments in agricultural policy frameworks. From 2015 to 2020, the trend stabilized, with incomes increasing gradually to PLN 44,678, supported by favorable macroeconomic conditions and the continued inflow of EU subsidies. Between 2021 and 2023, agricultural income rose sharply—reaching PLN 63,031 in 2022 and slightly declining to PLN 60,229 in 2023—driven by rising commodity prices, strong export performance, and inflationary pressures. These gains suggest improved farm profitability, stronger investment potential, and increased financial resilience across the sector.
Rising agricultural income has important implications for land market dynamics. Higher and more stable earnings improve farmers’ purchasing power and access to credit, enabling land expansion through purchases or leases and contributing to rising land prices. However, this also risks reinforcing disparities, as larger commercial farms are better positioned to benefit from favorable conditions than smaller or semi-subsistence operations. As a result, land accessibility for young or new farmers may be reduced, raising equity concerns. While higher incomes can support long-term investments, environmental practices, and structural modernization, they must be accompanied by policy measures that promote inclusive land access and intergenerational renewal. Overall,
Figure 6 highlights agricultural income as a key force shaping land market transformation in Poland, underscoring the need for nuanced policy approaches that balance efficiency with fairness and sustainability.
3.2. Economic and Demographic Determinants
The functioning of the agricultural land market in Poland is strongly influenced by macroeconomic trends and structural demographic changes. Over the past decade, dynamic shifts in land prices, lease values, and ownership continuity have been driven by fluctuations in agricultural income, GDP growth, inflation, and the progressive aging of rural populations. These elements constitute the foundational variables for assessing the market’s responsiveness to both short-term economic stimuli and long-term sustainability challenges.
Rising land prices and rental rates in Poland reflect both economic growth and structural changes in agriculture. Between 2015 and 2023, the average price of WRSP land increased, driven by limited availability and stronger demand.
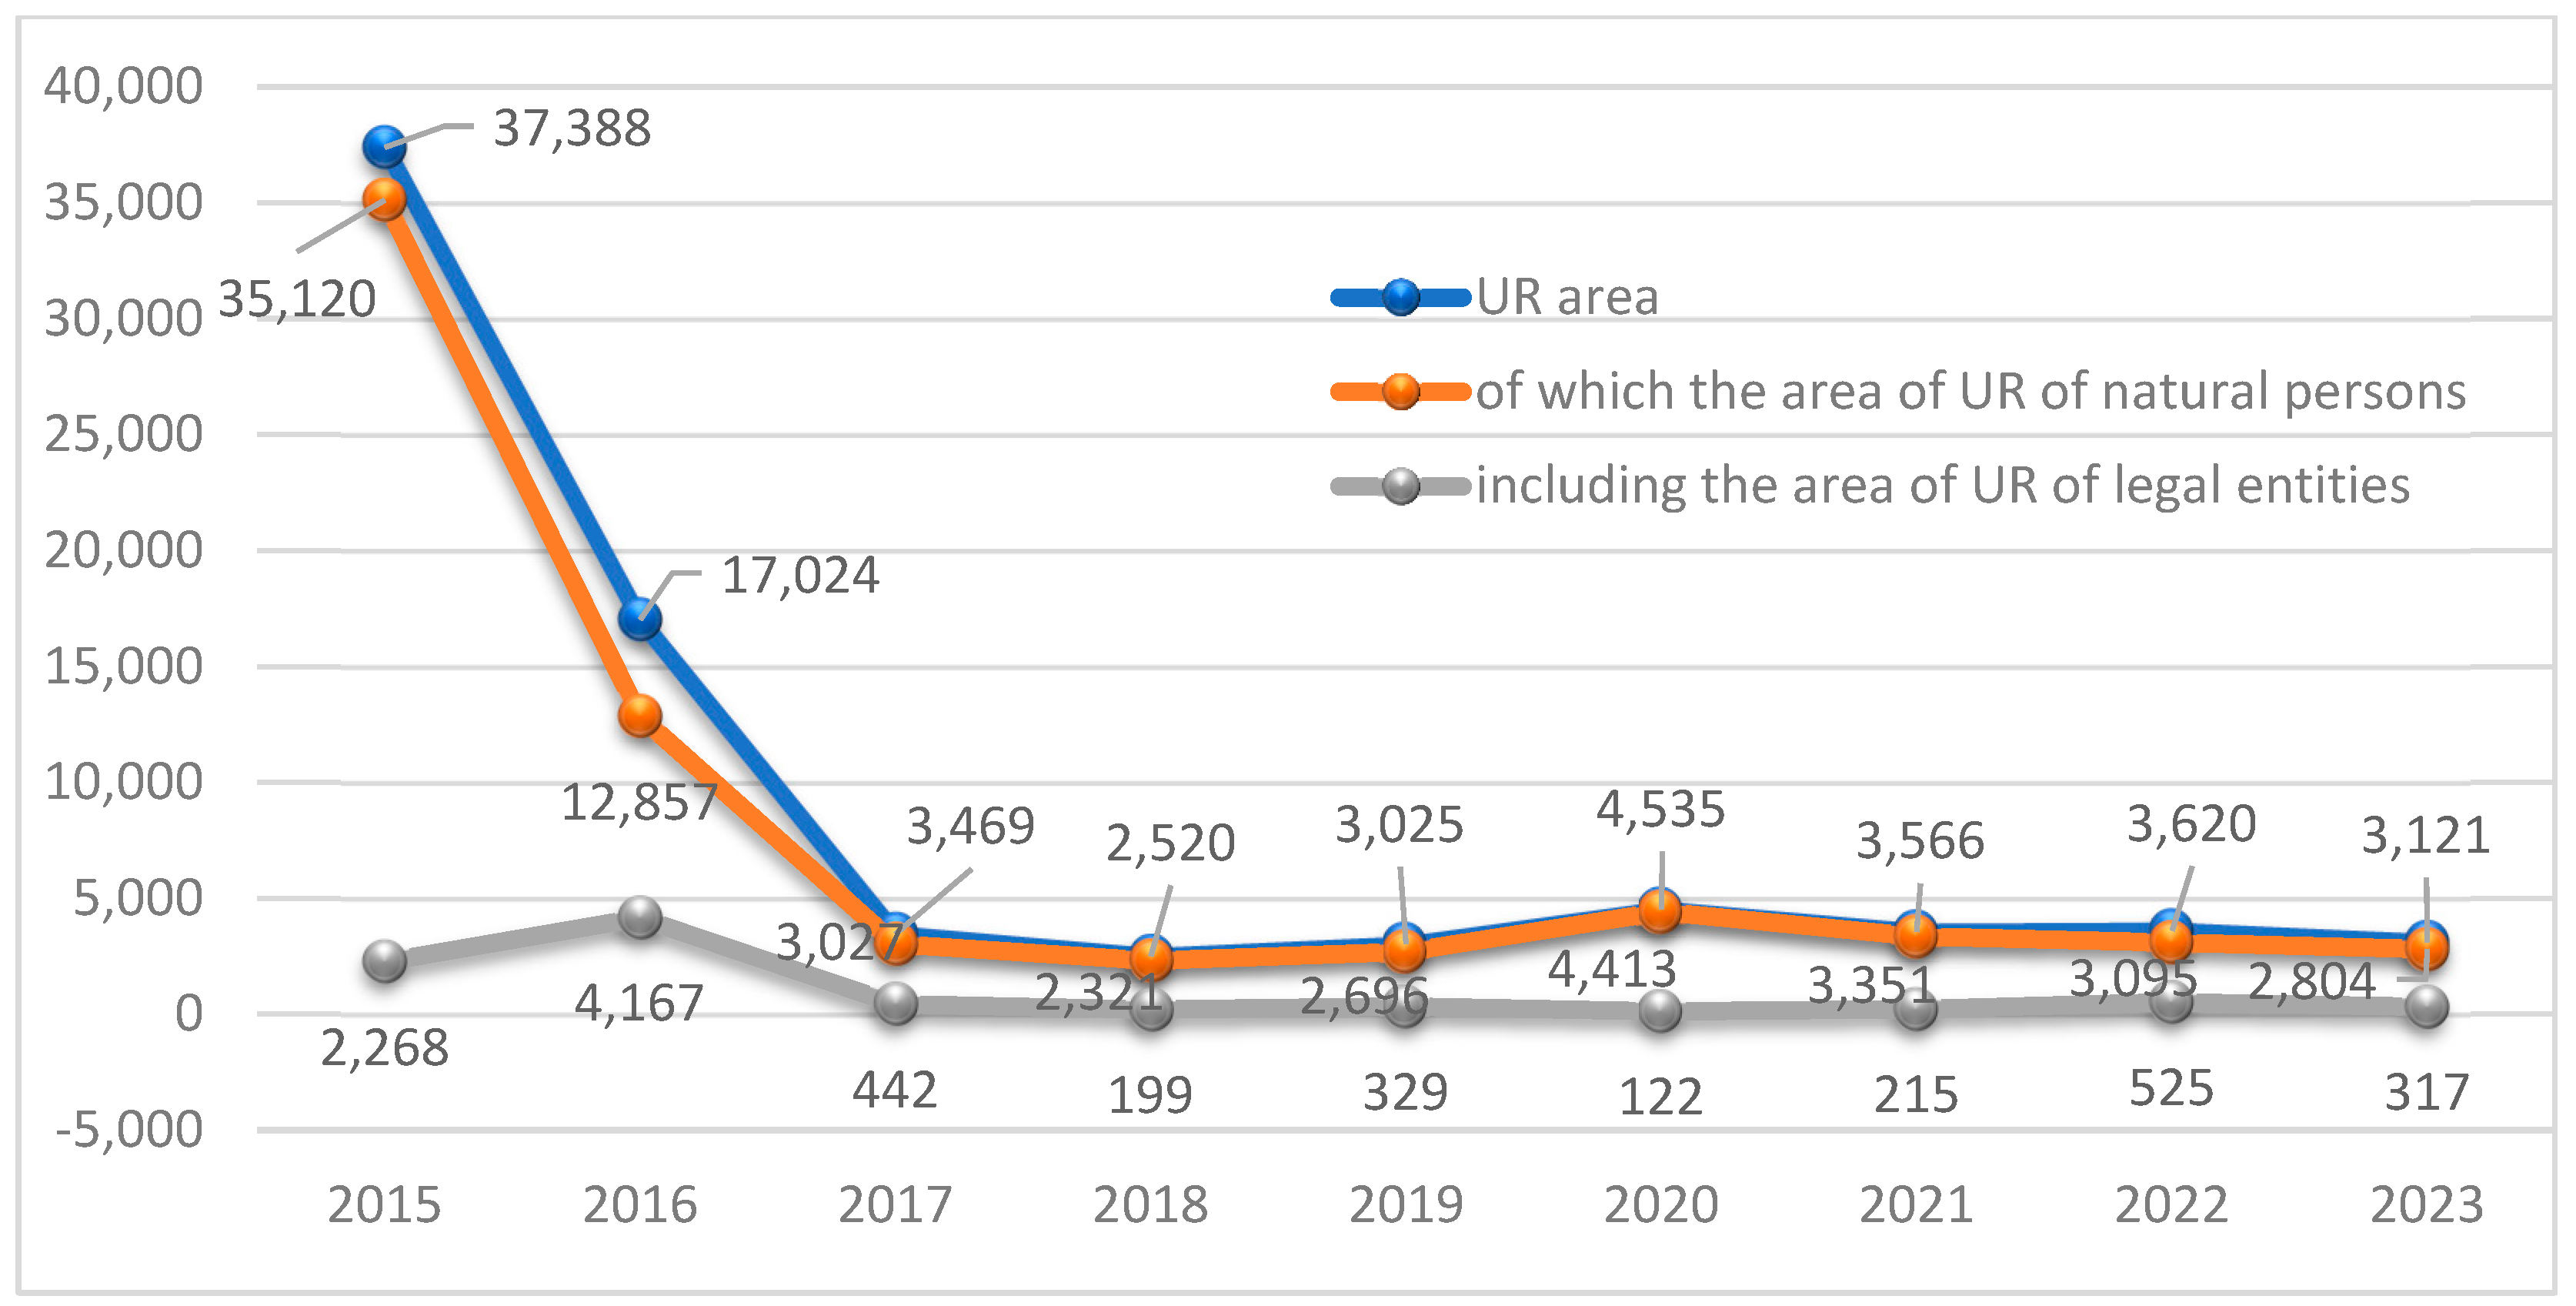
Figure 7 shows annual sales of WRSP agricultural land from 2015 to 2023, categorized by buyer type—natural persons and legal entities—highlighting the effects of the 2016 land reform, which restricted access for legal entities and prioritized individual farmers.
Sales dropped sharply from 37.4 thousand hectares in 2015 (94% to natural persons) to 17.0 thousand hectares in 2016. In the following years, volumes stabilized at 2.5–4.5 thousand hectares annually. From 2017 to 2023, natural persons accounted for over 85–95% of sales. In 2023, they acquired 2.80 thousand hectares (90% of the total), while legal entities bought only 317 hectares. These trends confirm a strategic policy shift toward leasing and selective sales, reinforcing the family farm model and limiting speculative or institutional ownership.
The reform reduced land market liquidity and may hinder access for new or young farmers, especially in high-demand regions. While it curbs concentration and protects agricultural use, it also raises concerns about long-term land mobility and investment incentives.
Figure 7 illustrates Poland’s transition from broad privatization to a regulated public land policy that supports sustainability, but requires complementary tools to ensure generational renewal and equitable access.
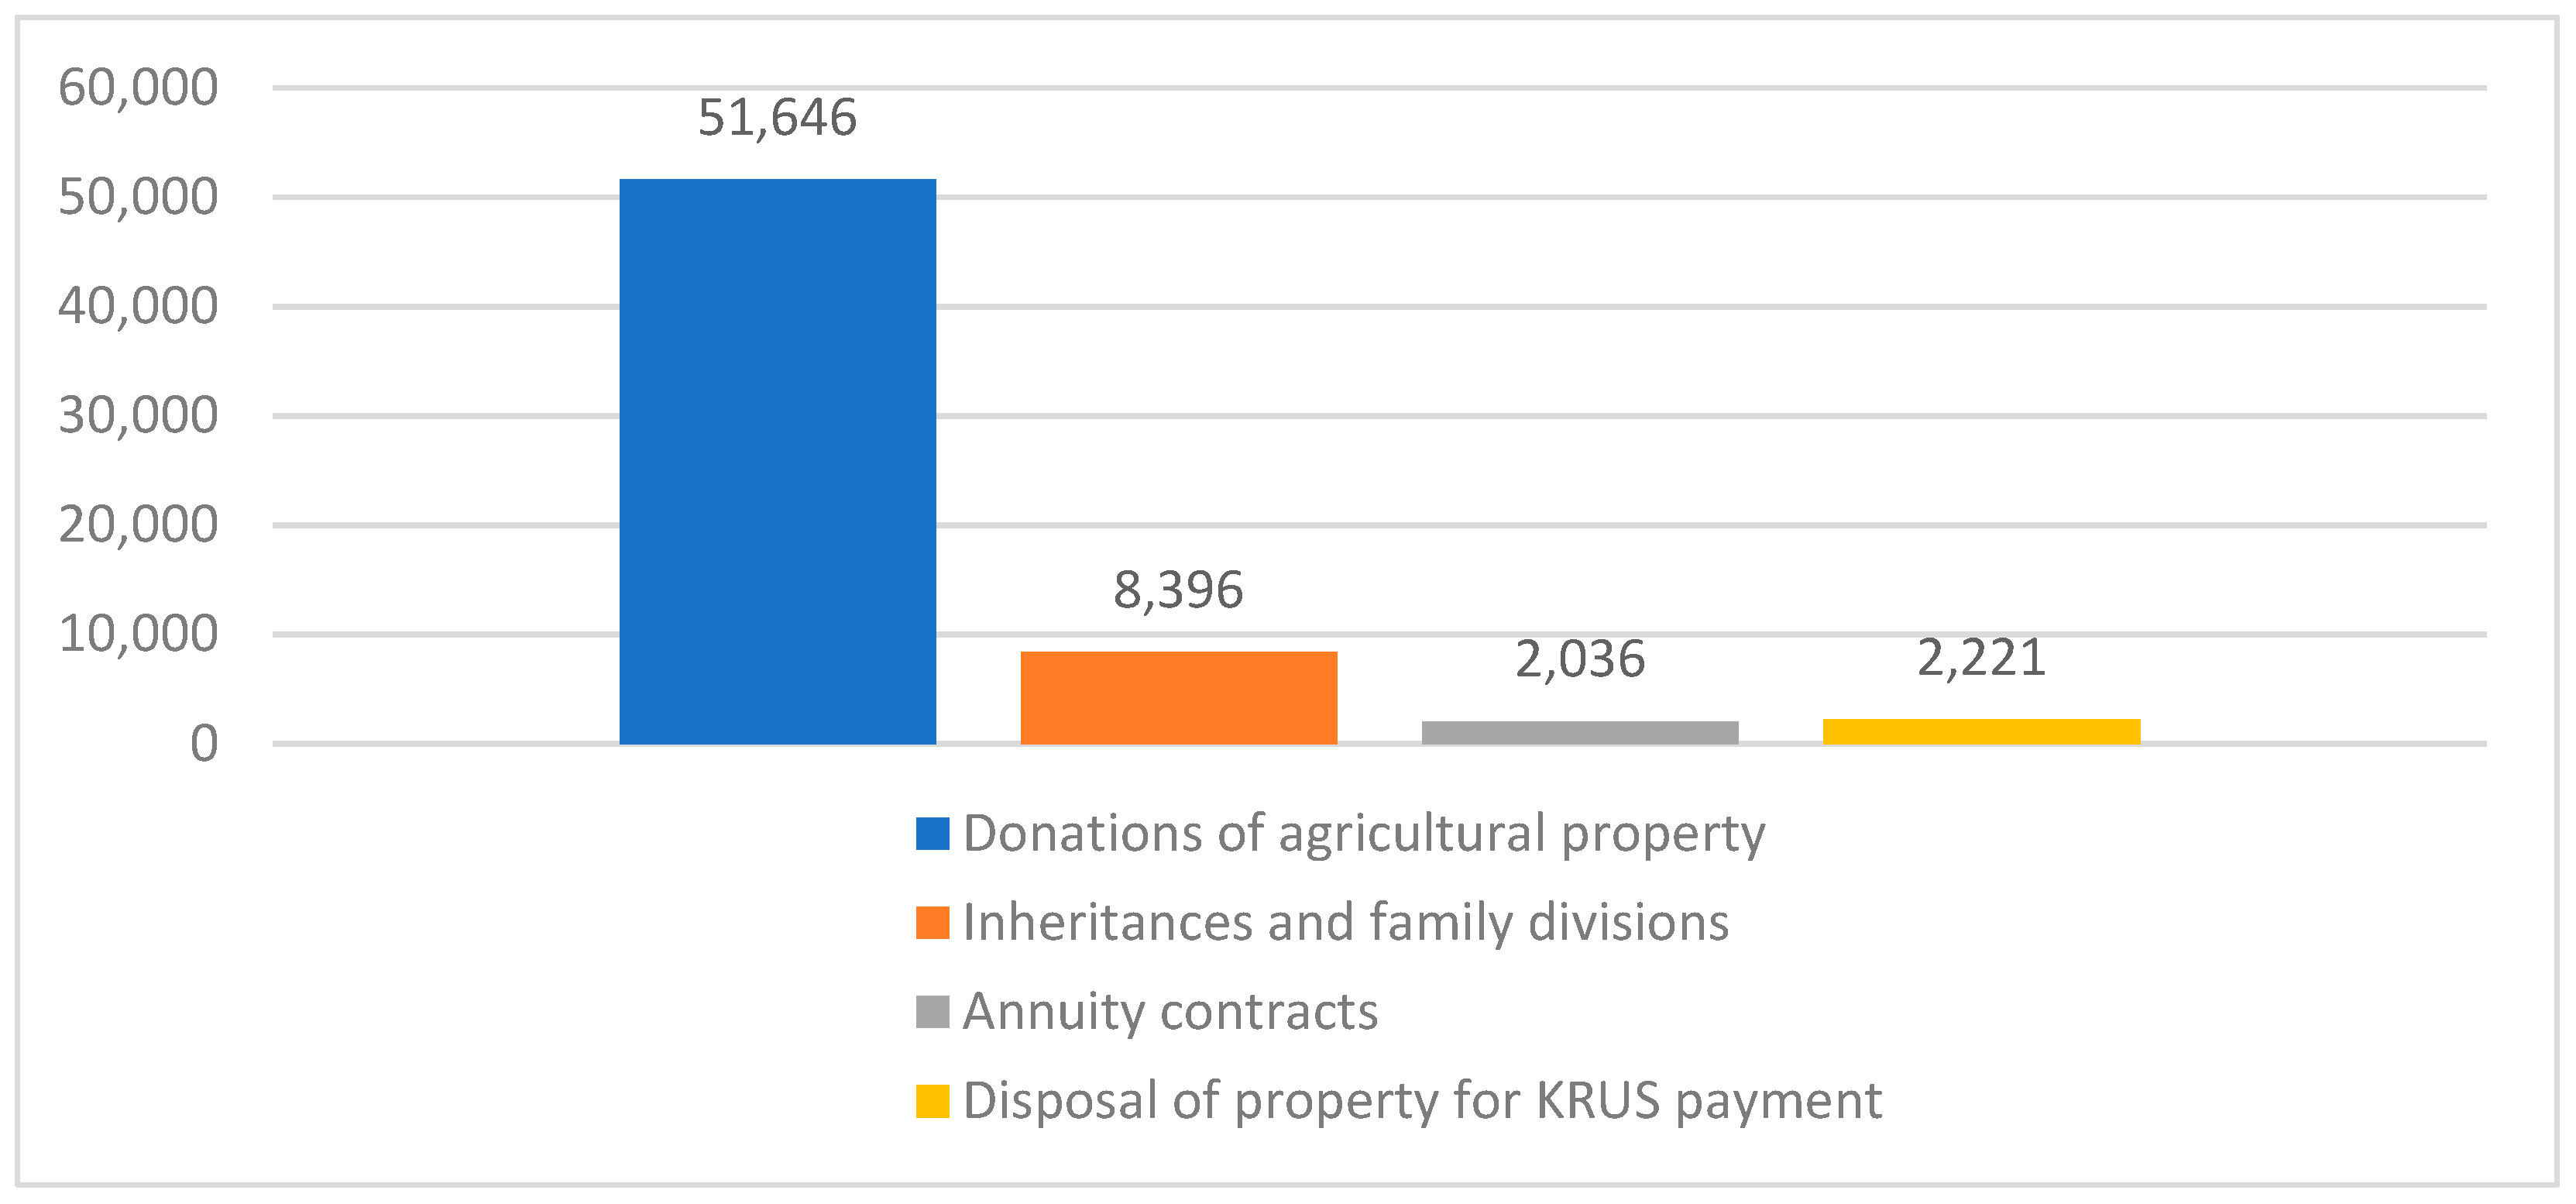
Figure 8 shows non-market agricultural land transactions in Poland from 2015 to 2023, recorded through notarial contracts. These include donations, inheritances, family divisions, annuity contracts, and KRUS-related retirements. The data highlight the dominant role of intra-family transfers in maintaining land continuity in rural areas.
Donations clearly dominate, with over 45,000 contracts annually and a peak of 61,261 in 2016. In 2023, there were still nearly 50,000, reflecting a continued preference for family-based succession. Inheritances and family divisions also increased—from 8159 in 2015 to 9983 in 2023—indicating greater legal formalization. Annuity contracts remained limited but rose from 1433 in 2018 to 2471 in 2023, reflecting Poland’s aging farming population. KRUS-related transfers fell sharply from 4808 in 2015 to just 161 in 2023 due to policy changes and fewer eligible farmers.
Non-market transactions consistently outnumber formal market sales, reinforcing ownership stability but contributing to fragmentation. As such, these transfers should be integrated into land governance policies. While they support generational renewal, accompanying them with advisory support and consolidation tools is essential to promote sustainable land use and structural modernization.
Figure 8 confirms the central role of informal mechanisms in Polish land circulation and the need for policies that balance tradition with transformation.
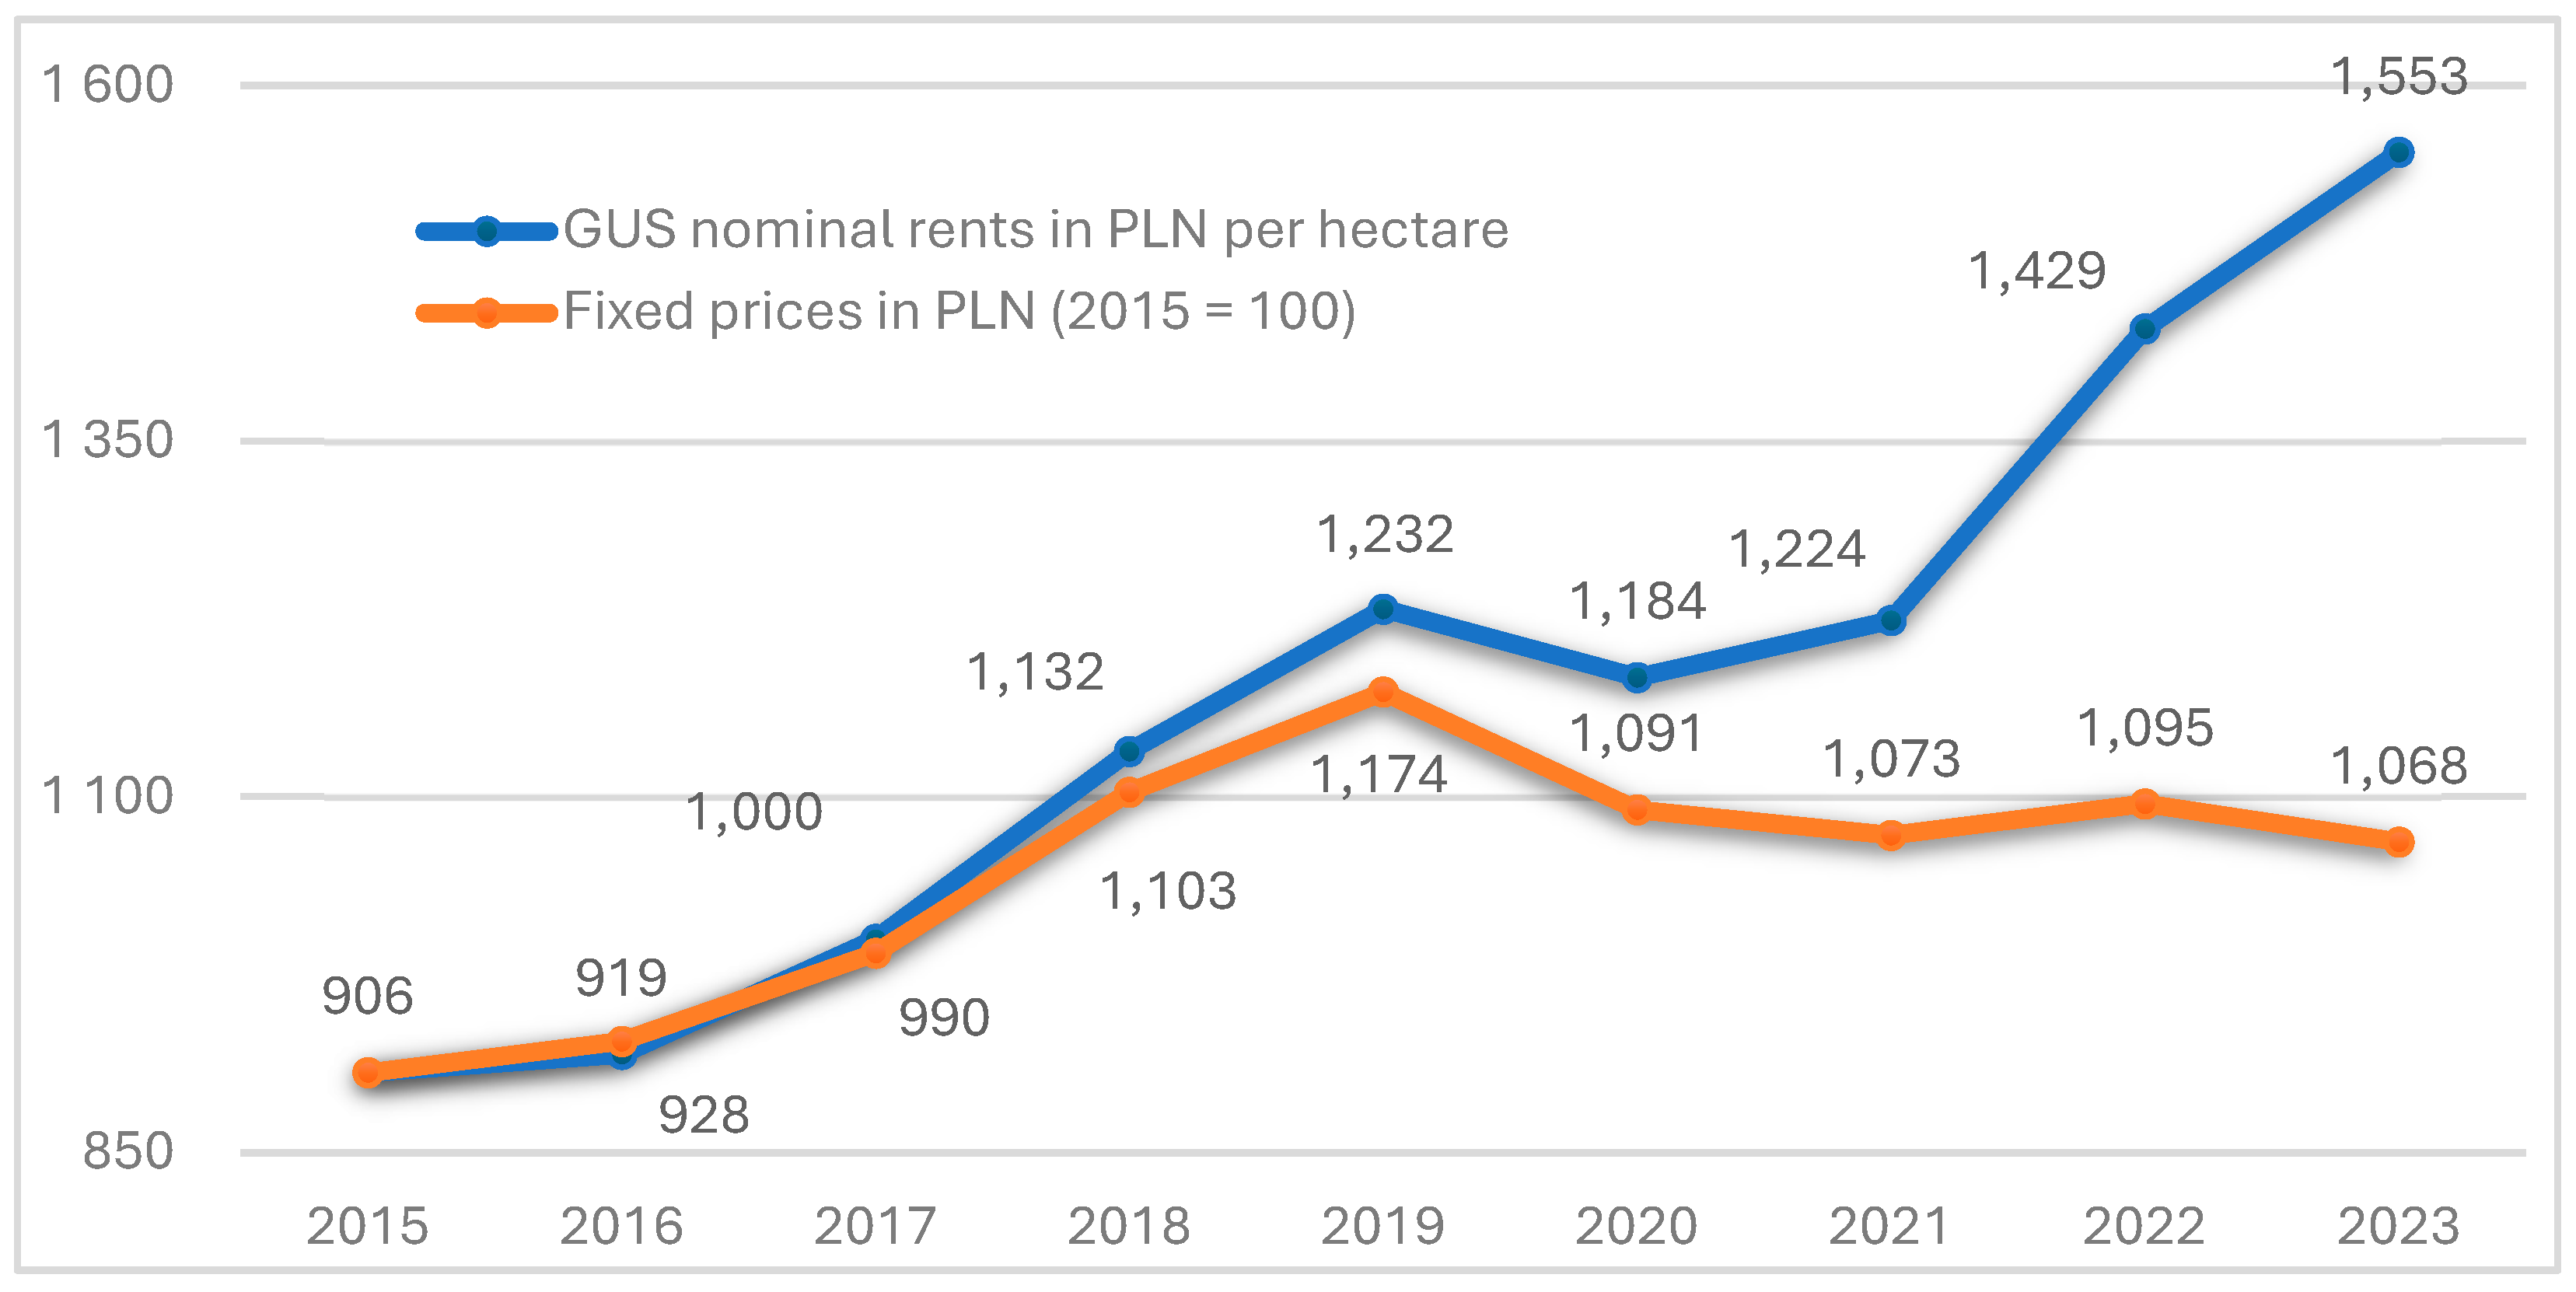
Figure 9 shows the evolution of average arable land rental rates in private transactions in Poland from 2015 to 2023, in both nominal and real (2015-adjusted) terms. The data reflect trends in the lease market shaped by inflation, agricultural profitability, and regional land demand.
Nominal rents rose steadily from PLN 906/ha in 2015 to PLN 1553/ha in 2023—a 71% increase—driven by strong growth in 2018, 2019, and 2022–2023. However, when adjusted for inflation, real rents peaked at PLN 1174/ha in 2019, then declined to PLN 1068/ha by 2023, indicating reduced purchasing power despite rising nominal costs.
These trends show land leasing is increasingly influenced by macroeconomic conditions. While large farms may absorb rising costs, smaller or newer farms may face greater barriers, especially where rents exceed subsidy levels, as in regions like Wielkopolskie or Kujawsko-Pomorskie.
Rising lease rates raise equity concerns and highlight the need for policy support, such as incentives for long-term leases, better monitoring of regional prices, and access schemes for young farmers.
Figure 9 confirms the central role of leasing in land access and the importance of maintaining affordability and sustainability in this growing market segment.
3.3. Results of Regression Analysis
The fixed effects panel regression identified several statistically and economically significant drivers of land prices. GDP per capita had a strong positive effect (β = +0.699, p < 0.001), indicating that wealthier regions exert upward pressure on land values, consistent with the idea of land as both a productive and speculative asset.
In contrast, Gross Value Added in Agriculture (GVA) and the Soil Quality Index (SQI) had significant negative effects (β = −2.698 and β = −6.241, respectively), suggesting that agriculturally intensive or high-soil-quality areas may be less attractive due to limited diversification, geographic peripherality, or weaker market integration. Agricultural Turnover Ratio (ATR) also showed a negative effect (β = −0.395, p < 0.001), possibly reflecting saturated markets or frequent low-value transactions.
Other variables—Population Density (PDN), Average Farm Size (AFS), Direct Payment Applications (DPA), and Agricultural Land Share (ALS)—were not statistically significant, though they may still influence land markets indirectly.
Overall, the model highlights the importance of regional development, market dynamics, and spatial factors in shaping land values, while also revealing counterintuitive patterns that call for broader policy interpretation and spatial analysis.
3.4. Spatial Dependence and the Justification for Spatial Modeling
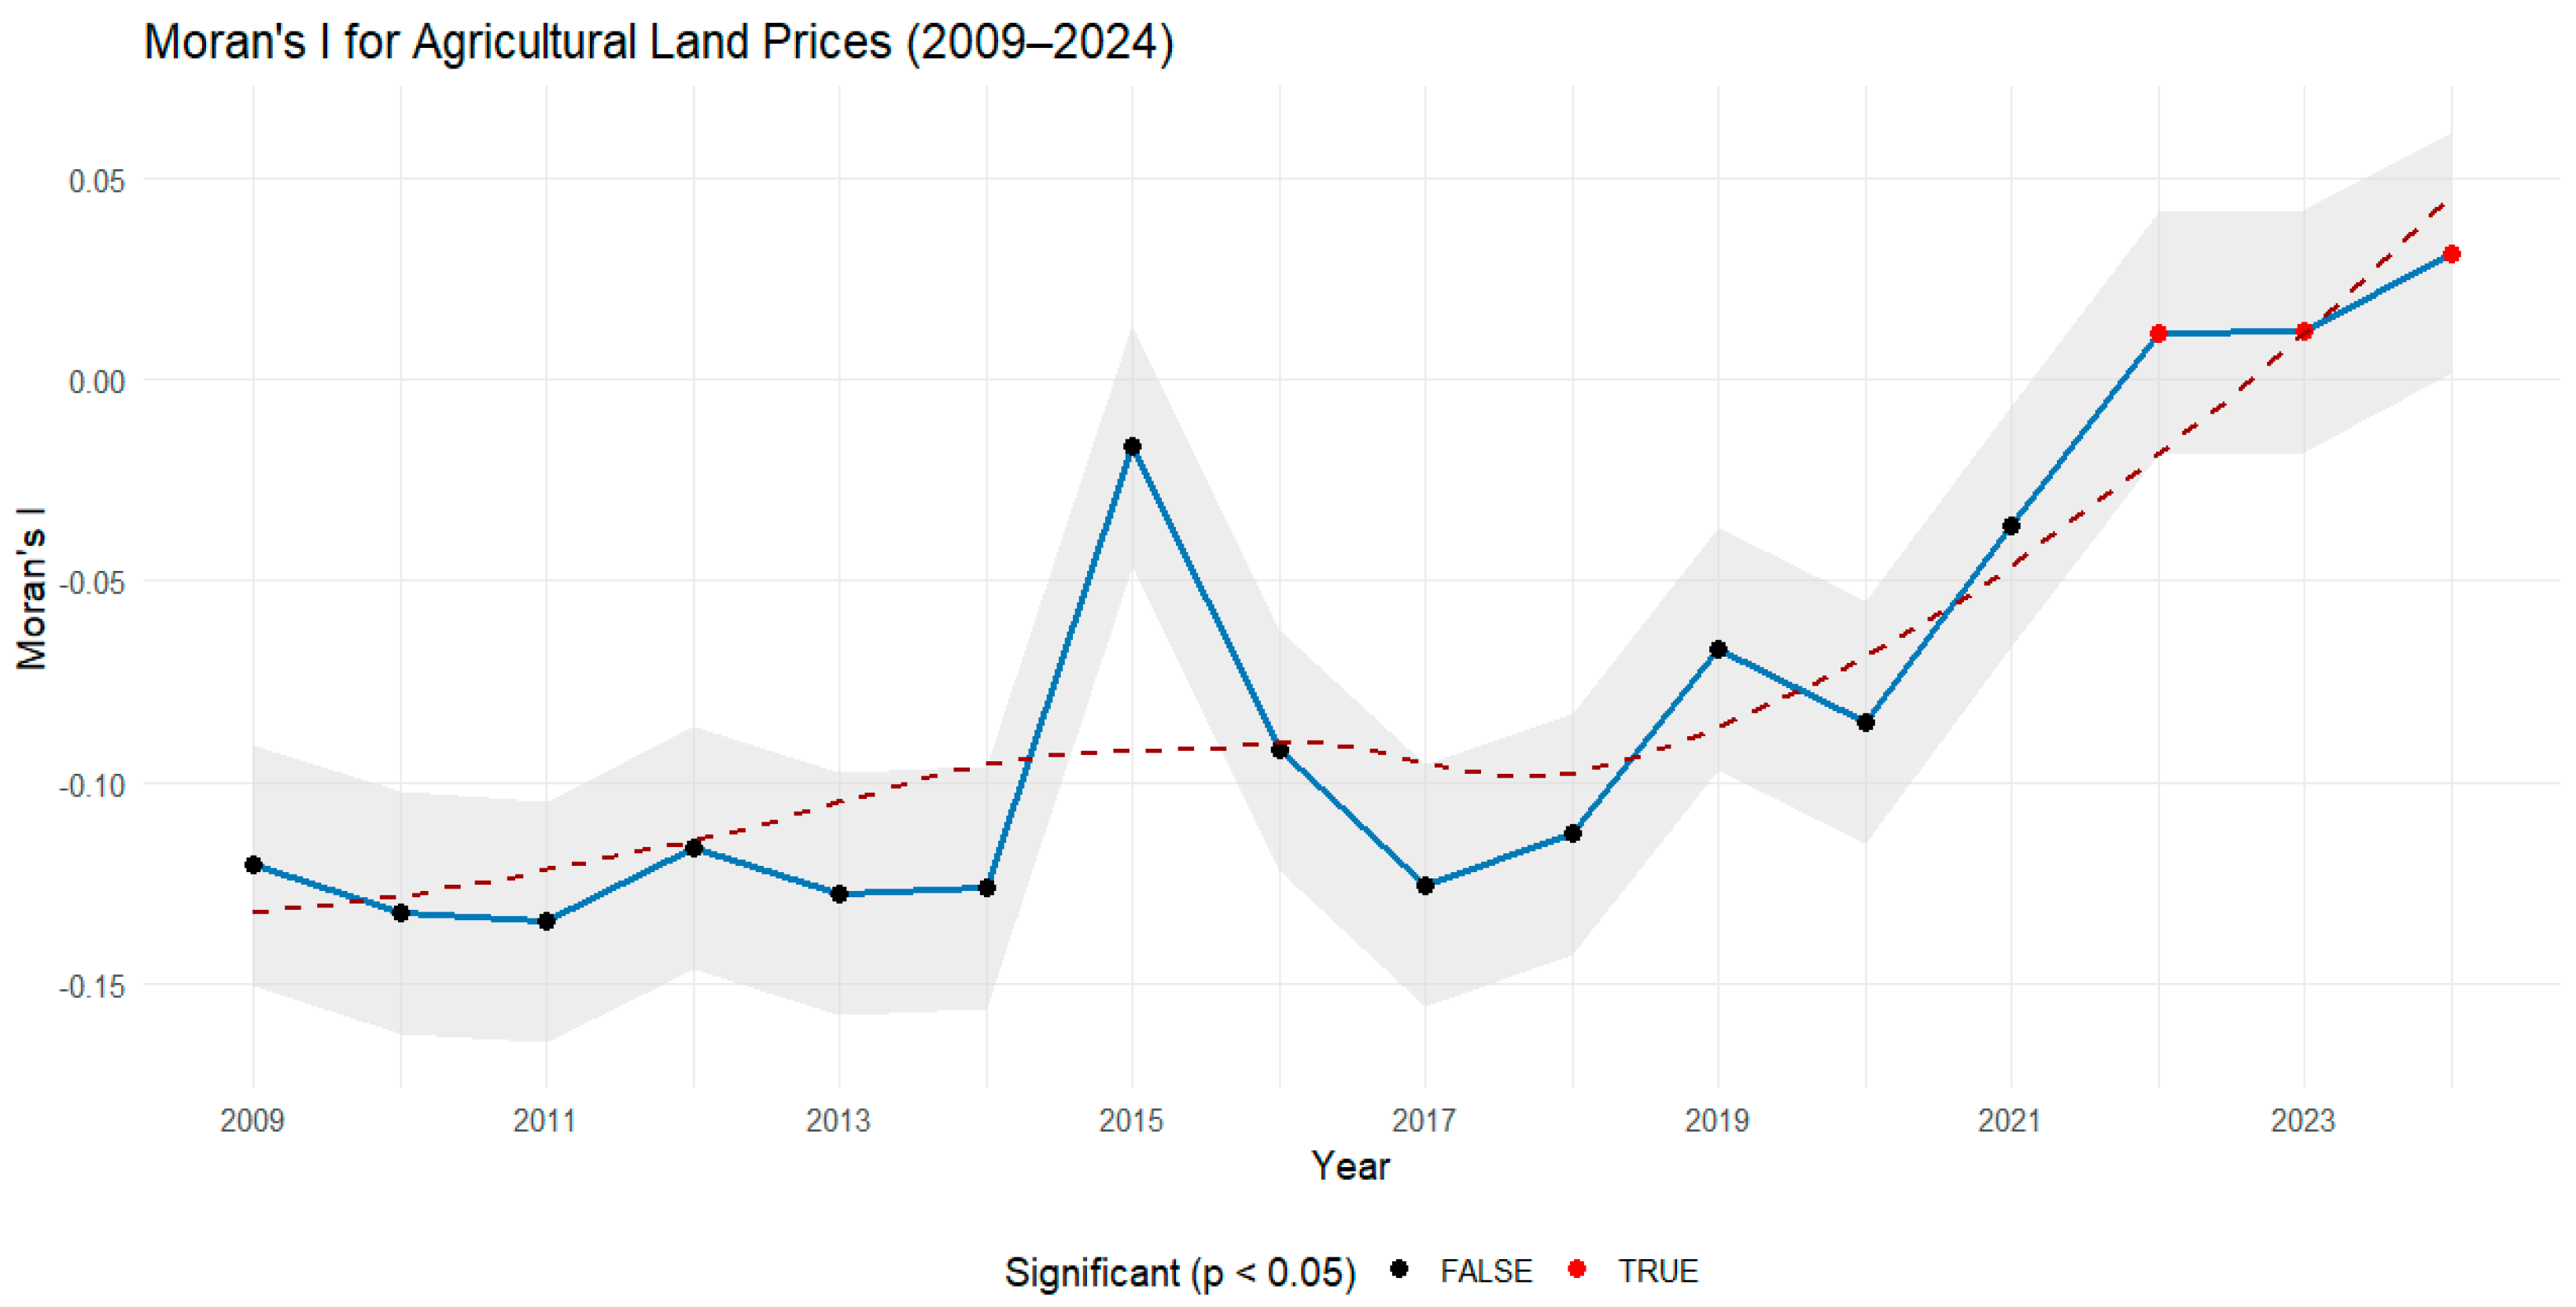
The investigation of agricultural land prices in Poland reveals an increasingly important role for spatial effects in explaining regional price dynamics. Analysis based on Moran’s I statistics (
Figure 10), computed annually from 2009 to 2024, indicates a notable temporal shift in the spatial structure of land markets. Between 2009 and 2014, Moran’s I values were consistently negative or near zero, with no statistically significant spatial autocorrelation. This pattern implied a spatially uncorrelated distribution of land prices, where high-price regions were not systematically surrounded by other high-price regions. However, from 2022 onwards, Moran’s I values turned positive and statistically significant, rising from 0.011 in 2022 to 0.031 in 2024, with
p-values below 0.01 in all years. This change signifies the emergence of spatial clustering, wherein regions with similar land price levels increasingly tend to cluster geographically.
This structural transformation reflects a growing spatial polarization or diffusion process in rural land markets, possibly due to the localized effects of agricultural investment, policy differentiation, or market consolidation. The emergence of significant spatial autocorrelation necessitates a departure from traditional panel regression models, which assume spatial independence. Instead, spatial econometric methods offer a more appropriate framework to account for interregional dependence and to avoid biased inference due to omitted spatial structure.
3.5. Estimation and Interpretation of Spatial Panel Models
To better understand spatial dynamics in land prices, three spatial panel models—SAR, SEM, and SDM—were estimated and compared to a fixed-effects baseline (
Table 3). The SAR model showed significant spatial dependence (λ = 0.53,
p < 0.001), meaning regional prices are influenced by neighboring values. The SEM model, capturing spatial autocorrelation in the error term, also found a weaker but significant effect (ρ = 0.26,
p = 0.0018).
The Spatial Durbin Model (SDM) delivered the most robust results by accounting for both spatial lags and spatial error. It produced strong spatial parameters (λ = 0.74, ρ = −0.74; both p < 0.001), confirming that regional land prices are shaped by both spillover effects and unobserved structural shocks.
Key coefficients align with earlier models: GDP per capita positively affects land prices, while GVA, SQI, ATR, and AFS show negative associations. These findings suggest that regions more specialized in agriculture or with better soils may have lower prices due to limited diversification or weak speculative demand. Other variables, such as population density or subsidy applications, were not significant.
The SDM outperformed other models by capturing both direct and indirect effects, improving model fit and explanatory power. Its flexibility makes it the most appropriate tool for analyzing spatial influences on agricultural land prices in Poland.
5. Conclusions
This study has examined the evolving structure, pricing dynamics, and institutional regulation of Poland’s agricultural land market in the context of sustainable development. Using a combination of empirical analysis—including econometric and spatial panel models—and theoretical synthesis, the paper demonstrates that land market behavior is shaped not only by economic fundamentals but also by regulatory frameworks, demographic pressures, and spatial spillover effects. Key findings confirm the dual nature of the Polish land system: a strong legal orientation toward protecting farmland and family farming, coupled with persistent structural challenges such as fragmentation, limited land availability, and uneven regional development.
Results from the robust fixed effects and Spatial Durbin Models reveal that regional economic prosperity (GDP per capita) exerts a strong positive influence on land prices, while higher agricultural intensity and superior soil quality are surprisingly associated with lower land values—likely reflecting market segmentation and limited non-agricultural demand in peripheral areas. In parallel, analysis of WRSP land turnover and lease structures highlights the strategic shift from privatization to controlled leasing, aimed at preserving agricultural use. However, the concentration of land access among established actors and the slow pace of land release risk undermining generational renewal and environmental adaptation.
The dominance of non-market land transfers—particularly donations and inheritances—reinforces the cultural and social foundations of family farming, but also limits land mobility and structural transformation. Without adequate support for land consolidation, modernization, and intergenerational planning, such transfers may perpetuate fragmentation and underinvestment. Strategic tools, such as advisory services and conditional support mechanisms, are therefore essential to enhance the sustainability potential of inherited or transferred land.
Looking ahead, future land policy must bridge the gap between tenure control and performance-based outcomes, incorporating ecological criteria, regional differentiation, and support for young and transitioning farmers. A national strategy that integrates land use with spatial planning, environmental monitoring, and CAP implementation would offer a more coherent foundation for balancing food security, climate goals, and rural equity. In this way, land governance can become a proactive instrument of sustainable development, ensuring that agricultural land remains both productive and resilient in the face of social, economic, and ecological change.


 ,
, 

