Article

Carbon Risk and Capital Mismatch: Evidence from Carbon-Intensive Firms in China

1
School of Economics and Management, Nanjing Tech University, Nanjing 211816, China
2
School of Economics and Management, Southeast University, Nanjing 211189, China
3
School of Business, Jiangsu Ocean University, Lianyungang 222005, China
*
Author to whom correspondence should be addressed.
Sustainability 2025, 17(14), 6477; https://doi.org/10.3390/su17146477
Submission received: 21 June 2025 / Revised: 13 July 2025 / Accepted: 14 July 2025 / Published: 15 July 2025
(This article belongs to the Special Issue Advances in Low-Carbon Economy Towards Sustainability)

Abstract

Emerging economies such as China have benefited from rapid growth but now face acute carbon risk amid worsening environmental conditions. Carbon-intensive firms—major emitters—face rising carbon risk that pervades operations and threatens efficient capital allocation. To advance global climate-change mitigation, help China meet its dual-carbon goals, and enhance corporate financial sustainability, we analyze panel data on 575 Chinese carbon-intensive companies from 2012 to 2022 and estimate OLS models to assess how carbon risk influences capital mismatch. Results show that higher carbon risk significantly widens capital mismatch, whereas higher media attention and better corporate governance each weaken this effect. These findings suggest that regulators and the media should monitor carbon-intensive firms more closely to improve information transparency and guide capital to its most productive uses, while firms themselves need to strengthen governance to limit the damage carbon risk inflicts on capital allocation.

1. Introduction

Efficient allocation of production factors is a key driver of firm-level productivity, whereas misallocation inevitably depresses total factor productivity (TFP) [1]. Empirical evidence shows that capital misallocation is widespread across countries and particularly acute in developing economies [2]. In China’s pursuit of rapid growth, substantial financial resources have been channeled to low-efficiency firms, exacerbating capital mismatch [3,4]. Such distortions not only erode individual firms’ TFPs but also create sector-level imbalances in investment and capacity [5], thereby hampering national economic performance [6]. Estimates suggest that eliminating these distortions could raise China’s aggregate TFP by 18–29% [7]. Recognizing this challenge, the Chinese government has called for a more market-oriented allocation of production factors and accelerated reforms of factor–price mechanisms [8]. At the micro level, enterprises—one of the core economic agents that both demand and deploy capital—must therefore prioritize improving capital-allocation efficiency and reducing mismatch, especially as carbon-intensive industries come under growing pressure from China’s “dual-carbon” targets.
As the world strives to limit global warming to well below 2 °C—as codified in the 2015 Paris Agreement, which has spurred more than 140 countries to announce net-zero pledges—China, the planet’s largest greenhouse-gas emitter, is under growing pressure to curb its emissions. After ratifying the Paris Agreement in 2016, China declared two headline climate targets in 2020: reaching a national carbon-emissions peak by 2030 and achieving carbon neutrality (net-zero emissions) by 2060. These commitments align China with the broader international agenda for peaking and then zeroing out emissions, signaling to both domestic and global stakeholders the country’s resolve to shoulder its share of climate responsibility. Growing attention from global policymakers to climate action and the low-carbon transition has likewise stimulated academic interest in carbon risk, prompting a wave of studies on the topic. Evidence now suggests, for example, that higher carbon risk raises corporate borrowing costs, especially for carbon-intensive firms [9], and that decarbonization policies depress the market valuations of such firms [10]. In addition, enterprises’ carbon risk exposures will also significantly impact their credit risks [11]. Capital mismatch refers to a persistent divergence between where capital actually flows and where it would generate the highest returns, often stemming from financial frictions or policy distortions. Because carbon risk inflates funding costs [10], shifts investor perceptions [12], and may trigger regulatory constraints [13], it plausibly diverts capital from its most efficient uses. While the scale and channels of this influence remain largely undocumented, it plausibly shifts capital away from its most productive uses and thus amplifies this mismatch. Yet the magnitude of this influence remains largely undocumented.
To close this gap, the present study empirically examines the impact of carbon risk on corporate capital mismatch and, in doing so, makes several important marginal contributions to the existing literature: (1) It substantially extends the understanding of the economic consequences of corporate carbon risk. As carbon risk has garnered increasing global attention, a growing body of research has explored its relationship with corporate investment [14], debt financing costs [15], and the cost of equity [16]. However, carbon risk, as a multifaceted risk affecting a wide range of stakeholders, may influence firms’ resource-allocation efficiency in multiple ways, ultimately resulting in different degrees of capital misallocation across firms. (2) This study also provides a valuable supplement to the literature on the determinants of capital misallocation. As a concept primarily rooted in corporate finance, capital misallocation has traditionally been explained through economic factors such as financing constraints [17], capital structure [18], financial frictions [19], and financial market concentration [20]. By innovatively examining the relationship between corporate carbon risk and capital misallocation, this study encourages the academic community to explore non-economic dimensions in order to more comprehensively understand the formation and mechanisms of capital misallocation. (3) Beyond simply integrating carbon risk and capital misallocation into a unified analytical framework, this study further investigates the moderating roles of media attention and corporate governance in this relationship. In doing so, it offers detailed policy implications for firms, governments, media, and other stakeholders to jointly advance the dual-carbon goals and improve the efficiency of capital allocation.
The rest of this paper is organized as follows. Section 2 presents a brief literature review. In Section 3, we systematically present the theoretical analysis and develop the relevant hypotheses. Section 4 outlines the research design, including the definition of variables, data, and empirical model. Section 5 discusses the results and discussion. In Section 6, we draw our conclusions, explore the study’s potential implications, and objectively discusses the study’s limitations.

2. Literature Review

2.1. Capital Mismatch

Resource mismatch refers to the non-efficient allocation of resource factors among sectors, caused by market mechanism barriers. Following the pioneering work of Restuccia and Rogerson (2008) and Hsieh and Klenow (2009) [21,22], a significant number of researchers have explored the causes of resource mismatch, such as adjusting costs [23], financial frictions [19], and demand uncertainty [24]. Since the adoption of the Decision of the 12th CPC Central Committee on Economic System Reform at the Third Plenary Session in 1984, which marked a comprehensive acceleration of China’s reform and opening-up, the country has achieved spectacular growth in both the pace and scale of its economy [25]. However, the “Chinese-style catch-up” model has also shown various drawbacks in recent years, including the problem of capital mismatch [26]. Instead of flowing from low- to high-return activities, resources are often channeled to under-performing regions, sectors, or firms, leaving more productive entities capital-constrained and dampening aggregate performance [27].
Consequently, researchers have undertaken extensive investigations into the drivers of capital misallocation in emerging economies such as China, arriving at a range of nuanced, multidimensional conclusions. First, policy distortions constitute a significant macroeconomic factor contributing to capital misallocation in China. Initial research indicated that anomalies in China’s capital markets may be ascribed to policies promoting investment in the state sector, thereby detracting from resources allocated to the more efficient non-state sector [28]. Subsequent research verifies that targeted industrial policies, fiscal subsidies, financial disincentives, administrative impediments to market entry, and loan bias from policy banks substantially intensify capital mismatches in China [29,30]. Second, diverse frictions within industries may lead to capital discrepancies at the meso level. The inefficient deployment of resources within China’s domestic manufacturing sector has resulted in a 15% disparity between actual and potential output [31]. The serious capital mismatch in China’s manufacturing industry caused by equity mismatch will be reduced by 18.06% and its carbon emissions will be reduced by 55.22% if the allocation is optimized [32]. Third, at the micro level, the differential interest rate system and local debt extension aggravated capital mismatches among firms. State-owned enterprises make loans based on regulated interest rates, while private enterprises make loans based on market interest rates [33]. The two interest rate approaches distort the capital allocation profile and lead to capital mismatches between firms. Meanwhile, the firms’ lack of liquidity and ability to pledge funds can also lead to capital mismatches [34]. For another example, environmental governance policies in China led to an increase in local debt and the degree of capital mismatch among firms is gradually deepening accordingly [35].

2.2. Carbon Risk

Carbon risk typically denotes the uncertainty that companies encounter when climate policies, technologies, and market anticipations transition towards a low-carbon economy [36]. Labatt and White (2011) were the first to specify its components in detail, distinguishing among regulatory, physical, and commercial risk [37]. Later studies refined the concept from different angles. Subramaniam et al. (2015) classified carbon risk into strategic, operational, compliance, reporting, and reputational categories [38]. In contrast, Gasbarro et al. (2017) expanded this classification to encompass shifts in customer demand, product and technological innovation, operational, and financial risks, in addition to the conventional regulatory, physical, and reputational aspects [39]. At the firm level, the worldwide shift toward a low-carbon economy obliges companies to manage new exposures arising from short-term policy uncertainty and the long-term evolution of clean-energy technologies. The combined political, technological, and regulatory volatility that threatens a company’s financial position and market value is collectively referred to as “carbon risk” [40].
Carbon risk shapes corporate decisions across financing, investment, and performance in mutually reinforcing ways. On the financing side, banks increasingly incorporate climate exposure into credit assessments, which raises borrowing costs and tightens access to capital, which are pressures that weigh heaviest on carbon-intensive firms [10,41]. These higher costs, together with growing policy uncertainty, translate into lower investment efficiency; firms with substantial emission intensity, for instance, earn markedly weaker post-issuance returns when they tap the bond market [42]. Carbon risk also reshapes real investment behavior: empirical evidence shows a contraction in overall capital spending [14] and a discernible tilt in cross-border M&A toward countries with laxer environmental rules, as firms seek to hedge regulatory exposure [43]. The repercussions for operating performance are more nuanced. Some studies argue that proactive emission-reduction strategies enhance a firm’s green image, fostering durable competitive advantages and ultimately improving both environmental and financial outcomes [44]. Others contend that high abatement costs undermine profitability, especially when firms lack complementary capabilities to monetize their low-carbon credentials [45].
Despite these extensive streams of research, the two literatures rarely intersect. Work on capital mismatch largely abstracts from climate-related uncertainties, whereas studies of carbon risk have focused on financing, investment, or performance but have not examined whether that risk distorts the allocation of capital itself. This omission leaves a critical gap at the nexus of low-carbon transition and resource allocation, which the present study addresses by linking firm-level carbon risk to capital mismatch and testing the moderating roles of media attention and corporate governance.

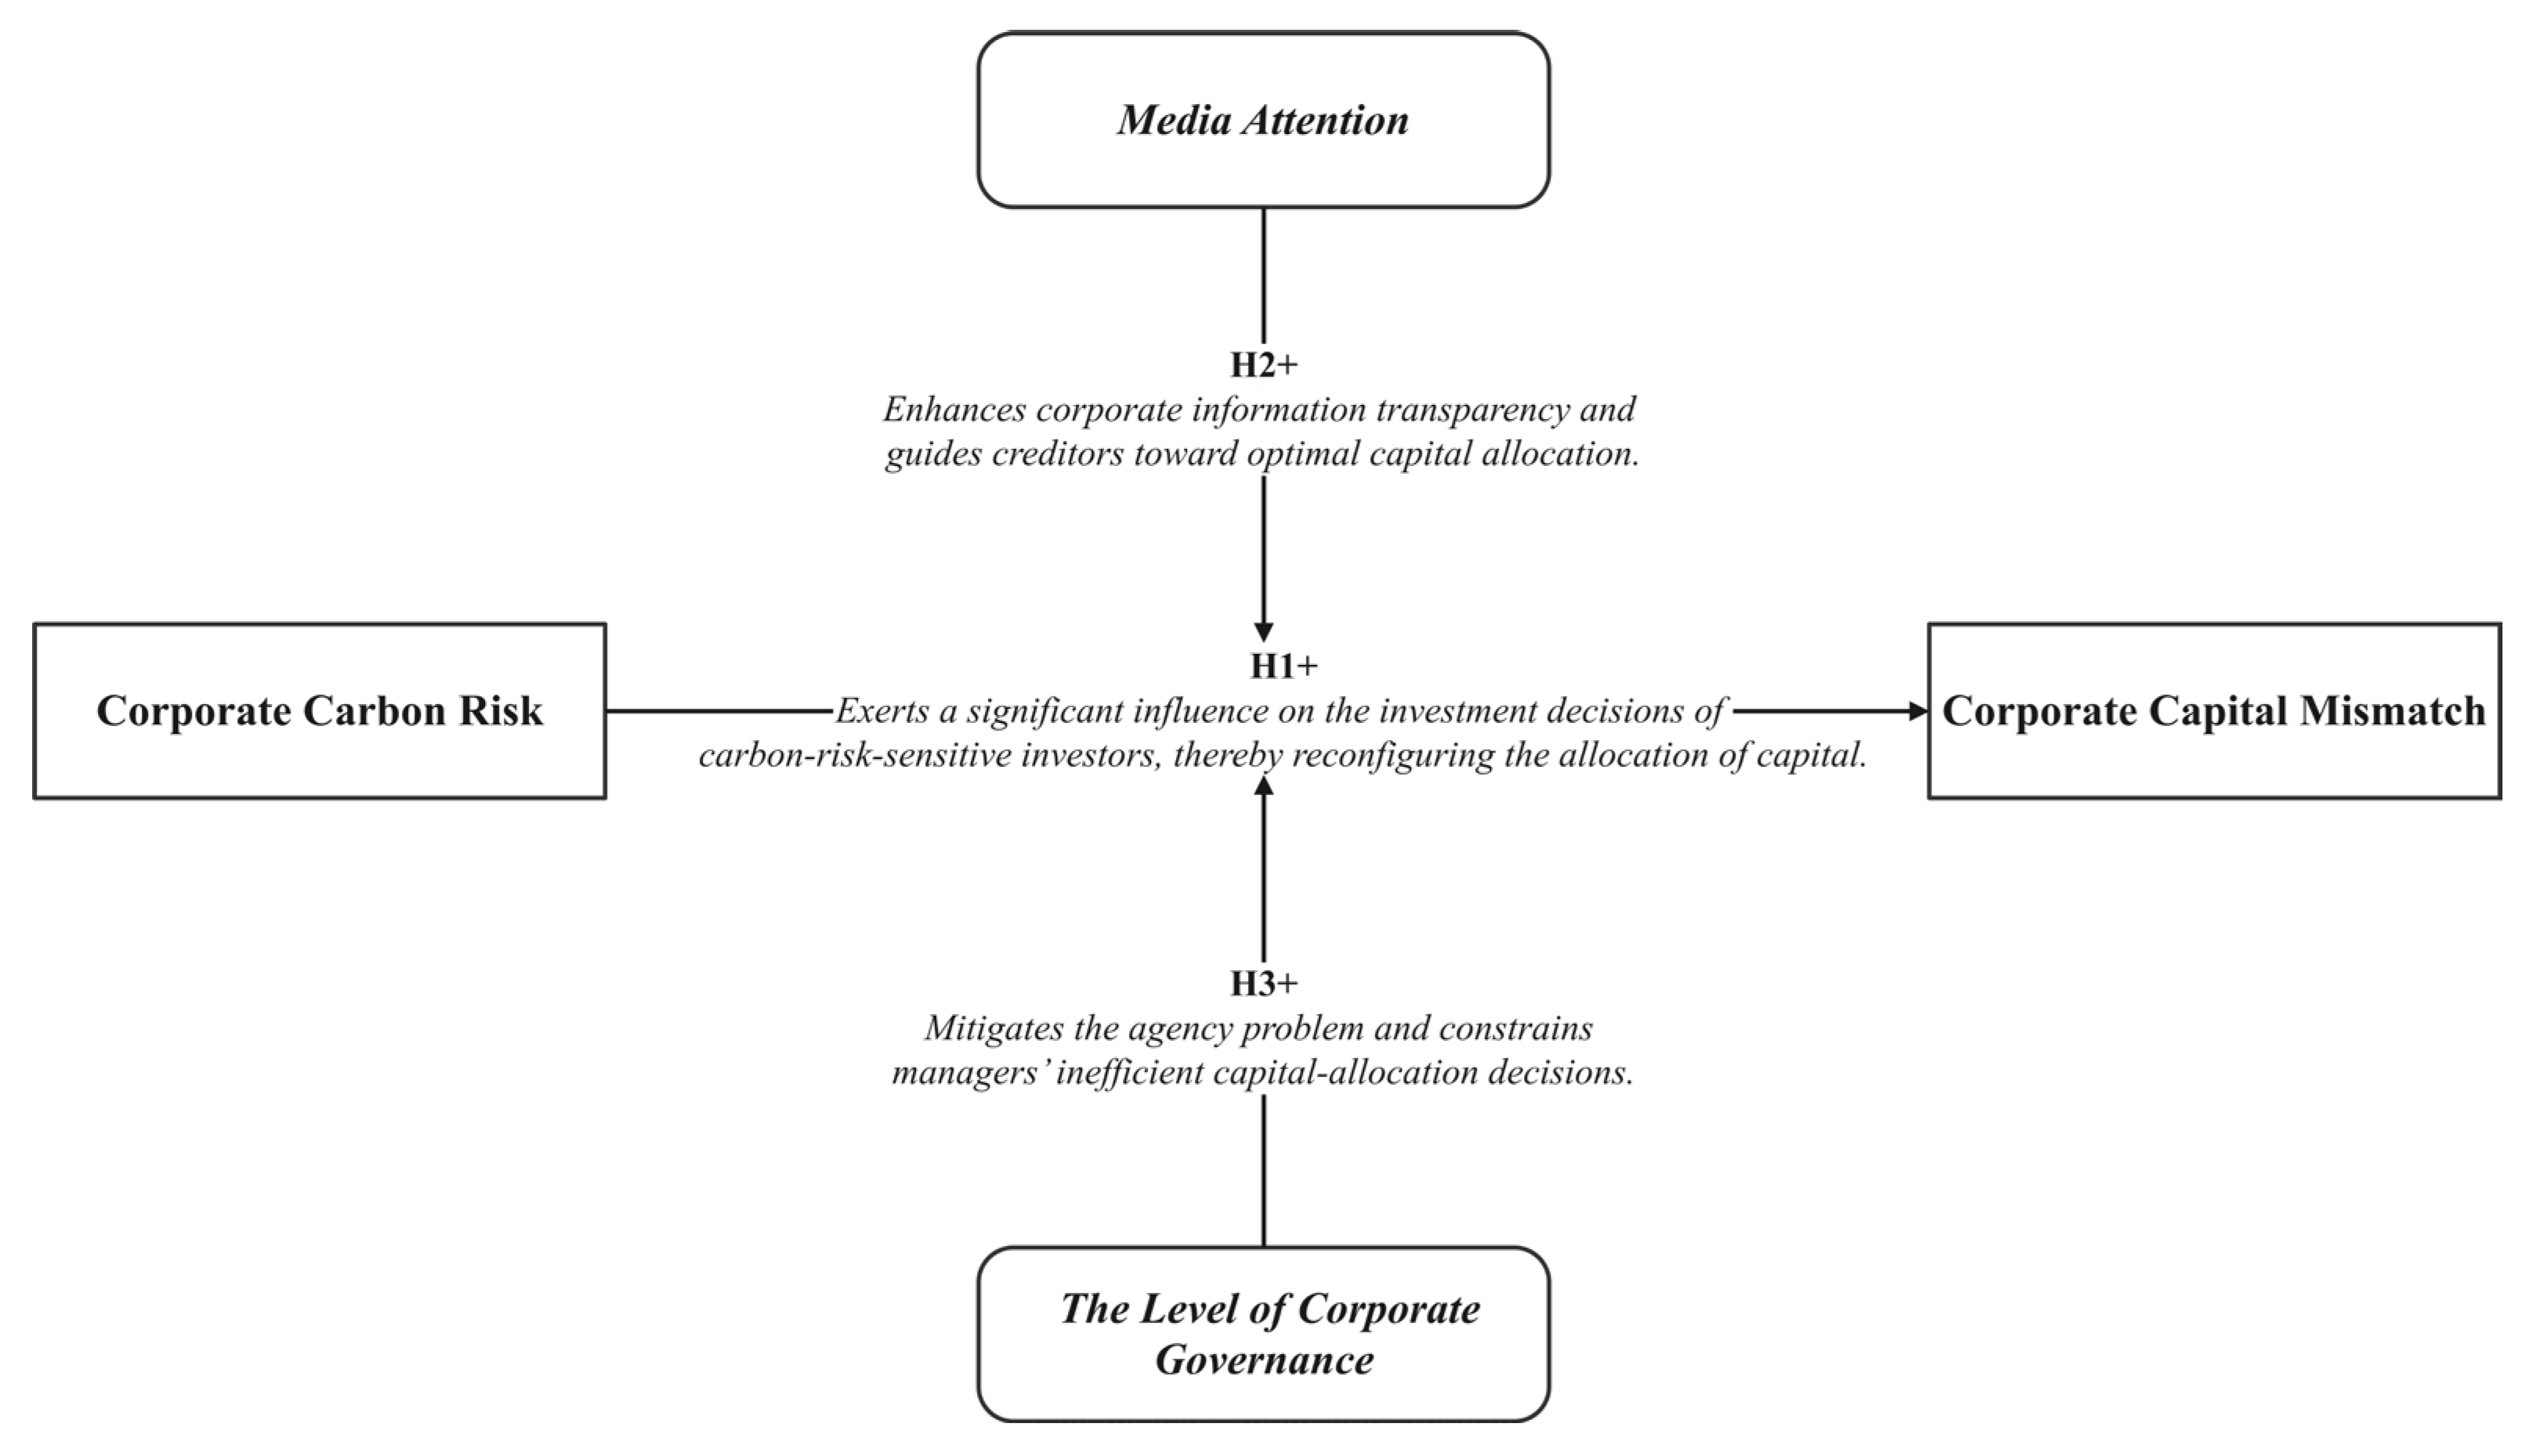
3. Theoretical Analysis and Research Hypotheses

3.1. The Impact of Carbon Risk on Capital Mismatch in Carbon-Intensive Firms

Agency problems may arise when capital providers and corporate managers disagree on carbon-related objectives [46]. Carbon risk is faced indirectly through lending activities by capital providers who expect companies to implement measures to reduce carbon risk [47]. However, firms that are more performance-oriented are likely to invest in more lucrative carbon-intensive projects. Should the carbon-intensive project succeed, shareholders will obtain the majority of the profits; conversely, if the project fails, the capital provider will incur most of the expenses. Despite the project’s success, the money provider may face reputational damage due to indirectly engaging in an environmentally detrimental initiative. Simultaneously, carbon risk threatens enterprises’ capital allocation via two mechanisms. In the corporate finance process, capital providers incorporate carbon risk into their loan decisions [41]. On the other hand, companies that have failed to borrow from banks often choose to finance themselves by issuing bonds. However, companies with high carbon intensity tend to earn low returns on bond issues [42]. The impacts of carbon risk heighten the uncertainty surrounding a corporation’s future cash flows, intensifying the agency problem between the capital provider and the firm, hence leading to a capital mismatch [48]. As the intensity of carbon regulation increases, capital providers increasingly incorporate corporate carbon risk into their credit decisions [49]. That is, creditors are more likely to determine their investment selections based on a firm’s carbon risk rather than its productivity. This leads to excessive capital flows to firms with low carbon risk, exacerbating capital mismatches between firms.
On this basis, the following hypothesis is formulated in this paper:
Hypothesis 1:
Carbon risk is positively associated with capital mismatch in carbon-intensive firms.

3.2. Moderating the Effects of Media Attention

Drawing on institutional theory and information asymmetry theory, this paper argues that media attention plays a crucial role in shaping the relationship between carbon risk and corporate capital misallocation. Institutional theory posits that firms operate under the influence of external institutional pressures, including social norms, regulations, and public scrutiny [50]. Within this context, the media has emerged as a powerful external governance force in capital markets. The external oversight mechanism suggests that media attention increases the visibility of corporate governance issues, thereby exerting normative pressure on firms to change their behavior, improve ESG performance, and ultimately reduce capital misallocation [51]. Moreover, early research grounded in institutional and reputation theory has shown that under conditions of information incompleteness, firms establish their reputations through long-term behaviors, which are essential for building trust and enduring stakeholder relationships [52]. The reputation mechanism emphasizes that media attention significantly influences corporate reputation, which in turn affects firms’ access to external financing. Financial institutions often consider reputation when making lending decisions, and well-reputed firms are more likely to secure financing [53]. Since corporate reputation often reflects underlying operational efficiency, the inflow of capital helps high-performing firms further optimize their capital allocation [54]. From the perspective of information asymmetry theory, the information dissemination mechanism (IDM) suggests that media coverage enhances corporate information’s transparency, thereby reducing the information gap between firms and capital providers [55]. Improved transparency allows creditors to make more informed investment decisions based on the firm’s actual performance, which can alleviate capital misallocation across firms [56]. In addition, heightened media attention can prompt greater disclosure of carbon-related information, thereby mitigating firms’ exposure to carbon risk shocks [57]. Based on the above mechanisms, we argue that media attention to firms’ carbon-related information operates through both governance and informational channels. On the one hand, media surveillance promotes corporate environmental responsibility, which reduces creditors’ perceived risk. On the other hand, authoritative media coverage enables stakeholders to access more complete and accurate carbon-related information at a lower cost, facilitating more effective investment decisions and efficient capital allocation.
On this basis, the following hypothesis is formulated:
Hypothesis 2:
Media attention attenuates the impact of carbon risk on capital mismatches in carbon-intensive firms.

3.3. Moderating the Effects of the Level of Corporate Governance

Drawing on the agency theory, this study argues that corporate governance plays a critical role in moderating the impact of carbon risk on capital misallocation. The agency theory asserts that conflicts of interest emerge when ownership and control are disaggregated, especially between shareholders and managers, as well as between shareholders and creditors [58]. This is especially relevant in the Chinese context, where many listed firms are restructured from former state-owned enterprises and continue to struggle with issues such as insider control, weak managerial accountability, and institutional inertia [59]. When firms are exposed to heightened carbon risk, managers—motivated by self-interest—may allocate capital inefficiently, pursuing projects that serve their personal goals rather than maximizing firm value [60]. This behavior increases the cost of capital and exacerbates capital misallocation [61]. In such cases, rather than responding effectively to external carbon-related shocks [62], poorly governed firms may worsen the inefficiency of capital allocation. A strong corporate governance system can help alleviate such agency problems. Effective governance mechanisms—such as independent boards, transparent decision-making processes, and accountability structures [63]—can constrain managerial discretion, reduce the incidence of moral hazard, and ensure that capital is allocated more efficiently [64].
Based on this theoretical foundation, the following hypothesis is proposed:
Hypothesis 3:
The level of corporate governance attenuates the impact of carbon risk on capital mismatches in carbon-intensive firms.
To provide a clear, intuitive overview of our research framework, we have visualized the relationships among the hypotheses and their underlying theoretical logic, as illustrated in Figure 1.

4. Research Design

4.1. Variable Selection

The dependent variable is the degree of capital mismatch between firms (Capmis). Two primary methodologies exist for assessing the extent of capital mismatch. One is to measure the dispersion of the marginal output of capital between firms [21]. Ideally, the marginal production of capital should be equal between firms. However, when certain firms can obtain credit resources at lower interest rates through government connections or other means, this can lead to a lower marginal output of capital for that firm than for other firms, ultimately leading to capital mismatch. The second technique assesses the degree to which the marginal output of capital diverges from the cost of capital utilization [65]. Both methods compare the extent to which the actual capital allocation position differs from the ideal one. The distinction lies in the former’s emphasis on quantifying the variability of the marginal production of capital among enterprises. The latter assesses the degree to which the marginal productivity of capital diverges from its utilization cost from the firm’s viewpoint, potentially indicating the significance of capital misallocation by micro-individuals. This study uses the second methodology to assess the degree of capital misalignment at the firm level. The extent of capital mismatch encountered by the firm is articulated as the degree of capital mismatch in accordance with the first-order criterion for profit maximization:
1 + τ i j = α i 1 α i ω L i j R K i j
where αi indicates industry capital output elasticity, 1 − αi indicates industry labor output elasticity, ω indicates employee wages, R indicates the cost of capital, Lij indicates labor, Kij indicates capital, ωLij indicates actual employee compensation paid by the enterprise, and ωLij/RKij indicates the ratio of a firm’s actual labor compensation to capital compensation. In the absence of capital mismatches, the ratio of labor compensation to capital compensation paid by a firm should be equal to the ratio of the elasticity of labor output to the elasticity of capital output in its industry, which is τij = 0. If there is a capital mismatch and the firm’s marginal output deviates from the cost of capital when the market clears; at this point τij ≠ 0. This paper uses ln(1 + τij) to measure the extent of firms’ capital mismatches (Capmis). The industry-level capital output elasticity αi is obtained based on the LP semiparametric estimation method.
For example, consider a firm operating in an industry whose capital–output elasticity is 0.40, implying a labor–output elasticity of 0.60. In the most recent fiscal year the firm paid RMB 150 million in wages (ωL) and incurred RMB 100 million in capital costs (RK, including interest and depreciation). Substituting these figures into Equation (1) gives 1 + τij = [αi/1 − αi] × (ωLij/RKij) = (0.40/0.60) × (150/100) = 0.667 × 1.5 = 1.00. Hence τij = 0, and the capital-mismatch indicator is Capmisij = ln(1 + τij) = 0, signaling an allocation close to the industry optimum. If the same firm had instead paid RMB 250 million in wages while its capital cost remained RMB 100 million, the ratio of labor to capital compensation would rise, yielding 1 + τij = 0.667 × 2.5 = 1.667; τij would then equal 0.667 and Capmisij = ln(1.667) ≈ 0.51, indicating a significant positive mismatch, where capital is over-deployed relative to the industry benchmark. Researchers can apply the same procedure—using firm-specific wage and capital-cost data along with the industry’s output elasticities—to determine whether capital allocation is misaligned and to gauge the extent of that mismatch.
The independent variable is carbon risk (Risk). Carbon risk is quantified by a company’s carbon intensity, defined as its CO2 emissions divided by its primary revenue (see to Equation (2) for specifics). Enterprise carbon dioxide emissions are estimated based on industry energy consumption, as indicated in Equation (3). The primary operating costs and overall energy consumption of the industry are sourced from the China Industrial Economic Statistics Yearbook and the China Energy Statistics Yearbook, respectively. According to the carbon dioxide calculation standard established by the Xiamen Energy Conservation Center, the conversion factor for 1 ton of standard coal is 2.493. Higher Risk ratings signify increased carbon risk.
R i s k = C a r b o n   d i o x i d e   e m i s s i o n s E n t e r p r i s e   m a i n   i n c o m e × 1,000,000
C a r b o n   d i o x i d e   e m i s s i o n s = E n t e r p r i s e   m a i n   c o s t I n d u s t r y   m a i n   c o s t × T o t a l   i n d u s t r y   e n e r g y   c o n s u m p t i o n × C a r b o n   d i o x i d e   c o n v e r s i o n   f a c t o r
The subsequent control variables are chosen at the firm level. Corporate size (Size), quantified by the logarithm of the firm’s total assets; CEO duality (Dual), assigned a value of 1 if the chairman also serves as CEO and 0 otherwise; shareholding concentration (Top1), quantified by the proportion of shares owned by the largest shareholder; profitability (ROA), defined as the ratio of net profit to total assets; the gearing ratio (Lev), defined as the proportion of a company’s total liabilities to its total assets; and corporate cash flow (Cashflow), defined as the ratio of net cash flow from operating activities to total profit. This paper also accounts for time-fixed and individual-fixed effects.
Moderating variables: Media attention (MA) is measured using the total number of carbon news stories. The total number of media reports was initially filtered through a subject search, utilizing the financial news database of Chinese listed companies. Then, the content of each report is analyzed. Finally, the relevant content is selected. Specifically, a story containing content related to carbon emissions, energy saving and emission reduction, low carbon production, low carbon investment, and/or environmental pollution is defined as carbon news. Corporate governance (Govern), a composite indicator of the level of corporate governance, was constructed. This was performed by synthesizing the eight indicators and finding linear combinations of the above variables based on principal component analysis. Ultimately, the first major principal component was selected as a measure of corporate governance level. The eight indicators comprise the combination of the two positions, the ratio of independent directors, the comparison of shares held by the board of directors and executives, the shareholding proportion of the largest shareholder, the size of both the board of directors and the supervisory board, and the total remuneration of the top three executives.
The variable definitions are detailed in Table 1.

4.2. Data Source

Carbon-intensive firms, as the main contributors to carbon emissions, exhibit suboptimal carbon performance, resulting in increased uncertainty in business operation [66]. In 2020, China’s National Development and Reform Commission (NDRC) identified six high-energy-consuming industries as critical carbon-intensive sectors: petroleum processing, coking and nuclear fuel processing; chemical raw materials and chemical product manufacturing; non-metallic mineral products; ferrous metal smelting and rolling processing; non-ferrous metal smelting and rolling processing; and electricity and heat production and supply. This study classifies carbon-intensive firms as those operating within those six specific industries.
The data used in this study are primarily obtained from the China Stock Market and Accounting Research (CSMAR) database, the China Industrial Economy Statistical Yearbook, and the China Energy Statistical Yearbook. In addition, firms’ primary business costs are manually collected from their annual reports. To mitigate the impact of idiosyncratic shocks and enhance the reliability of our findings, we aimed to cover the longest possible time span. However, due to the limited availability of sector-level energy consumption data, the final observation window is set to 2012–2022. The raw data were subsequently cleaned and filtered according to these principles: (1) firms with significant missing data that cannot be rectified were excluded and (2) firms under special treatment (ST) or at risk of delisting (*ST) due to irregular trading or operational issues were excluded. All continuous variables were winsorized at the 1% and 99% levels to reduce the influence of outliers on the results.
The final unbalanced panel dataset comprises 575 carbon-intensive listed firms, yielding a total of 4978 firm–year observations. Table 2 provides descriptive statistics for all variables employed in the subsequent analyses, facilitating an initial understanding of the relationship between carbon risk and capital mismatch.
As can be seen from Table 2, the mean capital mismatch among firms is 1.271, with minimum and maximum values of −1.188 and 4.071, respectively. The median is 1.278, suggesting that a majority of the sampled firms experience capital mismatch. The mean carbon risk is 1.309, while the median is 1.254, indicating that a majority of companies exhibit a carbon risk below the average level. A comparative analysis of the mean and median of media attention indicates that the majority of firms in the sample exhibit above-average media attention. This indicates that the Chinese media is paying much attention to corporate carbon news. The median level of corporate governance is negative, indicating that most firms need to improve the quality of their governance further.

4.3. Empirical Model

4.3.1. Baseline Regression Model

This study employs stepwise OLS regressions to examine the relationship between carbon risk and corporate capital mismatch.
First, the relationship between carbon risk and capital mismatch is tested according to Model (4):
C a p m i s i t = β 0 + β 1 R i s k i t + ε i t
where i denotes the firm and t denotes the year. The dependent variable Capmis is the degree of firms’ capital mismatch, the core independent variable Risk denotes the intensity of carbon risk, and ε is a random perturbation term. Further, the correlation between carbon risk and corporate capital mismatch is tested again after adding relevant control variables:
C a p m i s i t = β 0 + β 1 R i s k i t + β 2 C o n t r o l s i t + ε i t
Controls denotes the firm-level control variable, and the rest of the variables have the same meaning as in Model (4).
Finally, after controlling for both individual-fixed and year-fixed effects, a regression Model (6) is developed to test carbon risk’s impact on capital mismatches between firms:
C a p m i s i t = β 0 + β 1 R i s k i t + β 2 C o n t r o l s i t + δ i t + η i t + ε i t
where δi is an individual fixed effect, ηt is a year fixed effect, and the rest of the variables have the same meaning as in Model (5).

4.3.2. Moderating Effects Model

Based on Model (6), this paper introduces the cross-multiplier term of carbon risk and media attention to test the moderating effect of media attention on the relationship between carbon risk and corporate capital mismatch. Specifically, Model (7) is used for the test and is set as follows:
C a p m i s i t = β 0 + β 1 R i s k i t + β 2 M A i t + β 3 R i s k × M A i t + β 4 C o n t r o l s i t + δ i t + η i t + ε i t
where MA denotes media attention and the other variables have the same meaning as in Model (6).
To test the moderating effect of corporate governance level on the relationship between carbon risk and corporate capital mismatch, based on Model (6), this paper introduces the cross-multiplier term of carbon risk and media attention. Specifically, Model (5) is used for the test and is set as follows:
C a p m i s i t = β 0 + β 1 R i s k i t + β 2 G o v e r n i t + β 3 R i s k × G o v e r n i t + β 4 C o n t r o l s i t + δ i t + η i t + ε i t
Govern denotes the level of corporate governance, and the rest of the variables have the same meaning as in Model (6).

5. Empirical Results and Discussion

5.1. Baseline Regression Results

If a panel time series contains a unit root, subsequent analyses may suffer from spurious regression or spurious correlation, undermining the reliability of the results. Because this study employs an unbalanced short-panel dataset, we conduct panel unit-root tests using the Fisher-type method before running the baseline regressions. The test statistics (all significant at the 1% level) are as follows: Capmis, 1804.3487 ***; Risk, 1486.5431 ***; Size, 1648.0087 ***; Dual, 257.7531 ***; Top1, 2327.7105 ***; ROA, 2108.5937 ***; Lev, 1978.3351 ***; and Cashflow, 2625.7115 ***. The Fisher tests reject the null hypothesis of a unit root for all variables, indicating that each series is stationary in levels and can therefore be directly entered into the OLS regressions.
This paper first estimates Models (4)–(6) to empirically test Hypothesis 1. As shown in Table 3, the coefficients of carbon risk are significantly positive in both univariate and multiple regression tests. This indicates that carbon risk considerably intensifies the capital mismatch in carbon-intensive firms, thereby supporting Hypothesis 1. The total sample Model (6) test results show that the multiple regression coefficient of carbon risk (Risk) on capital mismatch (Capmis) of carbon-intensive firms is 0.055, which is significant at the 5% level after we include all controls and two-way fixed effects. Because Capmis is expressed in logarithms, this estimate implies that a one-unit increase in carbon risk raises the actual level of capital mismatch by approximately 5.6 percent (e0.055 − 1 ≈ 0.056). Put differently, for a representative carbon-intensive firm with an average capital stock of about RMB 5 billion, such a rise in carbon risk would translate into roughly RMB 28 million of capital being inefficiently deployed, highlighting the economic, not merely statistical, significance of the result.
Prior studies on climate change have concentrated significantly on the influence of stranded asset risk on capital allocation choices. These studies identify more serious stranding risks for carbon-intensive firms [67]. Based on the above analysis, this paper further establishes that carbon risk reduces the efficiency of corporate capital allocation and exacerbates capital mismatch. This presents a novel approach for organizations to enhance the effectiveness of capital allocation.

5.2. Moderating Effects Results

5.2.1. Media Attention

Model (7) is built to empirically test the moderating effect of media attention on the relationship between carbon risk and corporate capital mismatch. The regression results in Table 4 show that the coefficient of the interaction term between corporate carbon risk and media attention is significantly negative at the 5% level. This result provides robust empirical support for Hypothesis 2, confirming that media attention does dampen the positive association between corporate carbon risk and capital mismatch.
Media attention softens the negative effect of carbon risk on capital mismatch by working through three closely related channels. First, sustained public exposure keeps companies under constant watch and discourages managers from pursuing self-interested investments [68]. Second, the spotlight magnifies reputational differences, so firms that manage their environmental responsibilities well enjoy easier and cheaper access to capital, while poor performers face higher financing costs [69]. Third, frequent reporting makes carbon data more transparent, narrowing the information gap between firms and their creditors and investors and steering funds toward businesses that use resources more efficiently [70]. To harness these benefits, regulators should tighten climate-related disclosure rules and give journalists reliable access to environmental data. News organizations should provide ongoing coverage of high-carbon industries to maintain reputational pressure, and companies should publish clear, verifiable carbon information to lower financing risks and appeal to long-term investors. Together, these efforts can raise transparency, improve the way capital is allocated, and cushion firms against the shocks that come with rising carbon risk.

5.2.2. Corporate Governance Level

Model (8) is built to empirically test the moderating effect of corporate governance level on the relationship between carbon risk and corporate capital mismatch. Based on the results in columns (3) and (4) of Table 4, it can be seen that the coefficient of the interaction term between carbon risk and corporate governance level is significantly negative at the 1% level. These results strongly confirm that the level of corporate governance attenuates the impact of carbon risk on capital mismatches in carbon-intensive firms, thereby validating our previously proposed Hypothesis 3.
Corporate governance weakens the link between carbon risk and capital mismatch by curbing the agency problems that arise when managers control resources but do not bear the full consequences of their investment choices [71]. Strong boards, clear accountability structures, and transparent decision processes narrow the scope for self-interested projects, keep capital costs from spiraling under carbon stress, and steer funds toward higher-return uses [72]. For practice, this evidence suggests that carbon-intensive firms should reinforce board independence, tie executive pay to both decarbonization and capital-efficiency targets, and disclose governance arrangements in sufficient detail to reassure creditors and investors. Regulators, in turn, can promote these improvements by sharpening listing rules on board composition and by encouraging lenders to reward firms that meet higher governance standards with better borrowing terms.

5.3. Robustness Checks

To verify the robustness of the baseline results, we conducted three complementary checks: (i) replacing the measure of capital misallocation, (ii) adding province fixed effects, and (iii) shortening the sample period.
Column (1) of Table 5 reports the results using an alternative measure of capital misallocation. Because actual capital misallocation cannot be directly observed and must be estimated through modeling, different estimation approaches may yield divergent outcomes. We therefore recalculate the misallocation indicator with the Olley–Pakes (OP) method and re-estimate Model (6). Risk remains positively and significantly associated with Capmis, confirming that our main finding is not an artifact of any particular measurement approach.
To eliminate time-invariant regional heterogeneity, reduce endogeneity arising from omitted variables, and strengthen the reliability of the estimates, we introduce province fixed effects in column (2). The coefficient on Risk is 0.032 and remains significant at the 1% level, further attesting to the robustness of the baseline result.
Finally, to rule out potential bias arising from the selected research timeframe, we restrict the data to the 2014–2020 period and re-execute the regression in column (3). Although the level of significance declines from 1% to 5%, Risk continues to exhibit a positive and statistically significant effect on Capmis, indicating that our earlier conclusions remain reliable.

6. Research Conclusions, Implications, and Limitations

Based on summarizing previous research results, this paper empirically investigates the impact of carbon risk on corporate capital mismatch based on the panel data of 575 companies in China’s carbon-intensive industries from 2012 to 2022. The study found that carbon risk significantly exacerbates corporate capital mismatches. The results of the moderating effect tests indicate that both media attention and corporate governance level negatively moderate the process of carbon risk, exacerbating firms’ capital mismatch. The empirical results of our study hold consistently even after conducting a series of rigorous robustness tests.
This study refines the theoretical narrative surrounding corporate carbon risk along three interrelated dimensions. First, whereas prior work has largely focused on how carbon risk reshapes capital structure [73], financing costs [46], or investment intensity [14], we uncover a novel real-sector channel: rising carbon risk systematically exacerbates capital mismatch. By situating capital-allocation efficiency within the climate-risk framework, we provide richer empirical evidence on the economic consequences of carbon risk. Second, in contrast to mainstream explanations that attribute mismatch to financial frictions such as credit constraints [17], ownership concentration [74], or market power [1], we establish carbon risk as an independent—and salient—non-financial driver, thereby broadening the prevailing lens on the origins of resource misallocation. Third, our moderation analyses reveal that intensive media scrutiny and robust internal governance each markedly weaken the adverse effect of carbon risk on capital mismatch, offering fresh empirical support for agency-theory arguments that external information intermediaries and internal monitoring jointly discipline managerial investment choices. Taken together, the study bridges the climate–finance and capital-mismatch literature, highlights the pivotal roles of information and governance in shaping the economic fallout of carbon risk, and furnishes a unified micro-level perspective that has been largely absent from prior research.
Given that carbon risk markedly exacerbates capital mismatch in carbon-intensive firms—yet can be mitigated by strong media scrutiny and sound corporate governance—we offer the following integrated policy recommendations with broad international relevance. Government and regulatory authorities should embed carbon risk into financial-sector oversight and industrial policy by adopting harmonized, sector-specific carbon-accounting standards, strengthening disclosure requirements, and steering capital toward low-carbon, high-efficiency projects through preferential green-credit risk weights and dedicated transition-finance facilities at development or policy banks. Corporations, especially those in emission-intensive sectors, should establish board-level sustainability committees, tie executive compensation to both capital-allocation efficiency and decarbonization targets, deploy real-time carbon-risk dashboards to improve decision transparency, and draw on governance-advisory programs to reinforce internal controls. Across the information ecosystem, securities regulators and stock exchanges can mandate integrated climate–finance reporting in annual and interim filings, grant media outlets and ESG-rating agencies access to centralized emissions databases, and encourage the publication of industry-wide carbon-risk benchmarks and transparency indices that reward well-governed firms while penalizing laggards. Coordinated action on these three fronts will curb information asymmetry and agency costs, channel capital more efficiently, and accelerate the high-quality, low-carbon transition of carbon-intensive industries worldwide.
Objectively speaking, this study still has some limitations: First, our sample is drawn exclusively from China, an emerging economy whose listed firms, managerial practices, and environmental-regulatory framework possess distinctive features, even as the country strives to align with global climate norms. These idiosyncrasies may limit the portability of our policy recommendations to other jurisdictions. Future research should therefore test the robustness of our findings in a cross-country setting, particularly by contrasting advanced and developing economies. Second, we employ OLS regressions to establish the relationship between carbon risk and capital mismatch, a method that is statistically parsimonious and reliable but inevitably abstracts from the complexity of real-world decision-making. Subsequent work could complement our approach with in-depth sectoral or firm-level case studies, offering practitioners more nuanced, context-specific guidance on how to pursue low-carbon transitions while improving capital-allocation efficiency. Finally, measuring carbon risk (Risk) in this study requires an estimate of firm-level carbon dioxide emissions. Because direct emission figures are generally unavailable for Chinese companies, we follow Liu et al. (2025) and approximated each firm’s carbon output by multiplying its share of industry operating costs by the sector’s total energy consumption and the standard coal-to-CO2 conversion factor [75]. However, in reality, as China’s environmental regulations continue to tighten, many firms may have already taken the lead in initiating low-carbon transitions, resulting in carbon emissions that are not always proportional to their primary operating costs. This may introduce measurement bias in the assessment of Risk. Therefore, it is recommended that future researchers seek to obtain firm-level, precise CO2 emissions data or further refine the method for measuring carbon risk.

Author Contributions

Conceptualization, S.Z. and C.Z. (Changjiang Zhang); methodology, S.Z. and C.Z. (Chunyan Zhao); software, S.Z. and C.Z. (Chunyan Zhao); validation, C.Z. (Changjiang Zhang) and B.H.; formal analysis, S.Z.; investigation, S.Z. and C.Z. (Chunyan Zhao); data curation, S.Z. and C.Z. (Chunyan Zhao); writing—original draft preparation, S.Z.; writing—review and editing, C.Z. (Changjiang Zhang) and all authors; supervision, C.Z. (Changjiang Zhang) and B.H.; and funding acquisition, C.Z. (Changjiang Zhang). All authors have read and agreed to the published version of the manuscript.

Funding

This work was supported by the National Social Science Fund of China (grant number 19AGL009); and the Jiangsu Province Postgraduate Scientific Research Innovation Project (grant number KYCX24_1655).

Institutional Review Board Statement

Not applicable.

Informed Consent Statement

Not applicable.

Data Availability Statement

The data presented in this study are available on request from the corresponding author.

Acknowledgments

The authors are grateful to the editors, as well as the anonymous reviewers for valuable suggestions and comments that helped us improve our paper significantly.

Conflicts of Interest

The authors declare that they have no known competing financial interests or personal relationships with other people or organizations that could have appeared to influence the work reported in this paper.

References

  1. Zhang, S.; Luo, J.; Huang, D.-H.; Xu, J. Market distortion, factor misallocation, and efficiency loss in manufacturing enterprises. J. Bus. Res. 2023, 154, 54. [Google Scholar] [CrossRef]
  2. Wang, S.; Tian, W.; Lu, B. Impact of capital investment and industrial structure optimization from the perspective of “resource curse”: Evidence from developing countries. Resour. Policy 2023, 80, 103276. [Google Scholar] [CrossRef]
  3. Wei, C.; Li, C.-Z. Resource misallocation in Chinese manufacturing enterprises: Evidence from firm-level data. J. Clean Prod. 2017, 142, 837–845. [Google Scholar] [CrossRef]
  4. Wang, S.; Zhao, D.; Chen, H. Government corruption, resource misallocation, and ecological efficiency. Energy Econ. 2020, 85, 104573. [Google Scholar] [CrossRef]
  5. Jin, L.; Dai, J.; Jiang, W.; Cao, K. Digital finance and misallocation of resources among firms: Evidence from China. N. Am. J. Econ. Financ. 2023, 66, 101911. [Google Scholar] [CrossRef]
  6. Li, Y.; Ji, Q.; Wang, Z.; Xiong, Z.; Zhan, S.; Yang, Y.; Hao, Y. Green energy mismatch, industrial intelligence and economics growth: Theory and empirical evidence from China. Environ. Dev. Sustain. 2022, 24, 11785–11816. [Google Scholar] [CrossRef]
  7. Tang, L. Investment dynamics and capital distortion: State and non-state firms in China. J. Asian Econ. 2021, 73, 101274. [Google Scholar] [CrossRef]
  8. Wu, J.; Lu, W.; Li, M. A DEA-based improvement of China’s green development from the perspective of resource reallocation. Sci. Total Environ. 2020, 717, 137106. [Google Scholar] [CrossRef]
  9. Cumming, D.; Duppati, G.; Fernando, R.; Singh, S.P.; Tiwari, A.K. Dynamics of carbon risk, cost of debt and leverage adjustments. Br. Account. Rev. 2025, 57, 101353. [Google Scholar] [CrossRef]
  10. Zhu, B.; Zhao, Y. Carbon risk and the cost of bank loans: Evidence from China. Technol. Forecast. Soc. Change 2022, 180, 121741. [Google Scholar] [CrossRef]
  11. Capasso, G.; Gianfrate, G.; Spinelli, M. Climate change and credit risk. J. Clean Prod. 2020, 266, 121634. [Google Scholar] [CrossRef]
  12. Bolton, P.; Kacperczyk, M. Do investors care about carbon risk? J. Financ. Econ. 2021, 142, 517–549. [Google Scholar] [CrossRef]
  13. Deng, W.; Liu, L. Comparison of carbon emission reduction modes: Impacts of capital constraint and risk aversion. Sustainability 2019, 11, 1661. [Google Scholar] [CrossRef]
  14. Phan, D.H.B.; Tran, V.T.; Ming, T.C.; Le, A. Carbon risk and corporate investment: A cross-country evidence. Financ. Res. Lett. 2022, 46, 102376. [Google Scholar] [CrossRef]
  15. Jung, J.; Herbohn, K.; Clarkson, P. Carbon Risk, Carbon Risk Awareness and the Cost of Debt Financing. J. Bus. Ethics 2018, 150, 1151–1171. [Google Scholar] [CrossRef]
  16. Arian, A.G.; Sands, J. Do corporate carbon emissions affect risk and capital costs? Int. Rev. Econ. Financ. 2024, 93, 1363–1377. [Google Scholar] [CrossRef]
  17. Piao, Z.; Wu, C.; Su, N.; Lin, Y.; Zheng, Z. Financial constraints, capital misallocation and firm’s total factor productivity (TFP) loss—Empirical evidence from listed manufacturing companies in China. Appl. Econ. 2023, 55, 4572–4585. [Google Scholar] [CrossRef]
  18. Uras, B.R. Corporate financial structure, misallocation and total factor productivity. J. Bank Financ. 2014, 39, 177–191. [Google Scholar] [CrossRef]
  19. Xiao, W.; Deng, Q.; Yuan, W.; Wu, N. Financial frictions, capital misallocation, and total factor productivity: Evidence from China. Appl. Econ. 2023, 55, 4853–4870. [Google Scholar] [CrossRef]
  20. Neuhann, D.; Sockin, M. Financial market concentration and misallocation. J. Financ. Econ. 2024, 159, 103875. [Google Scholar] [CrossRef]
  21. Klenow, H.C.-T.P.J. Misallocation and Manufacturing TFP in China and India. Q. J. Econ. 2009, 124, 1403–1448. [Google Scholar] [CrossRef]
  22. Restuccia, D.; Rogerson, R. Policy distortions and aggregate productivity with heterogeneous establishments. Rev. Econ. Dyn. 2008, 11, 707–720. [Google Scholar] [CrossRef]
  23. Asker, J.; Collard-Wexler, A.; De Loecker, J. Dynamic Inputs and Resource (Mis)Allocation. J. Political Econ. 2014, 122, 1013–1063. [Google Scholar] [CrossRef]
  24. Belloni, A.; Lopomo, G.; Wang, S. Resource Allocation Under Demand Uncertainty and Private Information. Manag. Sci. 2017, 63, 4219–4235. [Google Scholar] [CrossRef]
  25. Wang, H. China’s Economic System Reform (1978–2018); Springer: Berlin/Heidelberg, Germany, 2024. [Google Scholar]
  26. Wu, G.L. Capital misallocation in China: Financial frictions or policy distortions? J. Dev. Econ. 2018, 130, 203–223. [Google Scholar] [CrossRef]
  27. Hao, Y.; Gai, Z.Q.; Wu, H.T. How do resource misallocation and government corruption affect green total factor energy efficiency? Evidence from China. Energy Policy 2020, 143, 111562. [Google Scholar] [CrossRef]
  28. Brandt, L.; Tombe, T.; Zhu, X. Factor market distortions across time, space and sectors in China. Rev. Econ. Dyn. 2013, 16, 39–58. [Google Scholar] [CrossRef]
  29. Huang, X.L.; Ge, P.F.; Zhou, B.L. Selective industrial policy and capital misallocation: Evidence from the ‘Revitalization Plan for Ten Industries’ in China. J. Asia Pac. Econ. 2024, 29, 206–236. [Google Scholar] [CrossRef]
  30. Sun, C.; Zhan, Y.; Du, G. Can value-added tax incentives of new energy industry increase firm’s profitability? Evidence from financial data of China’s listed companies. Energy Econ. 2020, 86, 104654. [Google Scholar] [CrossRef]
  31. Chen, R.; Wu, L. Calculation and analysis of the efficiency of resource allocation for technological innovation in China. PLoS ONE 2024, 19, e0308960. [Google Scholar] [CrossRef]
  32. Li, S.; Huifang, E.; Wang, L.; Xue, H. Factor Misallocation and Optimization in China’s Manufacturing Industry. Sustainability 2023, 15, 4279. [Google Scholar] [CrossRef]
  33. Chen, S.Y.; Lin, B. Dual-track interest rates and capital misallocation. China Econ. Rev. 2019, 57, 101338. [Google Scholar] [CrossRef]
  34. Piao, Z.F.; Jia, J.N.; Shen, F.Y.; Chen, R.D. Research of Microcosmic Affection Factors on Capital Misallocation: A Case of Chinese Listed Companies. Math. Probl. Eng. 2016, 2016, 8921418. [Google Scholar] [CrossRef]
  35. Deng, G.J.; Zhou, C.W.; Wang, D.X.; Zhou, W.H. Local government debt, resource misallocation, and green total factor productivity in China. Front. Environ. Sci. 2023, 11, 1257912. [Google Scholar] [CrossRef]
  36. Hoffmann, V.H.; Busch, T. Corporate Carbon Performance Indicators—Carbon Intensity, Dependency, Exposure and Risk. J. Ind. Ecol. 2008, 12, 505–520. [Google Scholar] [CrossRef]
  37. Labatt, S.; White, R.R. Carbon Finance: The Financial Implications of Climate Change; John Wiley & Sons: New York, NY, USA, 2011. [Google Scholar]
  38. Subramaniam, C.; Watson, M. Additional evidence on the sticky behavior of costs. Adv. Manag. Account. 2016, 26, 275–305. [Google Scholar]
  39. Gasbarro, F.; Iraldo, F.; Daddi, T. The drivers of multinational enterprises’ climate change strategies: A quantitative study on climate-related risks and opportunities. J. Clean Prod. 2017, 160, 8–26. [Google Scholar] [CrossRef]
  40. Gorgen, M.; Jacob, A.; Nerlinger, M. Get Green or Die Trying? Carbon Risk Integration into Portfolio Management. J. Portf. Manag. 2021, 47, 77–93. [Google Scholar] [CrossRef]
  41. Herbohn, K.; Gao, R.; Clarkson, P. Evidence on Whether Banks Consider Carbon Risk in Their Lending Decisions. J. Bus. Ethics 2017, 158, 155–175. [Google Scholar] [CrossRef]
  42. Duan, T.; Li, F.W.; Wen, Q. Is Carbon Risk Priced in the Cross Section of Corporate Bond Returns? J. Financ. Quant. Anal. 2023, 60, 1–35. [Google Scholar] [CrossRef]
  43. Bose, S.; Minnick, K.; Shams, S. Does carbon risk matter for corporate acquisition decisions? J. Corp. Financ. 2021, 70, 102058. [Google Scholar] [CrossRef]
  44. Gallego-Álvarez, I.; Segura, L.; Martínez-Ferrero, J. Carbon emission reduction: The impact on the financial and operational performance of international companies. J. Clean Prod. 2015, 103, 149–159. [Google Scholar] [CrossRef]
  45. Lewandowski, S. Corporate Carbon and Financial Performance: The Role of Emission Reductions. Bus. Strategy Environ. 2017, 26, 1196–1211. [Google Scholar] [CrossRef]
  46. Lee, S.-Y.; Choi, D.-K. Does Corporate Carbon Risk Management Mitigate the Cost of Debt Capital? Evidence from South Korean Climate Change Policies. Emerg. Mark. Financ. Trade 2021, 57, 2138–2151. [Google Scholar] [CrossRef]
  47. van Vliet, O.; Hanger-Kopp, S.; Nikas, A.; Spijker, E.; Carlsen, H.; Doukas, H.; Lieu, J. The importance of stakeholders in scoping risk assessments—Lessons from low-carbon transitions. Environ. Innov. Soc. Transit. 2020, 35, 400–413. [Google Scholar] [CrossRef]
  48. Ek, C.; Wu, G.L. Investment-cash flow sensitivities and capital misallocation. J. Dev. Econ. 2018, 133, 220–230. [Google Scholar] [CrossRef]
  49. Dong, X.; Yang, Y.; Zhao, X.; Feng, Y.; Liu, C. Environmental Regulation, Resource Misallocation and Industrial Total Factor Productivity: A Spatial Empirical Study Based on China’s Provincial Panel Data. Sustainability 2021, 13, 2390. [Google Scholar] [CrossRef]
  50. Aharonson, B.S.; Bort, S. Institutional pressure and an organization’s strategic response in Corporate Social Action engagement: The role of ownership and media attention. Strateg. Organ. 2015, 13, 307–339. [Google Scholar] [CrossRef]
  51. He, F.; Guo, X.; Yue, P. Media coverage and corporate ESG performance: Evidence from China. Int. Rev. Financ. Anal. 2024, 91, 103003. [Google Scholar] [CrossRef]
  52. Luo, C.; Wei, D.; He, F. Corporate ESG performance and trade credit financing—Evidence from China. Int. Rev. Econ. Financ. 2023, 85, 337–351. [Google Scholar] [CrossRef]
  53. Houqe, M.N.; Khan, H.Z.; Moses, O.; Elias, A. Corporate reputation, cost of capital and the moderating role of economic development: International evidence. Meditari Account. Res. 2024, 32, 1106–1134. [Google Scholar] [CrossRef]
  54. Huang, T.; Zhang, X. Media coverage of industry and the cross-section of stock returns. Account. Financ. 2022, 62, 1107–1141. [Google Scholar] [CrossRef]
  55. Bessler, W.; Drobetz, W.; Grüninger, M.C. Information Asymmetry and Financing Decisions. Int. Rev. Financ. 2011, 11, 123–154. [Google Scholar] [CrossRef]
  56. Chih, H.-H.; Chih, H.-L. Doing good with or without being known? Media coverage of corporate social performance and its impact on corporate financial performance. Manag. Financ. 2014, 40, 883. [Google Scholar] [CrossRef]
  57. Palea, V.; Drogo, F. Carbon emissions and the cost of debt in the eurozone: The role of public policies, climate-related disclosure and corporate governance. Bus. Strateg. Environ. 2020, 29, 2953–2972. [Google Scholar] [CrossRef]
  58. Eisenhardt, K.M. Agency Theory: An Assessment and Review. Acad. Manag. Rev. 1989, 14, 57–74. [Google Scholar] [CrossRef]
  59. Jiang, F.; Kim, K.A. Corporate Governance in China: A Survey. Rev. Financ. 2020, 24, 733–772. [Google Scholar] [CrossRef]
  60. Li, X.; Liu, G.; Fu, Q.; Abdul Rahman, A.A.; Meero, A.; Sial, M.S. Does corporate social responsibility impact on corporate risk-taking? Evidence from emerging economy. Sustainability 2022, 14, 531. [Google Scholar] [CrossRef]
  61. Koch, N.; Bassen, A. Valuing the carbon exposure of European utilities. The role of fuel mix, permit allocation and replacement investments. Energy Econ. 2013, 36, 431–443. [Google Scholar] [CrossRef]
  62. Pirson, M.; Turnbull, S. Corporate governance, risk management, and the financial crisis: An information processing view. Corp. Gov. Int. Rev. 2011, 19, 459–470. [Google Scholar] [CrossRef]
  63. Love, I. Corporate Governance and Performance around the World: What We Know and What We Don’t. World Bank Res. Obs. 2010, 26, 42–70. [Google Scholar] [CrossRef]
  64. Bouteska, A.; Mili, M. Does corporate governance affect financial analysts’ stock recommendations, target prices accuracy and earnings forecast characteristics? An empirical investigation of US companies. Empir. Econ. 2022, 63, 2125–2171. [Google Scholar] [CrossRef] [PubMed]
  65. Aoki, S. A simple accounting framework for the effect of resource misallocation on aggregate productivity. J. Jpn. Int. Econ. 2012, 26, 473–494. [Google Scholar] [CrossRef]
  66. Ren, X.; Li, Y.; Shahbaz, M.; Dong, K.; Lu, Z. Climate risk and corporate environmental performance: Empirical evidence from China. Sustain. Prod. Consump. 2022, 30, 467–477. [Google Scholar] [CrossRef]
  67. Curtin, J.; McInerney, C.; Gallachoir, B.O.; Hickey, C.; Deane, P.; Deeney, P. Quantifying stranding risk for fossil fuel assets and implications for renewable energy investment: A review of the literature. Renew. Sustain. Energy Rev. 2019, 116, 109402. [Google Scholar] [CrossRef]
  68. Carson, T.L. Self–Interest and Business Ethics: Some Lessons of the Recent Corporate Scandals. J. Bus. Ethics 2003, 43, 389–394. [Google Scholar] [CrossRef]
  69. Vogler, D.; Eisenegger, M. CSR Communication, Corporate Reputation, and the Role of the News Media as an Agenda-Setter in the Digital Age. Bus. Soc. 2021, 60, 1957–1986. [Google Scholar] [CrossRef]
  70. OuYang, Z.; Xu, J.; Wei, J.; Liu, Y. Information Asymmetry and Investor Reaction to Corporate Crisis: Media Reputation as a Stock Market Signal. J. Media Econ. 2017, 30, 82–95. [Google Scholar] [CrossRef]
  71. Aktas, N.; Andreou, P.C.; Karasamani, I.; Philip, D. CEO Duality, Agency Costs, and Internal Capital Allocation Efficiency. Br. J. Manag. 2019, 30, 473–493. [Google Scholar] [CrossRef]
  72. Bosse, D.A.; Phillips, R.A. Agency Theory and Bounded Self-Interest. Acad. Manag. Rev. 2016, 41, 276–297. [Google Scholar]
  73. Nguyen, J.H.; Phan, H.V. Carbon risk and corporate capital structure. J. Corp. Financ. 2020, 64, 101713. [Google Scholar] [CrossRef]
  74. Zhang, Z.; Wang, Z.; Liang, S. The effect of government intervention on the resource misallocation in innovation: Ownership differences. Asia-Pac. J. Account. Econ. 2023, 30, 230–246. [Google Scholar] [CrossRef]
  75. Liu, D.; Xiong, Y.; Wang, L.; Yao, S. Corporate carbon risk and green M&As. Res. Int. Bus. Financ. 2025, 75, 102714. [Google Scholar]
Figure 1. Research framework.
Sustainability 17 06477 g001
Table 1. Variable definitions.
Variable TypeVariable NameVariable SymbolCalculation Method
Dependent variablesCapital mismatchCapmisDegree of deviation of marginal output of capital from the cost of capital employed
Independent variablesCarbon riskRiskCarbon dioxide emissions/(Enterprise main business income × 1,000,000)
Moderator variablesMedia attentionMALn (1 + Total number of carbon news stories)
Corporate
governance
GovernBased on eight indicators calculated by principal component analysis
Control
variables
Corporate sizeSizeLogarithm of total assets for the year
CEO dualityDual1 is assigned when the chairman of the firm’s board and CEO are the same individual, and 0 otherwise
Shareholding
concentration
Top1The shareholding ratio of the largest shareholder
ProfitabilityROANet profit/Total assets
Gearing ratioLevTotal corporate liabilities at year-end/Total corporate assets
Corporate cashflowCashflowNet cash flows from operating activities/Total profit
Year-fixed effectsYearAnnual dummy variables
Individual-fixed
effects
IdIndividual dummy variables
Table 2. Descriptive statistics of variables.
VariableNMeanp50sdMinMax
Capmis49781.2711.2780.943−1.1884.071
Risk49781.3091.2540.4860.0592.513
MA49464.3364.4070.9710.6936.340
Govern4724−0.035−0.2290.591−1.5352.400
Size497822.4822.2501.41419.95026.340
Dual49780.2290.0000.4200.0001.000
Top1497834.3731.77014.9509.18277.290
ROA49780.0420.0380.063−0.1960.235
Lev49780.4420.4450.2080.0620.936
Cashflow49780.0580.0580.066−0.1360.248
Table 3. Baseline regression results.
Variable(1)(2)(3)
CapmisCapmisCapmis
Risk0.374 ***0.412 ***0.055 **
(0.027)(0.023)(0.025)
Size −0.243 ***−0.317 ***
(0.010)(0.017)
Dual 0.084 ***0.026
(0.027)(0.023)
Top1 −0.001−0.000
(0.001)(0.001)
ROA 2.230 ***0.748 ***
(0.225)(0.144)
Lev −0.665 ***−0.180 ***
(0.071)(0.066)
Cashflow −0.701 ***−0.320 **
(0.191)(0.117)
_cons0.783 ***6.440 ***8.045 ***
(0.038)(0.205)(0.393)
IdNONOYES
YearNONOYES
N497849784978
R20.0370.3040.837
Note: ** and *** indicate significance at the 5% and 1% levels, respectively; standard errors for the regression coefficients are in parentheses.
Table 4. Moderated effects regression results.
Variable(1)(2)(3)(4)
MAMAGovernGovern
Risk0.058 **0.056 **0.064 **0.045 *
(0.025)(0.025)(0.025)(0.026)
MA−0.010−0.009
(0.009)(0.009)
Risk × MA −0.034 **
(0.017)
Govern −0.030−0.036
(0.033)(0.033)
Risk × Govern −0.156 ***
(0.037)
Size−0.316 ***−0.315 ***−0.317 ***−0.313 ***
(0.017)(0.017)(0.017)(0.017)
Dual0.0260.0270.0440.044
(0.023)(0.023)(0.027)(0.027)
Top1−0.000−0.000−0.002−0.002
(0.001)(0.001)(0.001)(0.001)
ROA0.760 ***0.756 ***0.708 ***0.685 ***
(0.146)(0.146)(0.147)(0.147)
Lev−0.175 ***−0.166 **−0.234 ***−0.233 ***
(0.067)(0.067)(0.068)(0.068)
Cashflow−0.317 ***−0.319 ***−0.129−0.127
(0.118)(0.118)(0.119)(0.119)
_cons8.037 ***8.016 ***8.049 ***7.981 ***
(0.395)(0.395)(0.405)(0.404)
IdYESYESYESYES
YearYESYESYESYES
N4946494647244724
R20.8360.8370.8440.845
Note: *, **, and *** indicate significance at the 10%, 5%, and 1% levels, respectively; standard errors for the regression coefficients are in parentheses.
Table 5. Robustness checks results.
Variable(1)(2)(3)
OPInclude Province-Fixed EffectsReduced Sample Period
Risk0.029 ***0.032 ***0.070 **
(0.011)(0.022)(0.033)
Size−0.087 ***−0.315 ***−0.283 ***
(0.008)(0.017)(0.025)
Dual−0.0120.0250.037
(0.011)(0.023)(0.030)
Top1−0.001−0.001−0.001
(0.000)(0.001)(0.001)
ROA0.369 ***0.739 ***0.678 ***
(0.068)(0.143)(0.178)
Lev−0.170 ***−0.175 ***−0.224 **
(0.031)(0.067)(0.087)
Cashflow−0.389 ***−0.332 ***−0.171
(0.055)(0.117)(0.146)
_cons2.239 ***8.379 ***7.241 ***
(0.055)(0.362)(0.576)
IdYESYESYES
YearYESYESYES
ProvinceNOYESNO
N497849783109
R20.5940.8390.875
Note: ** and *** indicate significance at the 5% and 1% levels, respectively; standard errors for the regression coefficients are in parentheses.
Disclaimer/Publisher’s Note: The statements, opinions and data contained in all publications are solely those of the individual author(s) and contributor(s) and not of MDPI and/or the editor(s). MDPI and/or the editor(s) disclaim responsibility for any injury to people or property resulting from any ideas, methods, instructions or products referred to in the content.

