Article

Enhanced Parallel Convolution Architecture YOLO Photovoltaic Panel Detection Model for Remote Sensing Images

1
State Grid Shanxi Electric Power Company Electric Power Research Institute, Taiyuan 030001, China
2
School of Electrical and Control Engineering, North University of China, Taiyuan 030051, China
3
School of Instrument and Electronics, North University of China, Taiyuan 030051, China
*
Author to whom correspondence should be addressed.
Sustainability 2025, 17(14), 6476; https://doi.org/10.3390/su17146476
Submission received: 19 June 2025 / Revised: 12 July 2025 / Accepted: 14 July 2025 / Published: 15 July 2025

Abstract

Object detection technology enables the automatic identification of photovoltaic (PV) panel locations and conditions, significantly enhancing operational efficiency for maintenance teams while reducing the time and cost associated with manual inspections. Challenges arise due to the low resolution of remote sensing images combined with small-sized targets—PV panels intertwined with complex urban or natural backgrounds. To address this, a parallel architecture model based on YOLOv5 was designed, substituting traditional residual connections with parallel convolution structures to enhance feature extraction capabilities and information transmission efficiency. Drawing inspiration from the bottleneck design concept, a primary feature extraction module framework was constructed to optimize the model’s deep learning capacity. The improved model achieved a 4.3% increase in mAP, a 0.07 rise in F1 score, a 6.55% enhancement in recall rate, and a 6.2% improvement in precision. Additionally, the study validated the model’s performance and examined the impact of different loss functions on it, explored learning rate adjustment strategies under various scenarios, and analyzed how individual factors affect learning rate decay during its initial stages. This research notably optimizes detection accuracy and efficiency, holding promise for application in large-scale intelligent PV power station maintenance systems and providing reliable technical support for clean energy infrastructure management.

1. Introduction

As a pivotal technology for the deployment of artificial intelligence, object detection plays an instrumental role in contemporary computer vision. It facilitates the localization and classification of specific targets within images/videos [1,2], thereby furnishing foundational perceptual capabilities for industrial intelligentization. Particularly in automated monitoring and identification of renewable energy infrastructure, this technology has demonstrated immense potential. Illustrated by photovoltaic (PV) maintenance scenarios [3,4], automatic recognition of precise PV panel positions, angles, as well as abnormalities such as cracks and dust accumulation [5,6], significantly bolsters operational efficiency. This compressing inspection cycles for megawatt-scale PV power stations from weekly to hourly intervals, drastically reducing manual inspection time and cost. Amid the global energy transition, cumulative installed capacity of global renewable continues its rapid escalation. According to the International Renewable Energy Agency (IRENA), by close of 2023, the aggregate installed capacity of renewable energy worldwide had attained 3870 GW. Among these, photovoltaic, owing to a substantial decline in the levelized cost of electricity, have emerged as a cornerstone component of clean energy systems [7]. With the expansion of industrial scale and accelerated large-scale application following breakthroughs in PV module conversion efficiency, there arises an escalating demand for intelligent operations and real-time monitoring of power stations [8]. This necessity stems from the requirement for ongoing health assessment of distributed PV arrays throughout their lifespan. It also stems from the need to mitigate power loss incurred by hotpot effects due to localized shading, and grid stability necessitating minute-level fault response [9]. Nonetheless, technological implementation encounters formidable challenges. Distributed PV arrays, situated in intricate geographical contexts (such as urban built-up areas, agrivoltaic zones, and mountainous distributed stations), exhibit highly heterogeneous spatial distribution characteristics. These manifest as variable morphological scales, random angles, and strong coupling with backgrounds [10], rendering them prone to confusion with man-made structures possessing regular geometric edges, such as vehicles and greenhouses, in remote sensing imagery. Especially in panchromatic images with low spatial resolution (<5 m), individual PV panels occupy fewer than 5 × 5 pixels and lack multi-spectral information support. Traditional methods reliant on HSV color space transformation are constrained by sensitivity to illumination variations. This leads to identification processes incorporating edge detection suffering from elevated average rates of missed detection and false positives. Therefore, there is an urgent need to develop technologies capable of efficiently and accurately discriminating PV panels through satellite remote sensing imagery. This will enhance dynamic monitoring capabilities of PV facilities within China’s borders.
Present detection methodologies primarily rely on ultra-high-resolution (0.3–0.8 m) aerial imagery and Unmanned Aerial Vehicle (UAV) patrol imaging acquisition [11,12,13,14,15]. These methods, albeit capable of achieving accuracy exceeding 80%, are beleaguered by limited single-task coverage areas. This necessitates frequent round trips for refueling or recharging. Moreover, in practical applications, several systemic bottlenecks emerge. For instance, aerial photography’s economic viability is unsustainable over extensive dynamic monitoring endeavors due to prohibitive costs. UAV image capture is stymied by battery life constraints, airspace regulations, and wireless transmission distance limitations. This significantly compromises timeliness. Furthermore, flight altitude fluctuations introduce substantial variations between captured image resolution and actual terrain dimensions. This exacerbates image recognition complexities. Notably, high-resolution satellites such as WorldView-4 and GF-7 have attained sub-meter observation capabilities within the 0.3–0.5 m range [16,17], addressing the issue of large-scale coverage. However, prevailing deep learning models grapple with architectural limitations; for example, the ubiquitous Mask R-CNN and U-Net fusion framework [18,19] only partially captures images’ fragmented characteristics. These endeavors lay the groundwork for constructing a high-precision remote sensing satellite image-based photovoltaic array detection system.
In recent years, methodologies for image feature extraction have predominantly bifurcated into two categories: one rooted in the manipulation of image engineering characteristics [20,21,22,23,24,25,26,27], and the other propelled by data-driven deep learning segmentation techniques [28,29,30,31,32,33,34,35]. Generally, researchers construct models grounded in the physical attributes of samples under scrutiny. They train these models to recognize specific information within images. For instance, Tan et al., meanwhile, enhanced the precision of photovoltaic panel region localization and shape correction [25]. They did this by integrating common characteristics of PV panels with a constraint refinement module and a color loss function predicated on prior color knowledge. This refined predicted regions with accurate color information amid confusing targets. David et al. demonstrated the effectiveness of airborne longwave-infrared spectral imaging for detecting PV solar panels [26]. Through controlled experiments with a test array of seven PV panels, the study validated a detection protocol using adaptive coherence estimation and material identification algorithms. Nonetheless, traditional approaches are confined to detecting objects with conspicuous physical traits. They exhibit limitations in accuracy when confronted with the intricate backgrounds and variable geometries of photovoltaic panels. Moreover, these methods often prioritize accuracy over computational efficiency. They fail to address the real-time processing requirements critical in practical applications such as remote sensing or industrial monitoring. Particularly challenging is the scenario where PV panel images bear striking similarities in shape and hue to greenhouse structures or industrial facility areas. This leads to heightened false positive rates in models reliant on color or shape-based feature extraction.
Deep learning-powered semantic segmentation technologies have demonstrated pronounced advantages in remote sensing imagery analysis. They excel especially in localization precision and the multi-scale feature integration. As examples, Guo et al. introduced a deep learning model that leverages data distribution analysis and PV panel idiosyncrasies. This model adopts a multi-scale feature learning approach to augment segmentation accuracy and generalizability. The strategy uses an augmented feature pyramid network to harmonize data characteristics across varying resolutions. This effectively mitigates imbalances therein [30]. Zhou et al., furthermore, put forth a semantic segmentation technique founded on a Multi-Level Pyramid Strategy [33]. This strategy narrows information disparities among hierarchical features. By implementing a pooling distribution mechanism, their approach fosters productive interactions between multi-tier features within the feature pyramid architecture. However, existing deep learning frameworks like those mentioned above often sacrifice real-time performance for enhanced accuracy, limiting their applicability in time-sensitive scenarios. To bridge this gap, our study builds upon the YOLO v5 architecture, renowned for its real-time object detection capabilities, and introduces targeted improvements to balance speed and precision. This work pioneers the adaptation of YOLO v5 for photovoltaic panel detection. It enhances the backbone network with multi-scale feature fusion mechanisms to capture fine-grained details while maintaining low latency.
In this paper, a novel parallel architecture model is devised based on the YOLOv5 framework. Its cornerstone is the substitution of conventional residual connections with a parallel convolution structure. This innovation aims to bolster the network’s feature extraction prowess and enhance information propagation efficiency. Drawing inspiration from the bottleneck design philosophy, we erect a principal feature extraction module scaffold to optimize the model’s deep learning capabilities. The enhancements yield substantial improvements: a 4.3% increase in mean average precision (mAP), a 0.07 rise in F1 score, a 6.55% recall uplift, and a 6.2% precision augmentation. Furthermore, the study rigorously validates the model’s performance and delves into the impact of diverse loss functions on its efficacy. It also scrutinizes various learning rate adjustment strategies tailored to different experimental scenarios. The study meticulously dissects specific influences of individual factors during the initial phase of learning rate decay. In a final comparative analysis, the refined model is pitted against YOLOv8’s high-performing feature extraction architecture. This reveals that our adapted model can maintain precision while mitigating the rate of missed detection.

2. Methodology and Model

2.1. Data Preprocessing Techniques

Image preprocessing is bifurcated into two principal components: image enhancement and prior anchor initialization. The image enhancement methodology retains the Mosaic augmentation technique from YOLOv5. This highly efficacious data augmentation strategy training dataset diversity and model generalizability. It works by arbitrarily cropping and fusing distinct images into a novel composite. This process entails the following: (1) Stochastic cropping of individual images to ensure the model can discern objects across varied scales and aspect ratios, targeting random sections of the image; (2) Systematic arrangement and fusion of these cropped segments to form an expansive synthetic image; and (3) Recalibration of resultant composites to dimensions congruent with network input specifications. Prior anchor initialization, meanwhile, involves clustering analysis of annotated bounding boxes within the training dataset. This derives predefined anchor dimensions serving as the foundational framework for predicting object localization during the training phase.

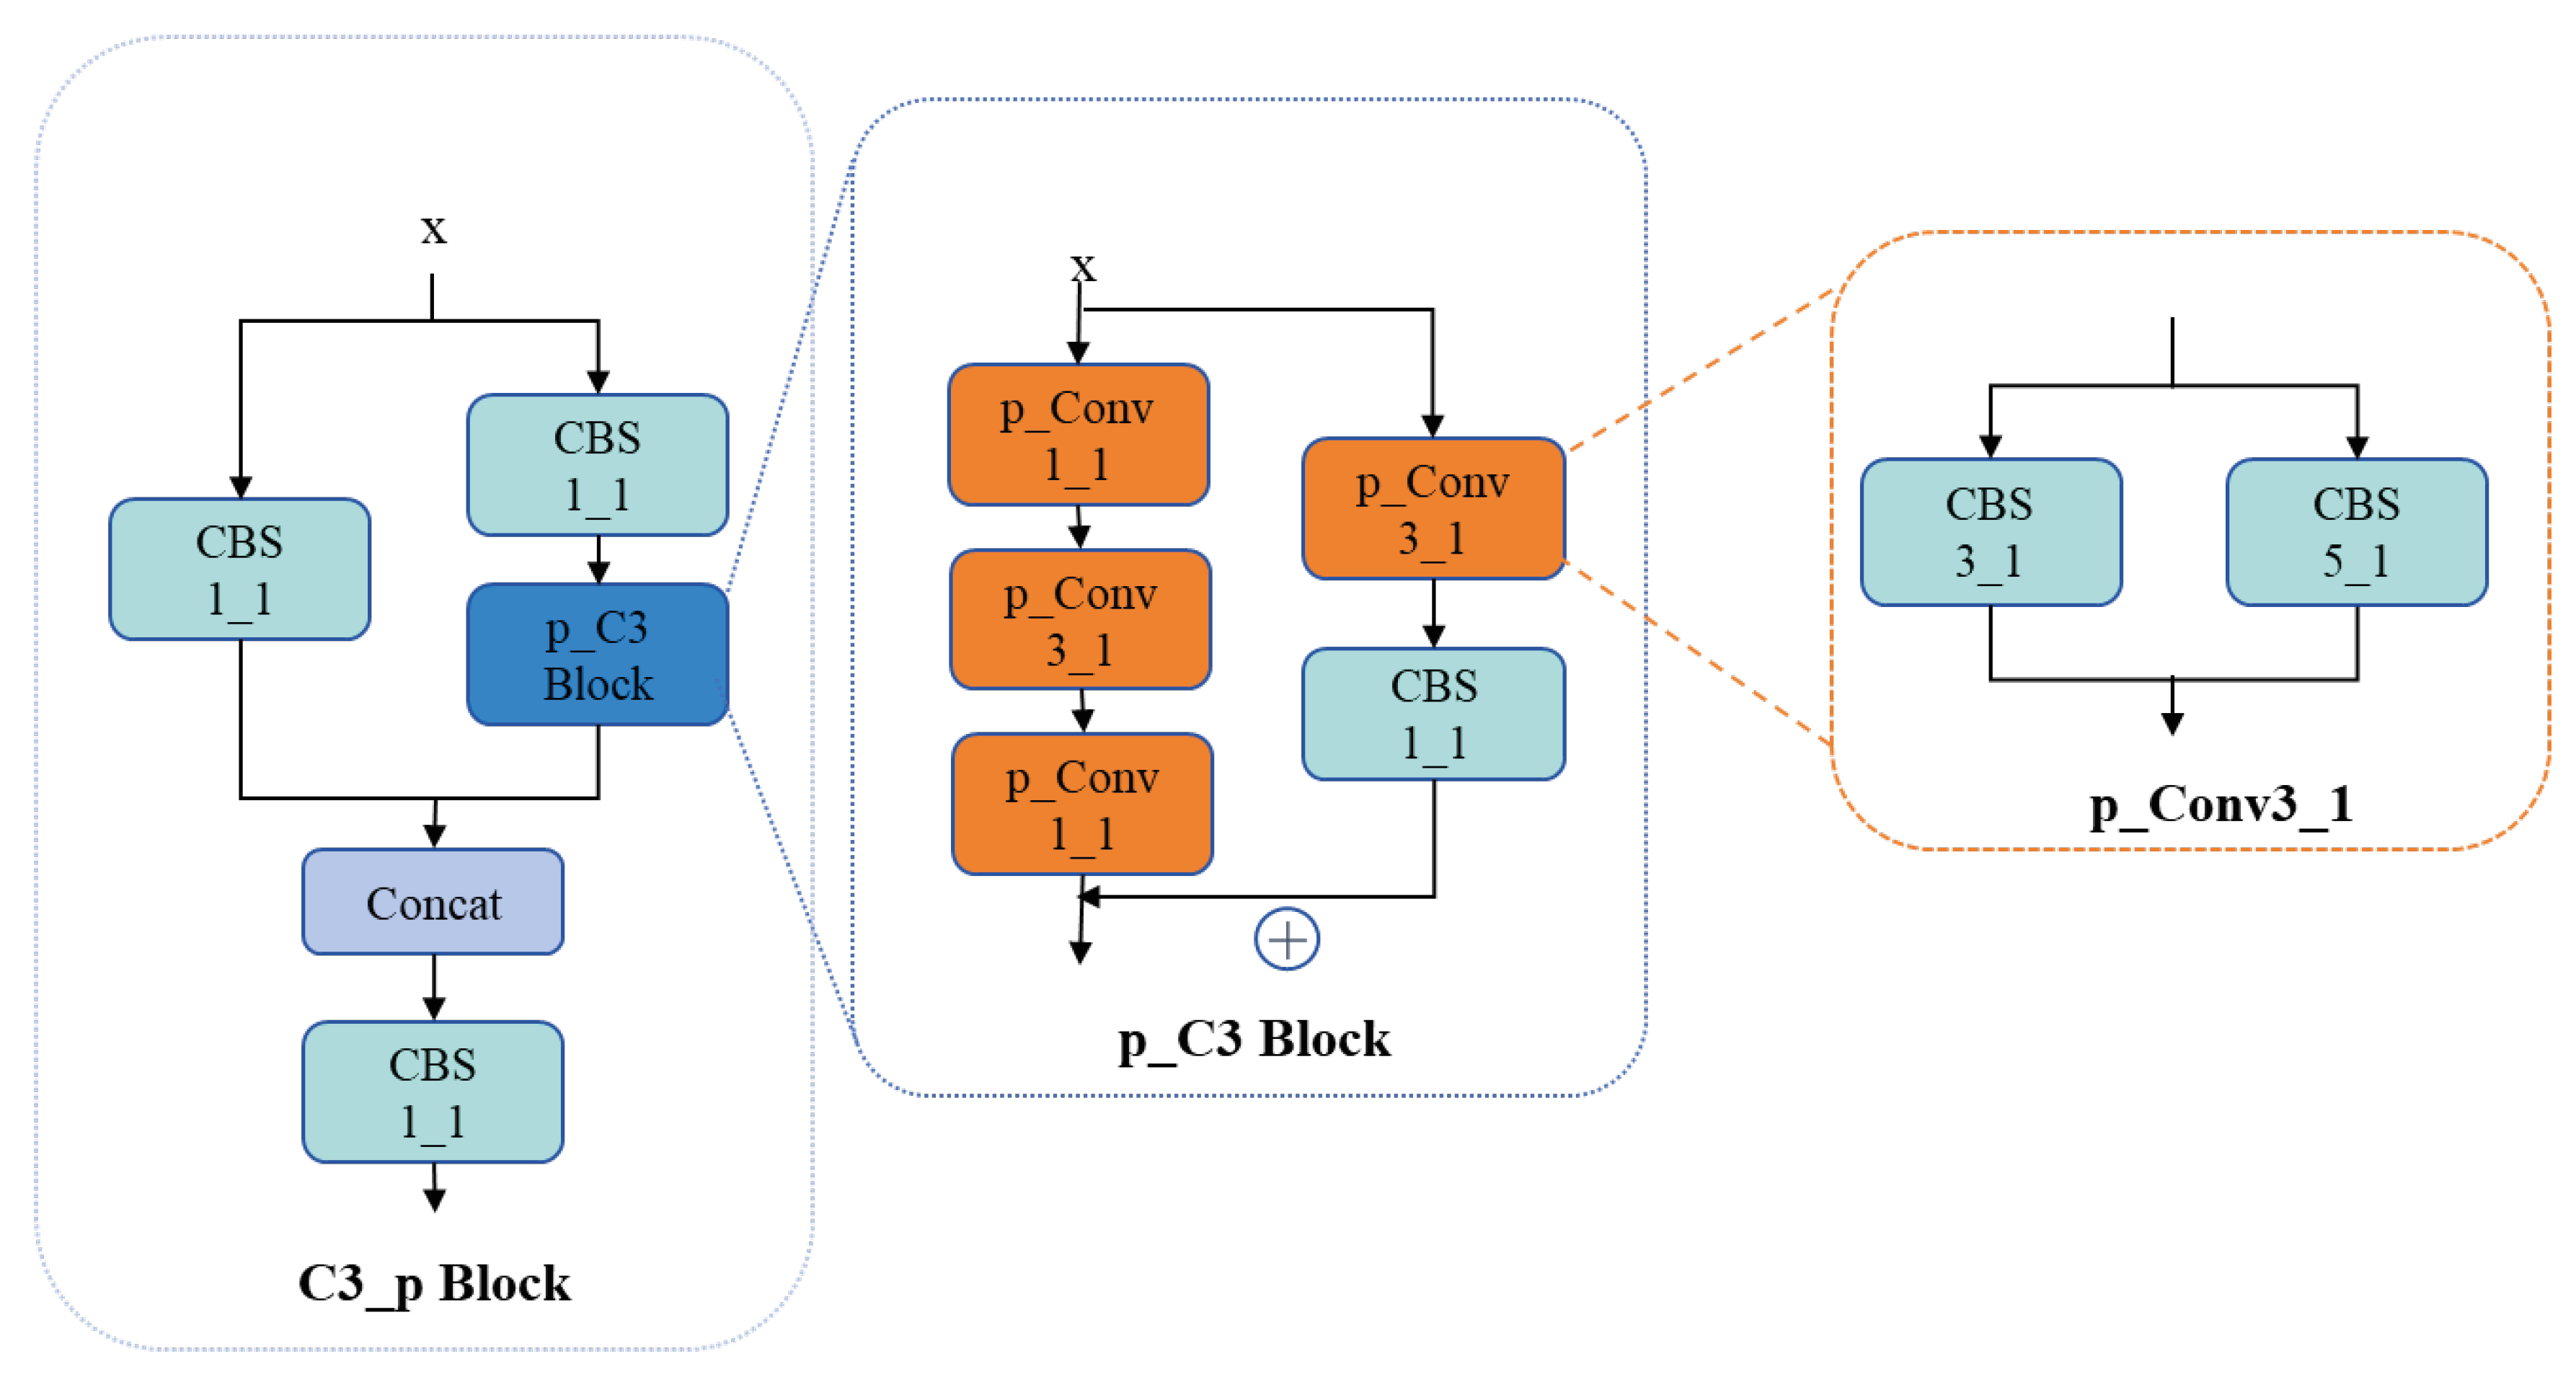
2.2. Model Architecture

The model retains the overarching architecture of YOLOv5, as depicted in Figure 1. The framework leverages a Backbone network to extract and compress image features, which are subsequently channeled into the Neck component. Here, a pyramidal structure facilitates cross-scale feature fusion, ensuring the model’s capacity to capture information pertaining to objects of diverse dimensions. At the terminal stage of the architecture, the Prediction layer undertakes the tasks of bounding box localization, class identification, and confidence assessment for targets across all scales, culminating in the final output of object detection.
The Focus module diverges from conventional uniform segmentation by employing a “leapfrog partitioning” technique. This generates the initial feature map. The approach entails non-continuous, leapfrog-style sampling based on pixel values, slicing the image of every other pixel along both width and height dimensions, thereby yielding four sub-images with distinct content characteristics. These sub-regions are subsequently concatenated along the channel dimension. Consequently, the original RGB three-channel image expands into a 12-channel dataset. Each sub-region occupies a fraction of the channels in the new image.
The model modifies the core feature extraction module C3 into an enhanced variant, C3_p (Figure 2). The revamped C3_p structure replaces each layer’s architecture with a parallel configuration. It substitutes residual connections with CBS (Convolutional-BatchNorm-Activation) modules housing convolution kernels of varying sizes. This adaptation amplifies the model’s capacity to capture intricate details. Within the p_C3 Block, features extracted via a CBS module equipped with a 1 × 1 convolution are paralleled with those from a classic bottleneck structure and subsequently summed. Similarly, the p_Conv3_1 module juxtaposes two CBS units—one with a 3 × 3 kernel and another with a 5 × 5 kernel, both stride 1—to extract features independently before merging them. Analogously, the p_Conv1_1 module combines features from parallel CBS modules featuring 1 × 1 and 5 × 5 kernels, respectively, after independent extraction.
The core philosophy of the bottleneck design revolves around diminishing feature map dimensions through a sequence of convolution layers. This mitigates computational demands while preserving network performance. Operation follows three steps: (1) An initial 1 × 1 convolution layer reduces channel count, alleviating computational overhead for successive layers; (2) A 3 × 3 convolution layer, the linchpin of the bottleneck, is applied to the compressed feature maps to extract more intricate features; (3) A subsequent 1 × 1 convolution layer reinstates channel count, restoring feature map dimensions and enabling continued learning in a higher-dimensional space.
Within the C3_p Block architecture, we emulate this bottleneck ethos by constructing a feature extraction framework comprising a 1 × 1 convolution (p_Conv1_1), followed by a 3 × 3 convolution (p_Conv3_1), and culminating in another 1 × 1 convolution (p_Conv1_1). Concurrently, the 3 × 3 convolution (p_Conv3_1) is parallel with a CBS structure incorporating a 1 × 1 convolution, forming a dual-branch system for feature extraction. Post-extraction, these branches are summed before proceeding to subsequent operations.

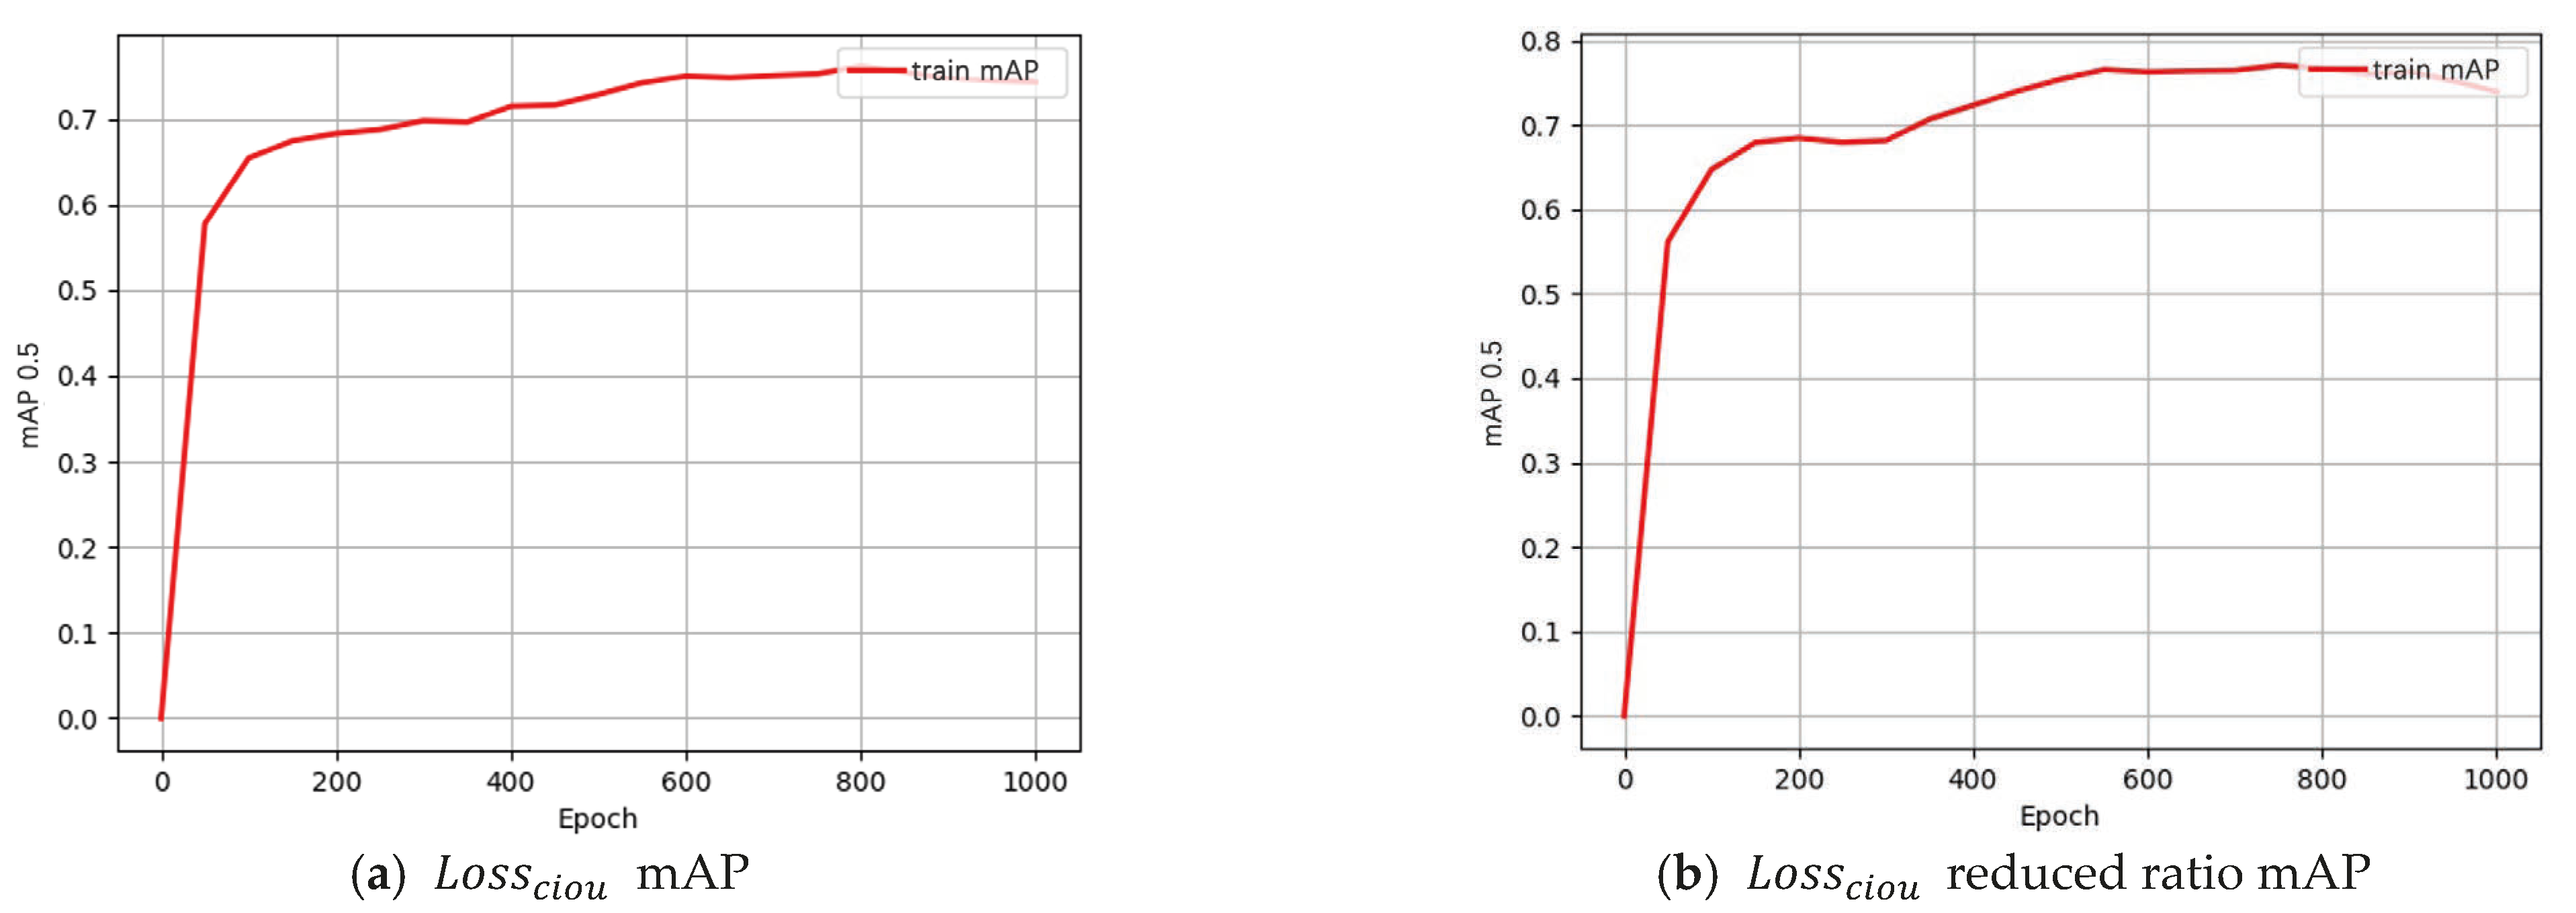
2.3. Loss Function Definition

In the experiment, we conducted a comparative evaluation of the impact of two loss functions, GIoU (Generalized Intersection over Union) and CIoU (Complete Intersection over Union), on model performance. GIoU is particularly adept at addressing scenarios where bounding boxes do not overlap. The L o s s g i o u methodology not only considers the intersection and union of the predicted and ground truth boxes but also incorporates the area of the smallest encompassing box between them, providing a more holistic assessment of the predicted box’s localization accuracy:
S A B = S A + S B S A B
i o u = S A B S A B
g i o u = i o u S s q u a r e _ m i n S A B S s q u a r e _ m i n
L o s s g i o u = 1 g i o u
where S A is the area of the predicted box, S B is the area of the ground truth box, S A B is the overlapping region’s area, and S s q u a r e _ m i n is the area of the minimal enclosing square.
Currently employed loss functions also include CIoU, DIoU, and Focal Loss. Although DIoU, which is part of CIoU, incorporates the distance between centers, it does not explicitly constrain the aspect ratio. Focal Loss is specifically designed to address class imbalance in classification tasks. Given the research focus on improving bounding box localization accuracy and the operational demands of enhancing the State Grid’s image recognition precision and real-time processing capabilities, we have prioritized the use of CIoU as our core loss functions. CIoU, an advancement upon GIoU, integrates additional penalty terms—including center point distance, aspect ratio, and containment metrics—to penalize inaccurate predictions of width-to-height ratios. By accounting not only for overlapping regions but also incorporating spatial relationships via center point proximity, and morphological characteristics through aspect ratio analysis, CIoU offers a more comprehensive and efficacious optimization framework for bounding box localization.
L o s s c i o u = 1 i o u + d 2 c 2 + α v
α = v 1 i o u + v
v = 4 ( a r c t a n w g h g a r c t a n w p h p ) 2 π 2
where d denotes the Euclidean distance between the centroids of the predicted and ground truth boxes; α is weighting coefficient that dynamically balances the contribution of the aspect ratio term based on current IoU; v is aspect ratio discrepancy measure quantifying alignment between box proportions; c represents the diagonal length of the smallest enclosing rectangle. The dimensions ( w g , h g ) correspond to the width and height of the ground truth box, while ( w p , h p ) define the width and height of the predicted box.

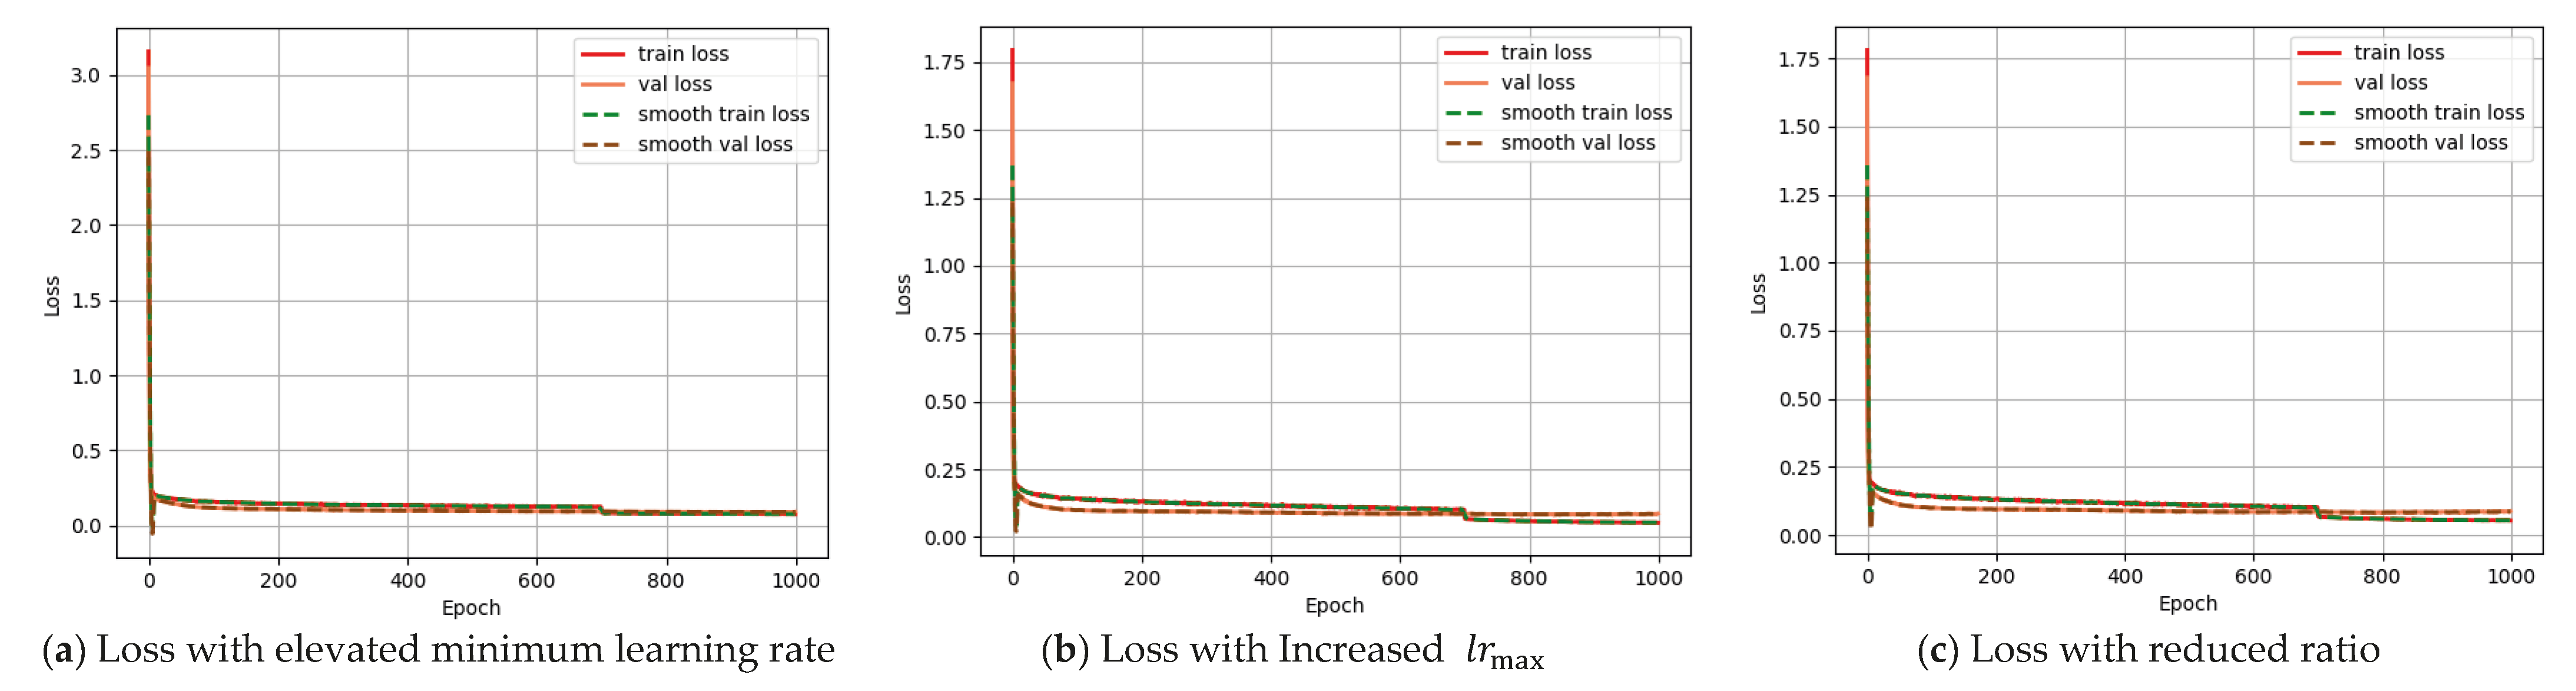
2.4. Learning Rate Adjustment Strategy

The calibration of learning rate is critical in deep learning model training, as an optimal learning rate accelerates convergence, reduces iterations required to attain optimality, and enhances predictive accuracy. To mitigate overfitting during advanced training phases, a gradual decay of the learning rate is employed. In this experiment, the cosine annealing strategy—grounded in cosine-function-based modulation—is adopted for learning rate scheduling:
l r c u r = l r m i n + ( l r m a x l r m i n ) 2 ( 1 + c o s ( T c u r T m a x π ) )
where l r c u r denotes the current learning rate, l r m i n is the minimum learning rate, and l r m a x signifies the maximum learning rate, T c u r is to the current iteration step, T m a x is the maximum time. This cosine annealing methodology is characterized by a gradual decline of the learning rate from its initial value to the predefined minimum. In practice, the learning rate adjustment for each iteration l r i t e r is partitioned into four distinct phases: l r i t e r = l r m a x . During the initial phase, the maximum learning rate is set to l r m a x , serving as the baseline for subsequent iterative computations. Subsequent adjustments are derived from this starting point, ensuring a systematic decay aligned with the cosine annealing framework.
In this study, the core objective of learning rate scheduling is to maximize the model’s ultimate generalization performance while ensuring training stability. The cosine annealing strategy balances rapid convergence and fine-tuning. It offers distinct advantages in the later training stages, particularly for extended training cycles. Other methods may suit specific scenarios better. Exponential decay exhibits an overly rapid reduction in learning rate. It potentially decreases to very small values prematurely during later training phases. This may prevent the model from undergoing sufficient fine optimization, potentially limiting the ceiling for final accuracy. It is better suited for scenarios demanding extremely fast convergence without stringent requirements on peak accuracy, or as a component of other strategies (e.g., Warmup). Theoretically, cyclical learning rates can assist the model in escaping local minima and exploring superior solutions. However, they carry training instability risks: substantial cyclical oscillations may introduce instability. This is especially true with smaller batch sizes or sensitive model optimization.
At training onset, model parameters are typically initialized randomly. Directly employing a high learning rate at this stage may induce excessive parameter updates, destabilizing the training process. To mitigate this, a warm-up phase is introduced, wherein a lower initial learning rate is utilized before progressively escalating it to the predefined target value. This gradual increment in learning rate enables the model to explore a more favorable parameter space during early iterations. It facilitates accelerated convergence in subsequent stages. Additionally, different layers may necessitate distinct learning rates. The warm-up phase ensures all layers adapt harmoniously to the training regimen. The initial learning rate during the warm-up phase is defined as follows:
w a r m u p _ l r _ s t a r t = m a x ( w a r m u p _ l r _ r a t i o × l r m a x , 10 6 )
where w a r m u p _ l r _ r a t i o represents the proportional relationship between total number of training iterations and maximum learning rate, l r m a x . In the experiments, we impose a constraint that the initial learning rate in the warm-up phase must not fall below 10 6 , as excessively low learning rates can lead to prohibitively slow convergence. The duration of the warm-up phase is governed by the parameter w a r m u p _ t o t a l _ i t e r s , which determines the number of iterations over which the learning rate incrementally rises to its target value:
w a r m u p _ t o t a l _ i t e r s = m i n ( m a x ( t o t a l _ i t e r s × w a r m u p _ i t e r s _ r a t i o , 1 ) , 3 )
where w a r m u p _ i t e r s _ r a t i o is the proportional relationship between the total training iterations and the number of iterations allocated to the warm-up phase. During the initial training stages, a relatively higher learning rate facilitates rapid capture of dominant data features; however, excessively large learning rates may induce oscillations near local minima or even divergence. Based on empirical observations, the warm-up iteration count is constrained within the range (1, 3). Specifically, if t o t a l _ i t e r s × w a r m u p _ i t e r s _ r a t i o falls within (1, 3), the warm-up duration is set accordingly; otherwise, it is clamped to either 1 (for values <1) or 3 (for values >3). To ensure training stability, the learning rate during the warm-up phase, l r i t e r , defined for iterations satisfying 0 i t e r w a r m u p _ t o t a l _ i t e r s is as follows:
l r i t e r = ( l r i t e r 1 w a r m u p _ l r _ s t a r t ) × ( i t e r w a r m u p _ t o t a l _ i t e r s ) 2 + w a r m u p _ l r _ s t a r t
During this process, the learning rate, l r i t e r , transitions nonlinearly with iterations, incrementally escalating from w a r m u p _ l r _ s t a r t to the predefined target value in a manner proportional to the warm-up iterations. This gradual adjustment mitigates oscillations during early training stages, enhancing stability. Following the warm-up phase, a cosine annealing strategy is employed for learning rate decay. In the subsequent fine-tuning stage n o _ a u g _ i t e r , a reduced learning rate is utilized to enable the model to perform refined optimizations near the minima of the loss landscape:
l r i t e r = l r m i n + ( l r m a x l r m i n ) 2 ( 1 + c o s ( i t e r w a r m u p _ t o t a l _ i t e r s t o t a l _ i t e r s w a r m u p _ t o t a l _ i t e r s n o _ a u g _ i t e r π ) )
In this phase, the term i t e r w a r m u p _ t o t a l _ i t e r s signifies the relative iteration count within the learning rate decay window, while t o t a l _ i t e r s w a r m u p _ t o t a l _ i t e r s n o _ a u g _ i t e r represents the total number of iterations allocated to the decay period. This formulation enables precise characterization of the temporal progression during the decay phase. As the iteration count iter approaches the critical threshold, the learning rate progressively converges to its minimum value l r m i n , ensuring a continuous and smooth trajectory throughout the training process. During the final fine-tuning stage, when i t e r t o t a l _ i t e r s n o _ a u g _ i t e r , the learning rate is fixed at l r i t e r = l r m i n , where l r m i n denotes the predefined lower bound for the learning rate, representing the minimal permissible value attainable in the training regimen.

3. Experimental Procedure and Results

3.1. Dataset

A training set of 971 photovoltaic (PV) panel images (resolution: 640 × 640) was constructed. These images were captured under diverse geographic and environmental conditions to enhance the model’s generalization capability. To ensure objective and fair performance evaluation, an independent validation set consisting of 66 images was created. The validation set encompasses various scenarios, including color and grayscale backgrounds, complex urban environments, and diverse natural settings. It aims to rigorously assess robustness and recognition accuracy across background complexities and image qualities. Image annotation was performed using LabelImg tool. VOC format ensured consistent labeling standards. Data preprocessing and augmentation methods matched the YOLOv5 source code implementation.

3.2. Experimental Environment

The experiments used a Tesla A100 GPU (Nvidia, Santa Clara, CA, USA) with 40 GB memory. During training, the batch size was set to 10, the initial maximum learning rate l r m a x was configured as 0.001, and the minimum learning rate, l r m i n , was defined as 0.01 × l r m a x . The Stochastic Gradient Descent (SGD) optimizer was employed for parameter optimization. Each model underwent 1000 training epochs to ensure sufficient optimization of performance.

3.3. Experimental Results

The YOLOv5 model with optimal hyperparameters underwent rigorous validation. To quantify performance metrics and facilitate comparative analysis with baseline models, 1000 training iterations were executed, and the mean average precision (mAP) on the validation set was recorded at each stage. The model achieved its peak performance with an F1 score of 0.72, recall of 64.2%, precision of 82.08%, and mAP of 73.4%. Figure 3a illustrates the mAP curve over 1000 iterations. It shows the model’s dynamic performance evolution.
During improved model training, we maintained baseline YOLOv5 parameter configurations. Figure 3b shows the optimized model exhibited significantly superior performance compared to the baseline YOLO v5 model within the first 200 training iterations. However, later stages experienced noticeable performance improvement deceleration. This was likely due to insufficient mid-to-late phase learning momentum.
To address this challenge, learning rate adjustments were implemented. These sustained learning dynamics in later stages, enhancing detection accuracy and generalization capability. The modification strategies were systematically explored and validated:
(1) Elevating the Minimum Learning Rate l r m i n : The minimum learning rate, l r m i n , is increased by raising the ratio of l r m i n to l r m a x . This adjustment elevated the learning rate during both the decay and fine-tuning phases, as described by the following:
l r ' m i n = 0.2 × l r m a x > l r m i n
l r ' i t e r = l r ' m i n + ( l r m a x l r ' m i n ) 2 ( 1 + c o s ( i t e r w a r m u p _ t o t a l _ i t e r s t o t a l _ i t e r s w a r m u p _ t o t a l _ i t e r s n o _ a u g _ i t e r π ) ) = ( 1 1 2 ( 1 + c o s ( i t e r w a r m u p _ t o t a l _ i t e r s t o t a l _ i t e r s w a r m u p _ t o t a l _ i t e r s n o _ a u g _ i t e r π ) ) l r ' m i n + 1 2 ( 1 + c o s ( i t e r w a r m u p _ t o t a l _ i t e r s t o t a l _ i t e r s w a r m u p _ t o t a l _ i t e r s n o _ a u g _ i t e r π ) ) l r m a x > ( 1 1 2 ( 1 + c o s ( i t e r w a r m u p _ t o t a l _ i t e r s t o t a l _ i t e r s w a r m u p _ t o t a l _ i t e r s n o _ a u g _ i t e r π ) ) l r m i n + 1 2 ( 1 + c o s ( i t e r w a r m u p _ t o t a l _ i t e r s t o t a l _ i t e r s w a r m u p _ t o t a l _ i t e r s n o _ a u g _ i t e r π ) ) l r m a x = l r i t e r
As illustrated in Figure 4, increasing the ratio of the minimum learning rate, l r m i n , to the maximum learning rate, l r m a x , accelerated the overall training process and significantly mitigated the issue of insufficient momentum in the mid-training phase. However, this adjustment did not yield substantial performance improvements in the later stages of training.
(2) The initial maximum learning rate, l r ' m a x , is increased to 0.05 to elevate the learning rate throughout the training process. As shown in Figure 5a, this adjustment led to an overall performance improvement. However, it also resulted in pronounced overfitting. The model achieved its best performance with an F1 score of 0.79, recall of 71.17%, precision of 88.10%, and mAP of 78.6%.
To alleviate overfitting, improvements were implemented while retaining the existing optimization framework: The ratio of the minimum to maximum learning rate was lowered to 0.08. This resulted in an adjusted minimum learning rate l r ' m i n = 0.08 × l r ' m a x . As shown in Figure 5b, this modification partially mitigated overfitting and accelerated early-stage training. Meanwhile, the loss function after adjusting the learning rate was compared, as shown in Figure 6. In Figure 6a, training and validation losses converge stably. Figure 6b exhibits pronounced validation loss oscillations despite stable training loss. This indicates reduced generalization, consistent with earlier mAP drops. Figure 6c demonstrates smoother validation convergence with marginally lower final loss values. This aligns with observed mAP improvements. These curves empirically validate that aggressive learning rates induce overfitting, while carefully tuned decay ratios enhance optimization stability.
However, late-stage learning rates underwent synchronized reduction. This led to suboptimal peak performance versus previous configurations. In addition, for loss function replacement, the loss function was switched to L o s s c i o u at the model’s best-performing state. Figure 7a illustrates these changes modestly relieved overfitting. But the optimal results remained inferior to the baseline. Building on this, further parameter tuning was conducted, including reducing l r m i n to l r ' m i n . Figure 7b depicts improved mid-to-late-stage performance. However, overfitting reduction was insignificant. Early-stage training risked converging to local optima.
Figure 8 presents YOLOv5 and enhanced parallel architecture performance under various conditions and loss functions. The improved model demonstrates superior performance in reducing redundant bounding boxes and lowering false detection rates compared to the baseline model, particularly when processing monochromatic (black-and-white) images. For small object detection, both models exhibit misclassification errors. However, the model employing the GIoU loss function outperforms its CIoU-based counterpart by successfully identifying ambiguous small targets that the CIoU variant fails to detect. This advantage likely arises from reduced information content in small objects. This amplifies susceptibility to noise and background interference. Additionally, GIoU’s simplified regression task may enhance robustness. It enables more effective learning of localization cues for small targets.
We systematically investigated learning rate adjustment ratios during initial training phases. Focus was on three critical stages: warmup, decay, and fine-tuning. Key observations were as follows:
  • When both w a r m u p _ i t e r s _ r a t i o and n o _ a u g _ i t e r _ r a t i o were set to 0.05, maximizing warmup iterations to 3 and fine-tuning iterations to 15, reducing w a r m u p _ l r _ r a t i o to one-tenth of its original value resulted in only a 0.6% decrease in mAP during the first 50 epochs. This indicates that the initial learning rate in the warmup stage has minimal impact on early training performance.
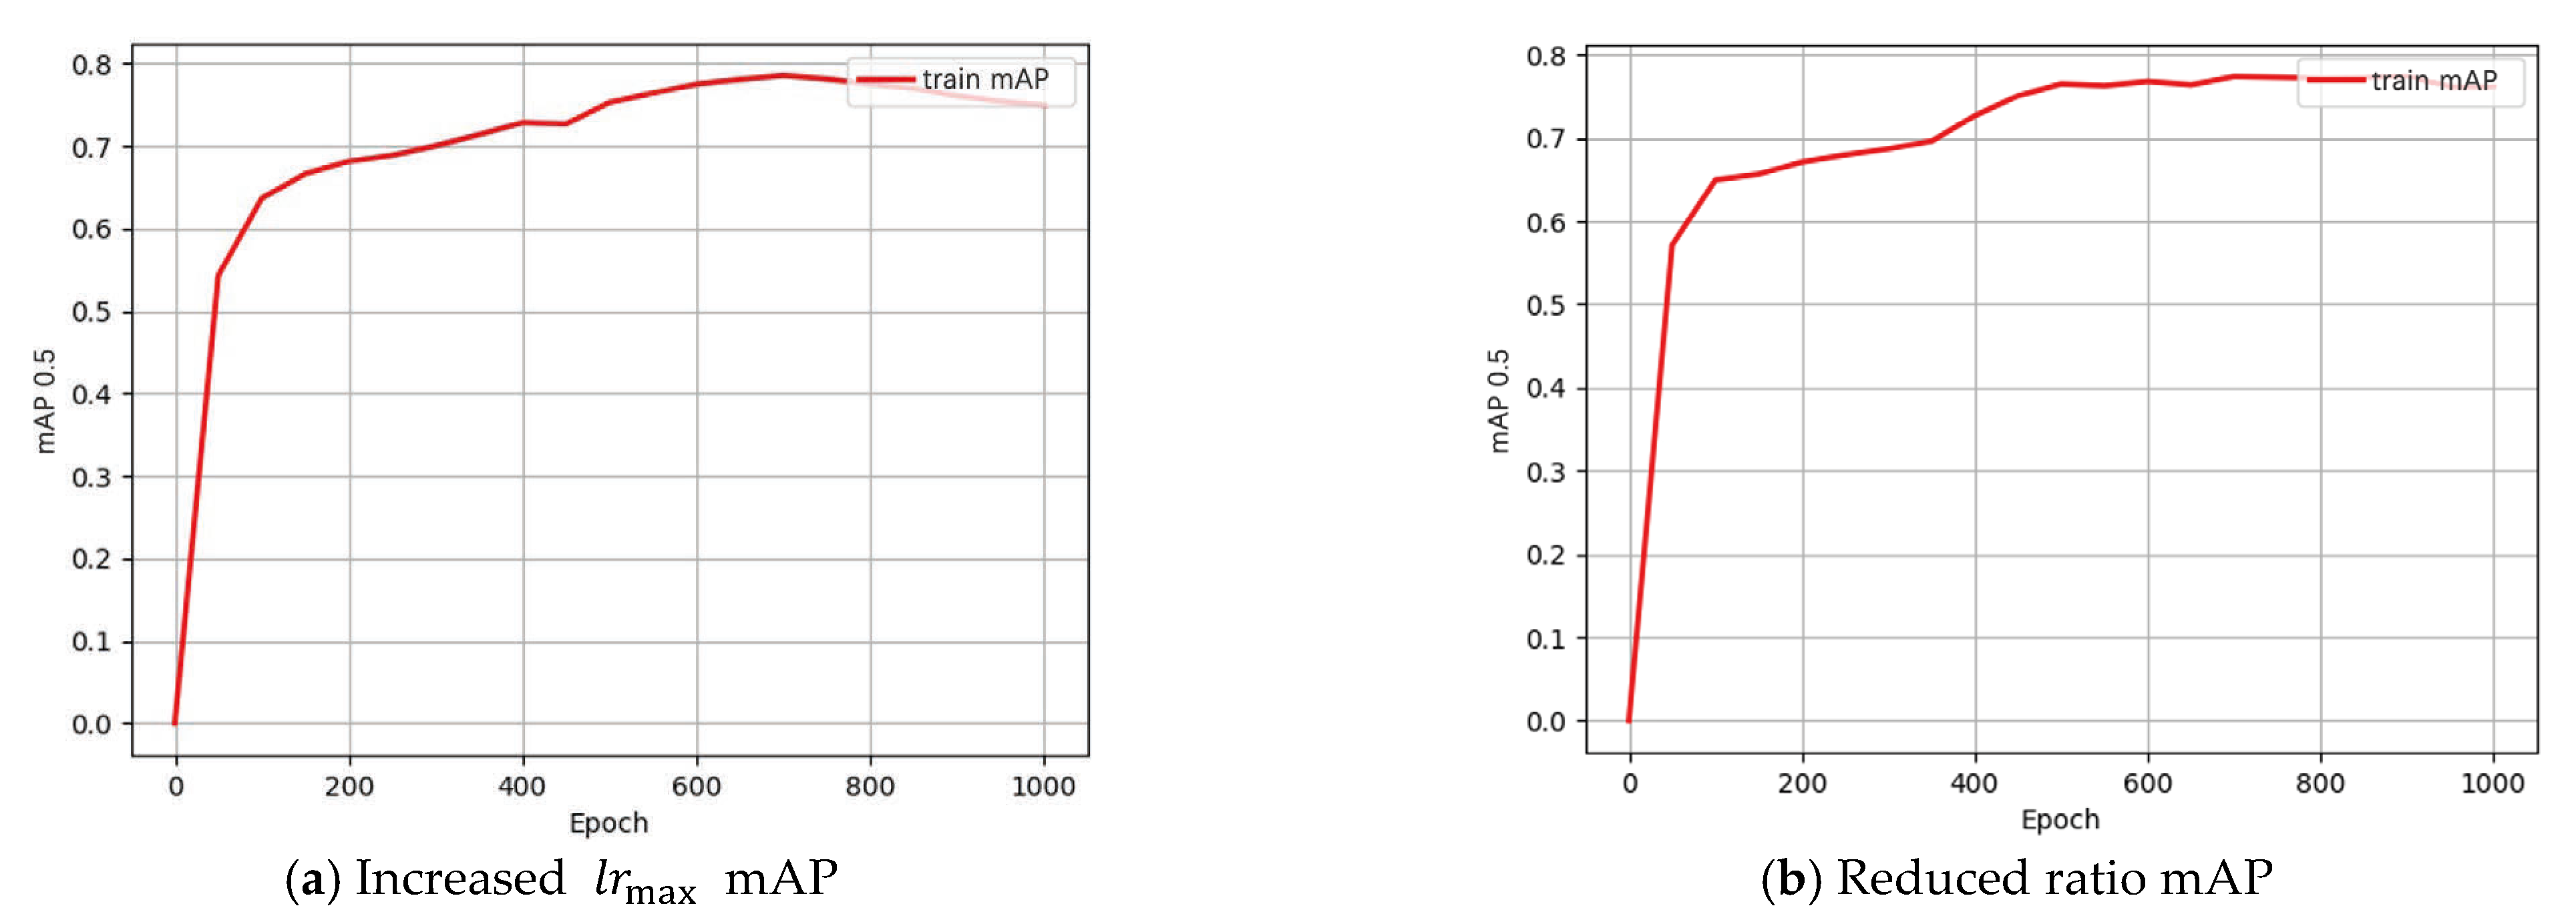
  • According to cosine annealing, decay phase learning rate is mainly affected by decay period duration. With fixed min/max learning rates, decay duration dominates performance at decay onset. For instance:
    w a r m u p _ i t e r s _ r a t i o = 0.002 , n o _ a u g _ i t e r _ r a t i o = 0.05 , warmup = 2 iterations, and fine-tuning = 15 iterations led to a 2.8% mAP drop, suggesting that reduced warmup iterations or insufficient learning rate ramping during warmup adversely affect training stability.
    w a r m u p _ i t e r s _ r a t i o = 0.005 , n o _ a u g _ i t e r _ r a t i o = 0.005 , warmup = 3 iterations, and fine-tuning = 5 iterations resulted in a 6.8% mAP decline. When the number of iterations n o _ a u g _ i t e r in the fine-tuning stage is small, the total number of decayed iterations is greater. Under the same training time, the larger the value of c o s ( i t e r w a r m u p _ t o t a l _ i t e r s t o t a l _ i t e r s w a r m u p _ t o t a l _ i t e r s n o _ a u g _ i t e r π ) , the larger the l r i t e r . However, each change in l r i t e r becomes smaller, indicating that in the initial stage of the decay phase, the degree of learning rate × decay has a greater impact on the experiment than the relative size of l r i t e r itself. At this time, we also verified that increasing l r m a x to 5 times and reducing the number of warm-up iterations by one still results in a 0.009 decrease. This shows that even if the learning rate value is significantly increased within a certain range, it cannot compensate for the impact of the reduction in the learning rate decay degree on the experiment.
In addition, an experimental comparison was conducted with YOLO v8’s feature extraction module under current optimal parameters. The result comparison is shown in Table 1. Like other experiments, the YOLO v8 experiment was also iterated for 1000 cycles and recorded the average precision mean mAP of the validation set at each stage of the model during this process, as shown in Figure 9c. At the same time, it was compared with YOLO v5 (Figure 9a) and the improved best model (Figure 9b). Compared with YOLO v8, the improved model has a more significant improvement in recall rate, enhancing the target coverage capability with a low missed detection rate; in terms of accuracy, it can be on par with YOLOv8; the F1 score indicates that the improved model achieves the best balance and has a strong overall detection capability. Analyzing the specific training process, YOLOv5, as the base model, stabilizes at 800 rounds, with the slowest convergence and overall performance lagging behind; the other two models both stabilize at 600 rounds, among which YOLO v8 shows effectiveness at 200 rounds by optimizing the architecture to achieve rapid convergence, but the training process experiences fluctuations with a decline in the middle and then an increase, presenting potential risks in generalization, and ultimately has a bottleneck in recall rate; the improved model reaches the effect of YOLOv8 at 200 rounds at 400 rounds, although the early convergence is slow, it continuously rises from 200 to 600 rounds, with a stable optimization trajectory, and ultimately has relatively outstanding overall performance.

4. Conclusions

In conclusion, the study successfully devised and validated an enhanced parallel convolution YOLOv5 model tailored for photovoltaic panel detection in remote sensing images. By substituting traditional residual connections with parallel convolution structures and incorporating bottleneck design principles, the model significantly boosted feature extraction capabilities and information transmission efficiency. This innovation yielded notable improvements: 4.3% mAP increase, 0.07 F1 score rise, 6.55% recall enhancement, and 6.2% precision augmentation. Furthermore, the research rigorously evaluated the performance of the model under various loss functions—GIoU and CIoU—and meticulously examined learning rate adjustment strategies during different training phases. Findings reveal GIoU is more effective in reducing small object false detections. The cosine annealing algorithm plays a pivotal role in managing learning rate decay dynamics. The comparative analysis against the YOLOv8 feature extraction module underscored the improved model’s superior recall rate and balanced F1 score. This indicates robustness and generalization capability. However, the method has limitations. Specifically, performance advantages may diminish as newer architectures (e.g., YOLOv9) advance accuracy–speed tradeoffs. Moreover, current evaluation focuses on technical metrics, not real-world deployment challenges like edge device computational constraints or environmental variation impacts. Future work will focus on two key areas: first, integrating emerging techniques like Efficient IoU (EIoU) with state-of-the-art detectors to maintain technological relevance. Second, conducting practical deployment studies addressing environmental adaptability through algorithms robust to illumination changes, weather, and partial occlusions. Additionally, systematic economic viability assessments and user-centric customization will be critical for translating technical improvements into industrial applications. Overall, this research optimizes PV panel detection accuracy and efficiency. It provides a robust foundation for intelligent maintenance systems in large-scale solar stations. This offers significant potential for enhancing renewable energy infrastructure management and operational efficiency.

Author Contributions

Methodology and formal analysis, J.L.; Investigation, X.M. and S.W.; Simulation analysis, J.L. and X.M.; Data collection and analysis, S.W. and Z.L.; Writing—original draft preparation, J.L.; Writing—review and editing, H.Y. and Z.Q.; Project administration, J.W. All authors have read and agreed to the published version of the manuscript.

Funding

This research was funded by Shanxi Province Science and Technology Innovation Talent Team (No. 202204051001011); Fundamental Research Program of Shanxi Province (No. 202203021212120).

Institutional Review Board Statement

Not applicable.

Informed Consent Statement

Not applicable.

Data Availability Statement

The data are incorporated within the article.

Conflicts of Interest

Authors J.L., X.M., S.W., Z.L. and H.Y. were employed by the company State Grid Shanxi Electric Power Company Electric Power Research Institute. The remaining authors declare that the research was conducted in the absence of any commercial or financial relationships that could be construed as a potential conflict of interest.

References

  1. Zhang, D.D.; Wang, C.P.; Fu, Q. A new benchmark for camouflaged object detection: RGB-D camouflaged object detection dataset. Gruyter 2024, 22, 20240060. [Google Scholar] [CrossRef]
  2. Liu, H.M.; Jin, F.; Zeng, H.; Pu, H.Y.; Fan, B. Image Enhancement Guided Object Detection in Visually Degraded Scenes. IEEE Trans. Neural Learn. Syst. 2024, 35, 14164–14177. [Google Scholar] [CrossRef]
  3. Zhao, E.Y.; Li, L.; Song, M.P.; Cao, Y.J.; Chen, S.H.; Shang, X.D.; Li, F.; Dai, S.; Bao, H. Research on Image Registration Algorithm and Its Application in Photovoltaic Images. IEEE J. Photovolt. 2020, 10, 595–606. [Google Scholar] [CrossRef]
  4. Xiong, J.; He, Z.G.; Zhou, Q.J.; Yang, R. Photovoltaic glass edge defect detection based on improved SqueezeNet. Signal Image Video Process 2024, 18, 2841–2856. [Google Scholar] [CrossRef]
  5. Li, C.X.; Yang, Y.H.; Zhang, K.J.; Zhu, C.L.; Wei, H.K. A fast MPPT-based anomaly detection and accurate fault diagnosis technique for PV arrays. Energy Convers. Manag. 2021, 234, 113950. [Google Scholar] [CrossRef]
  6. Dhoke, A.; Sharma, R.; Saha, T.K. A technique for fault detection, identification and location in solar photovoltaic systems. Solar Energy. 2020, 206, 864–874. [Google Scholar] [CrossRef]
  7. Liu, H.D.; Huang, B.J.; Chen, W.Y.; Shih, J.W. A solar energy system with a dual-input power converter and global MPPT for off-grid applications. Electr. Power Syst. Res. 2025, 243, 111497. [Google Scholar] [CrossRef]
  8. Han, M.Y.; Xiong, J.; Wang, S.Y.; Yang, Y. Chinese photovoltaic poverty alleviation: Geographic distribution, economic benefits and emission mitigation. Energy Policy 2020, 144, 111685. [Google Scholar] [CrossRef]
  9. Song, C.C.; Guo, Z.L.; Liu, Z.G.; Zhang, H.Y.; Liu, R.; Zhang, H.R. Application of photovoltaics on different types of land in china: Opportunities, status and challenges. Renew. Sustain. Energy Rev. 2024, 191, 114146. [Google Scholar] [CrossRef]
  10. Karteris, M.; Theodoridou, I.; Mallinis, G.; Papadopoulos, A.M. Façade photovoltaic systems on multifamily buildings: An urban scale evaluation analysis using geographical information systems. Renew. Sustain. Energy Rev. 2014, 39, 912–933. [Google Scholar] [CrossRef]
  11. Chen, Z.H.; Kang, Y.W.; Sun, Z.X.; Wu, F.; Zhang, Q. Extraction of photovoltaic plants using machine learning methods: A case study of the pilot energy city of golmud, China. Remote Sens. 2022, 14, 2697. [Google Scholar] [CrossRef]
  12. Zheng, Q.P.; Ma, J.M.; Liu, M.H.; Liu, Y.C.; Li, Y.X.; Shi, G. Lightweight hot-spot fault detection model of photovoltaic panels in UAV remote-sensing image. Sensors 2022, 22, 4617. [Google Scholar] [CrossRef] [PubMed]
  13. Jiang, L.J.; Yuan, B.X.; Du, J.W.; Chen, B.Y.; Xie, H.F.; Tian, J.; Yuan, Z.Q. MFFSODNet: Multiscale feature fusion small object detection network for UAV aerial images. IEEE Trans. Instrum. Meas. 2024, 73, 5015214. [Google Scholar] [CrossRef]
  14. Naeem, U.; Chadda, K.; Vahaji, S.; Ahmad, J.; Li, X.D.; Asadi, E. Aerial imaging-based soiling detection system for solar photovoltaic panel cleanliness inspection. Sensors 2025, 25, 738. [Google Scholar] [CrossRef] [PubMed]
  15. Huang, Y.P.; Kshetrimayum, S.; Sandnes, F.E. UAV-based automatic detection, localization, and cleaning of bird excrement on solar panels. IEEE Trans. Syst. Man. Cybern. Syst. 2025, 55, 1657–1670. [Google Scholar] [CrossRef]
  16. Vivone, G.; Marano, S.; Chanussot, J. Pansharpening: Context-based generalized laplacian pyramids by robust regression. IEEE Trans. Geosci. Remote Sens. 2020, 58, 6152–6166. [Google Scholar] [CrossRef]
  17. Zhang, X.F.; Feng, M.; Li, T.; Chen, J.Y.; Jiang, D.C.; Xu, J.H.; Yan, D.Z.; Zhou, X.Q.; Zhang, X.; Lu, J. High-resolutiondetection of periglacial landforms deformation using Radarsat-2 and GF-7 Stereo optical imagery. IEEE J. Sel. Top. Appl. Earth Obs. Remote Sens. 2024, 17, 10862–10876. [Google Scholar] [CrossRef]
  18. He, K.M.; Gkioxari, G.; Dollar, P.; Girshick, R. Mask R-CNN. In Proceedings of the IEEE International Conference on Computer Vision (ICCV), Venice, Italy, 2–29 October 2017; Volume 22, pp. 2980–2988. [Google Scholar]
  19. Uçar, G.; Dandıl, E. Enhanced detection of white matter hyperintensities via deep learning-enabled MR imaging segmentation. Trait. Signal 2024, 41, 1–21. [Google Scholar] [CrossRef]
  20. Hamed, B.; Ali, J. Fast uniform content-based satellite image registration using the scale-invariant feature transform descriptor. Front. Inf. Technol. Electron. Eng. 2017, 18, 1108–1116. [Google Scholar]
  21. Grimaccia, F.; Leva, S.; Niccolai, A. PV plant digital mapping for modules’ defects detection by unmanned aerial vehicles. IET Renew. Power Gener. 2017, 11, 1221–1228. [Google Scholar] [CrossRef]
  22. Zhou, J.X.; Liu, X.D.; Liu, W.Q.; Gan, J.H. Image retrieval based on effective feature extraction diffusion process. Multimed. Tools Appl. 2019, 78, 6163–6190. [Google Scholar] [CrossRef]
  23. Atik, S.O.; Atik, M.E.; Ipbuker, C.Z. Comparative research on different backbone architectures of DeepLabV3+ for building segmentation. J. Appl. Remote Sens. 2022, 16, 024510. [Google Scholar] [CrossRef]
  24. Yahyaoui, Z.; Hajji, M.; Mansouri, M.; Bouzrara, K. One-class machine learning classifiers-based multivariate feature extraction for grid-connected PV systems monitoring under irradiance variations. Sustainability 2023, 15, 13758. [Google Scholar] [CrossRef]
  25. Tan, H.J.; Guo, Z.L.; Zhang, H.R.; Chen, Q.; Lin, Z.J.; Chen, Y.T.; Yan, J.Y. Enhancing PV panel segmentation in remote sensing images with constraint refinement modules. Appl. Energy 2023, 350, 121757. [Google Scholar] [CrossRef]
  26. David, M.T.; Kerry, N.B.; Eric, R. Detection of photovoltaic solar panels with longwave-infrared spectral imaging. IEEE Trans. Geosci. Remote Sens. 2024, 62, 5521209. [Google Scholar]
  27. Zhu, G.J.; Liu, J.C.; Fan, Z.; Yuan, D.; Ma, P.L.; Wang, M.H.; Sheng, W.H.; Wang, K.C.P. A lightweight encoder-decoder network for automatic pavement crack detection. Comput. Aided Civ. Infrastruct. Eng. 2024, 39, 1743–1765. [Google Scholar] [CrossRef]
  28. Alberto, G.G.; Sergio, O.E.; Sergiu, O.; Victor, V.M.; Pablo, M.G.; Jose, G.R. A survey on deep learning techniques for image and video semantic segmentation. Appl. Soft Comput. 2018, 70, 41–65. [Google Scholar] [CrossRef]
  29. Jie, Y.S.; Yue, A.Z.; Liu, S.X.; Huang, Q.Q.; Chen, J.B.; Meng, Y.; Deng, Y.P.; Yu, Z.Y. Photovoltaic power station identification using refined encoder–decoder network with channel attention and chained residual dilated convolutions. J. Appl. Remote Sens. 2020, 14, 16506. [Google Scholar] [CrossRef]
  30. Guo, Z.L.; Zhuang, Z.; Tan, H.J.; Liu, Z.G.; Li, P.R.; Lin, Z.Y.; Shang, W.L.; Zhang, H.R.; Yan, J.Y. Accurate and generalizable photovoltaic panel segmentation using deep learning for imbalanced datasets. Renew. Energy 2023, 219, 119471. [Google Scholar] [CrossRef]
  31. Zhu, R.; Guo, D.X.; Wong, M.S.; Qian, Z.; Chen, M.; Yang, B.S.; Chen, B.Y.; Zhang, H.R.; You, L.L.; Heo, J.; et al. Deep solar PV refiner: A detail-oriented deep learning network for refined segmentation of photovoltaic areas from satellite imagery. Int. J. Appl. Earth Obs. Geoinf. 2023, 116, 103134. [Google Scholar] [CrossRef]
  32. Amiri, A.F.; Oudira, H.; Chouder, A.; Kichou, S. Faults detection and diagnosis of PV systems based on machine learning approach using random forest classifier. Energy Convers. Manag. 2024, 301, 118076. [Google Scholar] [CrossRef]
  33. Zhou, P.; Wang, R.; Wang, C.H.; Chen, H.Y.; Liu, K. SIIF: Semantic information interactive fusion network for photovoltaic defect segmentation. Appl. Energy 2024, 371, 123643. [Google Scholar] [CrossRef]
  34. Mahboob, Z.; Khan, M.A.; Lodhi, E.; Nawaz, T.; Khan, U.S. Using segformer for effective semantic cell segmentation for fault detection in photovoltaic arrays. IEEE J. Photolytic 2025, 15, 320–331. [Google Scholar] [CrossRef]
  35. Zhu, G.J.; Shen, S.L.; Yao, J.J.; Wang, M.H.; Zhuang, J.F.; Fan, Z. Automatic lightweight networks for real-time road crack detection with DPSO. Adv. Eng. Inform. 2025, 68, 103610. [Google Scholar] [CrossRef]
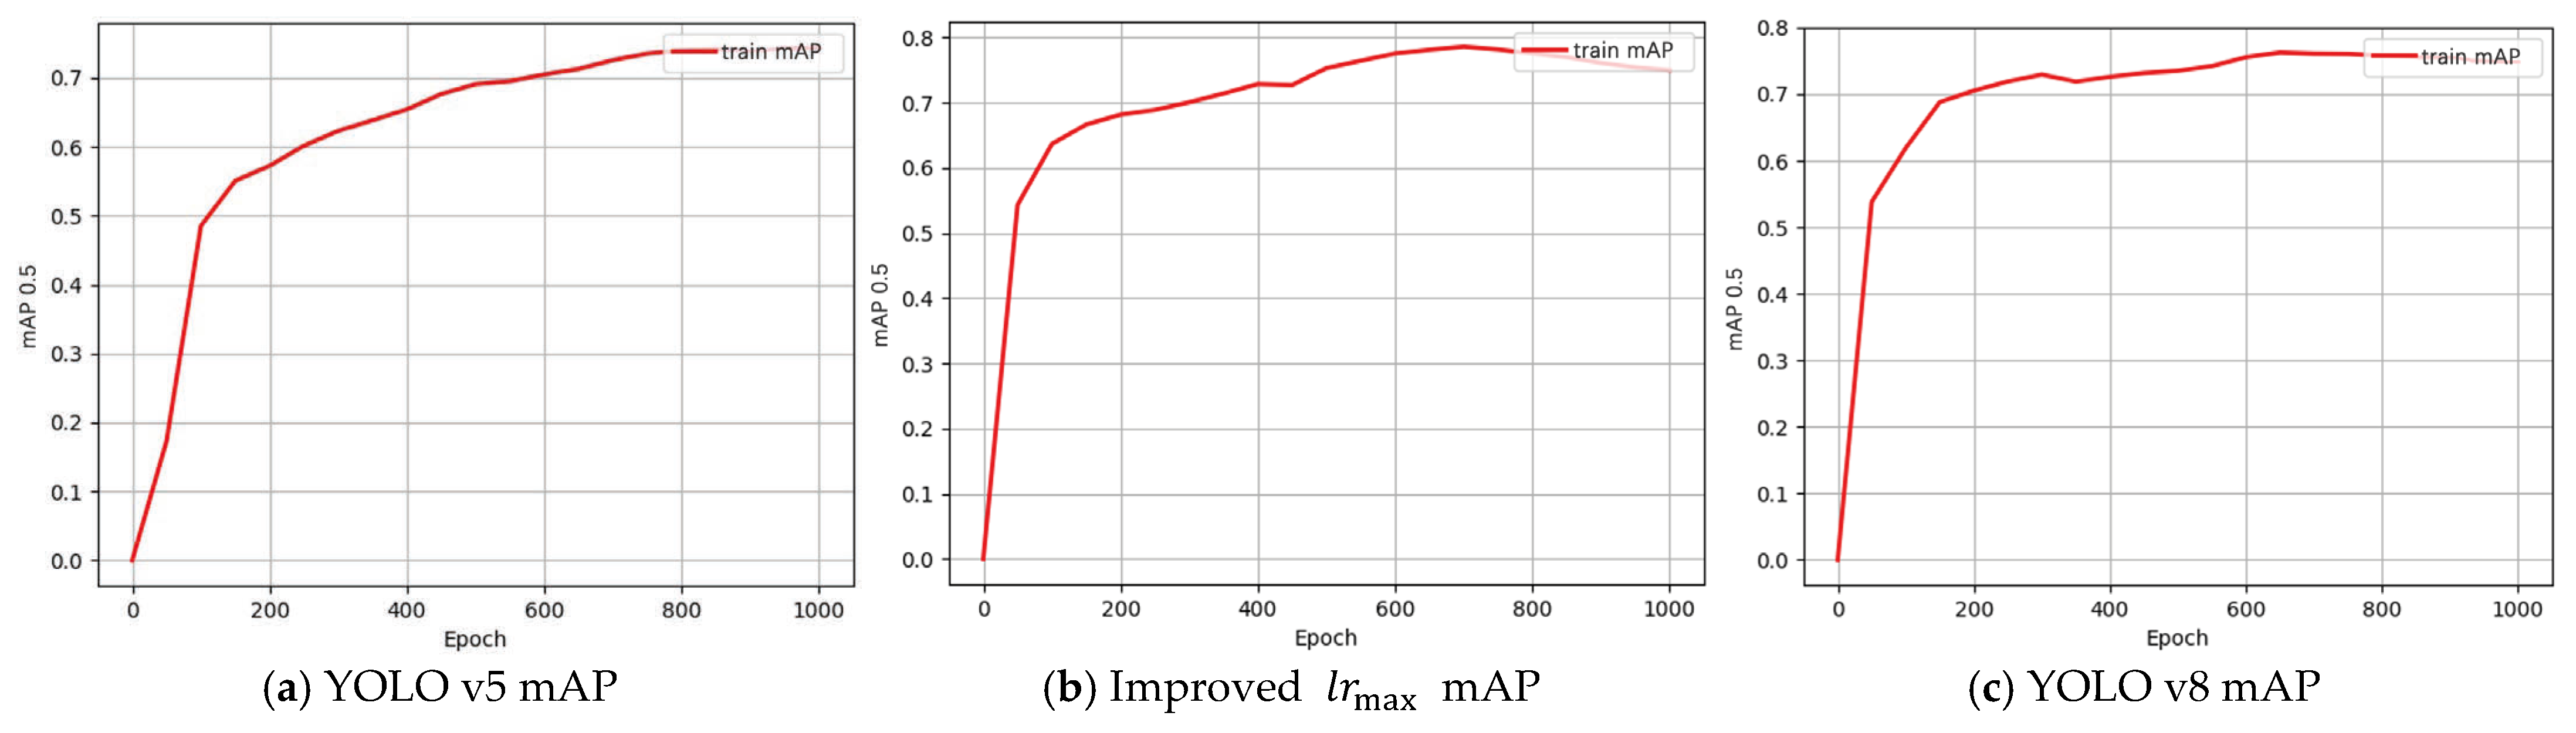
Figure 1. Overview of the model architecture.
Sustainability 17 06476 g001
Figure 2. Architectural diagram of the C3_p Module.
Sustainability 17 06476 g002
Figure 3. The mAP curves. (a) Baseline YOLOv5; (b) Enhanced parallel model.
Sustainability 17 06476 g003
Figure 4. The mAP curve with elevated minimum learning rate.
Sustainability 17 06476 g004
Figure 5. The mAP curves. (a) Increased learning rate; (b) Reduced ratio.
Sustainability 17 06476 g005
Figure 6. The loss function adjusted for the learning rate. (a) Loss with elevated minimum learning rate; (b) loss with Increased l r m a x ; (c) loss with reduced ratio.
Sustainability 17 06476 g006
Figure 7. The mAP curves under. (a) Original L o s s c i o u function; (b) L o s s c i o u reduced ratio.
Sustainability 17 06476 g007
Figure 8. Photovoltaic panel detection under diverse conditions. (a) Baseline YOLO V5; (b) Parallel model with L o s s g i o u function; (c) Parallel model with L o s s c i o u .
Sustainability 17 06476 g008
Figure 9. The mAP curves. (a) Baseline YOLO V5; (b) Improved l r m a x ; (c) YOLO V8.
Sustainability 17 06476 g009
Table 1. Comparison of experimental results of different models.
ModelRecallPrecisionF1mAP
YOLO v564.2%82.08%0.7273.4%
Improved YOLO v571.17%88.1%0.7978.6%
YOLO v866.46%88.08%0.7676.25%
Disclaimer/Publisher’s Note: The statements, opinions and data contained in all publications are solely those of the individual author(s) and contributor(s) and not of MDPI and/or the editor(s). MDPI and/or the editor(s) disclaim responsibility for any injury to people or property resulting from any ideas, methods, instructions or products referred to in the content.

