Abstract
Assessment of contaminant dispersal in sandstones requires hydraulic characterization with a combination of datasets that span from the core plugs to wellbores and up to the field scale as the matrix and fractures are both hydraulically conductive. Characterizing the hydraulic properties of the matrix is fundamental because contaminants diffuse into the fractured porous blocks. Fractures are highly conductive, and the determination of the number of hydraulically active rock discontinuities makes discrete fracture network models of solute transport reliable. Recent advances (e.g., active line source temperature logs) in hydro-geophysics have allowed the detection of 40% of hydraulically active fractures in a lithified sandstone. Tracer testing has revealed high (~10−4–10−2 ms−1) flow velocities and low (~10−2–10−4) effective porosities. Contaminants can therefore move rapidly in the subsurface. The petrophysical characterization of the plugs extracted from the cores, in combination with borehole hydro-geophysics, allows the characterization of either matrix or fracture porosity, but the volume of sandstone characterized is low. Tracer tests cannot quantify matrix or fracture porosity, but the observation scale is larger and covers the minimum representative volume. Hence, the combination of petrophysics, borehole hydro-geophysics, and tracer testing is encouraged for the sustainable management of solute transport in dual porosity sandstones.
1. Introduction
Sandstones of aeolian, fluvial, deltaic, beach, shallow marine, and turbiditic sedimentary origin host prolific groundwater resources; consequently, they are exploited for civil uses across many sites worldwide (Figure 1). Such lithologies (Figure 2) are complex because either fractures or the matrix can play a primary role in groundwater flow and solute contaminant transport in the subsurface. Indeed, fractures represent the principal driving force of groundwater flow in lithified and highly mechanically resistant (UCSnat > 20 MPa; see the lower diagram in conceptual model in Figure 3) sandstones with values of uniaxial compressional strength (UCS) exceeding 20 MPa under natural conditions [1,2,3]. In such lithologies, the network of fractures is well connected (Figure 2a–d), but the same network of rock discontinuities creates blocks of porous matrix (Figure 2b, Figure 3 and Figure 4), where diffusion of a variety of inorganic contaminants occurs [4,5,6,7]. According to this conceptualization, advection occurs through the highly conductive fractures, and the contaminants diffuse in the porous matrix blocks at contaminated sites [8]. The degree of complexity is relatively lower in porous and un-lithified sandstones (UCSnat < 20 MPa; see upper diagram in the conceptual model in Figure 3) because in these cases the porous matrix is the primary driver of groundwater flow and the transport of pollutants [9,10,11,12,13]. In contrast, the hard sandstones are characterized by a double porosity represented by the (i) intergranular matrix and (ii) network of fractures such as bedding plane discontinuities, joints, and fault planes (Figure 4) [14,15,16,17,18,19,20,21,22,23]. As a consequence of these mechanisms of contaminant dispersal in the subsurface, sandstones need to be characterized at variety of spatial scales from the core plug (the scale of the samples tested in the laboratory), borehole (the scale of the abstraction wells of drinkable water), up to the scale of the contaminated field sites (the effective scale of the plumes) to hydraulically determine both the porosities. A range of petrophysical, hydro-geophysical, and tracer testing techniques are therefore needed to inform models of solute transport in the subsurface using either the discrete fracture network (DFN) or the equivalent porous medium (EPM, or continuum for reservoir engineers) [24,25,26,27,28,29].

Figure 1.
GeoMapApp location of the sandstone aquifers studied in this review for fluid logs, quantitative flow-logging analyses, line source temperature logs (with additional straddle packer and FLUTe transmissivity profiles), and tracer test. The numbers identify specific geological formations and groups that are identified by the same number in Table 1 and were the object of specific hydrogeophysical/tracer testing surveys. Mount Simon Sandstone Formation (1), Passaic Sandstone Formation (2), Pantano Formation (3), St. Bees Sandstone Formation (4), Helsby and Wilmslow Sandstone Formations (5), Wildmoore Sandstone Formation (6), Tachen Sandstone Formation (7), Chatsworth Sandstone Formation (8), Kidderminster Sandstone Formation (9), undivided Sherwood Sandstone Group (10), Helsby and Wilmslow Sandstone Formations (11), Luxembourg Sandstone Group (12), Jizera Sandstone Formation (13), and Nepean Formation (14). Map created using GeoMappApp 3.7.5.
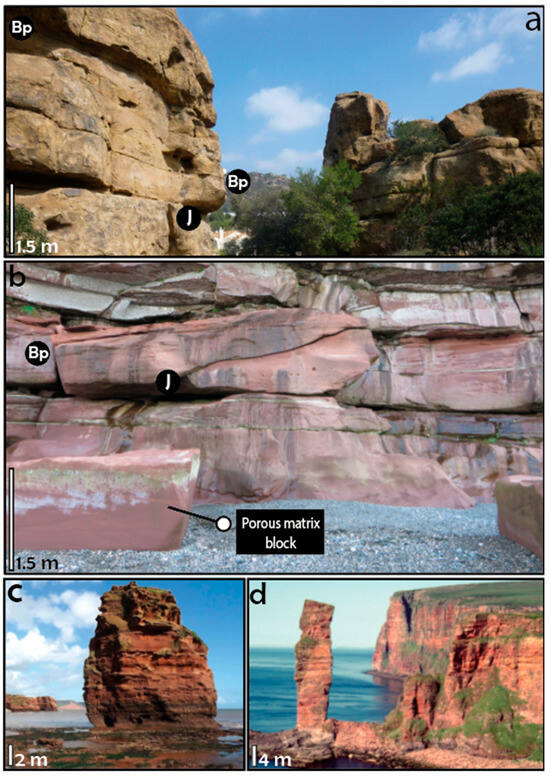
Figure 2.
Examples of lithified and fractured sandstone across the world. (a) Bedding plane fractures (Bp) and joints (J) in the Cretaceous Chatsworth Formation (California, USA). (b) Bedding plane fractures (Bp) and joints (J) in the Triassic St. Bees Sandstone Formation in England (St. Bees, UK). (c) Cliff with evident layering created by bedding plane fractures in the Triassic Otter Sandstone Formation at Ladram Bay (Wessex, UK). (d) Cliff in Scotland (Orkney, Shetland, UK) with evident layering created by bedding plane fractures in the Carboniferous New Old Red Sandstone Group.
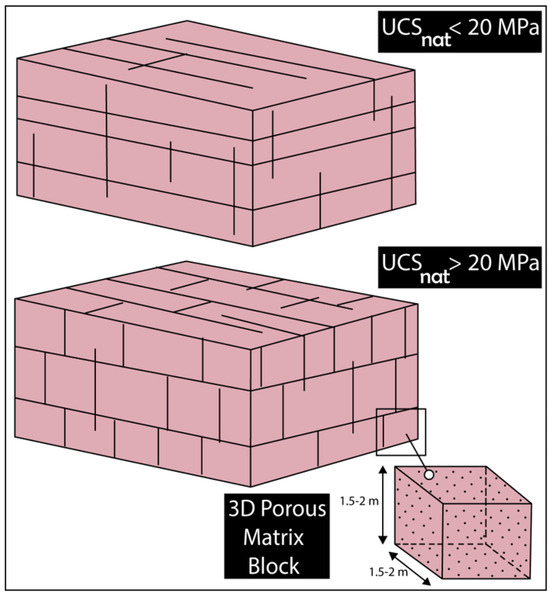
Figure 3.
Conceptual models of sandstone. Un-lithified and porous (UCSnat < 20 MPa) (upper diagram) vs. fractured and lithified (UCS > 20 MPa) sandstone with a close-up of a porous matrix block (lower diagram).
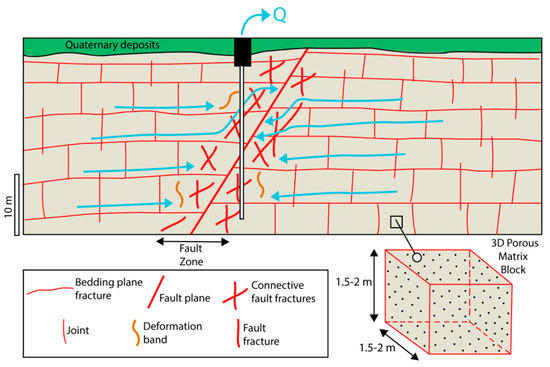
Figure 4.
Lithified and fractured sandstone with a fault and detail of a fractured block of porous matrix.
A specific article that reviews and summarizes these techniques is therefore needed due to the high number of methodologies involved. This article should incorporate the recent advanced approaches that have been proposed for tracer testing [39,40], and borehole hydro-geophysics [30,32,33,35,36] that allow the determination of the effective porosity and the individual flowing structures that represent pathways for the contaminants dissolved in sandstone geological media.
Review papers have been published in the literature, and they report the physical characteristics of specific sandstone aquifers; such reviews are characterized by their regional angle [5,42,43]. Some other review papers study the hydraulic conductivity of a specific sandstone as an analogue for hydrocarbon reservoirs buried under the sea [44]. Review papers on the Triassic Sandstone of Great Britain describes either chemical properties [45] or the minimum representative equivalent volume to determine the hydraulic conductivity [46]. In contrast to the previous reviews on sandstone aquifers, this review shows an evident worldwide prospective, and the topics of the effective porosity and the determination of the flowing fractures are new to academic reviews for siliciclastic rocks. It is also noteworthy that this research on the double porosity (matrix and fractures) in sandstones of continental and marine sedimentary origin is also relevant to other fractured sedimentary rocks, the dolostones, and chalks. Indeed, the dolomite mineral can preserve dolostones from karstification and the dolomitization process increases the matrix porosity during diagenesis [47,48,49,50,51,52]. Several of the borehole hydro-geophysical techniques (straddle packer testing and FLUTe transmissivity profiles) described in this review were developed first in a dolostone aquifer [53,54,55,56,57] and exported to a sandstone aquifer [36]. The contents of the present review can find applications in chalk aquifers because the presence of small fractures does not favor karstification [58,59,60,61,62]. The primary porosity of the matrix blocks in chalks is very high, and diffusion can occur there [63,64].
However, the proposed review is specific to shallow (~0–200 m below the ground surface) sandstone aquifers on their effective porosities. The goal is to combine traditional and/or advanced techniques to characterize the flowing geological structures and the effective porosity to inform contaminant transport models in a methodological portrayal. The specific objectives of this review on sandstone aquifers are as follows: (i) describe the techniques used to determine the total porosity and the degree of connectivity of the pores in the matrix; (ii) summarize the borehole hydro-geophysical methodologies needed to determine the number of hydraulically active fractures; (iii) present the effective porosities extrapolated from tracer tests; and (iv) address future research on the use of borehole hydro-geophysics and tracer tests to inform models of solute contaminant transport in the subsurface.
2. Petro-Hydraulic Tests
2.1. Core Plug-Scale Tests
Core plug-scale tests can be used to determine the total porosity from either outcropping or cored samples in sandstone. The multiple methods that can be used include the (i) Archimedes’ method, (ii) mercury porosimetry, and (iii) nuclear magnetic resonance (NMR) tests. The observation scale is very low (typically 5 cm), much lower than the minimum representative volume (REV) defined for fractured sandstone aquifers (35 × 35 × 35 m; [26]). As a consequence of the low volumes tested in the laboratory, the above mentioned three methods exclusively characterize the porosity of the rock matrix with all the potentially flowing fractures, which remain un-tested. The comparison of the three methods mentioned above show porosity values with discrepancy that range from 10% to 20% for the matrix of sandstone aquifers [33,65,66,67]. The discrepancies on comparing the porosities obtained using Archimedes’ method, mercury porosimetry, and nuclear magnetic resonance can be related to the issue of calibrating the nuclear magnetic resonance test machine. Alternatively, the differences are related to water and mercury that are characterized by different behaviors on entering the pores of smaller size [68].
The total porosity values at the core plug scale are normally combined in sandstones with measurements of the vertical and horizontal (respect to the sedimentary laminations) hydraulic conductivity of the matrix. Total porosity and hydraulic conductivity are plotted in binary diagrams with the y-axis of the horizontal hydraulic conductivity on non-logarithmic (Figure 5a) and logarithmic scales (Figure 5b) for the Triassic Sandstone Formation, West Cumbria (UK). The comparison shows an evident positive direct correlation only with the axis of the horizontal conductivity plotted on a log-scale (Figure 5a). However, the T2 (the nuclear relaxation time; Figure 5c) mode of a nuclear magnetic resonance test shows a direct, positive, and good (R2 is 0.70 of the linear regression) correlation with the core plug scale for horizontal hydraulic conductivity (Figure 5d) when the y-axis was not on a logarithmic scale [33]. This fact arises from the strong correlation of the T2 distribution with the connectivity and effective porosity (instead of the total porosity) of the matrix pore network as shown in sandstone aquifers as well as geothermal and hydrocarbon reservoirs in many sites worldwide [33,69,70,71]. The mercury porosimeter also provides information on the degree of connectivity of the pore network with the determination of the pore throat [65]. Of note, the nuclear magnetic resonance test was recently applied directly to the borehole, providing the total porosity of the matrix and the T2 distribution in the Nepean Formation (Potsdam Group in eastern Ontario) that consists of sandstone from the Upper Cambrian to Lower Ordovician age [41]. A slim-hole NMR tool was used in the fluvial Nepean Formation at the observation scale of the wellbore instead of the core plug [41]. NMR can characterize the total porosity at the scale of the core plug (traditional NMR) or of the wellbore (slim-hole NMR for downhole logging), and the porosity characterized in both cases is the one of the matrix blocks shown in Figure 2 and Figure 3.

Figure 5.
Examples of petro-hydraulic data extracted from a core plug in a lithified sandstone aquifer (dataset from [33]), namely, the St. Bees Sandstone aquifer. (a) Horizontal hydraulic conductivity (Kh) on a non-log scale vs. total porosity, (b) horizontal hydraulic conductivity (Kh) on a log scale vs. total porosity, (c) NMR T2, (d) NMR T2 mode vs. horizontal hydraulic conductivity (Kh) on a non-log scale.
The amount of studies that report at least one method to determine the total porosity is huge; therefore, looking at the range and average values from petrophysical [72,73,74] and hydrogeological [4] textbooks and review papers [5,43,45] is necessary. The total porosities of the sandstone matrix are high (0.05–0.35 in range) with an average of 0.22. It is noteworthy that this paragraph describes the methods and the values to determine the total porosity of sandstone aquifers in a study with a focus on the effective porosity. This paragraph with a focus on the total porosity is related to the fact that in mechanically weak sandstones (UCSnat < 20 MPa), the fracturing network is poorly developed and unconnected; therefore, the flow occurs through the matrix with the majority (those free from WanDerwaal forces) of the pore network that is assumed to be hydraulically active. The total porosity from the core plug can be considered equal to the effective porosity in the latter case of porous and un-lithified sandstones such as those depicted in the upper diagram in Figure 3.
2.2. Field Hydrogeology: Hydro-Geophysics and Tracer Tests
2.2.1. Fluid Logs
Fluid temperature, electric conductivity, and velocity logs in boreholes are used to quantify the number of hydraulically active fractures in bedrock aquifers under natural conditions using impeller flow and heat pulse meters [75,76,77]. After the determination of the number (n) of effective fractures, it is possible to extrapolate the hydraulic aperture (b) based on the cubic law using Equation (1) [78].
where T is the screened interval transmissivity, g is the gravity acceleration, and v is the kinematic viscosity of the fluid function of the water temperature. T can be determined using either slug or packer tests [44,79,80]. The number of flowing fractures can be determined by crossing the information of fluid temperature, electrical conductivity, and fluid velocity logs (detection of flowing points) using optical (OTV) and acoustic (ATV) televiewers as well as fullbore formation microimager (FMI) images (detection of the position of the fractures) [81]. This number of hydraulically active fractures is the key uncertainty in Equation (1) given the high number of techniques involved during the determination process. The observation scale of OTV, ATV, and FMI is the same as a slim-hole NMR used for the first time in the fluvial Nepean Formation, Ontario [41]. The effective porosity in fracture flow sandstones can be determined with field data using Equation (2) by combining electrical conductivity, temperature, and fluid velocity logs with slug or packer tests. In fact, the effective porosity (Φ) in fractured rocks is identified by knowing the number of flowing fractures (n), the average mechanical aperture (b), and the thickness of the interval (t) tested with slug or packer tests [78].
Low values of effective porosity (~10−4) have been detected in the Sherwood Sandstone Group of Great Britain and the Cambrian Mount Simon Formation in Wisconsin using Equation (2). The low value (~10−4) is typical of fractured rocks [30,32,35,46]. Flow-logging analyses undertaken in these lithified and fractured sandstone aquifers show sharp velocity variations in correspondence of large bedding fractures. Similar outcomes with the major flow points have been found where large bedding plane fractures have been identified using acoustic and optical televiewer logs and flow velocity logging in the Miocene shallow-marine sandstones of the Pantano Formation, northern Italy [7]. Focusing attention to the number of hydraulically active fractures detected using fluid velocity logs [34] in the Sherwood Sandstone aquifer of the Cheshire Basin and [31] in the Passaic Sandstone Formation in New Jersey, a low proportion (20%) of fractures with measurable flow were identified using borehole flow-logging, with values similar to the St. Bees Sandstone Formation (Sherwood Sandstone Group, West Cumbria) where the proportion was 9% according to Medici et al. [32]. The percentage of flowing fractures is 15% in the marine fluvial/alluvial Mount Simon Formation in Wisconsin [30]. Ref. [26] also pointed out the importance of bedding parallel fractures on conducting water flow in the Sherwood Sandstone aquifer in the Cheshire Basin at relatively shallow depths (<150 m). These authors found from analyzing fluid logs that 10% of fractures produced detectable water flow. Lo et al. [35] combined acoustic televiewer logging with the fluid velocity from a heat pulse flow meter and found that the 16% of fractures are effectively flowing in the Triassic sandstone of the Tachien Sandstone Formation at Chenyulan River Watershed, Nantou, Taiwan. It is noteworthy that all these authors found a narrow range (10–20%) of the percentage of flowing fractures in sandstones when combining fluid electrical conductivity (accuracy of a few μS/cm) and temperature (accuracy ± 0.15 °C) logs with an impeller flow meter (minimum observable flow rate of 10 mm/s) in the alluvial Passaic Sandstone Formation in New Jersey [31], the fluvial St. Bees Sandstone Formation in northern England [32], the fluvial Wildmoore Sandstone Formation in southern England [34], and the fluvial/aeolian Helsby Sandstone in western England [26]. All the geological formations mentioned in this sub-paragraph are mapped in Figure 1; the age and the specific depositional paleo-environment is reported in Table 1.

Table 1.
Details of the depositional paleoenvironment are provided for sandstone studied in this review and shown with codes in Figure 1. T, EC, and V indicate the temperature, electrical conductivity, and velocity of the fluid in the borehole.
2.2.2. Quantitative Flow Log Analysis
The combination of fluid velocity logs (minimum observable flow rate of 10 mm/s also in this case) under pumped conditions with the transmissivity from well tests allows for the determination of the hydraulic conductivities of specific portions (typically 5 up to 10 m thick) of fractured rocks after a desk study for the computation of data [82]. The logs of hydraulic conductivities can be computed using fluid velocity logs and pumping test data using the methodologies (Moltz or FLASH program) described in detail by [77,83]. Equation (3) represents the key formula to describe the quantitative flow log analysis in both cases:
where T is the total transmissivity from a pumping test, Δvi is the difference in velocity of the specific interval of fractured rock extrapolated from a fluid velocity log, and Vmax is the maximum velocity shown by the same fluid velocity log. Ti is the transmissivity of the specific interval (the key and unknown parameter of the equation) that can be computed knowing the other three parameters (T, Δvi, and Vmax) from the hydro-geophysical dataset. Transmissivity/hydraulic conductivity logs have been generated from the lithified sandstones the Triassic St. Bees Sandstone Formation in West Cumbria, northwestern England [32], the marine fluvial/alluvial Cambrian Mount Simon Formation in Wisconsin [30], and the fluvial Triassic Tachien Sandstone Formation in Taiwan [35]. In all the three hydro-geophysical surveys, optical, and acoustic televiewer images were used to unravel the nature of the flowing geological structures. In total, 80% of the transmissivity was estimated to relate to five bedding plane fractures in the Cambrian Mount Simon Sandstone aquifer studied by [30] in Wisconsin. This conclusion was drawn from the Cambrian Sandstone in Wisconsin by comparing the screened intervals, with each characterized by a percentage of total transmissivity with the acoustic/optical televiewer logs.
The same approach (use of quantitative flow log analysis proposed by [77,83]) was used in the shallow (<150 m depth) St. Bees Sandstone Formation aquifer, West Cumbria. Here, in northwestern England, marked conductivity, temperature, and flow velocity variations in wellbore fluid logs are localized to bedding parallel fractures and faults that represent the major borehole inflow/outflow horizons [32]. Proof of the key role of fractures on driving flow to wells in the aquifer include (i) abrupt variations in flow-log fluid velocity in association with major fractures, and (ii) up to 15 m thick stratigraphic intervals showing no detectable inflows, suggesting how the matrix is a minor contributor to hydraulic conductivity in the shallow (<150 m depth) part of the aquifer. Quantitative analysis of wellbore flow logs from the St. Bees Sandstone aquifer shows that fractured zones characterized by hydraulic conductivity higher than 5.8 × 10⁻⁵ ms−1 typically represent up to 50% of the overall transmissivity and are represented by the following geological structures: cataclasites where faults intersect the boreholes; discrete large bedding fractures; and clusters of minor bedding discontinuities (Figure 3). In each borehole, the percentage of hydraulically active fractures vary from 5% to 15% in the St. Bees Sandstone Formation; similarly to the Mount Simon Sandstone aquifer where the number of flowing fractures appear low. The major inflows/outflows are bedding plane fractures and fault planes in the St. Bees Sandstone Formation. In this formation of fluvial sedimentary origin, the fractures are enlarged by the groundwater flow that dissolves the aragonite, calcite, and dolomite cements [32,33]. It is noteworthy that the St. Bees Sandstone Formation approaches a purely fractured flow system because the ratio between hydraulic conductivity of the pumping tests and matrix is particularly high (~102) [5,32,33,43]. Key hydraulically active zones (K > 2.3 × 10⁻⁵ ms−1) with bedding plane fractures were found in association with stratabound sub-vertical joints in either the Triassic Sandstone of northwestern England [32] or the Carboniferous Sandstone in Taiwan [35].
To sum up, the combination of pumping (or packer) tests and traditional impeller and heat pulse flow meters for the assessment of fluid velocity show that well lithified sandstones can behave as fractured systems, even with a limited numbers of fractures that flow in the borehole. The hydraulic conductivities of such fractured sandstone intervals can be higher than 2.3 × 10⁻⁵ ms−1 [30,32,35]. The three geological formations (St. Bees Sandstone Formation, Mount Simon Sandstone Formation, and Tachien Sandstone Formation) mentioned in this sub-paragraph are mapped in Figure 1; the age and the specific depositional paleo-environment are reported in Table 1.
2.2.3. Borehole Hydraulic Tests with Active Line Sources Logs
Sandstone aquifers have been recently tested with more advanced hydro-geophysical techniques with the combination of (i) FLUTe transmissivity profiles [84], (ii) straddle packer tests [56], (iii) rock core permeability tests [33,65], (iv) active line source temperature logs [53,54,55], and (v) rock core VOC concentration profiles [85] to determine the number and position of hydraulically active fractures in a borehole (196 m in length) at the Santa Susanna field site, California. Of note, the literature in brackets describes the methodology necessary to use each of the five techniques applied at the Santa Susanna field site by Bairos et al. [36] on the Cretaceous Chatsworth Formation (mapped in Figure 1, and depositional paleo-environment reported in Table 1). This geological formation is a lithified sandstone of Cretaceous age with a turbiditic sedimentary nature with silty layers interbedded [14,86]. The application of the set of techniques described in this paragraph has shown that 40% of the identified fractures are active in this borehole with a frequency of 0.61 hydraulically active fractures for each logged meter.
A key finding is that Bairos et al. [36] found that the number of hydraulically active fractures detected by combining FLUTe transmissivity profiles, straddle packer tests, rock core permeability tests, active line source temperature logs, and rock core VOC concentration profiles is 40%, which is higher than the 9% to 20% in sandstone aquifers found by previous authors in other lithified sandstones in the Late Triassic in New Jersey (USA), the Early Triassic in West Cumbria (UK), the Early Triassic in Cheshire (UK), and the Cambrian in Wisconsin (USA) [26,30,31,32]. The higher proportion (40%) of hydraulically active fractures found by Bairos et al. [36] is related to the better accuracy of the active line source temperature sensor, which is 10−3 °C. Indeed, this high resolution is much better than the resolution of 10−1 °C that characterized the traditional fluid temperature logs used by the other authors in lithified sandstones studied by [26,30,31,32]. The number of flowing fractures can be very high, and the major bedding plane fractures do not exclusively drive the groundwater flow as pointed out by the quantitative flow-logging analyses performed in Wisconsin [30], in Taiwan [35], and in Great Britain [32]. The approach proposed by Bairos et al. [36] is also superior because it is green and non-invasive; the liners of the FLUTe technology that seal the boreholes are flexible and removable [84]. The Cretaceous Chatsworth Formation is a turbidite; therefore, a comparison with other types of sandstone of shallow marine (Table 1) and continental origin might be difficult. However, the sandstones in Figure 1 are lithified and fractured, so a comparison is reasonable. Additionally, specific research on the fracturing pattern shows a stratabound fracturing network for the Cretaceous Chatsworth Formation in California, the St. Bees Sandstone and Helsby formations, and the Wilmslow Sandstone formations in England [20,32,42].
2.2.4. Tracer Tests
Point-to-point (typically well-to-well in sandstone aquifers with large springs absent) tracer tests offer the chance to investigate fractured and karst aquifers at a larger scale with respect to borehole hydro-geophysics. Although these types of tests are much more common in karst aquifers of carbonate origin, a few case studies have also been published in sandstone aquifers [45,46]. The literature is narrow on point-to-point tracer tests on sandstone aquifers due to the assumption that they are primary matrix flow geological media, sometimes fractured and far from being karstic. Tracer transport was considered not rapid enough to perform tracer tests by geoscientists and high dilution, an issue that might prevent the detection of hydraulically active fractures at the field-site scale in sandstone [42]. Despite this partial limitation, some papers have been published on tracer testing in sandstones and are therefore reported in this scientific review [5,37,38,39,42]. Tracer tests are able to determine the flow velocity, which is expressed by Equation (4) derived from the Darcy’s law under conditions of advection and laminar flow [38,87,88]:
where K is the hydraulic conductivity, I the hydraulic gradient, and is the effective porosity (note that this parameter is defined by Equation (2) in fractured bedrock aquifers). The hydraulic conductivity can be easily determined by performing pumping tests, which are typically available at study sites based on searches of the databases of either geological surveys or environment agencies (e.g., [5]). The hydraulic gradient “i” is also easy to determine using a minimum of three piezometers at a study site. Therefore, the value of the effective porosity (the key uncertainty in Equation (4)) can be determined using Equation (4) considering that (i) the flow velocity can be measured by tracer testing, (ii) pumping tests provide K, and (iii) piezometers provide “i”.
Outputs from a few point-to-point tracer tests have been published on the porous and non-lithified Triassic fluvial sandstones of Yorkshire, West Midlands, and Cheshire regions in Great Britain where the average hydraulic conductivities are 2 × 10⁻⁵ ms−1 [5]. Here, low travel average linear velocities of 1.7 × 10⁻⁵ and 3.5 × 10⁻⁵ ms−1 indicate matrix flow; hence, high values of effective porosities (0.15–0.25) at Carlton in the Eastern England Shelf and Hodnet in the Worcester Basin were extrapolated considering hydraulic gradients ranging from 0.01 to 0.1 at both the sites [5,42]. Geoscientists injected fluorescent dye into a borehole and recorded the breakthrough at inflow points along a tunnel in Liverpool in the Triassic sandstone of the Mesozoic Cheshire Basin, England [5,37,38]. Here, the average linear flow velocity was 1.6 × 10⁻³ ms−1, which more commonly can be detected in karst aquifers of carbonate sedimentary nature instead of porous sandstone [87]. Taking into account 0.1 for the hydraulic gradient and 2 × 10⁻⁵ ms−1 of average linear flow velocity the average hydraulic conductivity at the study site in the Liverpool area, the effective porosity is 1.4 × 10⁻³ for this lithified sandstone of Triassic age [5,37,38]. High groundwater flow velocities based on as average peak and maximum flow velocities have been detected in the fluvial Jurassic Sandstone of Luxembourg (4.4 × 10⁻³ to 9.7 × 10⁻² ms−1) and the turbiditic Cretaceous in the Czech Republic (maximum flow velocities reported 2.2 × 10⁻² to 2.02 × 10⁻¹ ms−1) respectively, using tracer testing. Such flow velocities do not match a porous aquifer, but they can fit fractured sandstones with fractures enlarged by groundwater flow. The effective porosity ranges from 10−2 and 10−4 for the lithified Jurassic Sandstone of Luxembourg [39] and the Cretaceous Sandstone in the Czech Republic [40], respectively. This review of the effective porosity values from a variety of lithified sandstones across Europe has shown that the average linear flow velocities can be up to 10−4 ms−1 in lithologies, such as limestones, dolostones, chalks, and meta-igneous rocks [87,89]. All the geological formations mentioned in this sub-paragraph are mapped in Figure 1; the age and the specific depositional paleo-environment is reported in Table 1.
3. Hydraulic Tests for Contaminant Transport Modeling
3.1. Equivalent Porous Medium
The equivalent porous medium (Figure 6a) approach has been used in sandstone aquifers with a variety of numerical codes (e.g., MODFLOW, FEEFLOW) to determine the velocity (V) of groundwater under laminar flow conditions using Equation (4) if the hydraulic conductivity (K), the hydraulic gradient (i), and the effective porosity are known or estimated. The hydraulic conductivity can be easily determined by performing pumping tests in sandstone aquifers with a match between the hydraulic conductivity of the pumping tests and that of the groundwater flow models [5,33,45,46,90]. This value from the pumping tests covers the minimum representative volume and is therefore reliable at the regional scale of the groundwater flow models due to the absence of significant groundwater dissolution (or pseudo-karst) in fractured sandstone aquifers [4]. The literature on groundwater dissolution in fractured sandstone aquifers of fluvial, alluvial, deltaic, and turbiditic origin is relatively narrow and can be found in [39,40,46]. The hydraulic gradient is computed by groundwater flow models, and the piezometers are typically available at the study sites as explained in the previous paragraph. The key issue is to use a value of effective porosity in groundwater flow models based on either hydro-geophysical or tracer tests for lithified fractured sandstones. A high value of effective porosity that approaches the total porosity of the core plug has been used by previous authors in porous sandstones to run particle tracking and solute contaminant transport models using MODPATH and MT3DMS, respectively. This high value of effective porosity ranges from 0.15 to 0.25; these values were used in contaminant transport models built to represent capture zones and pollutant transport in the porous and un-lithified fluvio-aeolian sandstones of the Triassic age in Great Britain [91,92,93]. In contrast to this scientifically rigorous scenario depicted for porous sandstones, the effective porosity should be much lower (10−2–10−4) than the total one extrapolated in the laboratory when modeling flow and contaminant transport in lithified and fractured sandstones. Here, a gap exists in the hydrogeological literature because the methods to detect effective flowing fractures using borehole hydro-geophysics have been developed in the last 10 years [36]. Low (~10−2–10−4) values of effective porosities extrapolated by tracer test data in sandstones with fractures enlarged by groundwater flow have also been recently proposed [39,46,90] and therefore not yet inserted to inform particle tracking and solute contaminant transport models.

Figure 6.
Equivalent porous medium (EPM) (a) vs. discrete fracture network modeling (b) with matrix (DFN-M sensu 99) in sandstone aquifers.
3.2. Discrete Fracture Network
Hydro-geophysical tests were used worldwide to inform discrete fracture network models of sandstone aquifers as described in this paragraph. A DFN approach (Figure 6b) in a sandstone aquifer has been used in the Carboniferous sandstone of Northeast England. This fluvial sandstone of Carboniferous age is highly mechanically resistant (UCS > 20 MPa), fractured with hydraulic apertures sensitive to the applied stress. Therefore, flow velocities are highly sensitive to stress release in proximity to mineral pit excavations [94]. This finding has been achieved by applying DFN and ELFEN as a method and numerical code, respectively (by Rockfield Global, Cardiff) to rock mechanics modeling. Fracture aperture responses to stress release in the Carboniferous sandstone of Northumberland were studied on several excavation profiles, and the network of fractures have been built based on outcrop information from scanlines and acoustic televiewer logs acquired in the aquifer [94].
In contrast to the DFN model described in the previous lines, Ref. [26] built a DFN flow model using NAPSAC (by AMEC) as the numerical code for the Helsby Sandstone Formation in the Cheshire Basin located in the Merseyside area in northwestern England. This work used DFN modeling to assess fracture network connectivity in its minimum representative equivalent volume (sensu [95,96,97]) of 35 m × 35 m × 35 m (Table 1). In this sedimentary basin that hosts an aquifer in Cheshire, rock discontinuities are highly conductive (Kwell-test/Kcore plug = 5; [44]), and a DFN at the scale of the industrial site (~10 km2) can be used given the availability of an intense characterization of the fracture pattern. DFN modeling produces distributions of fractures and bedding planes and compares statistical values with observed datasets from outcrop scanline surveys and borehole televiewer logs to represent positions, spatial dimensions, and hydraulic apertures of rock discontinuities as explained in [26]. To achieve the DFN model published by [26], more than 1000 fractures were characterized by performing outcrop scanlines and hydro-geophysically logging the aquifer in open boreholes. In terms of numerical modeling, this DFN of the Triassic Sandstone aquifer of Merseyside assumes that the matrix is non-conductive; hydraulic conductivities of bedding plane fractures were extrapolated from packer tests [26].
Switching to a smaller spatial scale (1–5 km2) to represent solute pollutant transport, the DFN approach was used to assess the lithified turbiditic Cretaceous sandstones of California and Colorado and the alluvial Cambrian Sandstone of Wisconsin [98,99,100,101]. In the cases of research previously mentioned, the use of MAFIC/FRACTRAN (both developed by Golder Associates, Mississaugua, ON, Canada) as numerical codes allowed representation of solute advective transport and diffusivity in the fractures and porous matrix, respectively [102,103,104,105,106,107]. This method, named DFN-M (M indicates the matrix of the blocks incorporated in a discrete fracture network as shown in Figure 6b), combines EPM and DFN and uses either core plug-scale tests to determine the hydraulic conductivity of the matrix or field hydro-geophysics [99,100,101]. The mechanical aperture was determined by combining borehole optical and acoustic televiewer logging and packer tests using the cubic law (Equation (1)) for the turbiditic Cretaceous sandstones of California and Colorado and the alluvial Cambrian Sandstone of Wisconsin [98,99,100,101]. The effective number of flowing fractures was assumed to be equal to the total number without applying the combination of FLUTe transmissivity profiles, straddle packer tests, rock core permeability tests, and active line source temperature logs as described in Bairos et al. [36]. However, the DFN models developed by [98,99,100,101] for the lithified sandstone aquifers in North America advanced the one proposed by [26] in Great Britain because the models developed in the US account for the matrix hydraulic conductivity and therefore advection/diffusion.
4. Future Research Pathways
The definition of the (i) effective flowing structures and (ii) porosities described in this review are of paramount importance to achieve reliable representation of particle tracking and solute transport in sandstone aquifers, and they represent key uncertainties in solute transport modeling. The definition of the number of flowing fractures can be determined by either using advanced borehole hydro-geophysics [35,36,77] or tracer tests [39,46]. The uncertainties on the connectivity, aperture, capillarity entry pressure, and position of the fractures that affect their participation in the fluid flow have caused the practical solution involving “all the fractures connected and active” in DFN models of fluid flow (e.g., Figure 6b). However, identifying the exact percentage of hydraulically active fractures would make DFN models (i) more realistic and (ii) lighter by reducing the volume of computations due to the lower number of meshes. Such realistic and light DFN models incorporate the effective fracturing density (or the effective P32, see [29,108,109] for the definition of this parameter) in the absence of hydraulically inactive rock discontinuities (Figure 7). Simulating fluid flow in DFN models with the total and highest number of fractures is computationally heavy as shown in the conceptual model in Figure 7. Sometimes DFN models built using the total number of fractures are impossible to run, and we have proposed in the paragraph a practical solution to avoid the issue.
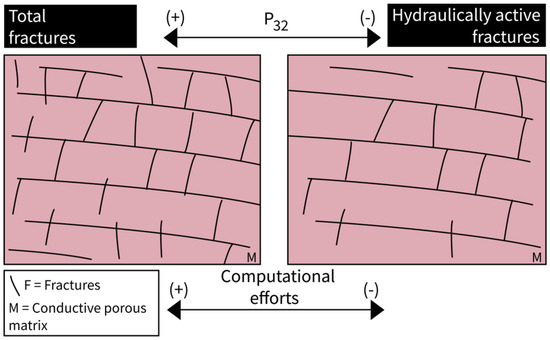
Figure 7.
Discrete fracture network modeling with conductive porous matrix vs. effective P32 in lithified sandstone aquifers.
Although the proposed research has shown a significant advance on determining the physical properties of sandstone aquifers, two points need to be addressed by researchers in the upcoming years. First, a combination of rock core permeability tests, FLUTe transmissivity profiles, straddle packer tests, and active line source temperature logs is necessary to detect numerous hydraulically flowing fractures as shown in lithified sandstones of the Cretaceous age by Bairos et al. [36] and run DFN-M models. Rock core permeability tests are necessary to characterize the matrix, and FLUTe transmissivity profiles/straddle packer tests are used to determine the transmissivity of layers of fractured rocks. The active line source temperature logs aim to determine the number of hydraulic actives fractures. Line source temperature logs are useful to determine inflow points, but issues arise on determining outflow points that need accurate tools to detect the flow velocity. More research efforts still need to be performed to increase the sensitivity of fluid velocity logs to accurately detect all the hydraulically active fractures to inform solute transport using DFN-M models (Figure 6b and Figure 7). Secondly, a DFN-M approach is an excellent method because it differentiates between the core plug-scale porosity of the matrix blocks (such as those in Figure 2b, Figure 3 and Figure 4) and the flowing fractures of the lithified sandstones. Point-to-point tracer tests are not capable of quantifying the value of the two types of porosities (matrix and fractures), but they characterize a larger volume of the fractured sandstone that is certainly capable of covering the minimum representative volume (e.g., 35 × 35 × 35 m according to [26]). Borehole hydro-geophysics is not capable of detecting the minimum representative volume of fractured sandstones. Therefore, hydrogeologists should combine borehole hydro-geophysics and tracer testing to characterize either the (i) matrix and (ii) fracture porosities and (iii) cover the minimum representative volume to properly model pollutant transport in fractured sandstones. These three key physical parameters (matrix and factures porosities, and representative equivalent volume) can be studied with a minimum of two wells. Coring and running hydro-geophysical tests would be possible in each of the two wells. Then, a well-to-well tracer test can be performed to characterize more volume of rock.
5. Conclusions
Fractured sandstones represent productive aquifers exploited for civil use in many sites worldwide. Groundwater flow and pollutant transport are complex in such geological media of sedimentary origin due to the conductivity of either the porous matrix or the fracture network. Therefore, a variety of petro-physical, hydro-geophysical, and hydraulic tests and modeling approaches (Equivalent Porous Medium, and Discrete Fracture Network) are applied in sandstones to represent the flow and the transport of the contaminants as shown in this research. The findings of the present review can be summarized as follows:
- The porous matrix plays a key role in diffusion of contaminants in the blocks created by the fracture network. The hydraulic properties of the matrix can be determined using a variety of core plug-scale tests for characterization of the porosity (Archimedes’ method, mercury porosimetry, and NMR), pore network connectivity (Archimedes’ method, mercury porosimetry, and NMR), and hydraulic conductivity (laboratory mini-permeameter).
- The effective number of flowing fractures can be high in lithified and turbiditic sandstones, and the most sensitive borehole hydro-geophysical techniques (FLUTe transmissivity profiles, straddle packer tests, and active line source temperature logs) have highlighted that 40% of fractures are hydraulically active in this litho-type. This percentage contrasts with the lower and unreal percentages (9 to 20%) detected using traditional fluid logging in the fractured sandstones of Great Britain, North America, and Taiwan. The effective number of hydraulically active fractures characterized using advanced hydro-geophysics must be used to represent advection and diffusion in discrete fracture network models with some practical use in the water industry (e.g., NAPSAC by AMEC).
- Well-to-well tracer tests can be used to measure flow velocities and to determine the effective porosity, which is a required parameter for equivalent porous medium models that track particles in sandstone aquifers using a variety of numerical codes, some of which are commonly used in industry (e.g., MODFLOW, MODPATH, MT3DMS). This type of tracer test has revealed low (~ 10−2 to 10−4) values of effective porosity that fit fractured flow systems for some lithified sandstones in northern and eastern Europe.
- Either the (i) combination of borehole hydro-geophysical tests (FLUTe transmissivity profiles, straddle packer tests, and active line source temperature logs) and core plug-scale tests, including the DFN-M approach, or (ii) traditional tracer tests have been examined in this review. DFN-M characterization determines both the porosities of the matrix and fractures, but the observation scale is limited to the single-borehole scale. Well-to-well tracer tests cannot differentiate the two porosities of the sandstone, but the volume tested is much larger. Hence, hydrogeologists employed in this industry and various agencies should combine borehole hydro-geophysics and tracer testing to characterize either the matrix or fracture porosities and cover the minimum representative volume to achieve a reliable representation of contaminant transport in fractured sandstones.
Overall, this review has shown that hydraulic tests at the scales of the core plug and of single and multiple boreholes (point-to-point tracer test) are needed to detect the effective number of fractures that flow and to represent either advection or diffusion in sandstone aquifers. Traditional and innovative techniques are needed to represent contaminant transport in fractured sandstones, and new research efforts are encouraged to improve the sustainability of these systems.
Author Contributions
Conceptualization, P.Y.A., F.F., and G.M.; methodology, P.Y.A. and G.M.; software, G.M.; validation, P.Y.A., F.F., and G.M.; formal analysis, G.M.; investigation, P.Y.A., F.F., and G.M.; resources, P.Y.A., F.F., and G.M.; data curation, P.Y.A.; writing—original draft preparation, P.Y.A. and G.M.; writing—review and editing, P.Y.A., F.F., and G.M.; visualization, P.Y.A., F.F., and G.M.; supervision, G.M.; project administration, G.M. All authors have read and agreed to the published version of the manuscript.
Funding
This research received no external funding.
Data Availability Statement
The data are available from the authors on reasonable request. However, this is a review paper, and all the data are available from the literature cited in the References.
Acknowledgments
The conclusions of this review benefited from discussions with Beth Parker, John Tellam, and Jared West at the University of Guelph (Canada), University of Birmingham (UK), and University of Leeds (UK), respectively. The manuscript also finds inspiration from constructive interaction with the students in Engineering Geology run by the Sapienza University of Rome (Italy). Finally, the paper benefited from a first assessment of the Special Issue Guest Editor Paolo Ciampi (Sapienza University).
Conflicts of Interest
The authors declare no conflicts of interest.
References
- Whitworth, L.G.; Turner, A.J. Rock socket piles in the Sherwood Sandstone of Central Birmingham Title of the article. In Proceedings of the Conference on Piling and Deep Foundations, London, UK, 15–18 May 1989; Institution of Civil Engineers: London, UK, 1989; pp. 327–334. [Google Scholar]
- Daw, G.P.; Howell, F.T.; Woodhead, J.A. The effect of applied stress upon the permeability of some Permian and Triassic sandstones of northern England. Int. J. Rock Mechan. Min. Sci. Abst. 1974, 12, 537–542. [Google Scholar] [CrossRef]
- Yates, J.G.J. The material strength of sandstones of the Sherwood Sandstone Group of north Staffordshire with reference to microfabric. Q. J. Eng. Geol. Hydrogeol. 1992, 25, 107–113. [Google Scholar] [CrossRef]
- Freeze, R.A.; Cherry, J.A. Groundwater; Prentice-Hall: Hoboken, NJ, USA, 1979. [Google Scholar]
- Allen, D.J.; Brewerton, L.J.; Coleby, L.M.; Gibbs, B.R.; Lewis, M.A.; MacDonald, A.M.; Wagstaff, S.J.; Williams, A.T. The Physical Properties of Major Aquifers in England and Wales; British Geological Survey Technical Report, WD/97/34; British Geological Survey: Nottingham, UK, 1997. [Google Scholar]
- Yan, T.; Zhu, C.; Li, Q.; Xu, Q. Investigating Disaster Mechanisms Triggered by Abrupt Overburden Fracture Alterations in Close-Seam Mining Beneath an Exceptionally Tick Sandstone Aquifer. Sustainability 2023, 15, 13845. [Google Scholar] [CrossRef]
- Filippini, M.; Amorosi, A.; Dinelli, E.; Segadelli, E.; Landi, L.; Casati, T.; Gargini, A. Depositional environment of shallow-marine arenites in the Northern Apennines (Italy) affects aquifer performance: An interpretative key to groundwater management in a climate change scenario. J. Hydrol. Reg. Stud. 2025, 57, 102183. [Google Scholar] [CrossRef]
- Parker, B.L.; Gillham, R.W.; Cherry, J.A. Diffusive disappearance of immiscible-phase organic liquids in fractured geological media. Groundwater 1994, 32, 805–820. [Google Scholar] [CrossRef]
- Guadagnini, L.; Guadagnini, A.; Tartakowski, D.M. Probabilistic reconstruction of geological facies. J. Hydrol. 2004, 294, 57–67. [Google Scholar] [CrossRef]
- Franzetti, S.; Guadagnini, A. Probabilistic estimation of well catchments in heterogeneous aquifers. J. Hydrol. 1996, 174, 149–171. [Google Scholar] [CrossRef]
- Bloomfiled, J.P.; Williams, A.T. An empirical liquid permeability—Gas permeability correlation for use in aquifer properties studies. Q. J. Eng. Geol. Hydrogeol. 1995, 28, 143–150. [Google Scholar] [CrossRef]
- Yang, Z.; Guo, J.; Quin, F.; Li, Y.; Wang, X.; Li, L.; Liu, X. Spatiotemporal Variability of Soil Erosion in the Pisha Sandstone Region: Influences of Precipitation and Vegetation. Sustainability 2024, 16, 9313. [Google Scholar] [CrossRef]
- Sun, L.; Lou, P.; Pan, C.; Ji, P. Mechanical Properties and DEM-Based Simulation of Double-Fractured Sandstone Under Cyclic Loading and Unloading. Sustainability 2024, 16, 9000. [Google Scholar] [CrossRef]
- Caine, J.S.; Evans, J.P.; Forster, C.B. Fault zone architecture and permeability structure. Geology 1996, 24, 1025–1028. [Google Scholar] [CrossRef]
- Aydin, A. Fractures, faults, and hydrocarbon entrapment, migration and flow. Mar. Pet. Geol. 2000, 17, 797–814. [Google Scholar] [CrossRef]
- Gutmanis, J.C.; Lanion, G.W.; Winn, T.J.; Watson, C.R. Fluid flow in faults: A study of fault hydrogeology in Triassic sandstone and Ordovician volcaniclastic rocks at Sellafield, north-west England. Proc. Yorks. Geol. Soc. 1998, 52, 159–175. [Google Scholar] [CrossRef]
- Antonellini, M.A.; Aydin, A.; Pollard, D.D. Microstructure of deformation bands in porous sandstones at Arches National Park, Utah. J. Struct. Geol. 1994, 16, 941–959. [Google Scholar] [CrossRef]
- Antonellini, M.A.; Pollard, D.D. Distinct element modeling of deformation bands in sandstone. J. Struct. Geol. 1995, 17, 1165–1182. [Google Scholar] [CrossRef]
- Bense, V.F.; Gleeson, T.; Loveless, S.E.; Bour, O.; Scibek, J. Fault zone hydrogeology. Earth-Sci. Rev. 2013, 127, 171–192. [Google Scholar] [CrossRef]
- Cilona, A.; Aydin, A.; Likerman, J.; Parker, B.; Cherry, J.A. Structural and statistical characterization of joints and multi-scale faults in an alternating sandstone and shale turbidite sequence at the Santa Susana Field Laboratory: Implications for their effects on groundwater flow and contaminant transport. J. Struct. Geol. 2016, 85, 95–114. [Google Scholar] [CrossRef]
- Del Sole, L.; Antonellini, M. Strengthening effect of compactive shear bands and associated carbonate nodules in arkose sandstone: A natural analog of composite multilayer. Earth 2019, 115, 12. [Google Scholar]
- Del Sole, L.; Antonellini, M.; Soliva, R.; Ballas, G.; Balsamo, F.; Viola, G. Structural control on fluid flow and shallow diagenesis: Insights from calcite cementation along deformation bands in porous sandstones. Solid Earth Discuss. 2020, 11, 2169–2195. [Google Scholar] [CrossRef]
- Antonellini, M.; Del Sole, L.; Mollema, P.N. Effects of outcrop-scale structural and diagenetic heterogeneities on flow and mass transport in a porous sandstone aquifer. Mar. Petrol. Geol. 2025, 177, 107406. [Google Scholar] [CrossRef]
- Selroos, J.O.; Walker, D.D.; Ström, A.; Gylling, B.; Follin, S. Comparison of alternative modelling approaches for groundwater flow in fractured rock. J. Hydol. 2002, 257, 174–188. [Google Scholar] [CrossRef]
- Neuman, S.P. Trends, prospects and challenges in quantifying flow and transport through fractured rocks. Hydrogeol. J. 2005, 13, 124–147. [Google Scholar] [CrossRef]
- Hitchmough, A.M.; Riley, M.S.; Herbert, A.W.; Tellam, J.H. Estimating the hydraulic properties of the fracture network in a sandstone aquifer. J. Contam. Hydrol. 2007, 93, 38–57. [Google Scholar] [CrossRef] [PubMed]
- Bigi, S.; Battaglia, M.; Alemanni, A.; Lombardi, S.; Campana, A.; Borisova, E.; Loizzo, M. CO2 flow through a fractured rock volume: Insights from field data, 3D fractures representation and fluid flow modeling. Int. J. Greenh. Gas Con. 2013, 18, 183–199. [Google Scholar] [CrossRef]
- Hsu, S.M.; Ke, C.C.; Lin, Y.T.; Huang, C.C.; Wang, Y.S. Unravelling preferential flow paths and estimating groundwater potential in a fractured metamorphic aquifer in Taiwan by using borehole logs and hybrid DFN/EPM model. Environ. Earth Sci. 2019, 78, 150. [Google Scholar] [CrossRef]
- Romano, V.; Bigi, S.; Carnevale, F.; Hyman, J.D.H.; Karra, S.; Valocchi, A.J.; Tartarello, M.C.; Battaglia, M. Hydraulic characterization of a fault zone from fracture distribution. J. Struct. Geol. 2020, 135, 104036. [Google Scholar] [CrossRef]
- Gellasch, C.A.; Bradbury, K.R.; Hart, D.J.; Bahr, J.M. Characterization of fracture connectivity in a siliciclastic bedrock aquifer near a public supply well (Wisconsin, USA). Hydrogeol. J. 2013, 2, 383–399. [Google Scholar] [CrossRef]
- Morin, R.H.; Carleton, G.B.; Poirier, S. Fractured-aquifer hydrogeology from geophysical logs; the Passaic Formation, New Jersey. Groundwater 1997, 35, 328–338. [Google Scholar] [CrossRef]
- Medici, G.; West, L.J.; Mountney, N.P. Characterizing flow pathways in a sandstone aquifer: Tectonic vs sedimentary heterogeneities. J. Contam. Hydrol. 2016, 194, 36–58. [Google Scholar] [CrossRef]
- Medici, G.; West, L.J.; Mountney, N.P. Characterization of a fluvial aquifer at a range of depths and scales. The Triassic St Bees Sandstone Formation, Cumbria, UK. Hydrogeol. J. 2018, 26, 565–591. [Google Scholar] [CrossRef]
- Bouch, J.E.; Hough, E.; Kemp, S.J.; McKervey, J.A.; Williams, G.M.; Greswell, R.B. Sedimentary and diagenetic environments of the Wildmoor Sandstone Formation (UK): Implications for groundwater and contaminant transport, and sand production. Geol. Soc. Spec. Publ. 2006, 263, 129–153. [Google Scholar] [CrossRef]
- Lo, H.C.; Chen, P.J.; Chou, P.Y.; Hsu, S.M. The combined use of heat-pulse flowmeter logging and packer testing for transmissive fracture recognition. J. Appl. Geophys. 2014, 105, 248–258. [Google Scholar] [CrossRef]
- Bairos, K.; Quinn, P.; Pehme, P.; Parker, B.L. Enumerating hydraulically active fractures using multiple, high-resolution datasets to inform plume transport in a sandstone aquifer. J. Hydrol. 2023, 619, 129362. [Google Scholar] [CrossRef]
- Barker, A.P.; Newton, R.J.; Bottrell, S.H.; Tellam, J.H. Processes affecting groundwater chemistry in a zone of saline intrusion into an urban sandstone aquifer. Appl. Geochem. 1998, 13, 735–749. [Google Scholar] [CrossRef]
- Streetly, H.R.; Hamilton, A.C.L.; Betts, C.; Tellam, J.H.; Herbert, A.W. Reconnaissance tracer tests in the Triassic sandstone aquifer north of Liverpool, UK. Q. J. Eng. Geol. Hydrogeol. 2002, 35, 167–178. [Google Scholar] [CrossRef]
- Meus, P.; Willems, L. Tracer tests to infer the drainage of the multiple porosity aquifer of Luxembourg Sandstone (Grand-Duchy of Luxembourg): Implications for drinking water protection. Hydrogel. J. 2021, 29, 461–480. [Google Scholar] [CrossRef]
- Kůrková, I.; Bruthans, J.; Balák, F.; Slavík, M.; Schweigstillová, J.; Bruthansová, J.; Mikus, P.; Vojtisek, J.; Grundloch, J. Factors controlling evolution of karst conduits in sandy limestone and calcareous sandstone (Turnov area, Czech Republic). J. Hydrol. 2019, 574, 1062–1073. [Google Scholar] [CrossRef]
- Pehme, P.; Crow, H.; Parker, B.; Russell, H. Evaluation of slim-hole NMR logging for hydrogeologic insights into dolostone and sandstone aquifers. J. Hydrol. 2022, 610, 127809. [Google Scholar] [CrossRef]
- Allen, D.J.; Bloomfield, J.P.; Gibbs, B.R.; Wagstaff, S.J. Fracturing and the Hydrogeology of the Permo-Triassic Sandstones in England and Wales; British Geological Survey Technical Report, WD/98/1; British Geological Survey: Nottingham UK, 1998. [Google Scholar]
- Medici, G.; West, L.J.; Mountney, N.P.; Welch, M. Permeability of rock discontinuities and faults in the Triassic Sherwood Sandstone Group (UK): Insights for management of fluvio-aeolian aquifers worldwide. Hydrogeol. J. 2018, 27, 2835–2855. [Google Scholar] [CrossRef]
- Medici, G.; West, L.J.; Mountney, N.P. Sedimentary flow heterogeneities in the Triassic UK Sherwood Sandstone Group: Insights for hydrocarbon exploration. Geol. J. 2019, 54, 1361–1378. [Google Scholar] [CrossRef]
- Tellam, J.H.; Barker, R.D. Towards prediction of saturated-zone pollutant movement in groundwaters in fractured permeable-matrix aquifers: The case of the UK Permo-Triassic sandstones. Geol. Soc. Spec. Publ. 2006, 263, 1–48. [Google Scholar] [CrossRef]
- Medici, G.; West, L.J. Review of groundwater flow and contaminant transport modelling approaches for the Sherwood Sandstone aquifer, UK; insights from analogous successions worldwide. Q. J. Eng. Geol. Hydrogeol. 2022, 55, qjegh2021-176. [Google Scholar] [CrossRef]
- Tucker, M.E. Precambrian dolomites: Petrographic and isotopic evidence that they differ from Phanerozoic dolomites. Geology 1982, 10, 7–12. [Google Scholar] [CrossRef]
- Tucker, M.E. Diagenesis, geochemistry, and origin of a Precambrian dolomite; the Beck Spring Dolomite of eastern California. J. Sediment. Res. 1983, 53, 1097–1119. [Google Scholar] [CrossRef]
- Moss, S.J.; Tucker, M.E. Dolomitization associated with transgressive surfaces—A mid-Cretaceous example. Sediment. Geol. 1996, 107, 11–20. [Google Scholar] [CrossRef]
- Sajed, O.K.M.; Glover, P.W.; Collier, R.E.L. Reservoir quality estimation using a new ternary diagram approach applied to carbonate formations in north-western Iraq. J. Petrol. Sci. Eng. 2021, 196, 108024. [Google Scholar] [CrossRef]
- Parker, B.L.; Bairos, K.; Maldaner, C.H.; Chapman, S.W.; Turner, C.M.; Burns, L.S.; Plett, J.; Carter, R.; Cherry, J.A. Metolachlor dense nonaqueous phase liquid source conditions and plume attenuation in a dolostone water supply aquifer. Geol. Soc. Spec. Publ. 2019, 479, 207–236. [Google Scholar] [CrossRef]
- Medici, G.; Munn, J.D.; Parker, B.L. Delineating aquitard characteristics within a Silurian dolostone aquifer using high-density hydraulic head and fracture datasets. Hydrogeol. J. 2024, 32, 1663–1691. [Google Scholar] [CrossRef]
- Pehme, P.E.; Greenhouse, J.P.; Parker, B.L. The active line source temperature logging technique and its application in fractured rock hydrogeology. J. Environ. Eng. Geophys. 2007, 12, 307–322. [Google Scholar] [CrossRef]
- Pehme, P.E.; Parker, B.L.; Cherry, J.A.; Greenhouse, J.P. Improved resolution of ambient flow through fractured rock with temperature logs. Groundwater 2010, 48, 191–205. [Google Scholar] [CrossRef]
- Pehme, P.; Parker, B.L.; Cherry, J.A.; Blohm, D. Detailed measurement of the magnitude and orientation of thermal gradients in lined boreholes for characterizing groundwater flow in fractured rock. J. Hydrol. 2014, 513, 101–114. [Google Scholar] [CrossRef]
- Quinn, P.; Cherry, J.A.; Parker, B.L. Hydraulic testing using a versatile straddle packer system for improved transmissivity estimation in fractured-rock boreholes. Hydrogeol. J. 2012, 20, 1529. [Google Scholar] [CrossRef]
- Munn, J.D.; Maldaner, C.H.; Coleman, T.I.; Parker, B.L. Measuring fracture flow changes in a bedrock aquifer due to open hole and pumped conditions using active distributed temperature sensing. Water Resour. Resear. 2020, 56, e2020WR027229. [Google Scholar] [CrossRef]
- Hartmann, S.; Odling, N.E.; West, L.J. A multi-directional tracer test in the fractured Chalk aquifer of E. Yorkshire, UK. J. Contam. Hydrol. 2007, 94, 315–331. [Google Scholar] [CrossRef] [PubMed]
- West, L.J.; Odling, N.E. Characterization of a multilayer aquifer using open well dilution tests. Groundwater 2007, 45, 74–84. [Google Scholar] [CrossRef]
- Keim, D.M.; West, L.J.; Odling, N.E. Convergent flow in unsaturated fractured chalk. Vadose Zone J. 2012, 11, vzj2011-0146. [Google Scholar] [CrossRef]
- Odling, N.E.; West, L.J.; Hartmann, S.; Kilpatrick, A. Fractional flow in fractured chalk; a flow and tracer test revisited. J. Contam. Hydrol. 2013, 147, 96–111. [Google Scholar] [CrossRef] [PubMed]
- Agbotui, P.Y.; West, L.J.; Bottrell, S.H. Characterisation of fractured carbonate aquifers using ambient borehole dilution tests. J. Hydrol. 2020, 589, 125191. [Google Scholar] [CrossRef]
- Berkowitz, B. Characterizing flow and transport in fractured geological media: A review. Adv. Water Resour. 2002, 25, 861–884. [Google Scholar] [CrossRef]
- Zghibi, A.; Zouhri, L.; Chenini, I.; Merzougui, A.; Tarhouni, J. Modelling of the groundwater flow and of tracer movement in the porous and fissured media: Chalk Aquifer (Northern part of Paris Basin, France). Hydrol. Process. 2016, 30, 1916–1928. [Google Scholar] [CrossRef]
- Pokar, M.; West, L.J.; Odling, N.E. Petrophysical characterization of the Sherwood sandstone from East Yorkshire, UK. Geol. Soc. Lond. Spéc. Publ. 2006, 263, 103–118. [Google Scholar] [CrossRef]
- Lamy-Chappuis, B.; Angus, D.; Fisher, Q.; Grattoni, C.; Yardley, B.W. Rapid porosity and permeability changes of calcareous sandstone due to CO2-enriched brine injection. Geophys. Resear. Lett. 2014, 41, 399–406. [Google Scholar] [CrossRef]
- Rosenbrand, E.; Haugwitz, C.; Jacobsen, P.S.M.; Kjøller, C.; Fabricius, I.L. The effect of hot water injection on sandstone permeability. Geothermics 2014, 50, 155–166. [Google Scholar] [CrossRef]
- Hossain, Z.; Grattoni, C.A.; Solymar, M.; Fabricius, I.L. Petrophysical properties of greensand as predicted from NMR measurements. Petrol. Geosci. 2011, 17, 11–125. [Google Scholar] [CrossRef]
- Kou, Z.; Wang, H.; Alvarado, V.; Nye, C.; Bagdonas, D.A.; McLaughlin, J.F.; Quillinan, S.A. Effects of carbonic acid-rock interactions on CO2/Brine multiphase flow properties in the upper Minnelusa sandstones. SPE J. 2023, 28, 754–767. [Google Scholar] [CrossRef]
- Ren, Q.; Li, L.; Cai, L.; Feng, J.; Li, M.; Wang, X. Geomechanical Response Characteristics of Different Sedimentary Hydrodynamic Cycles—Exampled by Xujiahe Formation of Upper Triassic, Western Sichuan Basin. Sustainability 2024, 16, 4304. [Google Scholar] [CrossRef]
- Wang, C.; Wang, Z.; Li, H. Numerical Modelling of CO2 Injection and Storage in Low Porosity and Low Permeability Saline Aquifers: A Design for the Permian Shiqianfeng Formation in the Yulin Area, Ordos Basin. Sustainability 2024, 16, 10593. [Google Scholar] [CrossRef]
- Zinszner, B.; Pellerin, F.M. A Geoscientist’s Guide to Petrophysics; Editions Technip: Paris, France, 2007. [Google Scholar]
- Kennedy, M. Practical Petrophysics; Elsevier: Amsterdam, The Netherlands, 2024. [Google Scholar]
- Tiab, D.; Donaldson, E.C. Petrophysics: Theory and Practice of Measuring Reservoir Rock and Fluid Transport Properties; Elsevier: Amsterdam, The Netherlands, 2024. [Google Scholar]
- Paillet, F.L. 1998. Flow modeling and permeability estimation using borehole flow logs in heterogeneous fractured formations. Water. Resour. Res. 1998, 34, 997–1010. [Google Scholar] [CrossRef]
- Paillet, F.L. A field technique for estimating aquifer parameters using flow log data. Groundwater 2000, 38, 510–521. [Google Scholar] [CrossRef]
- Day-Lewis, F.D.; Johnson, C.D.; Paillet, F.L.; Halford, K.J. A computer program for flow-log analysis of single holes (FLASH). Groundwater 2011, 49, 926–931. [Google Scholar] [CrossRef]
- Witherspoon, P.A.; Wang, J.S.; Iwai, K.; Gale, J.E. Validity of cubic law for fluid flow in a deformable rock fracture. Water Resour. Resear. 1980, 16, 1016–1024. [Google Scholar] [CrossRef]
- Quinn, P.M.; Cherry, J.A.; Parker, B.L. Quantification of non-Darcian flow observed during packer testing in fractured sedimentary rock. Water Resour. Resear. 2011, 47, W09533. [Google Scholar] [CrossRef]
- Ren, S.; Gragg, S.; Zhang, Y.; Carr, B.J.; Yao, G. Borehole characterization of hydraulic properties and groundwater flow in a crystalline fractured aquifer of a headwater mountain watershed, Laramie Range, Wyoming. J. Hydrol. 2018, 561, 780–795. [Google Scholar] [CrossRef]
- Medici, G.; Ling, F.; Shang, J. Review of discrete fracture network characterization for geothermal energy extraction. Front. Earth Sci. 2023, 11, 1328397. [Google Scholar] [CrossRef]
- Paillet, F. Integrating surface geophysics, well logs and hydraulic test data in the characterization of heterogeneous aquifers. J. Environ. Eng. Geophys. 1995, 1, 1–13. [Google Scholar] [CrossRef]
- Parker, A.H.; West, L.J.; Odling, N.E.; Bown, R.T. A forward modeling approach for interpreting impeller flow logs. Groundwater 2010, 48, 79–91. [Google Scholar] [CrossRef]
- Cherry, J.A.; Parker, B.L.; Keller, C. A new depth-discrete multilevel monitoring approach for fractured rock. Groundw. Monit. Remediat. 2007, 27, 57–70. [Google Scholar] [CrossRef]
- Meyer, J.R.; Beth, L.P.; Daron, G.A.; Shikaze, S.G.; Weaver, L.; Merritt, G.; Lucas Ribeiro, A.F.S.; Morgan, C.A.; Runkel, A.C. Rock core VOC profiles diagnostic of aquitard occurrence and integrity in a multi-layered sedimentary rock aquifer flow system. J. Hydrol. 2023, 626, 130347. [Google Scholar] [CrossRef]
- Langenheim, V.E.; Wright, T.L.; Okaya, D.A.; Yeats, R.S.; Fuis, G.S.; Thygesen, K.; Thybo, H. Structure of the San Fernando Valley region, California: Implications for seismic hazard and tectonic history. Geosphere 2011, 7, 528–572. [Google Scholar] [CrossRef][Green Version]
- Hartmann, A.; Goldscheider, N.; Wagener, T.; Lange, J.; Weiler, M. Karst water resources in a changing world: Review of hydrological modeling approaches. Rev. Geophys. 2014, 52, 218–242. [Google Scholar] [CrossRef]
- Medici, G.; West, L.J. Groundwater flow velocities in karst aquifers; importance of spatial observation scale and hydraulic testing for contaminant transport prediction. Environ. Sci. Pollut. Res. 2021, 28, 43050–43063. [Google Scholar] [CrossRef]
- Staněk, M.; Géraud, Y. Granite microporosity changes due to fracturing and alteration: Secondary mineral phases as proxies for porosity and permeability estimation. Solid Earth 2019, 10, 251–274. [Google Scholar] [CrossRef]
- Medici, G.; West, L.J. Reply to discussion on ‘Review of groundwater flow and contaminant transport modelling approaches for the Sherwood Sandstone aquifer, UK; insights from analogous successions worldwide’ by Medici and West (QJEGH, 55, qjegh2021-176). Q. J. Eng. Geol. Hydrogeol. 2023, 56, qjegh2022-097. [Google Scholar] [CrossRef]
- Davison, R.M.; Lerner, D.N. Evaluating natural attenuation of groundwater pollution from a coal-carbonisation plant: Developing a local-scale model using MODFLOW, MODTMR and MT3D. Water Environ. J. 2000, 14, 419–426. [Google Scholar] [CrossRef]
- Bottrell, S.H.; West, L.J.; Yoshida, K. Combined isotopic and modelling approach to determine the source of saline groundwaters in the Selby Triassic sandstone aquifer, UK. Geol. Soc. Spec. Publ. 2006, 263, 325–338. [Google Scholar] [CrossRef]
- Zhang, H.; Hiscock, K.M. Modelling the impact of forest cover on groundwater resources: A case study of the Sherwood Sandstone aquifer in the East Midlands, UK. J. Hydrol. 2010, 392, 136–149. [Google Scholar] [CrossRef]
- Foster, S.; West, L.; Bottrell, S.; Hildyard, M.W. A DFN approach to evaluating the hydrogeological significance of lithostatic unloading in fractured strata around open-pit workings. In Proceedings of the 2nd International Discrete Fracture Network Engineering Conference Extended Abtracts, Seattle, WA, USA, 27–29 June 2018; OnePetro: Richardson, TX, USA, 2018. [Google Scholar]
- Schulze-Makuch, D.; Carlson, D.A.; Cherkauer, D.S.; Malik, P. Scale dependency of hydraulic conductivity in heterogeneous media. Groundwater 1999, 37, 904–919. [Google Scholar] [CrossRef]
- Kuchuk, F.; Biryukov, D.; Fitzpatrick, T. Fractured-reservoir modeling and interpretation. SPE J. 2014, 20, 983–1004. [Google Scholar] [CrossRef]
- Demirel, S.; Irving, J.; Roubinet, D. Comparison of REV size and tensor characteristics for the electrical and hydraulic conductivities in fractured rock. Geophys. J. Int. 2019, 216, 1953–1973. [Google Scholar] [CrossRef]
- McKoy, M.L.; Sams, N.W. Tight Gas Reservoir Simulation: Modeling Discrete Irregular Strata-Bound Fracture Networks and Network Flow, Including Dynamic Recharge from the Matrix; US Department of Energy’s Federal Energy Technology Center Publication: Washington, DC, USA, 1997.
- Pierce, A.A.; Chapman, S.W.; Zimmerman, L.K.; Hurley, J.C.; Aravena, R.; Cherry, J.A.; Parker, B.L. DFN-M field characterization of sandstone for a process-based site conceptual model and numerical simulations of TCE transport with degradation. J. Contam. Hydrol. 2018, 212, 96–114. [Google Scholar] [CrossRef]
- Morgan, C. Fracture Network Characterization of an Aquitard Surface Within the Wonewoc Sandstone Using Digital Outcrop Photogrammetry and Discrete Fracture Network (DFN) Modelling. Ph.D. Thesis, University of Guelph, Guelph, ON, Canada, 2019. [Google Scholar]
- Pilato, T. Exploring the Statistical Method of Moments for Solute Transport in Fractured Porous Rock Aquifers: Bridging the Gap Between Local and Regional Scales. Master’s Thesis, University of Guelph, Guelph, ON, Canada, 2021. [Google Scholar]
- Miller, I.; Lee, G.; Dershowitz, W.; Sharp, G. MAFIC–Matrix/Fracture Interaction Code with Solute Transport; User Documentation, Version 1.5, Report 923-1089; Golder Associates: Seattle, WA, USA, 1994. [Google Scholar]
- Smythe, D.K. Inadequate Regulation of the Geological Aspects of Shale Exploitation in the UK. Intern. J. Environ. Res. Public Health 2020, 17, 6946. [Google Scholar] [CrossRef] [PubMed]
- Van Riet, B.; Six, S.; Walraevens, K.; Vandenbohede, A.; Hermans, T. Assessing the impact of fractured zones imaged by ERT on groundwater model prediction: A case study in a chalk aquifer in voort (Belgium). Front. Water 2021, 3, 783983. [Google Scholar] [CrossRef]
- Gan, H.; Liu, Z.; Wang, G.; Liao, Y.; Wang, X.; Zhang, Y.; Zhao, J.; Liu, Z. Permeability and porosity changes in sandstone reservoir by geothermal fluid reinjection: Insights from a laboratory study. Water 2022, 14, 3131. [Google Scholar] [CrossRef]
- Wei, B.; Nie, X.; Zhang, Z.; Ding, J.; Shayireatehan, R.; Ning, P.; Deng, D.; Cao, Y. Productivity equaequation of fractured vertical well with gas–water co-production in high-water-cut tight sandstone gas reservoir. Processes 2023, 11, 3123. [Google Scholar] [CrossRef]
- Parker, B.L.; Gillham, R.W.; Wanner, P. A novel laboratory method for determining the diffusive mass flux of dense non-aqueous phase liquids (DNAPLs) into natural clays. J. Contam. Hydrol. 2025, 274, 104651. [Google Scholar] [CrossRef]
- Lee, C.C.; Lee, C.H.; Yeh, H.F.; Lin, H.I. Modeling spatial fracture intensity as a control on flow in fractured rock. Environ. Earth Sci. 2011, 63, 1199–1211. [Google Scholar] [CrossRef]
- Morelli, G.L. Estimating the Volumetric Fracture Intensity P32 Through a New Analytical Approach. Rock Mechan. Rock Eng. 2024, 57, 6085–6103. [Google Scholar] [CrossRef]
Disclaimer/Publisher’s Note: The statements, opinions and data contained in all publications are solely those of the individual author(s) and contributor(s) and not of MDPI and/or the editor(s). MDPI and/or the editor(s) disclaim responsibility for any injury to people or property resulting from any ideas, methods, instructions or products referred to in the content. |
© 2025 by the authors. Licensee MDPI, Basel, Switzerland. This article is an open access article distributed under the terms and conditions of the Creative Commons Attribution (CC BY) license (https://creativecommons.org/licenses/by/4.0/).