Article

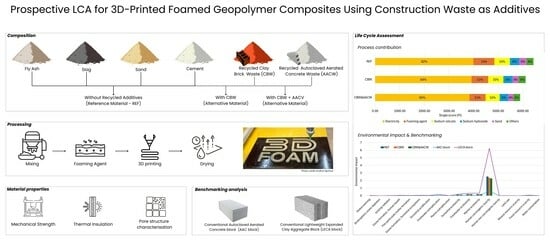
Prospective LCA for 3D-Printed Foamed Geopolymer Composites Using Construction Waste as Additives

1
Institute of Civil Engineering, Faculty of Civil Engineering, Riga Technical University, Kipsalas iela 6A, LV-1048 Riga, Latvia
2
Institute of Microbiology and Biotechnology, University of Latvia, Jelgavas iela 1, LV-1004 Riga, Latvia
3
Institute of High-Performance Materials and Structures, Faculty of Civil Engineering, Riga Technical University, Kipsalas iela 6A, LV-1048 Riga, Latvia
4
Institute of Sustainable Building Materials and Engineering Systems, Faculty of Civil Engineering, Riga Technical University, LV-1048 Riga, Latvia
*
Author to whom correspondence should be addressed.
Sustainability 2025, 17(14), 6459; https://doi.org/10.3390/su17146459
Submission received: 1 May 2025 / Revised: 3 July 2025 / Accepted: 4 July 2025 / Published: 15 July 2025
(This article belongs to the Special Issue Green Construction Materials and Sustainability)

Abstract

Additive manufacturing has recently become popular and more cost-effective for building construction. This study presents a prospective life cycle assessment (LCA) of 3D-printed foamed geopolymer composites (3D-FOAM materials) incorporating construction and demolition waste. The materials were developed using fly ash, slag, sand, and a foaming agent, with recycled clay brick waste (CBW) and autoclaved aerated concrete waste (AACW) added as alternative raw materials. The material formulations were evaluated for their compressive strength and thermal conductivity to define two functional units that reflect structural and thermal performance. A prospective life cycle assessment (LCA) was conducted under laboratory-scale conditions using the ReCiPe 2016 method. Results show that adding CBW and AACW reduces environmental impacts across several categories, including global warming potential and ecotoxicity, without compromising material performance. Compared to conventional wall systems, the 3D-FOAM materials offer a viable low-impact alternative when assessed on a functional basis. These findings highlight the potential of integrating recycled materials into additive manufacturing to support circular economy goals in the construction sector.

Graphical Abstract

1. Introduction

Additive manufacturing (AM), referred to as three-dimensional (3D) printing, is a rapidly evolving technology within the construction sector. One of its suggested advantages is the potential to significantly reduce construction costs when applied directly on-site, with estimates indicating possible cost savings of up to 60% [1]. Unfortunately, this cost reduction takes a significant amount of time, mainly because each printing technique takes substantial time to create and adapt the printable formulation of the cementitious composites. Furthermore, regular 3D-printed cementitious mortars exhibit higher cement content compared to conventional cast-in-place concrete [2]. This increased cement usage may undermine the environmental benefits of AM, particularly in terms of greenhouse gas emissions, given the high carbon footprint associated with cement production.
One alternative to conventional materials in additive manufacturing is the use of geopolymer composites. The geopolymer matrix is claimed to release four times less CO2 emissions than ordinary Portland cement [3,4]. In recent years, there has been a significant increase in the development of printable geopolymer formulations. For instance, Lori et al. (2025) have successfully developed a printable geopolymer composite that was foamed with the addition of aluminium powder [3]. The mix incorporated sodium hydroxide (NaOH) and sodium silicate (Na2SiO3) as alkaline activators, along with 3% Aalborg cement to accelerate the setting process. Similarly, Khalid et al. (2025) developed other printable mixes primarily based on fly ash, ground granulated blast furnace slag (GGBFS) [4]. Notably, there have been further advancements in the development of printable geopolymer formulations by Yan et al. (2025) and Sheng et al. (2024), primarily using fly ash and GGBFS and using an extrusion-based 3D printing setup [5,6].
Historically, geopolymer composites have been designed to valorise industrial by-products and reduce the environmental impact associated with traditional building materials. For instance, early formulations of geopolymers were predominantly based on fly ash, which served as a reactive aluminosilicate matrix. Additionally, the successful incorporation of red mud as another waste material has been reportedly used in geopolymer systems.
Construction material waste, such as autoclaved aerated concrete (AAC) and clay brick waste (CBW), presents a considerable challenge in terms of recycling and safe disposal [7]. In everyday civil engineering applications, AAC is used as a building material for non-load-bearing walls, valued for its lightweight and insulating properties. However, its end-of-life phase poses significant environmental concerns. In China alone, AAC accounts for approximately 40% of all annual construction and demolition waste [8]. Moreover, its production process generates non-negligible waste; it is estimated that 3–5% of the total production volume results in manufacturing residues [9].
Several studies have explored the reuse of autoclaved aerated concrete waste (AACW) as a partial substitute for natural sand, aiming to reduce both waste generation and raw material consumption. Promising results have been reported for sand replacement levels of up to 25% using ground AACW [10]. In parallel, other researchers have investigated the chemical formulation of AACW and its potential suitability as a precursor in geopolymer matrices. Findings suggest that AACW contribute to the formation of sodium aluminosilicates, aluminosilicate zeolites, and may even serve as a partial replacement for conventional cementitious materials. However, the effective utilisation of AACW in such applications typically requires pre-treatment using specific chemical agents under controlled environmental conditions. These stringent processing requirements currently pose a barrier to the widespread adoption of AACW in geopolymer production [6,8].
Clay brick waste (CBW) also reflects one of the major solid waste groups generated from construction and demolition activities by the building industry. Similarly, for the AACW and CBW, disposal mainly ends up in landfills, contributing to environmental degradation and occupying valuable land resources that could otherwise be repurposed. In the European Union, CBW accounts for a significant portion of total demolition waste, representing approximately 30% of all construction and demolition waste [11]. The issue of CBW is particularly crucial in Spain, where it is estimated that 54% of construction and demolition waste comes from brick walls [12]. These figures likely underestimate the actual volume of CBW, as additional waste is generated during the manufacturing, transportation, and construction phases. During kiln firing, a proportion of bricks may fracture, and further losses occur due to damage during handling and on-site application.
Recent studies have demonstrated the potential in CBW as a precursor material in geopolymer production. Chemically, CBW is characterised as a low-reactivity amorphous aluminosilicate suitable for producing geopolymer material with significant strength [13]. A notable advantage is that CBW has already undergone thermal treatment during brick manufacturing, typically at temperatures up to 950 °C [14]. This calcination process induces the formation of disordered, amorphous phases of alumina and silica through the dehydration of clay minerals, thereby enhancing the pozzolanic reactivity of the material. As such, CBW can be considered a low-cost and environmentally favourable material for geopolymer production [13]. Furthermore, CBW does not need to be used as a standalone constituent for creating a geopolymer matrix. It can be combined with other industrial by-products, such as fly ash and slag, to generate a geopolymer matrix with tailored properties.
In most cases, CBW-based geopolymers are created with a solution of NaOH and Na2SiO3. However, recent studies have shown that acceptable mechanical performance can also be achieved using NaOH as the sole activator, eliminating the need for sodium silicate [15]. A notable limitation of CBW-based geopolymers is their insufficient polymerisation and mechanical strength development under ambient curing conditions, irrespective of the activator combination employed. Elevated curing temperatures are crucial for facilitating proper geopolymerisation and ensuring structural integrity [11]. Reported optimal curing conditions vary across studies, with recommended temperatures ranging from 25 °C to 145 °C and curing durations spanning 2 to 24 h [16]. The most favourable outcomes in terms of compressive strength and polymerisation have been observed at curing temperatures between 50 °C and 80 °C, sustained for 24 to 48 h [17].
With the increasing demand for more environmentally friendly construction practices, assessing the environmental impact of novel building materials already at the design and development stages is essential. Life cycle assessment (LCA) offers a comprehensive framework for such evaluation, particularly at the early stages of material development [18]. Anticipatory or prospective LCA enables forward-looking sustainability assessments, ensuring that emerging technologies contribute meaningfully to resource conservation and emissions reduction from their inception. Integrating prospective life cycle assessment (LCA) into the R&D process helps steer innovation toward low-impact solutions, allowing for the iterative refinement of materials and processes using smaller-scale and experimental data before full-scale implementation [19].
Authors such as Motalebi et al., 2024 [20] and Liu et al., 2022 [21] have described the challenges and life cycle aspects of 3D-printed construction materials, and the environmental impact of recycled aggregates in geopolymer composites. Meanwhile, research focusing on the ecological assessment of foamed geopolymers in additive manufacturing remains absent. Although foamed geopolymers have been studied at a laboratory scale for thermal insulation applications, their specific integration into additive manufacturing processes and corresponding environmental impacts have not been systematically evaluated.
This study is part of the broader 3D-FOAM project, which aims to develop sustainable zero-waste technologies for additive manufacturing by incorporating waste-derived materials such as CBW and AACW. The project focuses on designing foamed geopolymer composites for additive manufacturing. The intended outcomes include the creation of a new class of materials with controlled porosity, low density, high thermal resistance, good mechanical properties, improved workability compared to conventional foamed construction materials, and enhanced environmental performance. In the following sections, “3D-FOAM material” refers to the 3D-printed foamed geopolymer materials developed within this project framework.
This study aims to fill the research gap by conducting a prospective life cycle assessment (LCA) of 3D-printed foamed geopolymer composites incorporating construction and demolition waste as additives. It is of high importance to introduce new materials into the building materials market and clarify their technical capabilities and environmental friendliness-related benefits, thus further outweighing those of the currently widely used building materials and products for which environmental impact has not been publicly declared or not fully disclosed.
At this early stage of material development, the study is guided by three central research questions:
(1)
How does the incorporation of clay brick waste (CBW) and autoclaved aerated concrete waste (AACW) as additives influence the environmental footprint of 3D-FOAM materials relative to a reference formulation without waste additives?
(2)
Can the integration of these recycled waste streams yield measurable environmental benefits without compromising the functional performance of the resulting material?
(3)
How does the environmental performance of 3D-FOAM materials compare to that of conventional wall systems currently available on the market?

2. Life Cycle Assessment

2.1. Goal and Scope Definition

Prospective life cycle assessment (LCA) is an environmental assessment approach used to evaluate the potential impacts in emerging technologies before they reach full-scale industrial implementation. Unlike traditional (retrospective) life cycle assessment (LCA), which assesses existing products and processes, prospective LCA relies on hypothetical models incorporating laboratory-scale data, estimates based on the literature, and future scenario projections. The 3D-FOAM material is still at an early technology readiness level (TRL). In this case, the prospective LCA is based on laboratory-scale data gathered from laboratory, process modelling, and future scenario projections to estimate the material’s environmental performance.

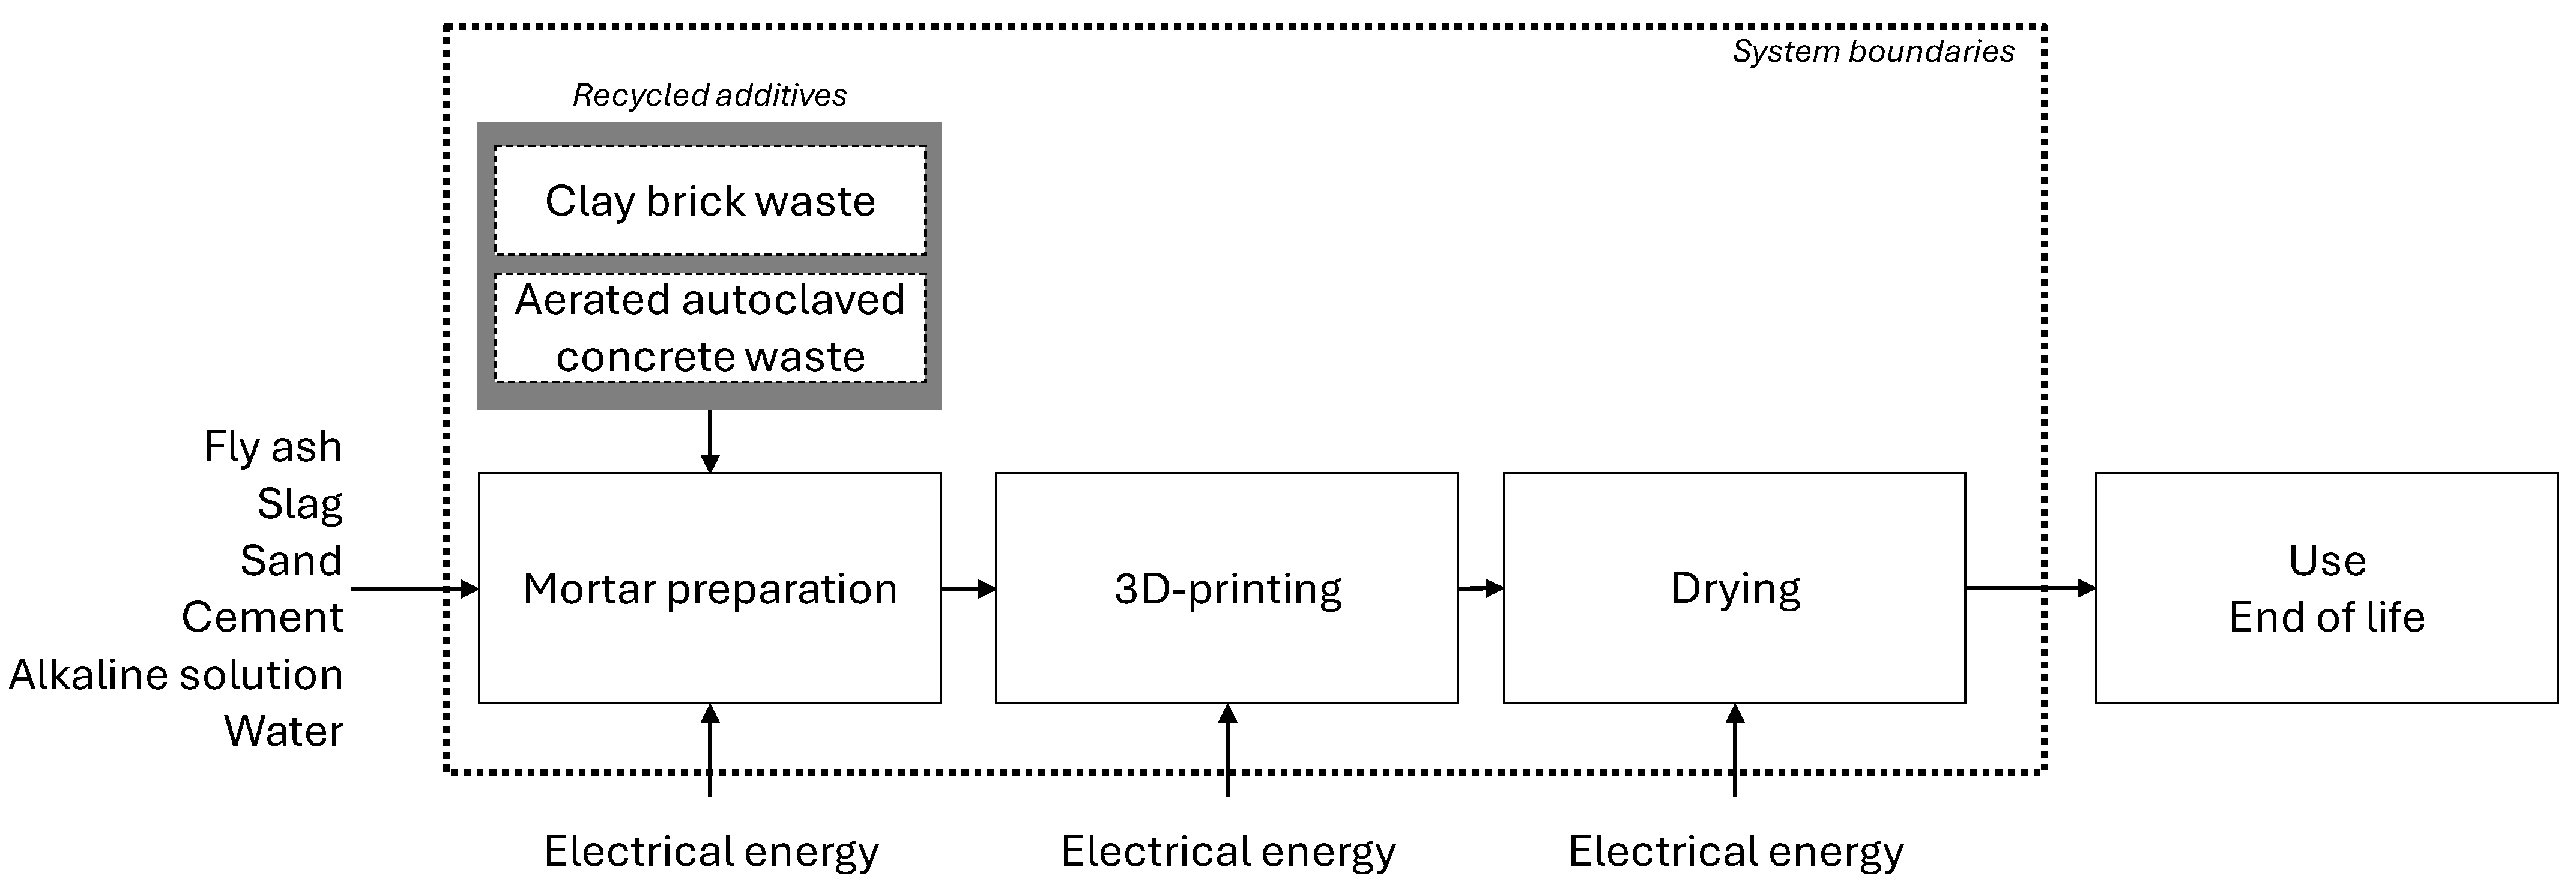
System Boundary and Functional Unit

The environmental assessment of the 3D-FOAM materials follows a cradle-to-gate system boundary, covering the entire production chain from raw material acquisition to the final drying stage after 3D printing (Figure 1).
The system boundary includes material extraction and preparation, mortar formulation, 3D printing, and subsequent drying. The use phase and end-of-life stages are excluded, as the technology is still under development and disposal pathways remain uncertain. The exclusion of these stages is justified by ongoing investigations into the material’s durability and service life, as well as the variability in potential end-of-life scenarios, such as recycling, landfilling, or repurposing. Transport was omitted from the system boundaries. However, it is recognised that transportation may become relevant at an industrial scale and should be addressed in future assessments.
The system boundaries encompass the mortar preparation stage, where cementitious binders, recycled aggregates, sand, water, an alkali-activating solution, and a foaming agent are mixed to produce the printable mortar. For alternative scenarios involving recycled additives, the collection, sorting, crushing, and milling of clay brick waste and aerated autoclaved concrete waste are included within the system boundaries. This is followed by the 3D printing process, which consists of extrusion and layer-by-layer deposition of the mortar to form structural elements. Finally, the drying stage is performed to achieve the required mechanical strength and dimensional stability of the printed components. Each process stage consumes electrical energy, which is included in the analysis to capture the operational energy demand of the production process. Detailed information on material preparation is provided in the Section 2.2.
Two functional units are defined to reflect the dual functionality of the material: mechanical performance and thermal insulation. The first functional unit (FU1) corresponds to the amount of material, expressed in kilograms, required to construct a 1 m3 wall panel with a compressive strength equal to or greater than 3 MPa. The second functional unit (FU2) refers to the amount of material expressed in kilograms required to construct a 1 m2 wall panel with a thermal transmittance (U-value) of 0.25 W/m2K comparable to conventional wall systems. These functional units enable performance-based benchmarking of 3D-FOAM materials, both with and without recycled additives, against traditional building materials.

2.2. Life Cycle Inventory

The life cycle inventory (LCI) was developed by combining primary laboratory-scale measurements with secondary data from established databases, scientific literature, and environmental product declarations (EPD). Material flow data were derived from experimental batching of the different mortar formulations, including a reference scenario and alternative scenarios incorporating recycled additives and foaming agents. Energy consumption for mixing, 3D printing, and drying was measured directly during laboratory trials to reflect actual process requirements.
Background data for upstream material production were sourced from Ecoinvent 3.10. Market datasets were applied without modification to standard materials, including sand, tap water, and a sodium hydroxide solution. Fly ash was modelled as a co-product of coal-fired electricity production in Poland, applying an economic allocation that assigns 98% of impacts to electricity and 2% to fly ash, following the recommendations of Tosti et al., 2020 [22]. Typical operational conditions were reflected by assuming that 80% of the total ash output corresponds to fly ash, consistent with values from the literature.
For Aalborg white CEM I 52.5 R cement, the proxy dataset for European cement production was adjusted by increasing the energy consumption by 15%, based on industry data and published sources [23]. Ground granulated blast furnace slag (GGBFS) was modelled using recycled-content datasets, applying a cut-off approach for the recycled input.
Recycled aggregates, including milled clay brick waste (Tenisit) and aerated autoclaved concrete waste, were integrated into the inventory for the alternative material scenarios. Factory data from LODE SIA were used to characterise the energy demands of brick waste processing, while estimates for aerated concrete waste were adapted from Volk et al., 2023 [24]. In both cases, a cut-off approach was applied at the point of waste generation, considering these materials as burden-free before collection and processing. The alkali-activating solution inventory was based on laboratory-prepared formulations, incorporating sodium hydroxide, sodium silicate, and water, along with measured energy consumption for mixing, as described in Section 2.1.
Detailed inventory data for material inputs, process energy consumption, and outputs are provided in the Supplementary Material (Tables S1–S7). Since the study relies on laboratory-scale production, several assumptions were necessary to ensure methodological consistency. Material yield rates and production efficiencies were based on batch-scale performance, and it was assumed that material losses during mixing, handling, and printing account for less than 1% of the total environmental impact and were therefore excluded from the analysis. Anticipated improvements in process efficiency at the industrial scale were not considered. Minor process inputs contributing less than 1% to the total impact were excluded unless identified as environmentally significant.
Energy consumption values for mixing, printing, and drying were based on laboratory equipment data, acknowledging that scale-up may influence energy demand due to equipment efficiency and process optimisation. Nonetheless, laboratory data were prioritised to ensure internal consistency and reflect the current Technology Readiness Level of the 3D-FOAM material.

2.2.1. Process Description

Prospective LCA was applied to the novel material formulation preparation process carried out at the laboratory of the Riga Technical University (RTU). The main goal was to identify environmental hotspots in the material formulation and 3D printing process at an early development stage, enabling the identification of the primary contributors to environmental impact. Understanding these contributors enables the investigation of potential technological improvements, such as increased material efficiency and energy optimisation. Moreover, it is essential to evaluate the changes in environmental impact resulting from using recycled material additives.
Material Preparation
The 3D-FOAM reference material was prepared in the laboratory, and it comprises a cementitious binder, fly ash, slag, sand, and a foaming agent. The reference material was prepared in accordance with the general formulation principles of aerated concrete geopolymer materials. This formulation served as the base scenario for evaluating the environmental impact of incorporating recycled additives. The main constituents of the printed composites are Class F fly ash, washed quartz sand, ground granulated blast furnace slag (slag), and Aalborg white CEM I cement (Aalborg, Denmark).
Three modelling scenarios were defined to capture the influence of material choices and process variations on the environmental performance of 3D-FOAM materials (Table 1). The first scenario, the reference case (1-REF), represents the formulation without recycled additives or foaming agents. It includes conventional inputs such as fly ash, slag, cement, sand, foaming agents, and alkali activators, serving as the baseline for comparison. The second scenario (2-CBW) evaluates the inclusion of recycled additives. In this case, milled CBW and milled AACW are incorporated in the formulation. This scenario assesses the potential environmental benefits of integrating construction waste materials into the 3D-FOAM matrix. The third scenario (3-CBW + AACW) further extends the second case scenario by incorporating AACW. This scenario allows the assessment of the combined effect of recycled additives. Each scenario is modelled according to the defined functional units, ensuring comparability of results regarding mechanical and thermal performance requirements.
The material preparation process begins with the alkali-activating solution, which consists of a 10 M NaOH solution mixed with an R-145 Na2SiO3 nanoparticle solution (Vincents Polyline, Kalngale, Latvia. First, a 10 M NaOH solution is prepared by dissolving NaOH flakes (98%, Sigma Aldrich, Seelze, Germany) in water. Due to the exothermic nature of the reaction, the solution is placed in cold water for one hour to. Subsequently, the Na2SiO3 nanoparticle solution is mixed with the NaOH solution at a ratio of 2.5:1. The combined solution is left to settle and consolidate until the following day. Inventory data of the Na2SiO3 nanoparticle solution is displayed in Table 2.
The slag was obtained from a cement producers Schwenk Latvia (Broceni, Latvia), and before use, it was ground using a disintegrator. This process, also called collision milling, involves the interaction of particles with a vertically spinning disc equipped with milling teeth. Depending on the rotation frequency and initial particle size, the disintegrator reduces the slag to a finer powder. The grinding process is conducted in four stages: the first stage at 35 Hz and the third at 50 Hz. Input data from Ecoinvent v3.11 were used.
Fly ash was sourced from coal-fired power plants in Kawina, Poland. Due to its commercial availability and compliance with Class F fly ash requirements, no specific pre-treatment was applied. The sand was sourced from a local construction materials supplier in Latvia. Commercially available washed quartz sand (Saulkalne-S, Saulkalne, Latvia), suitable for construction applications, was used without further pre-treatment. Input data from Ecoinvent v3.11 were used.
Mortar for the 3D-FOAM material was prepared by gradually mixing the dry and wet ingredients, including the prepared alkali solution, using an electric mixer. Hydrogen peroxide (H2O2) (≥30%, Sigma-Aldrich, Seelze, Germany) was used as the foaming agent and added after the dry and wet components were combined to achieve the porous structure.
The foaming agent plays a critical role in generating the porous structure of the 3D-FOAM material by introducing gas bubbles into the mortar mixture. This study used hydrogen peroxide (H2O2) as the foaming agent. Upon decomposition, H2O2 releases oxygen gas, which creates a uniform pore structure within the material. The choice of H2O2 is based on its compatibility with alkali-activated systems and its effectiveness in producing stable foamed structures suitable for 3D printing applications.
Hydrogen peroxide was added directly to the mixture after combining the dry and wet components. This approach ensures a homogeneous distribution of gas bubbles throughout the mortar. Unlike conventional protein-based or synthetic surfactant foaming agents, which are applied using a spray method, the chemical decomposition of H2O2 enables in- situ gas generation, simplifying the process and enhancing control over pore formation. The amount of H2O2 was selected based on preliminary laboratory trials to balance the porosity and mechanical stability of the printed material.
Recycled Additives Preparation
This study utilises milled ceramic brick waste material (CBW) as a recycled aggregate to produce 3D-FOAM material. The CBW is sourced from defective and non-standard bricks produced by LODE SIA, a manufacturer of ceramic building materials in Latvia. The preparation process of CBW powder includes the collection of bricks, mechanical crushing, milling, and sieving to meet the required particle size specifications for incorporation into the foamed mortar.
Defective and non-standard bricks are collected directly from the production line at LODE SIA, ensuring a controlled and consistent raw material source with minimal contamination. The brick waste undergoes mechanical crushing in two stages. In the first stage, a jaw or impact crusher reduces large brick fragments (approximately 50–100 mm) into smaller pieces. The second stage involves further milling using a hammer mill or ball mill to achieve the target particle size distribution for the mortar formulation. The processed material is then sieved to obtain the desired fraction of CBW, ranging from 0.1 mm to 5 mm. Any coarse fraction exceeding 5 mm is subjected to additional crushing until the required size is achieved.
Additionally, milled aerated autoclaved concrete waste (AACW) was incorporated as a recycled additive. The AACW was obtained from construction demolition sites in Latvia. The collected material was manually pre-sorted to remove contaminants, followed by mechanical crushing and milling to reach the appropriate particle size distribution suitable for mortar production.
In line with the cut-off approach (100:0), both AACW and CBW were modelled as burden-free at the point of collection. No upstream environmental impacts from their previous life cycles were allocated to the current system. Detailed inventory data related to the pre-treatment processes of the recycled waste additives is provided in the Supplementary Material.
3D Printing
The 3D printing process of the 3D-FOAM material was carried out using a custom extrusion-based printer developed for cementitious materials, as described in previous studies by Sapata et al. [25]. The printer operates by depositing the mortar layer by layer through a screw pump system connected to a nozzle ensuring continuous and controlled extrusion
The print speed was maintained at 6950 mm/min to ensure structural stability and uniform layer deposition. The printing process parameters, such as extrusion pressure and nozzle travel speed, were adjusted based on the workability and viscosity of the mortar mix to achieve stable printing without collapse or deformation.
Energy monitoring during the printing trials indicated that in the average printing mode, the entire printer set consumes 500 W with a printing speed of 1.67 L or 3.6 kg per minute. Thus, 1 m3 or 2100 kg of wet material will be printed for 10 h, consuming 5 kWh.

2.2.2. Benchmarking

To contextualise the environmental performance of the 3D-FOAM material, two benchmarking scenarios were included based on conventional wall materials commonly used in Latvia. The first benchmark represents Bauroc classic autoclaved aerated concrete (AAC), a widely used low-density block material. This product was modelled using data from its environmental product declaration (EPD) [26]. The second benchmark corresponds to a lightweight concrete block with expanded clay aggregate (LECA), comparable to FIBO 3 blocks. As no EPD was available, a representative proxy dataset from the Ecoinvent database was selected for modelling purposes. Benchmarks were selected based on their relevance in the Latvian construction market and their functional equivalence. For FU1 (compressive strength ≥ 3 MPa), both the LECA block and AAC deliver the equivalent compressive strength. For FU2 (thermal insulation performance), wall thicknesses were adjusted to match the U-value threshold of 0.08 W/(m2K), and the corresponding material mass per square meter was calculated based on density and λ-values. These benchmarks enable a comparison of the 3D-FOAM material’s environmental impact with that of conventional alternatives that deliver the same mechanical or thermal performance.
Due to resource constraints, this study did not conduct a formal sensitivity analysis. However, the environmental implications of formulation changes were explored through defined scenario modelling. Future work should investigate the influence of uncertain parameters, such as electricity consumption, material yield, or allocation methods, to further validate the robustness of the results.

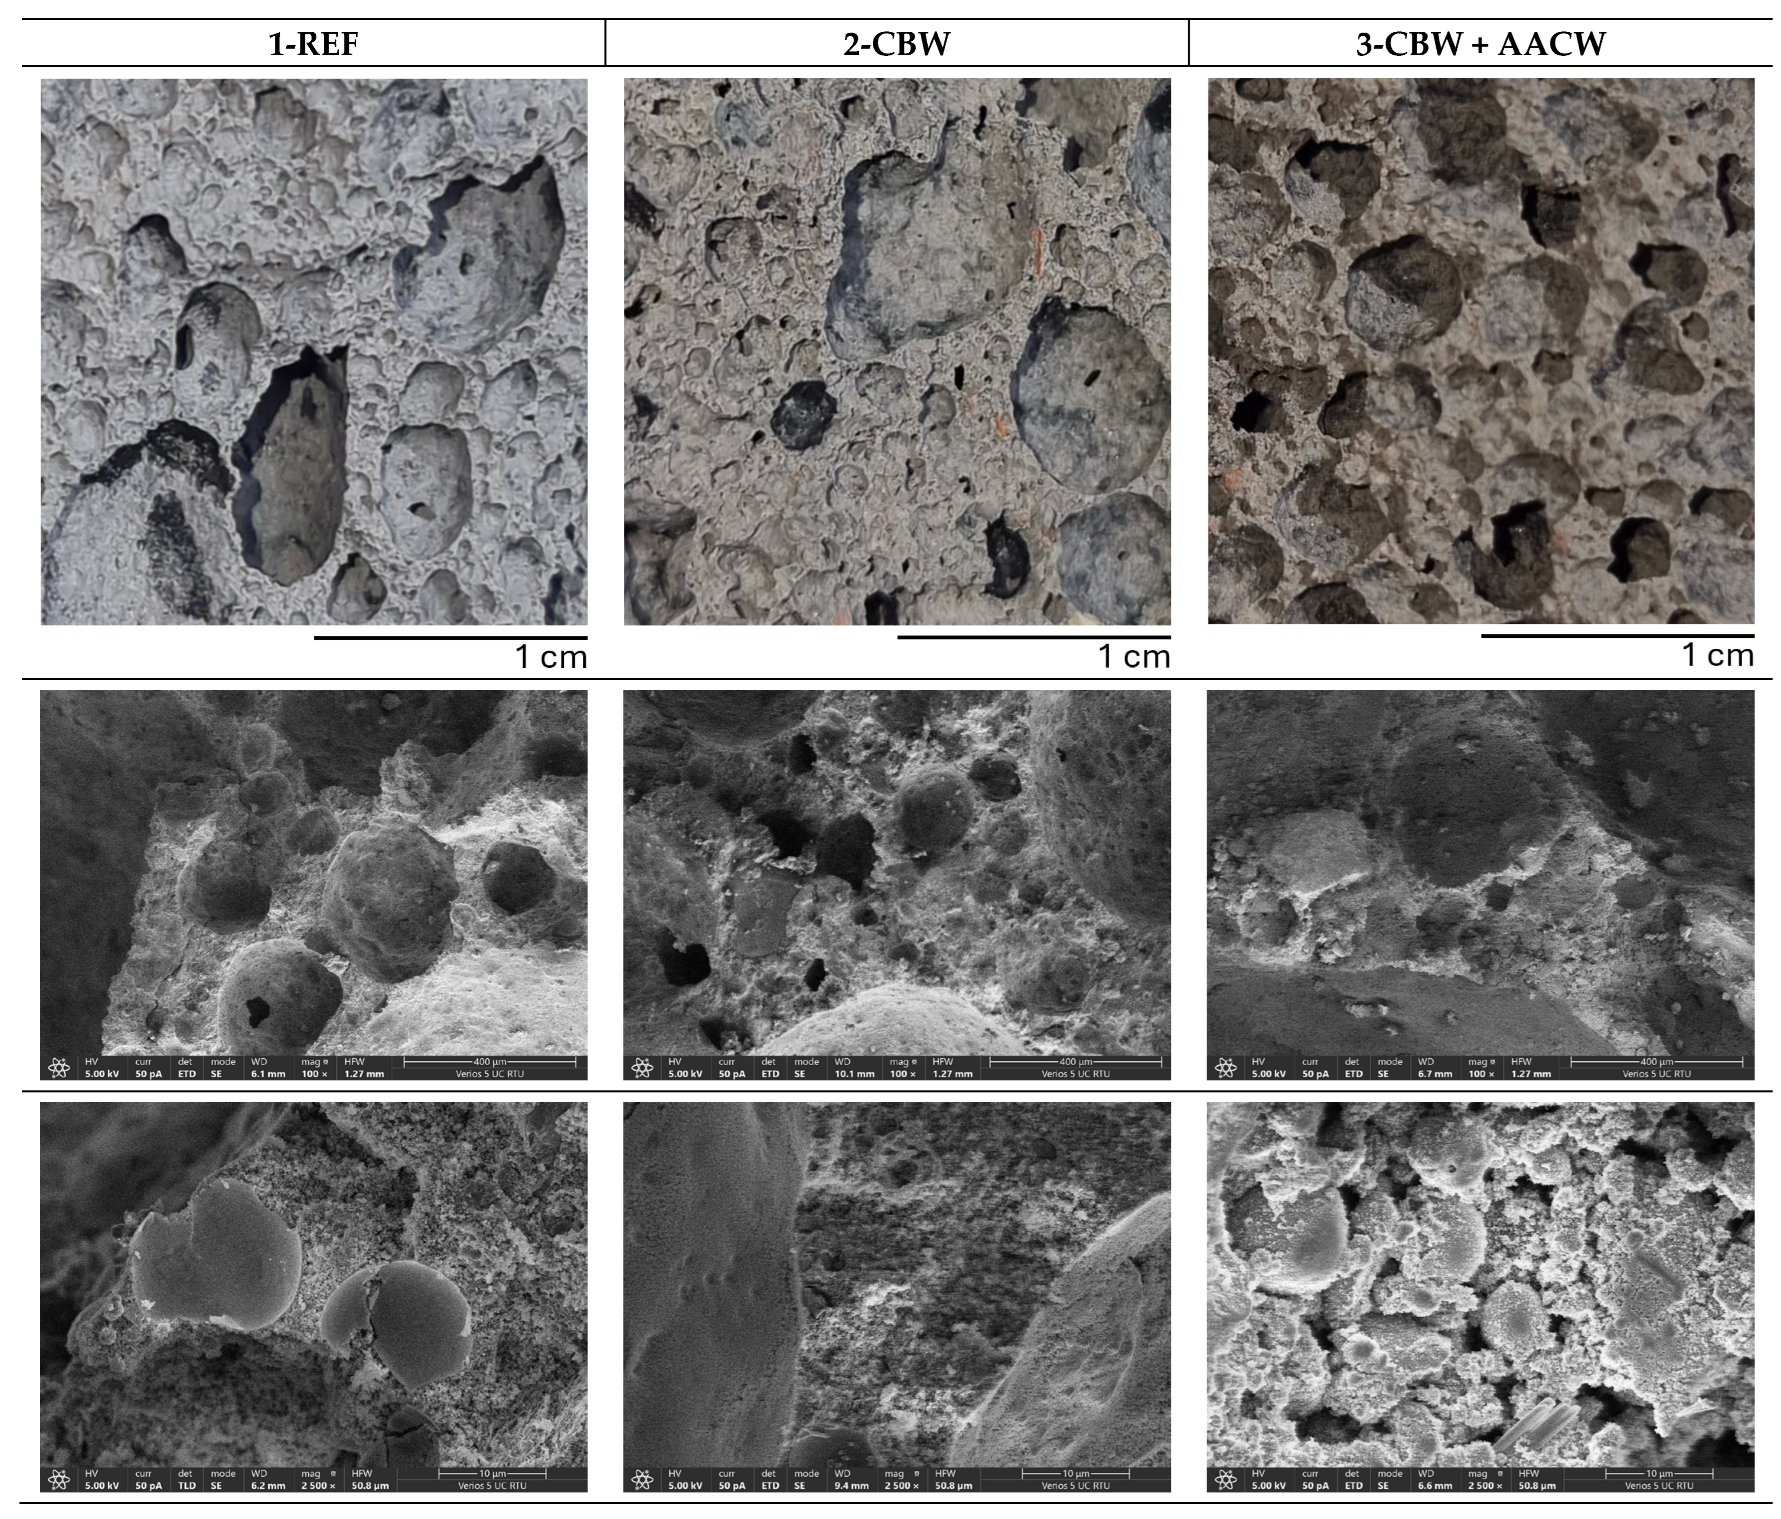
2.2.3. Material Properties

To evaluate the performance of the 3D-FOAM material, mechanical and thermal property tests were conducted on both the reference formulation and formulations incorporating recycled construction waste additives. These tests were designed to assess the impact of secondary raw materials on functional characteristics relevant to building applications, such as compressive strength and thermal conductivity. The results also served as the basis for defining the functional units applied in the subsequent life cycle assessment (LCA). Even though porosity and other technical parameters of the material are essential indicators of performance, they were not included in defining the FU for the present investigation. Future investigations should include more detailed research on the pore structure and morphology, and their role in the functionality of the material.
Compressive strength was determined to evaluate the load-bearing capacity of the material. Samples were tested in accordance with the LVS EN 12390-3; Testing Hardened Concrete—Part 3: Compressive Strength of Test Specimens. European Committee for Standardisation (CEN): Brussels, Belgium, 2019, using a compression testing machine with a loading rate of 0.5 MPa/s [27]. All samples were cut from printed elements after 28 days of curing. The measured compressive strength values defined the mechanical performance threshold of 3 MPa corresponding to the first functional unit (FU1).
Thermal conductivity was measured using a LaserComp FOX 600 heat flow meter, following the EN 12667:2001; Thermal Performance of Building Materials and Products—Determination of Thermal Resistance by Means of Guarded Hot Plate and Heat Flow Meter Methods—Products of High and Medium Thermal Resistance. European Committee for Standardisation (CEN): Brussels, Belgium, 2001 [28]. A temperature gradient of 20 °C was maintained between the upper (0 °C) and lower (20 °C) plates, resulting in a mean testing temperature of 10 °C. Test specimens measured 350 × 350 mm, with thicknesses ranging from 24 to 59 mm. Each sample was placed horizontally between the plates, and thermal conductivity was determined under steady-state conditions. R-values and U-values were calculated based on the measured conductivity and specimen thickness. The second functional unit (FU2) was based on the material required to achieve thermal performance equivalent to that of conventional insulating wall materials.
A high-resolution scanning electron microscope, Verios 5 UC (ThermoFisher Scientific, Waltham, MA, USA), was used to visualise the surface and fracture morphology of the samples. Secondary electrons created at an acceleration voltage of 5 kV were used for the sample image generation. For microscopy, the samples were fixed on standard aluminium pin stubs with an electrically conductive double-sided adhesive carbon tape. Before examination by SEM, the samples were sputter-coated by a thin layer of carbon using Leica EM ACE200 (Leica, Wetzlar, Germany) sputter coater.
The reported values (Table 3) represent the average values of six replicates for each formulation. Standard deviation is included to illustrate the variability ofin the mechanical performance. The REF and CBW formulations showed moderate variation, while the CBW + AACW mixture exhibited higher variability, likely due to inhomogeneous particle distribution and phase interactions.
An examination of all three samples (Figure 2) shows that the macroporosity is generally similar across formulations (top row); however, the REF and CBW samples contain some larger isolated pores reaching up to 5 mm in diameter, while the CBW + AACW sample features more uniformly distributed medium-sized pores with a maximum diameter of around 3 mm. SEM images (middle row) reveal that the smallest visible pores are approximately 100 µm, which confirms that all observed pores fall within the macropore range and are typical of those formed by H2O2 foaming. While such pores are characteristic of this foaming method, the appearance of excessively large pores likely resulted from overly intense gas release and may not provide additional benefits in terms of mechanical or thermal performance. In fact, macropores in the range of 100 µm to ~1 mm are considered most effective for reducing thermal conductivity under dry conditions by trapping still air. Larger pores (>2–3 mm), on the other hand, can promote convective heat transfer and reduce structural integrity. These pore size observations are partially reflected in the measured thermal conductivity values: both REF and CBW samples showed slightly higher values (~0.16 W/m × K), while the CBW + AACW sample reached a lower conductivity of 0.14 W/m × K.
Despite similar macropore morphology, the CBW + AACW material exhibited the lowest compressive strength (~2 MPa), while the REF sample reached ~5 MPa and the CBW sample achieved the highest value at ~7 MPa. This indicates that mechanical strength is governed not only by pore structure, but also by its influence on matrix density, binder reactivity, and microstructural cohesion. SEM analysis (Figure 2, bottom row) supports this interpretation. The CBW sample displays a dense and cohesive matrix with well-developed gel phases and good integration of residual particles, which likely contributes to its superior mechanical performance. In contrast, the REF sample shows a more porous and less compact matrix, with visible voids and a lower degree of gel continuity. The CBW + AACW sample reveals the weakest microstructure, characterised by partially reacted particles, microcracks, and poor phase connectivity, suggesting incomplete geopolymerisation or incompatibility between components. These features explain the significant loss in strength, despite comparable macroporosity and a slight improvement in thermal conductivity. While the present analysis provides qualitative insight, future work will include quantitative characterisation of pore structure (e.g., average pore diameter and pore volume fraction) to enable stronger correlations between microstructure and material performance. The measured values for compressive strength and thermal conductivity were used to benchmark the 3D-FOAM materials, both with and without recycled additives, against conventional materials available on the market. Environmental performance data for conventional alternatives were obtained from EPDs published by manufacturers.

2.2.4. Reference Flow Determination Based on Material Properties

Reference flows were calculated based on material functionality integrated into the functional units to ensure functional comparability between material formulations. For FU1, the required mass of material to construct a 1 m3 wall panel with compressive strength ≥ 3 MPa was determined. For the second functional unit (FU2), the mass required to achieve a thermal transmittance (U-value) of 0.25 W/m2K was calculated using measured thermal conductivity values. Reference values are summarised in Table 4. Both FUs are expressed in kg of final product; a different amount of material is needed to fulfil the functional unit.
For a 1 m3 building block with a compressive strength of at least 3 MPa, reference flows are 644 kg of final material in REF material and 633 kg in material with CBW additives. Although the compressive strength of the materials incorporating CBW and AACW additives did not reach the target value of 3 MPa, these formulations were retained in the study for indicative purposes. The aim was to assess the environmental relevance and potential of further developing these material formulations, despite their current mechanical limitations. The material with CBW + AACW additives required the least material mass to fulfil the function. These reference flows were used to scale all environmental impacts in the life cycle assessment to ensure functional equivalence across materials.

3. Life Cycle Impact Assessment

The LCA in this study follows the ISO 14040:2006; Environmental Management—Life Cycle Assessment—Principles and Framework. International Organisation for Standardisation (ISO): Geneva, Switzerland, 2006 and ISO 14044:2006; Environmental Management—Life Cycle Assessment—Requirements and Guidelines. International Organisation for Standardisation (ISO): Geneva, Switzerland, 2006 [29,30]. The life cycle impact assessment (LCIA) phase quantifies the potential environmental impacts associated with producing the 3D-FOAM material based on the functional unit, system boundaries, and inventory data collected. All impact calculations were performed using SimaPro Craft v10.2.0.1 software.
The environmental impact assessment was performed using the ReCiPe 2016 Midpoint (H) method, covering the following impact categories: global warming potential (GWP), stratospheric ozone depletion (SOD), ionising radiation (IR), human health ozone formation (OF-HH), particulate matter formation (PMF), terrestrial ozone formation (OF-TE), terrestrial acidification (TA), freshwater eutrophication (FEu), marine eutrophication (MEu), terrestrial ecotoxicity (TEco), freshwater ecotoxicity (FEco), marine ecotoxicity (MEco), human carcinogenic toxicity (HTc), human non-carcinogenic toxicity (HTnc), land use (LU), mineral resource scarcity (MRS), fossil resource scarcity (FRS), and water consumption (WC). The ReCiPe 2016 Endpoint (H) method was used to calculate a single score impact for contribution analysis. Given the early-stage development of the 3D-FOAM material, impact results were analysed across different hypothetical scenarios to reflect potential technological advancements and future optimisation opportunities.

4. Results and Discussion

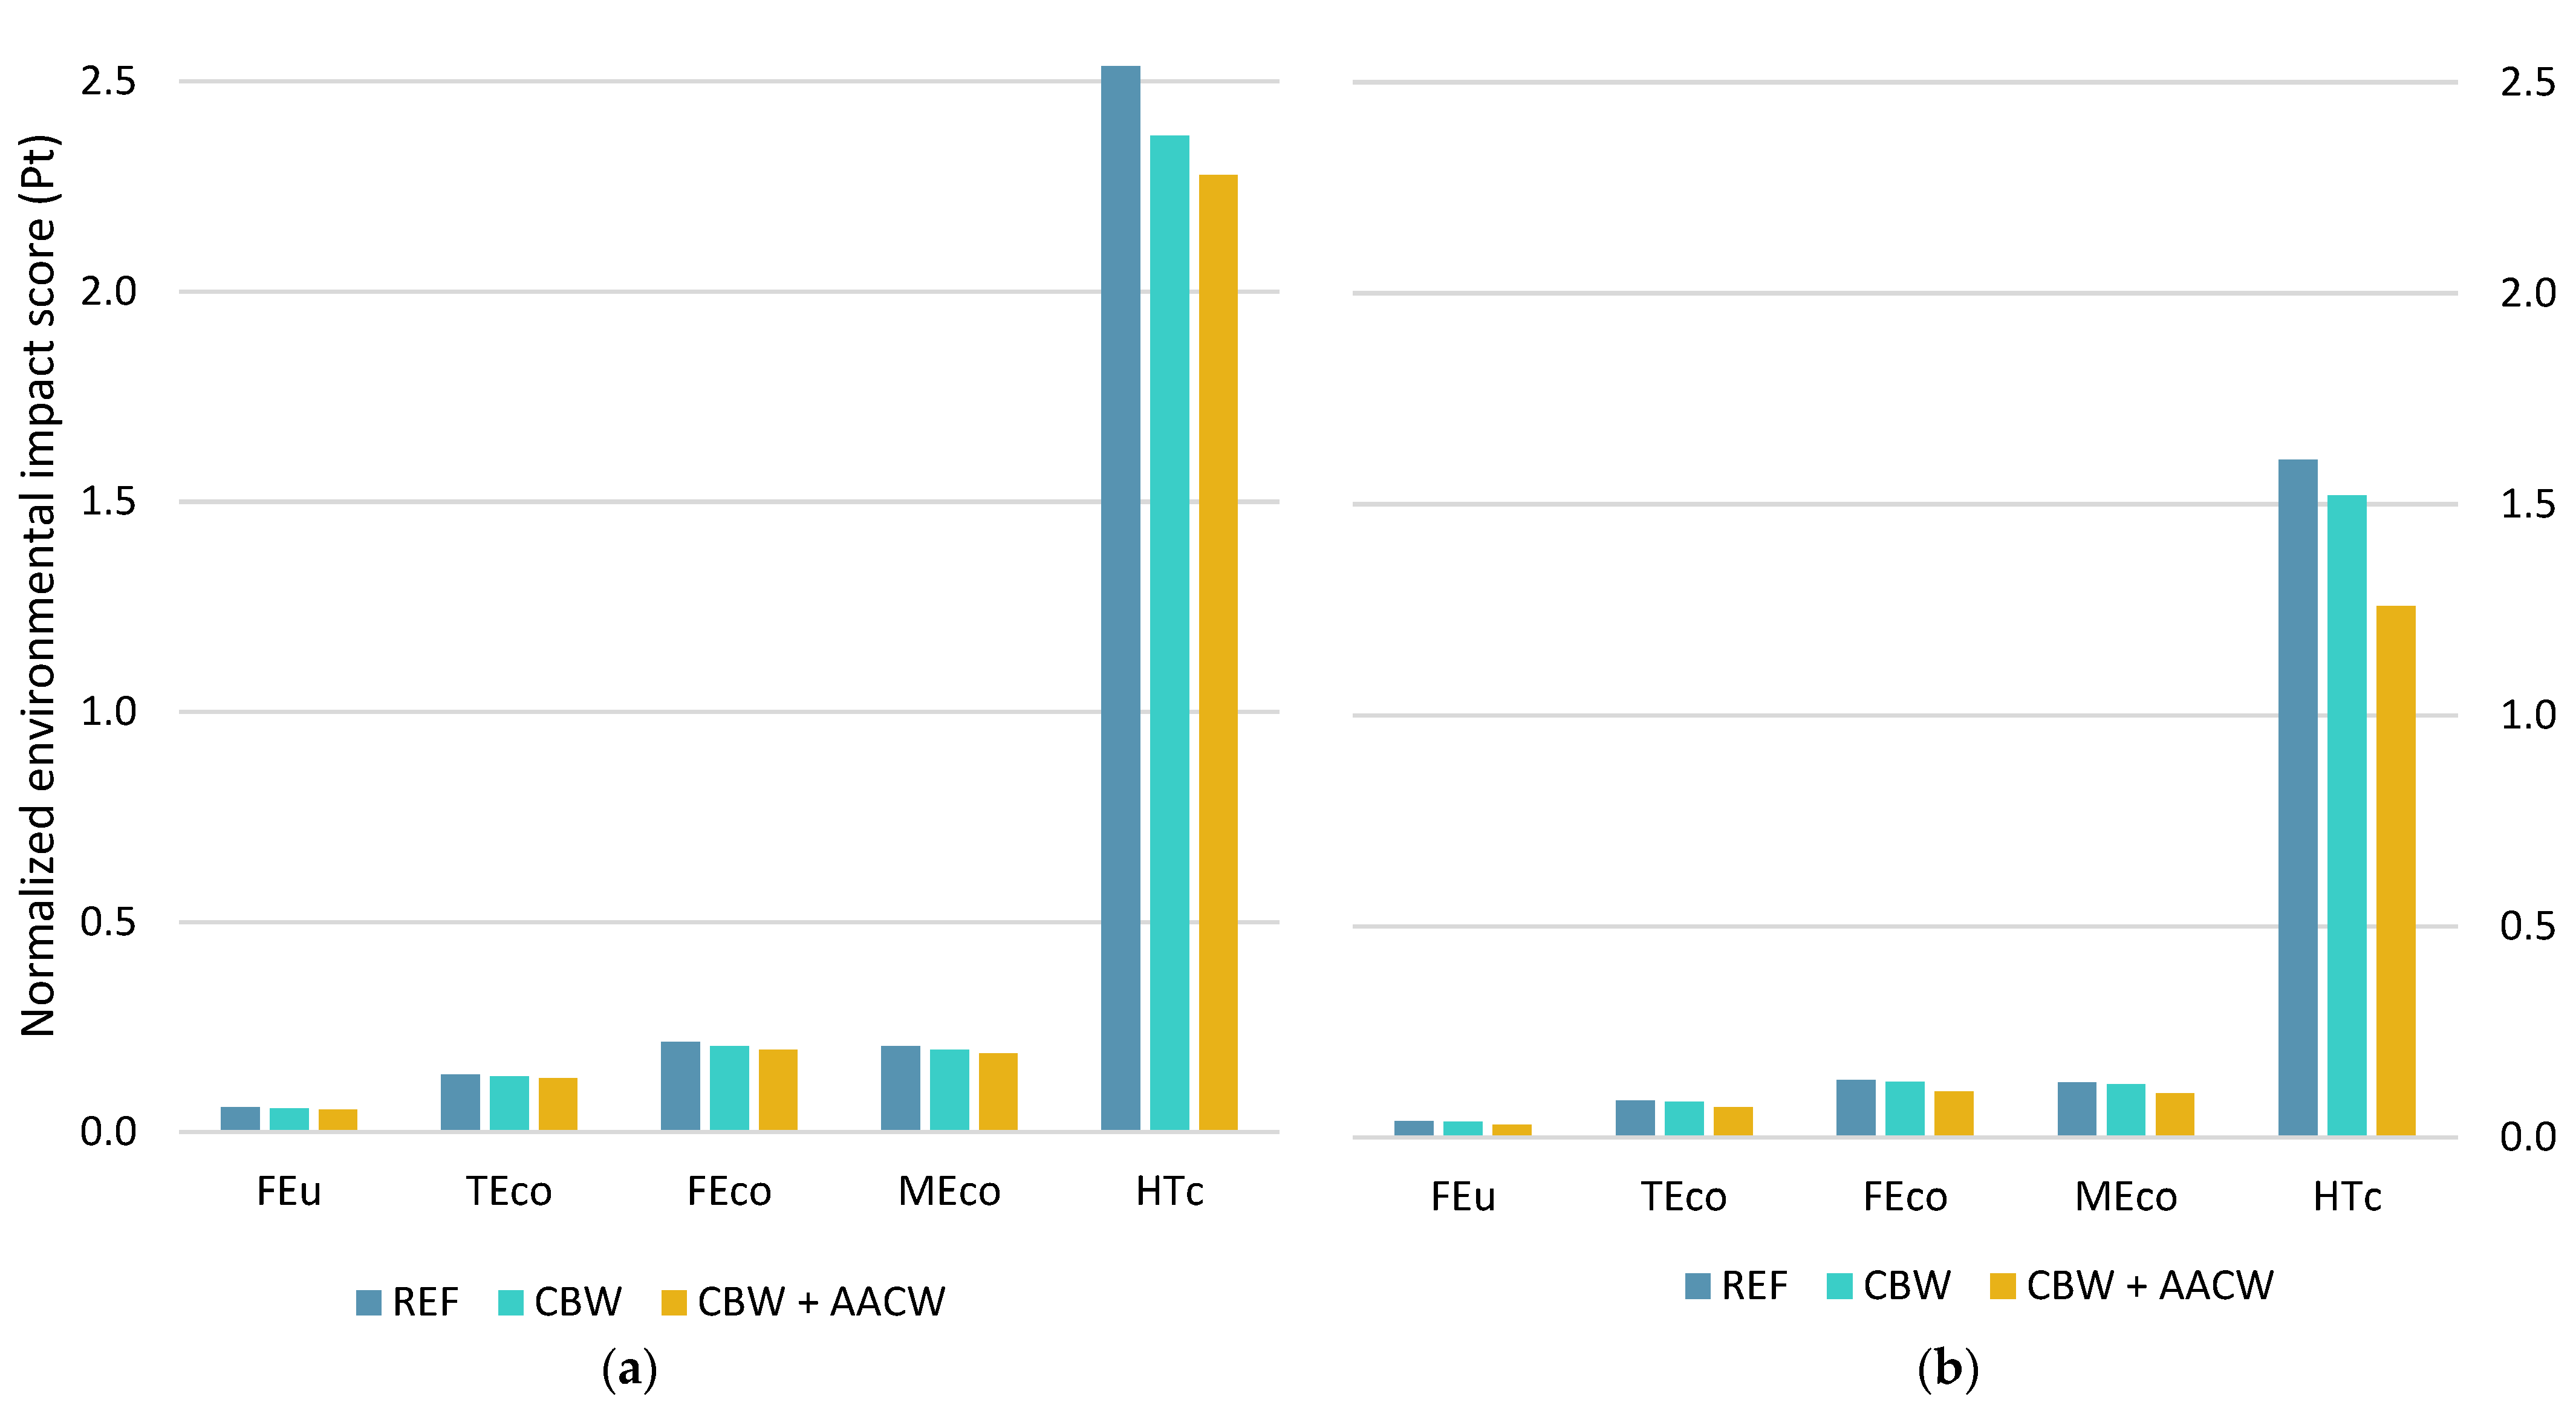
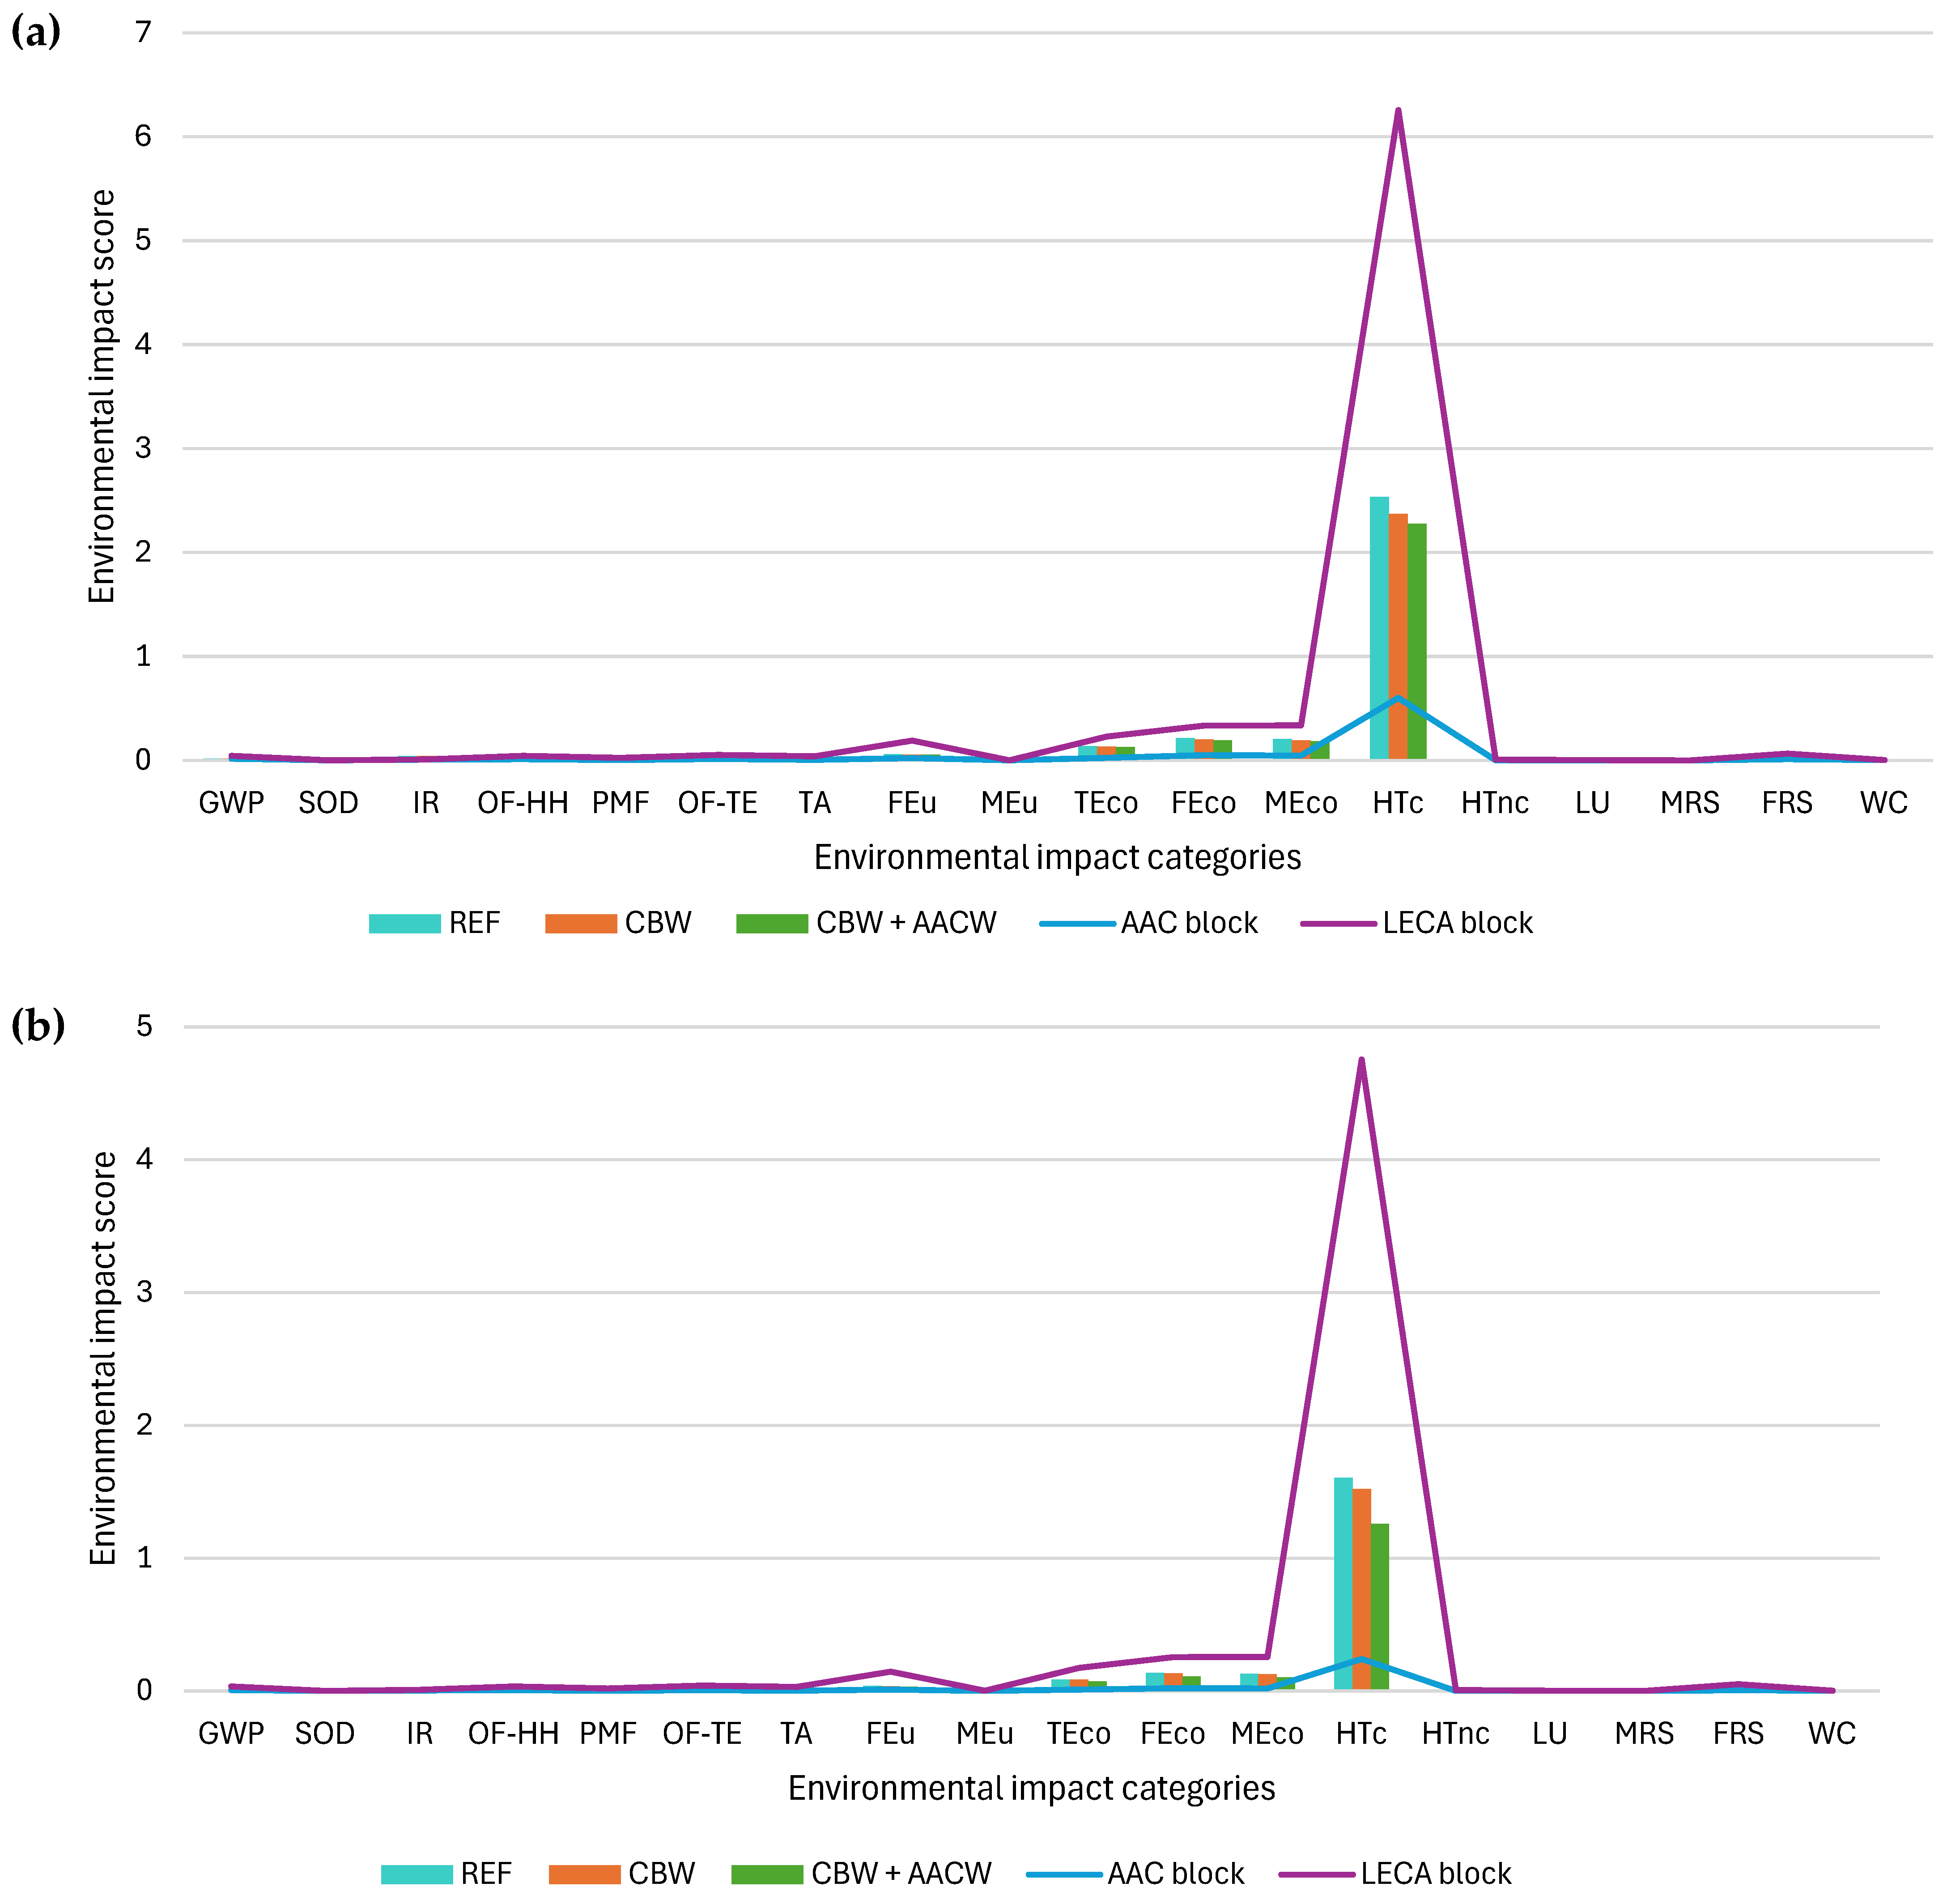
4.1. Environmental Performance of 3D-FOAM Materials

Three mortar formulations were compared to evaluate the environmental benefits of incorporating recycled materials: the base scenario using virgin raw materials, the CBW scenario with clay brick waste, and the CBW + AACW scenario with both clay brick waste and aerated autoclaved concrete waste.
Environmental impacts for each formulation were calculated using the ReCiPe 2016 Midpoint (H) method for each scenario under its respective functional unit (FU) (Table 5). Under FU1, the CBW + AACW scenario showed the lowest impact across nearly all categories, including global warming potential (−7%), human carcinogenic toxicity (−10%), and fossil resource scarcity (−8%) compared to REF. The CBW scenario also delivered improvements, though to a lesser extent.
When evaluated under FU2, the environmental advantages of CBW + AACW became more pronounced due to the significantly lower material mass required to meet thermal performance. Compared to REF, this scenario achieved a reduction of ~16–18% in impact categories, including land use, water consumption, and fine particulate matter formation.
These results demonstrate that incorporating recycled construction waste can lead to measurable reductions in environmental impacts, especially when thermal insulation is a key performance criterion. The results also show that even modest reductions in thermal conductivity can yield substantial gains under FU2 due to the inverse relationship between λ-value and required material thickness.
The normalisation of the environmental impact results shows that the five environmental impact categories with the highest environmental impact are freshwater eutrophication (Feu), terrestrial ecotoxicity (TEco), freshwater ecotoxicity (FEco), marine ecotoxicity (MEco), with the highest impact score on human carcinogenic toxicity (HTc) (Figure 3).
The main difference between the environmental impact scores for FU1 and FU2 is caused by the quantity of material needed to fulfil the FU.
Across displayed environmental impact categories, the CBW + AACW formulation consistently outperformed the base scenario. This outcome highlights the relevance of circular economy strategies and supports the development of multi-stream recycling approaches for sustainable geopolymer mortar production.
The results indicate that the highest environmental burden among the assessed impact categories is associated with human carcinogenic toxicity. This outcome could be linked to the production and use of chemical additives and activators, such as sodium hydroxide (NaOH) and sodium silicate (Na2SiO3), which are commonly used in geopolymer formulations. These substances are known to be associated with the emission of hazardous substances during their production, including heavy metals and other toxic intermediates, which significantly contribute to toxicity-related impact categories. Another contributing factor may be the energy consumption required for material preparation, particularly for drying.

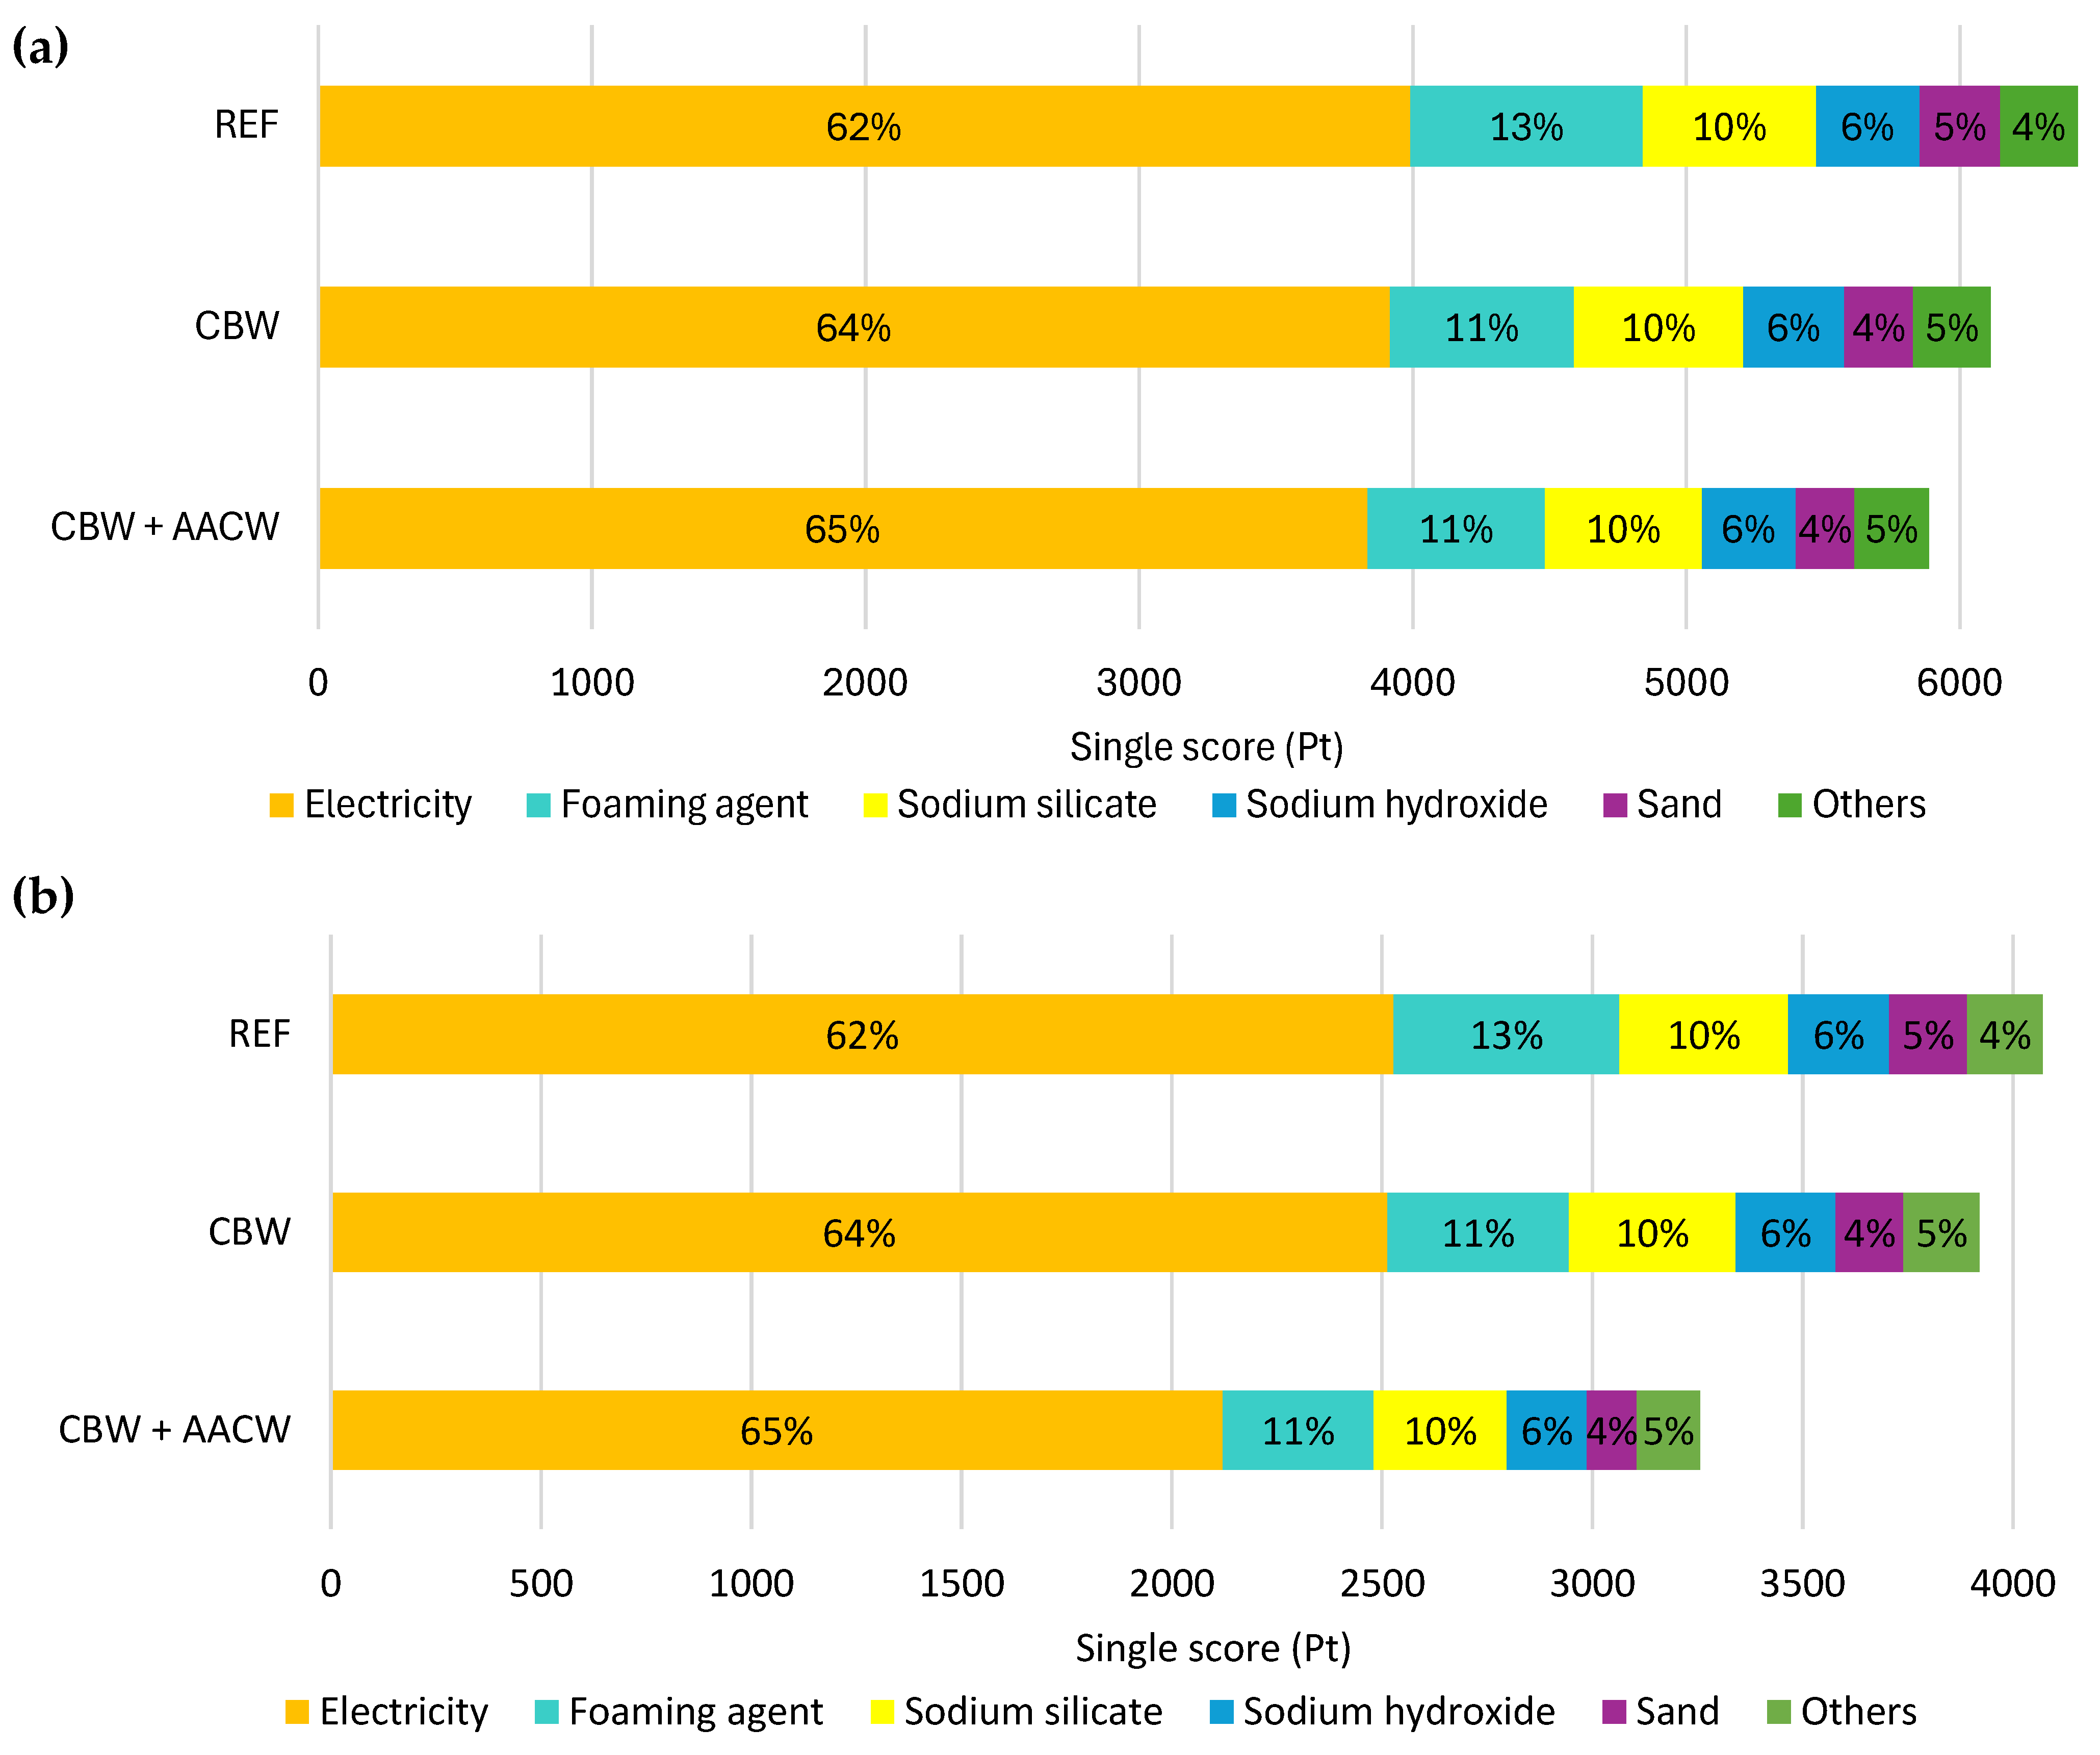
4.2. Contribution Analysis

To identify the main contributors to the environmental impacts of the 3D-FOAM material formulations, a contribution analysis was conducted across all input flows. The analysis focused on the dominant materials and processes that influence the total environmental impact score.
Figure 4a,b present the contribution analysis for the environmental single score (Pt) indicator across three material scenarios under two functional units: FU1 (Figure 4a) and FU2 (Figure 4b). The relative contributions of key input flows—electricity, foaming agent, sodium silicate, sodium hydroxide, sand, and others—are visualised to identify environmental hotspots and assess the effects of waste-derived additives.
Across both functional units, electricity is the dominant contributor to the total environmental impact, accounting for 62–65% of the single score. This reflects the energy-intensive nature of pre-treatment and processing steps such as milling, mixing, and foaming. The increase in electricity’s relative contribution from the reference scenario (REF) to the CBW + AACW scenario indicates that incorporating recycled materials may elevate energy requirements, primarily due to additional pre-treatment demands associated with construction and demolition waste.
However, it is essential to note that despite the higher relative share of electricity, the absolute environmental impact (in Pt) per functional unit decreases in the alternative scenarios. This suggests that the use of recycled additives improves the environmental efficiency of the material system, particularly in the CB + AACW scenario, where less environmental impact is required to achieve the same functional performance.
The primary contributor to the environmental impact of the 3D-FOAM material is the electricity used for drying. It is worth noting that materials in laboratory conditions were dried in an oven, which results in higher electricity consumption. As the process scales up, other drying options should be explored to mitigate the environmental impact of excessive electricity use from the grid. If electricity consumption continues to be a significant contributor to environmental impact, then utilising renewable energy sources may help mitigate this impact.
The contribution of the foaming agent ranges from 11% to 13% across scenarios. It is highest in the REF formulation and slightly lower in the CBW and CBW + AACW scenarios, which may reflect reduced dosage or improved foaming efficiency in the waste-enhanced formulations. Sodium silicate shows a uniform contribution of 10% across all cases, indicating its stable role in the geopolymer matrix regardless of the presence of recycled inputs. In contrast, sodium hydroxide exhibits a decreasing trend—from 6% in REF to 4% in CBW + AACW—suggesting that the inclusion of aluminosilicate-rich wastes partially replaces the need for synthetic alkali activators. A slight decrease in the relative environmental impact of the sand in alternative scenarios indicates that waste additives enable the substitution of sand, thereby reducing the environmental impact of the sand.
Overall, the contribution analysis reveals that while the relative distribution of environmental impacts remains unchanged across both functional units, performance-driven efficiency gains lead to a noticeable reduction in absolute environmental burdens. This emphasises the importance ofin optimising material properties not only for functional performance but also for environmental sustainability. The results demonstrate that the CBW& + AACW scenario exhibits the lowest absolute environmental impact across both functional units, confirming the environmental benefits of integrating recycled clay brick and autoclaved aerated concrete waste into the 3D-FOAM formulation. However, it must be noted that the compressive strength of this material did not meet the compressive strength value, indicating that further material development is required. Future optimisation should aim to improve mechanical performance without compromising environmental gains, particularly by preserving the advantages gained through the substitution of virgin raw materials with recycled inputs. Notably, the CBW + AACW material showed favourable thermal insulation properties, making it highly suitable for non-load-bearing applications such as thermal insulation panels or partition walls. In such use cases, it offers a significantly lower environmental impact than the reference material, while contributing to resource efficiency through the valorisation of construction and demolition waste.
When we examine Figure 5a, which compares the environmental burden of developed foamed geopolymer composites with on-market available AAC and LECA blocks based on FU1 (functional unit devoted to material strength), the main characteristic is that the material with the greatest compressive strength also incurs the highest environmental burden. Nevertheless, the fact that AAC blocks can be load-bearing structural materials for low-rise residential buildings is taken into account. In that case it is clear that, AAC blocks are the most environmentally conscious material to use, striking a balance between strength and lower environmental impact, based on the materials reviewed in this study.
According to Figure 5b, the environmental burden associated with AAC blocks is even lower than that shown in Figure 5a. This insight further justifies the use of AAC blocks in the creation of low-rise buildings or non-load-bearing walls. According to Figure 5a,b, the AAC blocks appear to be the best regarding the material properties developed that are important to the consumer, together with the technical means necessary to streamline manufacturing, so that material waste and environmental impact created by the material manufacturing are at their lowest.
Thus, this moves forward to the main result of this study. The materials developed in this study have the potential to be utilised in civil engineering applications, serving as an environmentally friendly alternative to AAC. Still, while the strength of the formulation is favourable for material with added CBW, the thermal transmittance coefficient could and should be improved. This will lead to improvements in the material creation procedures and further possible reductions in the environmental burden caused by manufacturing processes.
Several aspects require further investigation to enhance the performance and sustainability of 3D-FOAM materials. First, the amount of foaminsg agent should be carefully optimised to achieve a porous structure that improves thermal performance while maintaining sufficient mechanical strength. Future work should focus on incorporating quantitative pore structure analysis from image-based or complementary methods to strengthen the interpretation of the material’s functional properties. Second, future studies should address the challenges of scale-up. Industrial-scale production is expected to lower electricity demand, and alternative foaming agents may provide improved process efficiency. Additionally, residual heat from industrial symbiosis could be explored to reduce the energy required for drying. Third, this study did not assess the long-term durability and service life of the developed materials, which should be evaluated under realistic environmental conditions. Finally, alternative recycled waste streams should be investigated to identify additional suitable inputs and broaden the material’s applicability.

5. Conclusions

In the pursuit of developing 3D-printable foamed geopolymer composites with recycled material additions, the following conclusions can be stated:
  • To improve environmental performance, CBW and AACW were added as recycled materials. Both materials were compatible with alkali-activated systems, enabling the formation of stable mortars suitable for extrusion-based 3D printing.
  • The prospective LCA results show that the main contributors to environmental impact are associated with electricity consumption during processing, and the use of foaming and stabilising agents. Future development should aim to reduce the impacts of these contributors by optimising formulations and improving process energy efficiency.
  • The study shows that the most environmentally favourable formulation was the 3D-FOAM material with both CBW and AACW. This formulation consistently reduced environmental impacts across all impact categories. The composite with CBW-only also showed improvements, although to a lesser extent.
  • Compared to conventional wall materials such as LECA blocks, the developed geopolymer mixes performed favourably in terms of environmental impact when benchmarked using functional units. However, the formulation with CBW and AACW exhibited lower mechanical strength than required.
  • This study represents a prospective LCA based on lablaboratory-scale data, and further input from scaled-up production processes will be needed to support more robust forecasting. Nonetheless, the current results provide valuable insight into potential environmental burdens and their sources at the early development stage.

Supplementary Materials

The following supporting information can be downloaded at: https://www.mdpi.com/article/10.3390/su17146459/s1. Table S1: Inventory data of 3D-FOAM materials; Table S2: Inventory data of NaOH solution; Table S3: Inventory data of milled clay brick waste production; Table S4: Inventory data of milled aerated autoclaved concrete; Table S5: Inventory data of fly ash; Table S6: Inventory data of cement; Table S7: Inventory data of slag; Table S8: Results of the Impact Assessment; Table S9: Results of the Contribution Analysis; Table S10: Results of the Benchmarking to Conventional Materials.

Author Contributions

Conceptualisation, K.B., R.G., M.S. and A.S.; methodology, K.B. and R.G.; investigation, K.B., R.G., M.S., P.P.A., L.R. and A.S.; writing—original draft preparation, K.B. and R.G.; writing—review and editing, R.G., M.S. and A.S.; visualisation, K.B.; supervision, A.S.; project administration, A.S.; funding acquisition, A.S. All authors have read and agreed to the published version of the manuscript.

Funding

This research was supported by the Latvian Council of Science within the scope of the project “Foamed Geopolymer Made by Additive Manufacturing for the Construction Technology Applications (3D-FOAM)” No. ESRTD/2022/8.

Institutional Review Board Statement

Not applicable.

Informed Consent Statement

Not applicable.

Data Availability Statement

The data presented in this study are available on request from the corresponding author.

Conflicts of Interest

The authors declare no conflicts of interest.

Abbreviations

The following abbreviations are used in this manuscript:
GCGeopolymer compositesComposites
AACWAerated autoclaved concrete wasteAutoclaved Concrete Waste
AACAerated autoclaved concreteAutoclaved Concrete
LECALightweight expanded clay aggregateExpanded Clay Aggregate
CBWClay brick wasteBrick Waste
LCALife Cycle Assessment
LCILife Cycle Inventory
LCIALife Cycle Impact Assessment
GWPGlobal Warming Potential
SODStratospheric Ozone Depletion
IRIonising Radiation
OF-HHOzone Formation—Human Health
PMFParticulate Matter Formation
OF-TEOzone Formation—Terrestrial Ecosystems
TATerrestrial Acidification
FEuFreshwater Eutrophication
MEuMarine Eutrophication
TEcoTerrestrial Ecotoxicity
FEcoFreshwater Ecotoxicity
MEcoMarine Ecotoxicity
HTcHuman Carcinogenic Toxicity
HTncHuman Non-Carcinogenic Toxicity
LULand Use
MRSMineral Resource Scarcity
FRSFossil Resource Scarcity
WCWater Consumption

References

  1. Wong, K.V.; Hernandez, A. A Review of Additive Manufacturing. ISRN Mech. Eng. 2012, 2012, 208760. [Google Scholar] [CrossRef]
  2. Alhumayani, H.; Gomaa, M.; Soebarto, V.; Jabi, W. Environmental assessment of large-scale 3D printing in construction: A comparative study between cob and concrete. J. Clean. Prod. 2020, 270, 122463. [Google Scholar] [CrossRef]
  3. Lori, A.R.; Novais, R.M.; Ascensão, G.; Fernandes, F.; Ranjbar, N.; Spangenberg, J. Chemically foamed geopolymers for 3D printing applications. Cem. Concr. Compos. 2025, 161, 106116. [Google Scholar] [CrossRef]
  4. Khalid, L.W.; Mermerdaş, K.; Bzeni, D.K.; Jawad, D.J. Determination of appropriate mix proportion of carbon fiber reinforced geopolymer composite for 3D printing technology. J. Build. Eng. 2025, 100, 111751. [Google Scholar] [CrossRef]
  5. Yan, Y.; Zhang, M.; Ma, G.; Sanjayan, J. An eco-friendly ultra-high-performance geopolymer concrete with quaternary binders for 3D printing. J. Clean. Prod. 2025, 487, 144614. [Google Scholar] [CrossRef]
  6. Sheng, Z.; Zhu, B.; Cai, J.; Han, J.; Zhang, Y.; Pan, J. Influence of waste glass powder on printability and mechanical properties of 3D printing geopolymer concrete. Dev. Built Environ. 2024, 20, 100541. [Google Scholar] [CrossRef]
  7. Radina, L.; Sprince, A.; Pakrastins, L.; Gailitis, R.; Sakale, G. Potential Use of Construction Waste for the Production of Geopolymers: A Review. Mater. Proc. 2023, 2, 13002. [Google Scholar] [CrossRef]
  8. Zou, D.; Que, Z.; Cui, W.; Wang, X.; Guo, Y.; Zhang, S. Feasibility of recycling autoclaved aerated concrete waste for partial sand replacement in mortar. J. Build. Eng. 2022, 52, 104481. [Google Scholar] [CrossRef]
  9. He, X.; Zheng, Z.; Yang, J.; Su, Y.; Wang, T.; Strnadel, B. Feasibility of incorporating autoclaved aerated concrete waste for cement replacement in sustainable building materials. J. Clean. Prod. 2020, 250, 119455. [Google Scholar] [CrossRef]
  10. Lam, N.N. Recycling of Aac Waste in the Manufacture of Autoclaved Aerated Concrete in Vietnam. Int. J. GEOMATE 2021, 20, 128–134. [Google Scholar] [CrossRef]
  11. Silva, G.; Castañeda, D.; Kim, S.; Castañeda, A.; Bertolotti, B.; Ortega-San-Martin, L.; Nakamatsu, J.; Aguilar, R. Analysis of the production conditions of geopolymer matrices from natural pozzolana and fired clay brick wastes. Constr. Build. Mater. 2019, 215, 633–643. [Google Scholar] [CrossRef]
  12. Zhu, L.; Zhu, Z. Reuse of Clay Brick Waste in Mortar and Concrete. Adv. Mater. Sci. Eng. 2020, 2020, 6326178. [Google Scholar] [CrossRef]
  13. Migunthanna, J.; Rajeev, P.; Sanjayan, J. Waste Clay Bricks as a Geopolymer Binder for Pavement Construction. Sustainability 2022, 14, 6456. [Google Scholar] [CrossRef]
  14. Hanein, T.; Thienel, K.C.; Zunino, F.; Marsh, A.T.M.; Maier, M.; Wang, B.; Canut, M.; Juenger, M.C.G.; Ben Haha, M.; Avet, F.; et al. Clay calcination technology: State-of-the-art review by the RILEM TC 282-CCL. Mater. Struct. Constr. 2022, 55, 3. [Google Scholar] [CrossRef]
  15. Migunthanna, J.; Rajeev, P.; Sanjayan, J. Investigation of waste clay brick as partial replacement of geopolymer binders for rigid pavement application. Constr. Build. Mater. 2021, 305, 124787. [Google Scholar] [CrossRef]
  16. Yener, E. Curing Time and Temperature Effect on the Resistance to Wet-Dry Cycles of Fly Ash Added Pumice Based Geopolymer. J. Cem. Based Compos. 2020, 1, 19–25. [Google Scholar] [CrossRef]
  17. Udawattha, C.D.; Lakmini, A.V.R.D.; Halwatura, R.U. Fly ash-based geopolymer mud concrete block. In Proceedings of the MERCon 2018—4th International Multidisciplinary Moratuwa Engineering Research Conference, Moratuwa, Sri Lanka, 30 May–1 June 2018; pp. 583–588. [Google Scholar] [CrossRef]
  18. Fang, Y.X.; Wu, P.Z.; Chen, S.; Li, Y.; Cui, S.F.; Zhu, J.X.; Cao, H.Z.; Jiang, K.J.; Zhong, L. Prospective LCA towards achieving carbon neutrality goals: Framework application and challenges. Environ. Impact Assess. Rev. 2025, 111, 107733. [Google Scholar] [CrossRef]
  19. Manthos, G.; Zagklis, D.; Georgopoulos, C.; Zafiri, C.; Kornaros, M. Life Cycle Assessment of Waste Glass Geopolymerization for the Production of Sustainable Construction Materials. Processes 2025, 13, 331. [Google Scholar] [CrossRef]
  20. Motalebi, A.; Khondoker, M.A.H.; Kabir, G. A systematic review of life cycle assessments of 3D concrete printing. Sustain. Oper. Comput. 2024, 5, 41–50. [Google Scholar] [CrossRef]
  21. Liu, S.; Lu, B.; Li, H.; Pan, Z.; Jiang, J.; Qian, S. A comparative study on environmental performance of 3D printing and conventional casting of concrete products with industrial wastes. Chemosphere 2022, 298, 134310. [Google Scholar] [CrossRef]
  22. Tosti, L.; van Zomeren, A.; Pels, J.R.; Damgaard, A.; Comans, R.N.J. Life Cycle Assessment of the Reuse of Fly Ash from Biomass Combustion as Secondary Cementitious Material in Cement Products. J. Clean. Prod. 2020, 245, 118937. [Google Scholar] [CrossRef]
  23. Sapata, A.; Šinka, M.; Šahmenko, G.; Korat Bensa, L.; Hanžič, L.; Šter, K.; Ručevskis, S.; Bajāre, D.; Bos, F.P. Establishing Benchmark Properties for 3D-Printed Concrete: A Study of Printability, Strength, and Durability. J. Compos. Sci. 2025, 9, 74. [Google Scholar] [CrossRef]
  24. Volk, R.; Steins, J.J.; Kreft, O.; Schultmann, F. Life Cycle Assessment of Post-Demolition Autoclaved Aerated Concrete (AAC) Recycling Options. Resour. Conserv. Recycl. 2023, 188, 106716. [Google Scholar] [CrossRef]
  25. Institut Bauen und Umwelt e.V. Environmental Product Declaration—Environmental Product Declaration, PROMATEC-L500. 2021, p. 11. Available online: https://epd-online.com/EmbeddedEpdList/Download?id=15158 (accessed on 31 March 2025).
  26. Oviir, A.; Ital, A. Autoclaved aerated concrete blocks (EPD). 2021, pp. 1–17. Available online: https://bauroc.lv/uploads/sites/7/2021/06/EPD_blocks_allkirjadega.pdf (accessed on 31 March 2025).
  27. EN 12390-3; Testing Hardened Concrete—Part 3: Compressive Strength of Test Specimens. European Committee for Standardisation (CEN): Brussels, Belgium, 2019.
  28. EN 12667:2001; Thermal Performance of Building Materials and Products—Determination of Thermal Resistance by Means of Guarded Hot Plate and Heat Flow Meter Methods—Products of High and Medium Thermal Resistance. European Committee for Standardisation (CEN): Brussels, Belgium, 2001.
  29. ISO 14040:2006; Environmental Management—Life Cycle Assessment—Principles and Framework. International Organisation for Standardisation (ISO): Geneva, Switzerland, 2006.
  30. ISO 14044:2006; Environmental Management—Life Cycle Assessment—Requirements and Guidelines. International Organisation for Standardisation (ISO): Geneva, Switzerland, 2006.
Figure 1. System boundaries of 3D-FOAM material production.
Sustainability 17 06459 g001
Figure 2. Morphological characteristics of 3D-FOAM materials. Top row—macroscopic cross-sections showing pore distribution and size; middle row—SEM images at 100× magnification highlighting pore morphology and typical sizes formed by H2O2 foaming (~100 µm to 3–5 mm); bottom row—high-magnification SEM images at 2500× showing matrix structure, degree of geopolymerisation, and integration of unreacted or partially reacted particles.
Sustainability 17 06459 g002
Figure 3. Normalised environmental impacts in the top five impact categories for 3D-FOAM material scenarios: (a) per FU1; (b) per FU2.
Sustainability 17 06459 g003
Figure 4. Relative contribution to total environmental impact (single score): (a) FU1; (b) FU2.
Sustainability 17 06459 g004
Figure 5. Environmental benchmarking of the 3D-FOAM material scenarios compared to conventional AAC and LECA blocks: (a) FU1; (b) FU2.
Sustainability 17 06459 g005
Table 1. Inventory data of 1m3 3D-FOAM materials across modelled scenarios.
Data Unit1-REF2-CBW3-CBW + AACW
Input
Fly Ashkg173.2163.5174.0
Slagkg38.536.338.7
Sandkg384.8363.4386.7
Aalborg cementkg11.512.915.5
NaOH solutionkg96.9104.8120.8
Waterkg32.138.769.6
H2O2 (foaming agent)kg7.46.47.7
Additives
Milled aerated autoclaved concretekg0.00.087.0
Milled clay brick wastekg0.081.887.0
Energy
Electricity for mixingkWh1.00.91.0
Electricity for 3D printingkWh1.81.71.9
Electricity for dryingkWh221.1215.9241.5
Output
Loss of water through dryingkg93.086.6183.2
Dry 3D-FOAM materialkg644.0633.0622.0
Table 2. Inventory of Na2SiO3 nanoparticle solution.
DataUnitAmount
Input
NaOHkg0.4
Waterkg1
Na2Sikg0.875
Waterkg2.625
Energy
Energy for mixingkWh0.02
Output
NaOH + Na2SiO3 solutionkg4.9
Table 3. Material properties of studied materials.
Product Properties
Materials/ScenariosDensity
(kg/m3)
Thermal Conductivity
λ10 Dry (W/mK)
Compressive Strength
(MPa)
3D FOAM materials
REF644 ± 0.010.165.06 ± 1.11
CBW additives633 ± 0.010.167.04 ± 1.31
CBW + AACW additives622 ± 0.010.142.08 ± 1.63
Conventional materials
Conventional AAC4250.103
Conventional LECA7400.193
Table 4. Reference flows per functional unit for each mortar formulation.
Reference Flows
Materials/ScenariosFU1—kg per 1 m3 Wall ≥ 3 MPaFU2—kg per 1 m2 Wall with U = 0.25 W/m2K
3D FOAM materials
REF644407.78
CBW additives633406.13
CBW + AACW additives622344.09
Conventional materials
Conventional AAC425170.00
Conventional LECA740562.40
Table 5. Environmental impact of 3D-FOAM materials.
UnitFU1 REFFU1 CBWFU1
CBW + AACW
FU2 REFFU2 CBWFU2
CBW + AACW
GWPkg CO2 eq152.56146.04141.0496.6093.7092.09
SODkg CFC11 eq<0.01<0.01<0.01<0.01<0.01<0.01
IRkBq Co-60 eq20.6520.1619.6013.0712.9312.80
OF-HHkg NOx eq0.340.320.310.210.210.20
PMFkg PM2.5 eq0.180.170.160.110.110.11
OF-TEkg NOx eq0.360.340.330.230.220.21
TAkg SO2 eq0.380.360.350.240.230.23
FEukg P eq0.040.040.040.020.020.02
MEukg N eq<0.01<0.01<0.01<0.01<0.01<0.01
TEcokg 1,4-DCB2075.982004.231939.091314.511285.911266.12
FEcokg 1,4-DCB5.425.144.923.433.303.22
MEcokg 1,4-DCB8.918.498.145.645.445.32
HTckg 1,4-DCB26.1224.4223.4516.5415.6715.31
HTnckg 1,4-DCB107.66101.8797.4068.1765.3663.60
LUm2 a crop eq13.8113.2312.668.758.498.27
MRSkg Cu eq0.430.410.390.270.260.26
FRSkg oil eq43.5541.6040.2627.5826.6926.29
WCm32.151.961.871.361.251.22
Disclaimer/Publisher’s Note: The statements, opinions and data contained in all publications are solely those of the individual author(s) and contributor(s) and not of MDPI and/or the editor(s). MDPI and/or the editor(s) disclaim responsibility for any injury to people or property resulting from any ideas, methods, instructions or products referred to in the content.

