1. Introduction
Climate change is currently the greatest threat to human health, with global impacts disproportionately affecting low- and middle-income countries [
1,
2,
3,
4]. Some of the impacts include respiratory and infectious diseases associated with heat waves, floods, and other climatic phenomena, and the resulting increases in mortality and morbidity, highlighting the need for resilient health systems to deal with these emerging threats [
5]. Although high-income countries are also affected [
6,
7,
8], low-income countries are particularly vulnerable [
9].
Since the historic Stockholm Conference, which celebrated its 50th anniversary in 2022, and the Earth Summit in Rio de Janeiro in 1992—a landmark event that saw more than one hundred countries participate in a global agreement on climate and environmental protection, which also celebrated its 30th anniversary in 2022 [
10]—the urgency of addressing global environmental, public health, and social challenges has been emphasized. The 2030 Agenda and its 17 Sustainable Development Goals (SDGs) reflect this orientation, establishing guidelines to respond to these crises. The Web of Science (WoS), one of the main scientific indexing bases, recently organized its documents according to the SDGs, highlighting the growing importance of these guidelines in scientific research. The 17 SDGs commit the international community to addressing interlinked issues of health, poverty, inequality, and climate change [
11]. The effective implementation of the SDGs requires an integrated approach that brings together knowledge and public policies to fight poverty, protect the environment, and promote global health. However, recent studies highlighted a significant gap between the current progress of health indicators and the goals set by the Paris Agreement [
12,
13]. Important issues, such as addressing climate change vulnerability in historically underserved regions, are still under discussion.
The current literature highlights not only the complexity of the climate and public health crisis but also points to the need to better understand how knowledge collaboration networks can contribute to mitigating these global challenges, especially in the field of health and well-being. However, important gaps remain in the production, dissemination, and collaboration of scientific knowledge about the SDGs in the face of the health and climate crises. Understanding these dynamics is crucial to identifying the structural barriers that limit the participation of vulnerable regions in knowledge generation. Thus, further studies are needed to investigate the role of these networks in advancing the SDGs and promoting equitable, sustainable development. This article explores the production of knowledge on the SDGs since the 1992 UN Conference in Rio de Janeiro, with attention to patterns that may reflect global knowledge asymmetries, particularly in the field of health. Although the SDGs were established in 2015, the period before 2015 is relevant because of the Stockholm Conference in 1972 and the Earth Summit in Rio de Janeiro in 1992, which marked the beginning of global agreements on climate and environmental protection.
The objective of this study is to analyze global scientific production and collaboration related to the Sustainable Development Goals (SDGs), with a specific focus on SDG 3 (Good Health and Well-being). The analysis is based on data retrieved from the Web of Science Core Collection covering the period from 1945 to 2023, using data mining techniques and complex network analysis. This study seeks to identify asymmetries in the global production of scientific knowledge and to highlight countries with low research output in these areas. To date, no study has quantitatively estimated knowledge production and global collaborative networks on the SDGs, with a focus on SDG 3 (Good Health and Well-Being), over such an extensive period. This work fills this gap by analyzing more than 49 million scientific publications, using data mining and complex network analysis techniques to map asymmetries in knowledge production. There are several advantages to understanding these knowledge networks, especially at a global level, when focusing on health and well-being. This includes identifying countries with low scientific output and exploring the factors that contribute to disparities in health and climate indicators. To summarize, the main contributions of this study are as follows: (a) The first large-scale bibliometric analysis of SDG-related scientific output, covering 49.4 million publications indexed in the Web of Science Core Collection from 1945 to 2023. (b) The construction and analysis of global co-authorship networks with a focus on SDG 3 (Good Health and Well-Being), providing insights into patterns of scientific collaboration. (c) The application of unsupervised clustering techniques to identify country-level asymmetries in knowledge production and scientific engagement with the SDGs. (d) The identification of countries and regions with low scientific output on SDG 3, contributing to the debate on global knowledge inequalities and providing an empirical foundation for more inclusive and equitable strategies for sustainable development. The wider goal is to provide data that will inspire new research and help identify other gaps that can be addressed by public policies focused on access to health, well-being, and a fair and equitable transition.
2. Background
Several recent studies have emphasized the crisis of biodiversity loss [
14], the water crisis [
15,
16], the climate and planetary crisis [
17], and the crisis of food supply and security [
18]. The poorest countries are the most affected by crises such as hunger [
19] and disease [
12,
20]. At the same time, recent studies have highlighted the relevance of the SDGs as a framework to address these systemic crises [
21,
22,
23].
In the specific context of the SDGs, a series of recent studies have applied bibliometric methods to map the scientific production associated with the 2030 Agenda. These studies have focused primarily on the thematic distribution of scientific output, the impact metrics linked to different goals, and the temporal evolution of publications [
24]. Yamaguchi et al. [
25] exclusively analyzed bibliometric review studies on the SDGs and presented results that challenge prior bibliometric analyses. Their findings demonstrated that research on the SDGs cannot yet be considered a consolidated field, as many goals remain unexplored.
Regarding SDG 3, Sweileh [
26] was one of the first authors to conduct a bibliometric analysis using Scopus data, highlighting the limited extent of international collaboration in global health research. Other studies focused on specific topics, such as education [
27] and South–South cooperation in the case of Brazil, where SDG 3 emerges as the dominant theme in international partnerships, with stronger connections in South–South relations than in North–South collaboration [
28].
Sianes et al. [
29] is one of the few studies that analyzed over five thousand articles, identifying research topics, authors, and journals, highlighting research opportunities during the 2015–2020 period, including the need for a greater understanding of knowledge production associated with the SDGs in order to further strengthen evidence-based policies capable of supporting the implementation of the 2030 Agenda and the achievement of the Sustainable Development Goals.
Despite advances in the literature, studies that integrate co-authorship network analysis and the spatial distribution of scientific production related to the SDGs remain scarce, particularly those based on large datasets that consider extended time periods and broad geographic representation.
In this regard, the present study offers a relevant baseline for understanding the scientific production on the SDGs, further expanded by the analysis of 49 million publications over eight decades. By scaling the analysis to this volume, this study provides an unprecedented and comprehensive overview of how scientific knowledge and international collaboration on the SDGs manifest in global scientific production.
By building an original dataset based on publications indexed in the Web of Science and applying advanced bibliometric and scientometric methods to map research networks related to the SDGs, especially SDG 3, this study contributes to the empirical foundations necessary for future research on thematic and regional imbalances, funding asymmetries, and international collaboration in sustainability. It also enables comparative analysis with underexplored goals and supports broader efforts to align knowledge production with equitable and context-sensitive development priorities.
The literature also warns of the risks posed by scientific development strategies that disregard epistemic diversity. Otto [
30] contributes to this discussion by arguing that the climate crisis is not only a physical or environmental issue but also a justice crisis, revealed by the response capacities of regions.
There is a major challenge regarding the monitoring methods and implementation of the SDGs [
31]. However, it is also necessary to develop not only indicators and means to monitor the SDGs but also scientific knowledge that can help define, measure, and implement them at the local level. It is equally essential to understand the scientific capacities of regions to address local challenges as part of unified global monitoring frameworks. Our study can support scientific analyses and policy development in this direction and inform broader academic debates on the effective implementation of the SDGs.
3. Materials and Methods
This study applies social network analysis methods that were previously developed [
32,
33,
34,
35,
36] to estimate the distribution and collaboration of scientific knowledge about the SDGs. All data analyzed in this research were obtained exclusively from the Web of Science Core Collection (WoSCC), with the coverage period defined from 1945 to 2023. Our analysis included all citation indexes available in the Web of Science Core Collection: SCI-EXPANDED (1900–present), SSCI (1900–present), AHCI (1975–present), CPCI-S (1990–present), CPCI-SSH (1990–present), BKCI-S (2005–present), BKCI-SSH (2005–present), ESCI (2005–present), CCR-EXPANDED (1985–present), and Index Chemicus (1993–present). The search strategy followed the SDG descriptors dictionary provided by Clarivate (InCites).
The following search string was applied:
SDG = (‘01 No Poverty’ OR ‘02 Zero Hunger’ OR ‘03 Good Health and Well-being’ OR ‘04 Quality Education’ OR ‘05 Gender Equality’ OR ‘06 Clean Water and Sanitation’ OR ‘07 Affordable and Clean Energy’ OR ‘08 Decent Work and Economic Growth’ OR ‘09 Industry Innovation and Infrastructure’ OR ‘10 Reduced Inequality’ OR ‘11 Sustainable Cities and Communities’ OR ‘12 Responsible Consumption and Production’ OR ‘13 Climate Action’ OR ‘14 Life Below Water’ OR ‘15 Life on Land’ OR ‘16 Peace and Justice Strong Institutions’).
This approach ensures both the transparency and the reproducibility of the study, as emphasized in Liu [
37] and Li et al. [
38], which underscore the importance of explicitly detailing data sources and specifying the subsets of the WoSCC employed in bibliometric research.
The exclusive use of the WoSCC was motivated by its adoption of a standardized thesaurus for SDG classification, which allows for the accurate identification and categorization of articles associated with each specific SDG. This feature, unique to the WoSCC among major international databases, was crucial to ensuring methodological consistency throughout the analysis.
First, a general analysis of scientific production related to SDGs 1 to 16 was conducted for the period of 1945–2023. The WoS SDG thesaurus does not include SDG 17 due to its cross-cutting nature, which makes it unavailable for bibliometric retrieval under this classification system. Accordingly, the unsupervised K-means clustering algorithm was applied to group countries/regions based on the density of scientific output associated with these SDGs. Subsequently, the analysis focused on SDG 3 (Health and Well-Being) from 1992 to 2023, using network science to examine global academic collaboration.
Data and Network Analysis
To retrieve articles on the SDGs in the WoS database, we adopted search descriptors. Of almost 85.5 million documents, from 1945 to 2023, which are included in the WoS database, around 49.5 million represent publications about the sixteen SDGs (except for SDG 17, Partnership for the Goals), accounting for 57.89% of the total publications that make up the entire WoS database.
The collaboration networks analyzed in this study are constructed based on scientific articles. Whenever an article in the WoS database involves authors from two distinct countries/regions, an edge is created between these countries/regions, with an initial weight of 1, and the countries/regions are represented as nodes in the graph. If a new article involves the same countries/regions, the weight of the edge is incremented. Additionally, the number of articles produced by each country is preserved in the network through loop edges, which connect a country to itself, with a weight corresponding to its scientific output. Thus, the resulting networks are modeled as weighted graphs with loops.
For a graph G(V,E) of order n, its adjacency matrix A(G) is a square matrix of order n whose entries
are 1 if
i is adjacent to
j, and 0 otherwise [
39]. The degree of a vertex
i can be calculated from the sum of the corresponding entries in the adjacency matrix:
For weighted graphs, we use a weight matrix W
(G), where the entries
represent the weight of the edge
if
i is adjacent to
j, and 0 otherwise. The weighted degree of a vertex
i, referred to as the strength of vertex
i, is given by
The minimum degree [
40,
41] of a graph G is defined as
. The average degree of a graph [
41] is defined as
.
In this study, we use degree centrality and weighted degree centrality. Degree centrality is defined as , where i is a vertex. Here, a vertex is considered important if it is connected to many other vertices. We can also define the normalized degree centrality as , where Weighted degree centrality is an extension of degree centrality for weighted graphs. Instead of counting only the number of edges incident to a vertex, this metric considers the weights associated with the edges. Thus, it reflects not only the number of connections a vertex has but also the strength or intensity of these connections. The formula is given by where represents the weight of the edge between vertices i and j.
Community detection in the graphs was performed using the Girvan–Newman algorithm (GN), which is efficient in identifying the patterns of scientific collaboration and analyzing asymmetries in knowledge production. The GN algorithm follows four steps: (a) calculate the edge-betweenness centrality
for each edge and (b) remove the edges with the highest
(c) recalculate
for the affected edges; and (d) repeat the process until all edges are removed. Thus,
where
is the total number of the shortest paths between nodes p and q, and
is the number of shortest paths between p and q that pass through the edge e. Consequently, the metric
evaluates how often the edge is present in the shortest paths of the network.
Modularity is a measure that evaluates the quality of a graph’s division into communities, i.e., the effectiveness of the clustering. For a graph
G, the modularity of
G is defined as
where
if vertices
i and
j belong to the same community, and 0 otherwise. Here,
represents the presence of an edge between vertices
i and
j,
and
are the degrees of the vertices, and
m is the total number of edges in the graph. A high value of
Q(
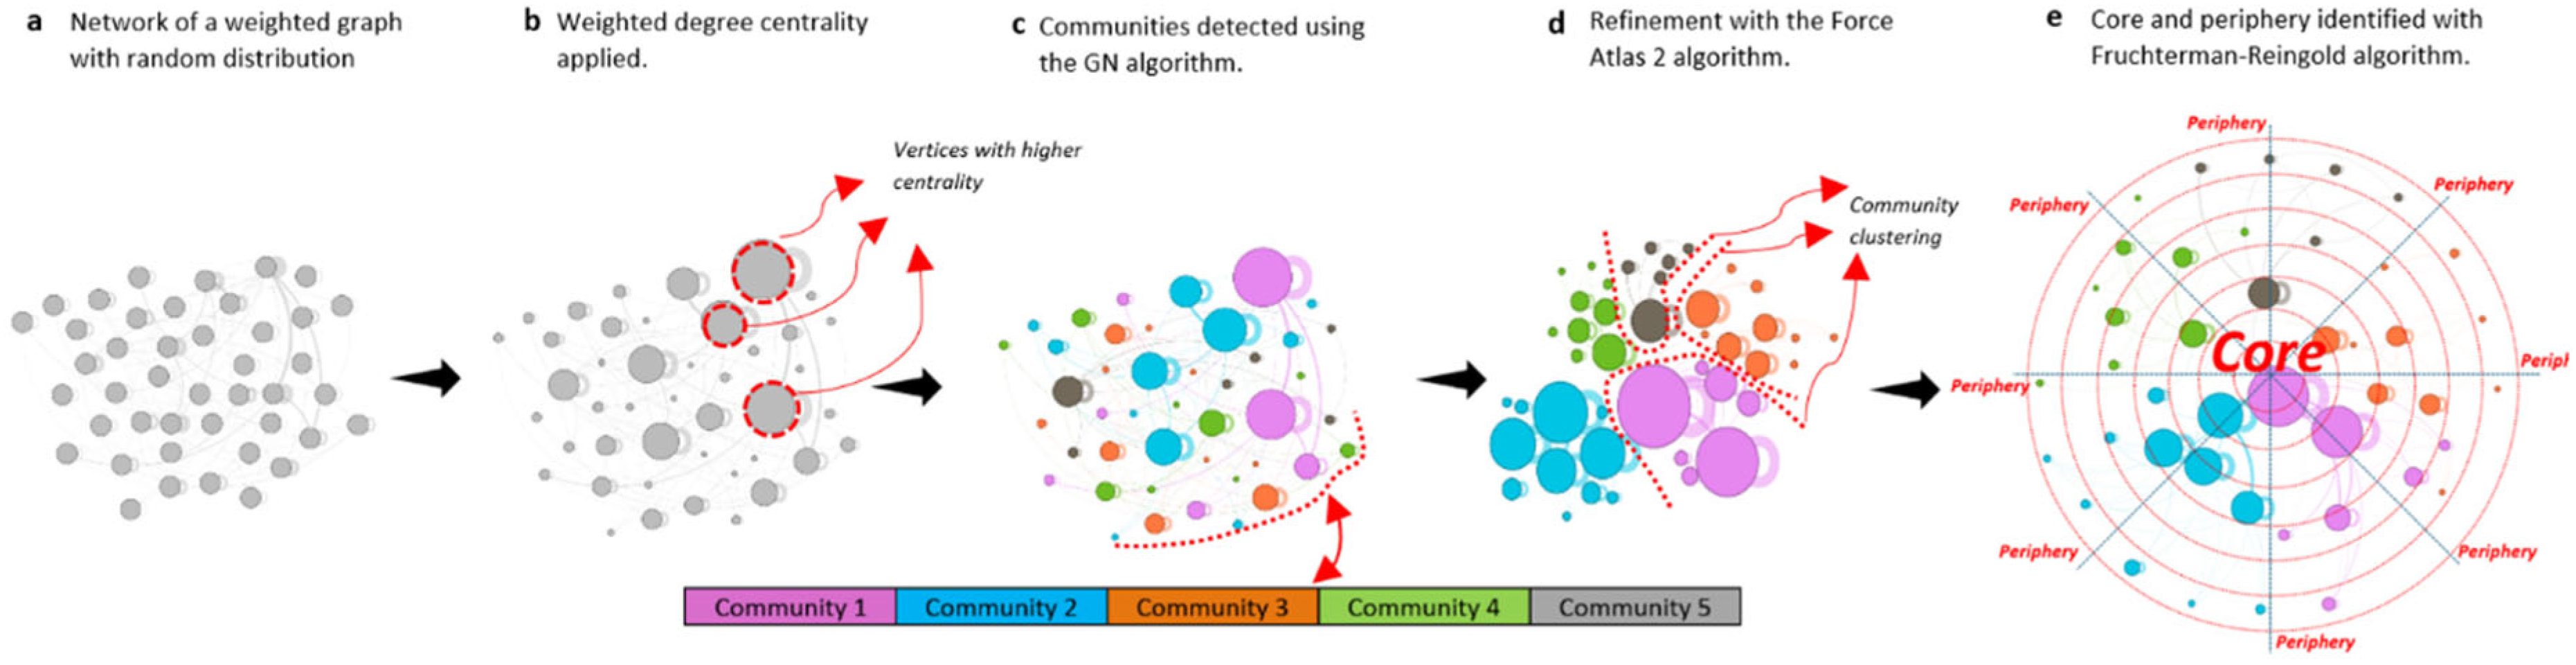
G) indicates a greater density of edges within communities than expected by chance, suggesting effective clustering. For network visualization, the Fruchterman–Reingold algorithm was used, which positions the most influential vertices in the core of the visualization and distributes the others around them based on their importance in the network, forming the periphery. The size of the vertices was determined by their weighted degree centrality, and colors were assigned according to the identified communities, facilitating the interpretation of the clusters [
42,
43].
The analysis of the collaboration network focused on three main metrics: weighted degree centrality, community detection, and network model identification. Weighted degree centrality was used to evaluate the influence of nodes, considering both the number and strength of their connections. Community detection using the GN identified the patterns of scientific collaboration and asymmetries in knowledge production. To avoid distortions in the representation of international collaborations, we assigned a weight of 1 to each co-authorship link between countries/regions per document, including loop edges for single-author publications. Additionally, this study explored the applicability of different network models, including random, small-world, and complex networks, to understand the topological characteristics and evolution of the collaboration networks. Together, these approaches facilitated an understanding of the network structure, revealing colors and peripheries, collaboration patterns, and community dynamics that underpin the production and dissemination of scientific knowledge about the SDGs (
Figure 1).
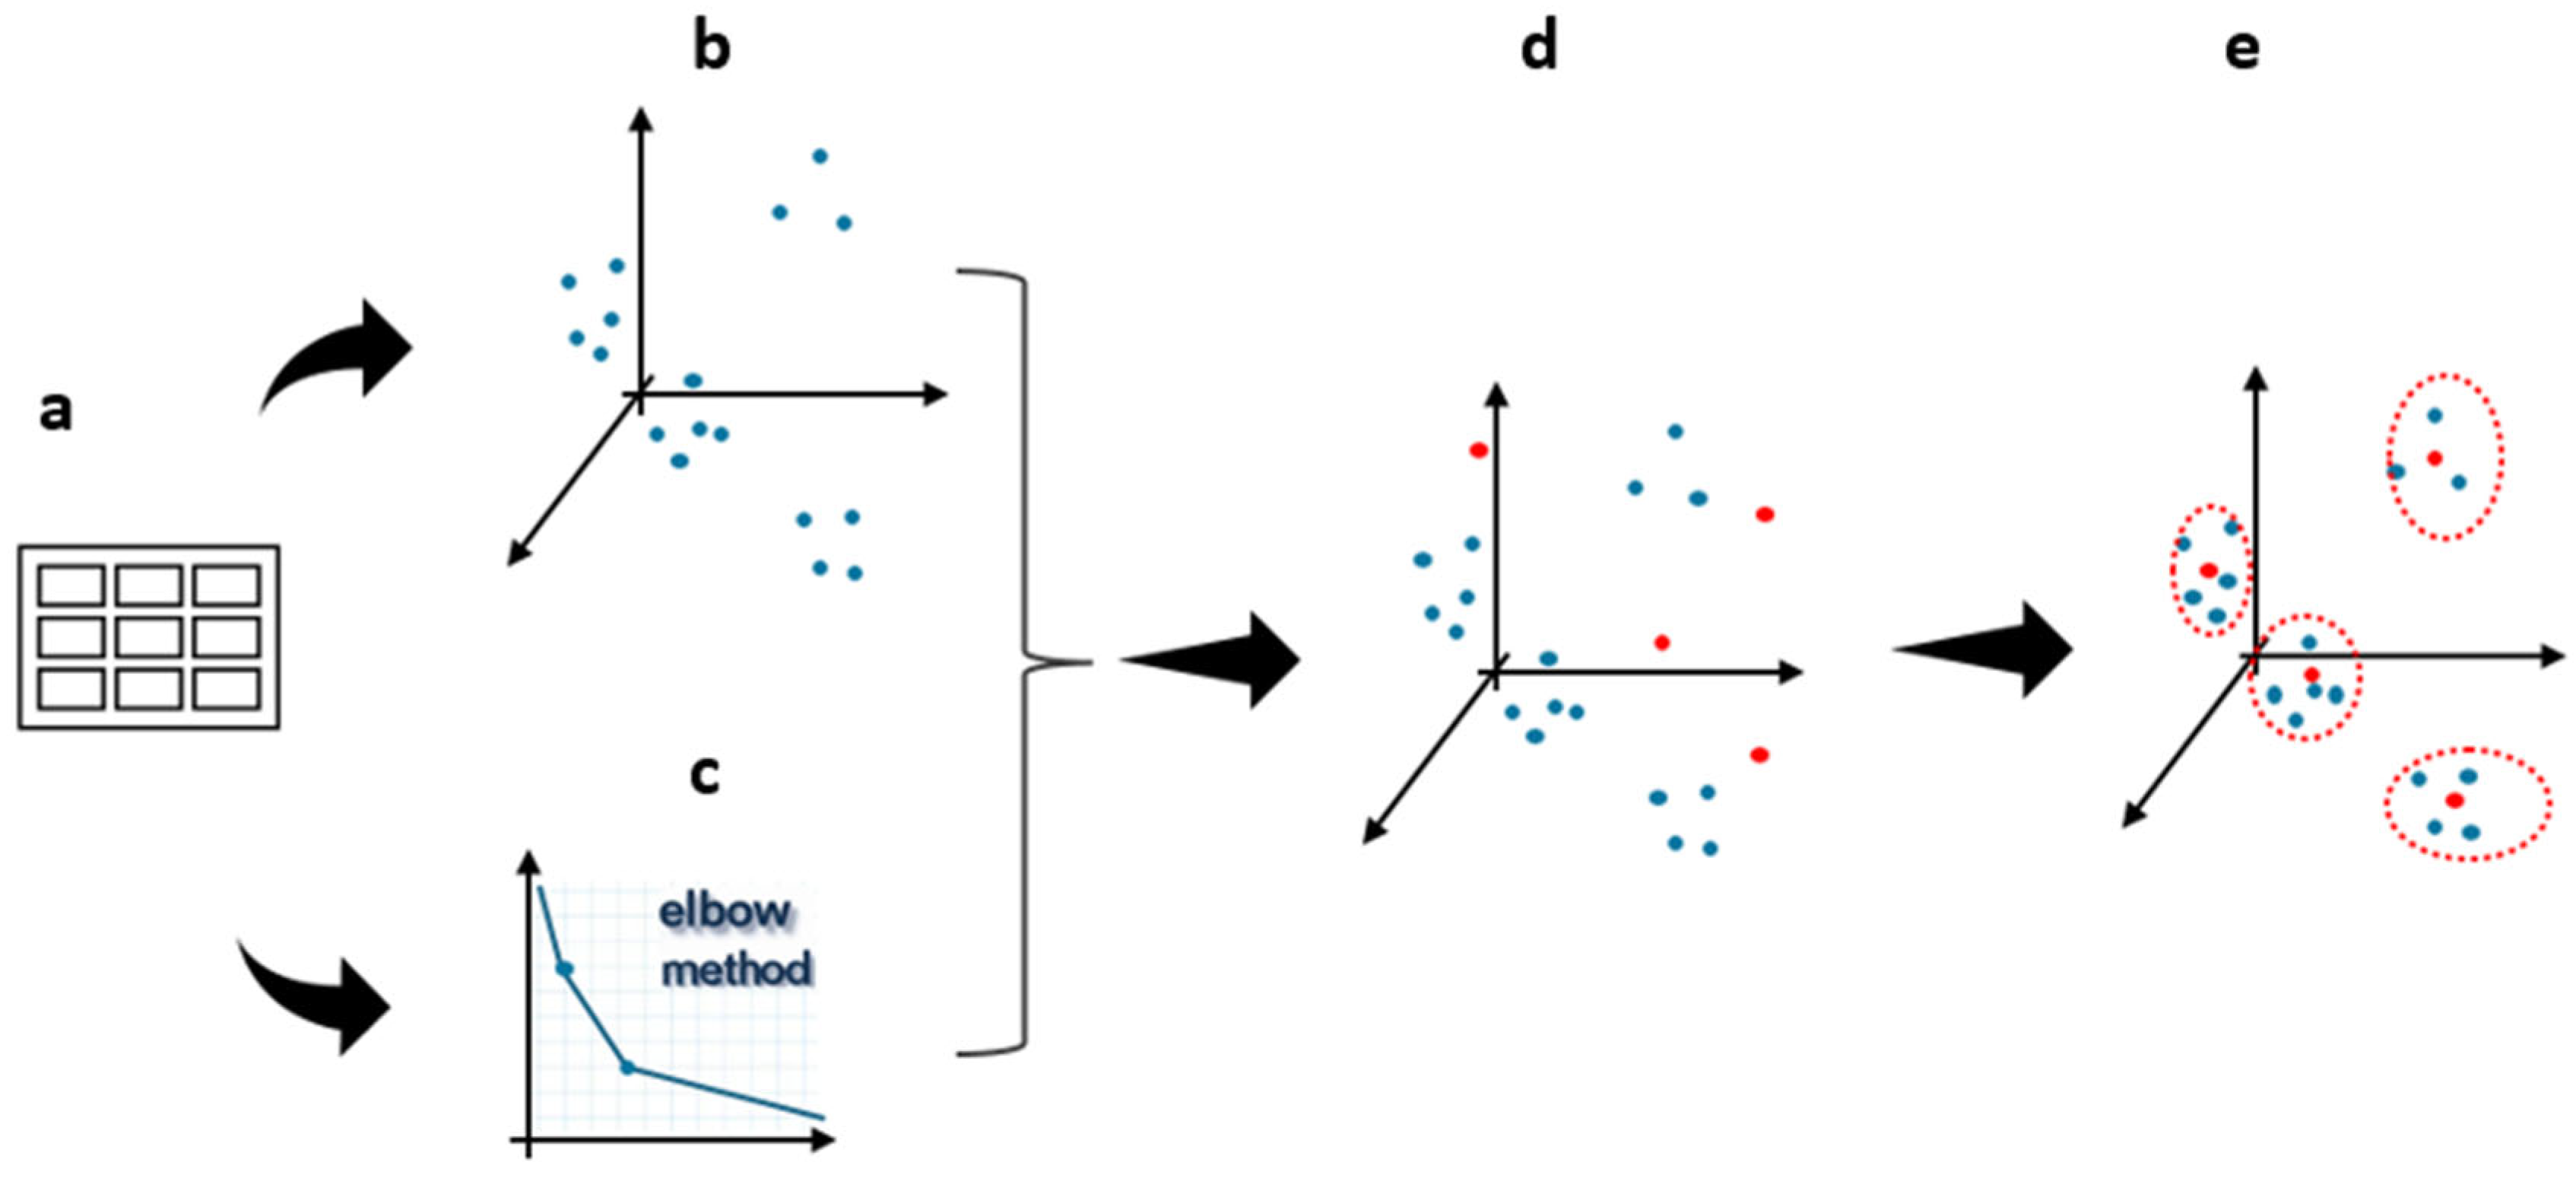
Additionally, the K-means algorithm [
44], an unsupervised learning technique for clustering, was employed to group countries based on the density of scientific production related to the SDGs. The focus here is not on collaboration between countries but rather on the similarities in scientific production for each SDG. The elbow method was used to determine the optimal number of clusters, resulting in four groups of countries based on scientific production related to the SDGs [
45,
46].
After selecting the initial centroids, the algorithm proceeds iteratively in two main steps, as seen in
Figure 2. (i) Cluster assignment: Each country (vector) is assigned to the cluster whose centroid is closest, according to the Euclidean distance. Formally, for each country
, it is assigned to the cluster
whose centroid
minimizes the Euclidean distance
. This step ensures that all countries are grouped based on the similarity of their scientific production [
47]. (ii) Centroid update: After all countries have been assigned to clusters, the centroids are recalculated as the arithmetic mean of the vectors that comprise each cluster. Mathematically, the new centroid
of a cluster
is calculated as
where
is the number of countries in cluster
. This update moves the centroid to a new position that is more representative of the countries currently assigned to the cluster [
48].
After executing K-means, the resulting clusters were validated using hierarchical clustering methods, specifically Agglomerative Clustering, implemented through the Scikit-learn library [
49]. This method constructs a hierarchical tree (dendrogram) that captures similarity relationships among countries, allowing a verification of whether the clusters formed by K-means reflect the underlying hierarchical structure of the data. Cluster evaluation was confirmed when the hierarchical clustering structure showed a strong correspondence with the clusters generated by K-means. This additional validation ensures that the identified groups of countries are stable and reflect significant patterns in scientific production related to the SDGs.
This method was chosen for its broad acceptance in the scientometric literature, computational efficiency, and suitability for analyzing large datasets with continuous variables. K-means also enables the direct algebraic manipulation of clusters, allowing for the verification of intra-group similarity, radius estimation, and sensitivity analysis by iteratively removing elements and recalculating centroids. The optimal number of clusters was determined using the elbow method, and internal validation metrics were employed to confirm the stability of the clustering structure. While the algorithm assumes spherical clusters and equal variance, these limitations were mitigated by complementary tests and comparisons with hierarchical clustering techniques. Overall, K-means provided a robust and interpretable framework for classifying countries according to their scientific contributions to the SDGs. Instead, we constructed an international co-authorship network focused on SDG 3 (Health), represented as a weighted graph in which each edge receives a weight based on the volume of joint health-related publications between countries. We applied weighted centrality measures to identify the most central countries in this global health collaboration network and used the Girvan–Newman algorithm to detect communities or cooperation groups. We then refined the network visualizations using the ForceAtlas2 layout, while the Fruchterman–Reingold algorithm highlighted the core–periphery structure of the graph, facilitating the interpretation of central and peripheral country roles. In parallel, we structured a 16-dimensional vector space in which each country is characterized by its scientific output across the 16 SDGs, determined the optimal number of clusters using the elbow method, and applied the K-means algorithm (with Euclidean distance) to iteratively group countries according to thematic production profiles. These complementary approaches are appropriate for identifying asymmetries and global patterns in SDG-related scientific output (especially for SDG 3—Health) because they enable the discovery of natural groups of collaboration and specialization without imposing predefined categories. Moreover, by relying on well-defined algorithms and parameters, they provide clear and reproducible visualizations of the structure and distribution of international scientific collaboration.
4. Results
SDGs 3 (Good Health and Well-Being) and 13 (Climate Action) stand out with the largest contributions, representing 59.40% and 9% of the total articles, respectively. Next comes SDG 11 (Sustainable Cities and Communities), with 8.52% of publications. SDG 9 (Industry, Innovation, and Infrastructure) represents a total of approximately 2.73%. SDGs 1 (No Poverty), 8 (Decent Work and Economic Growth), 10 (Reduced Inequalities), and 16 (Peace, Justice and Strong Institutions) individually account for a volume of publications that do not exceed six hundred thousand publications for each SDG. In total, these SDGs represent 3.72% of publications.
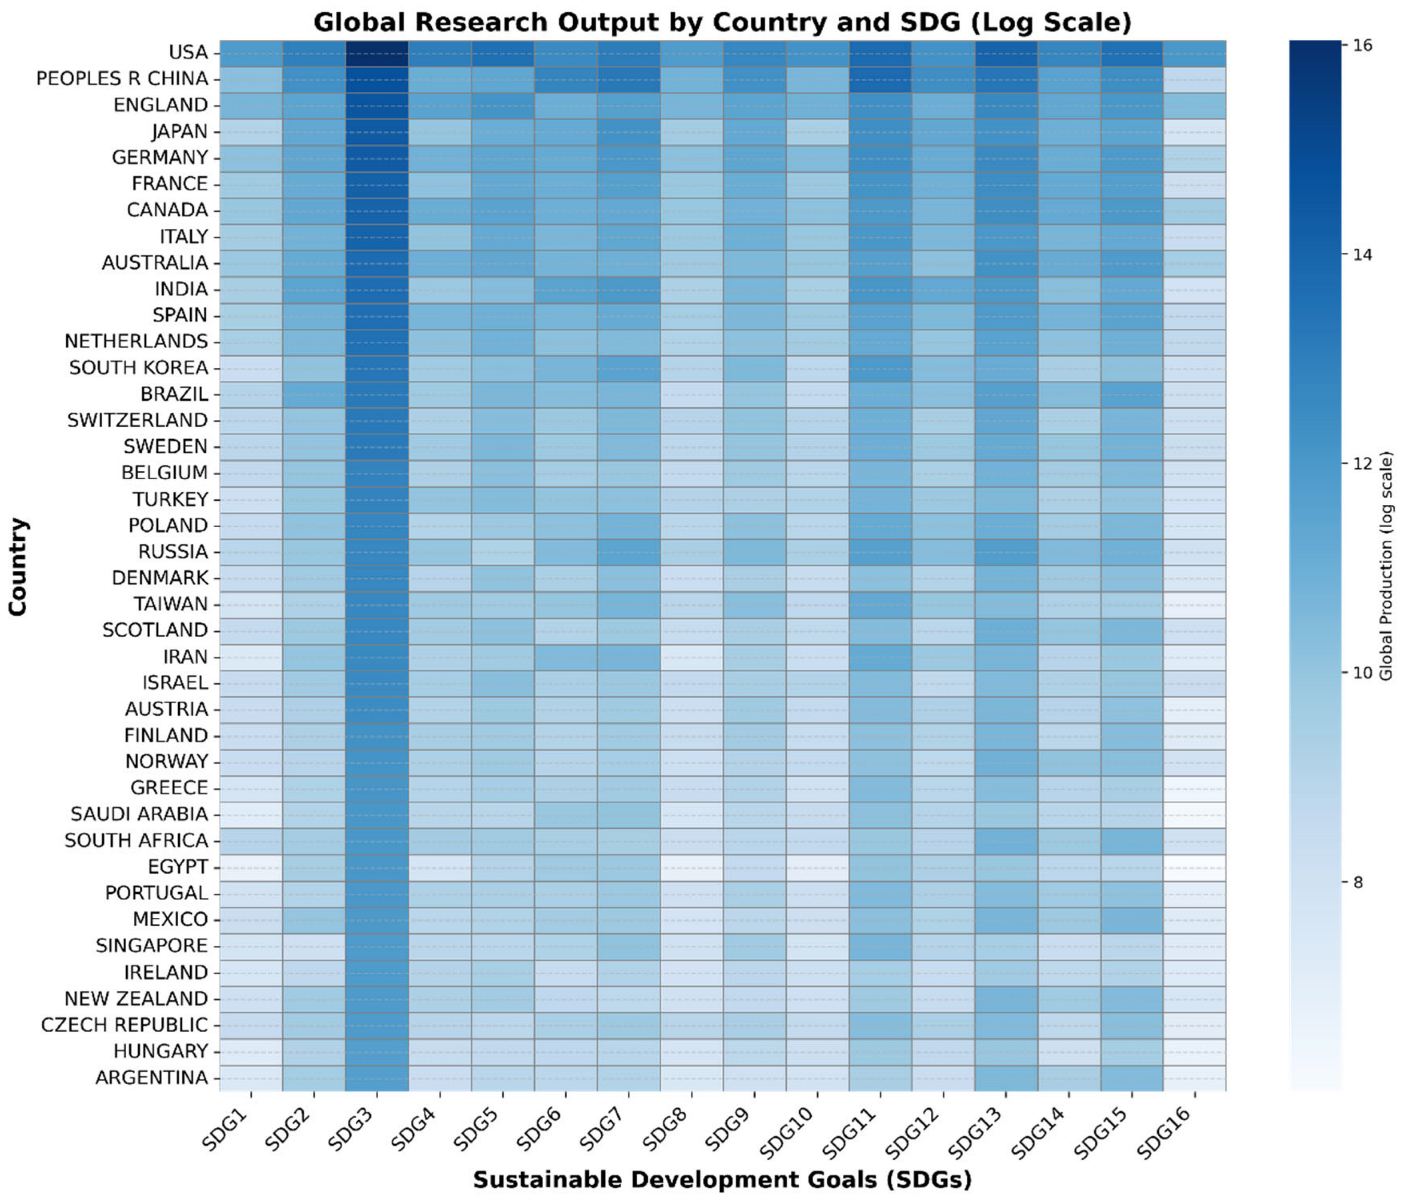
Figure 3 shows the publication density of the main countries and territories for each SDG, following the classification system adopted by the Web of Science Core Collection. It is important to note that some entities, such as “England” and “Taiwan”, are not sovereign countries but are listed as separate entries in the WoSCC. The darker the cell in the matrix corresponding to a given country in a specific SDG, the higher the density of the country/region in that SDG. The United States leads knowledge production in twelve of the sixteen SDGs analyzed, followed by China, which stands out in SDGs 6, 7, 11, and 12. Together, the US and China account for approximately 40% of total scientific publications (
Figure 4), with 29% of publications coming from the US and 11% from China. England, with 6.8%, is the third largest contributor. Countries such as Australia (3.2%), Canada (4.2%), Italy (3.81%), and Spain (2.82%) concentrate their publications mainly on SDGs 13, 14, and 15, while Germany (5.6%), Japan (5.4%), France (4.45%), and India (3.29%) focus on SDGs 6, 7, and 12. Brazil stands out in SDGs 2, 13, 14, and 15, corresponding to 1.91%.
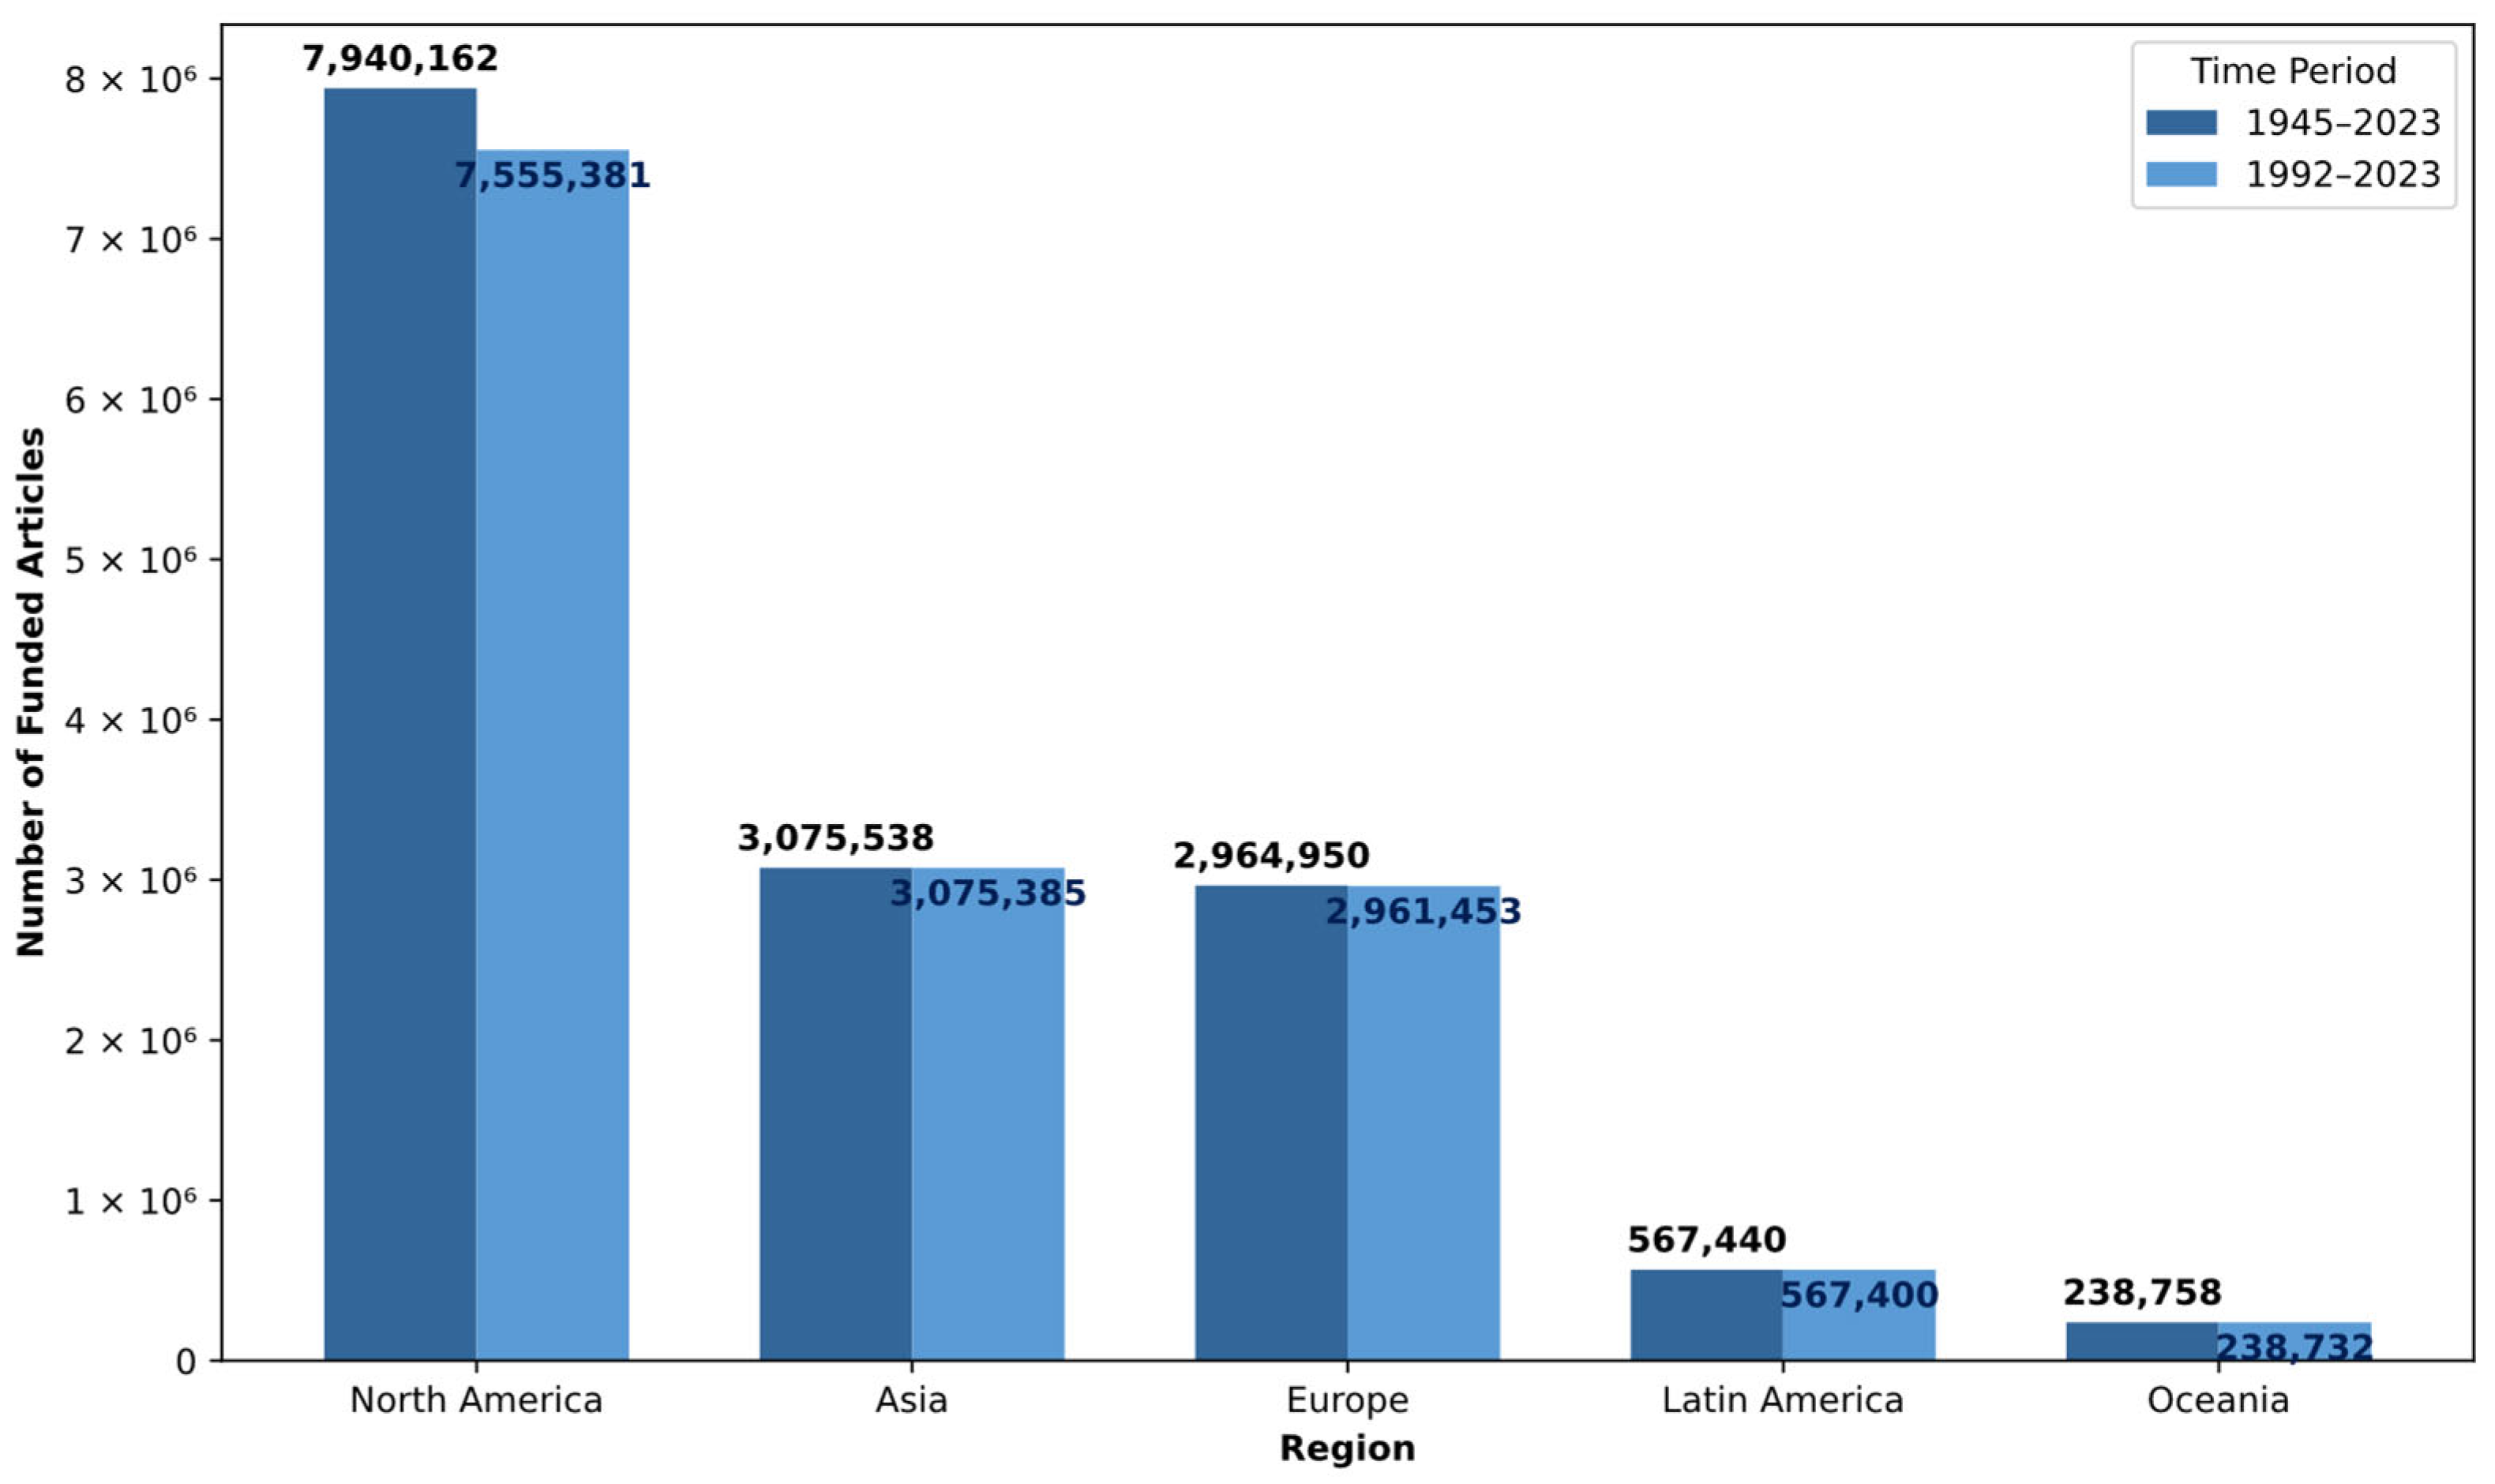
Regarding funding (
Figure 4), there are more than 100,000 funders in more than 30 million published works. The top fifty funders (by number of papers) represent the funding of 17 million published papers. It is mostly public funding, and only one of the selected funding agencies is predominantly private, which is the UK’s Wellcome Trust. Funding is concentrated in North America, Europe, and Asia, covering about 15 million published papers. The United States is the country with the most funders, with 16 of the 50 selected. Next comes China, with eight funders, and the United Kingdom, with four. Then comes Japan with three, the same number as Brazil.
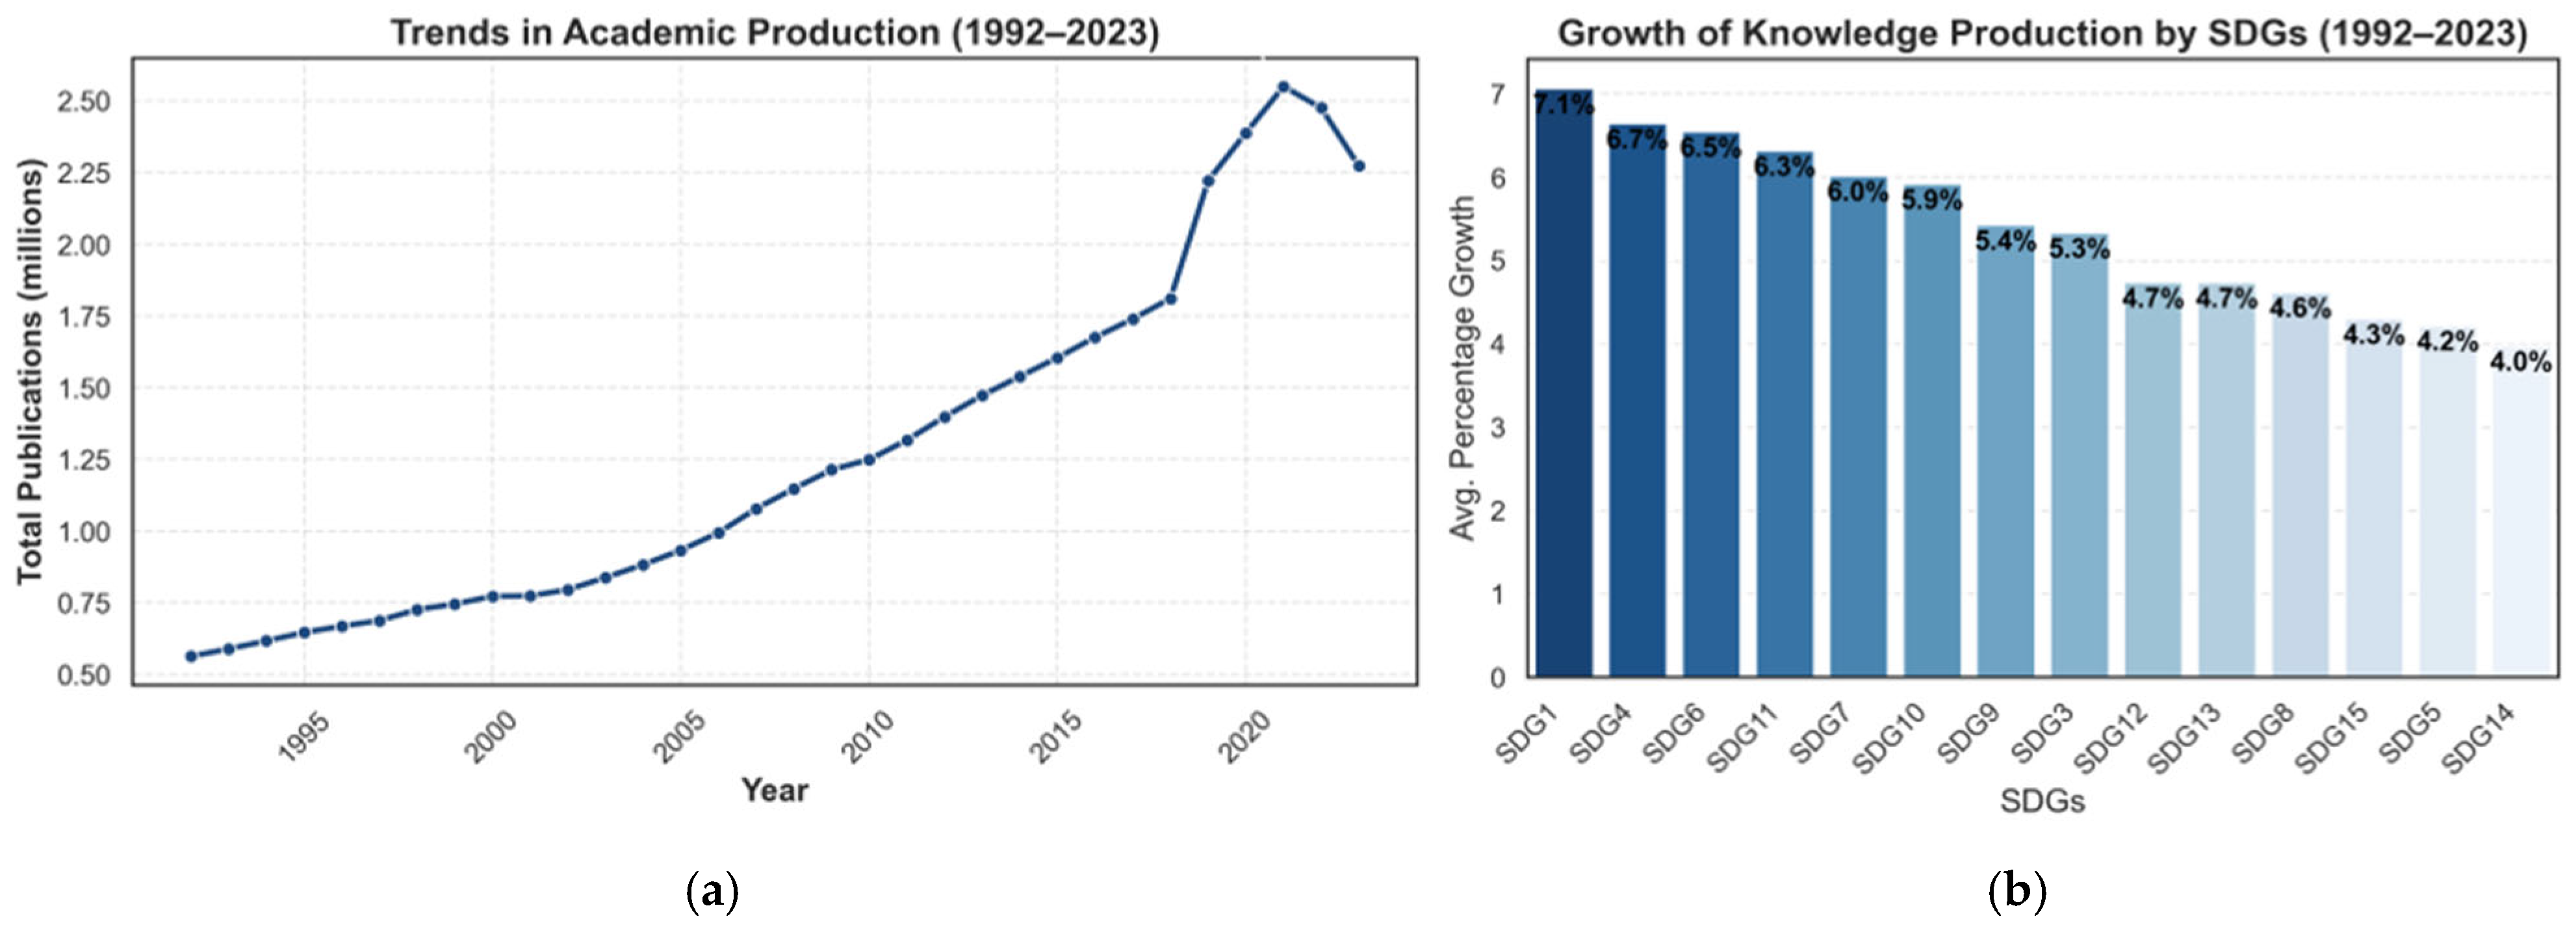
The works published between 1992 and 2023 total more than 40.3 million scientific papers (representing approximately 81.57% of the total).
Figure 5 shows the growth rate of each SDG in the range from 1992 to 2023, revealing an average annual expansion rate between 4% and 7%. Notably, (b) SDG 1—No Poverty—stands out with the highest growth rate, reaching 7.07%. On the other hand, SDG 3—Good Health and Well-Being—presents one of the lowest average growth rates, with 4.30%, surpassing only SDG 15 with 4.22% and SDG 14—Life Below Water—which registers 3.98%. A critical note in (a) indicates an increase in aggregate scientific output related to the SDGs as of 2018.
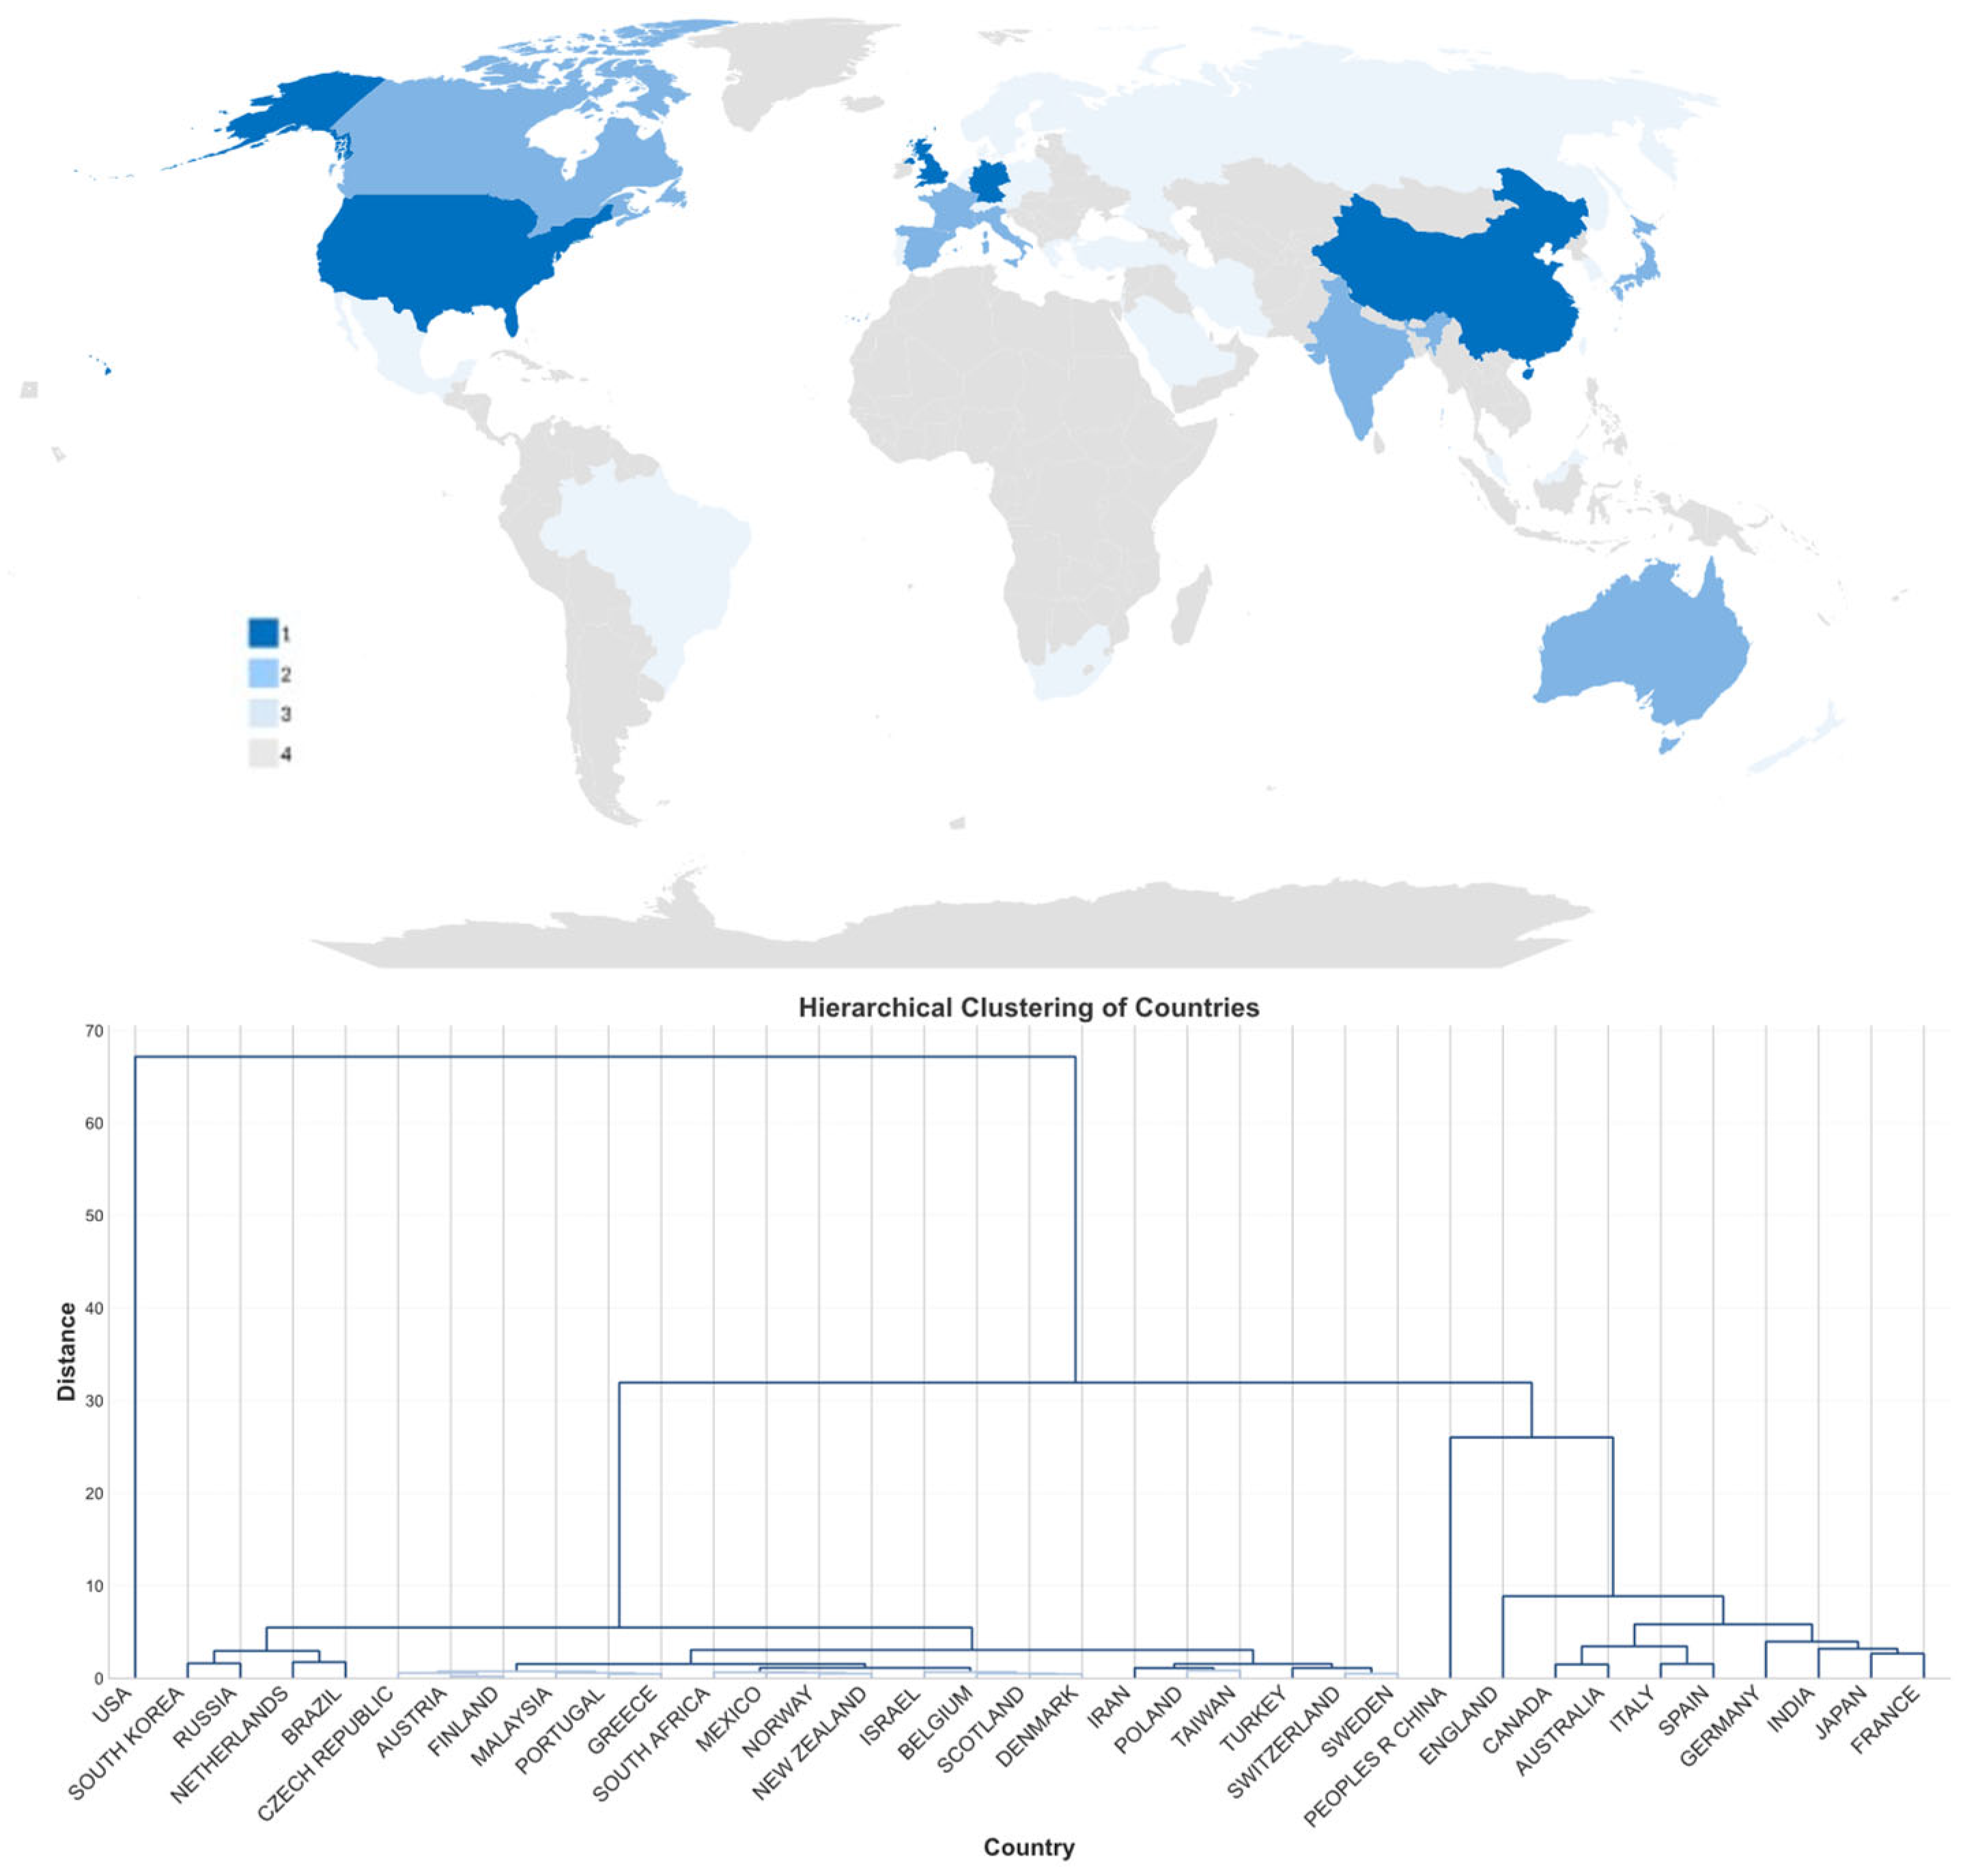
Countries are grouped according to their similarity using the K-means algorithm. In this case, they are sorted into countries with the most publications, countries in between, and countries with the least publications; that is, countries are grouped by publication density similarity. Our sample contains 231 countries or territories, and the elbow method showed four clusters.
Cluster 1 is composed of nations that stand out in the density of scientific knowledge about all the SDGs, including the United States, China, England, and Germany. These four countries/regions are responsible for about 51.65% of the global scientific production on the SDGs. Cluster 2 is composed of Japan, France, Canada, Italy, India, Australia, and Spain, representing 27.29% of global production. Cluster 3, consisting of twenty-five countries, maintains an intermediate density, representing 27.46% of the knowledge about the SDGs. This set includes the Netherlands, Brazil, South Korea, Russia, Switzerland, Sweden, Poland, Turkey, Belgium, Taiwan, Iran, Scotland, Denmark, Israel, Austria, Finland, Norway, South Africa, Mexico, Portugal, Saudi Arabia, Greece, Czech Republic, New Zealand, and Malaysia. Cluster 4 represents the remaining 195 countries and territories and accounts for about 5% of global production (
Figure 6).
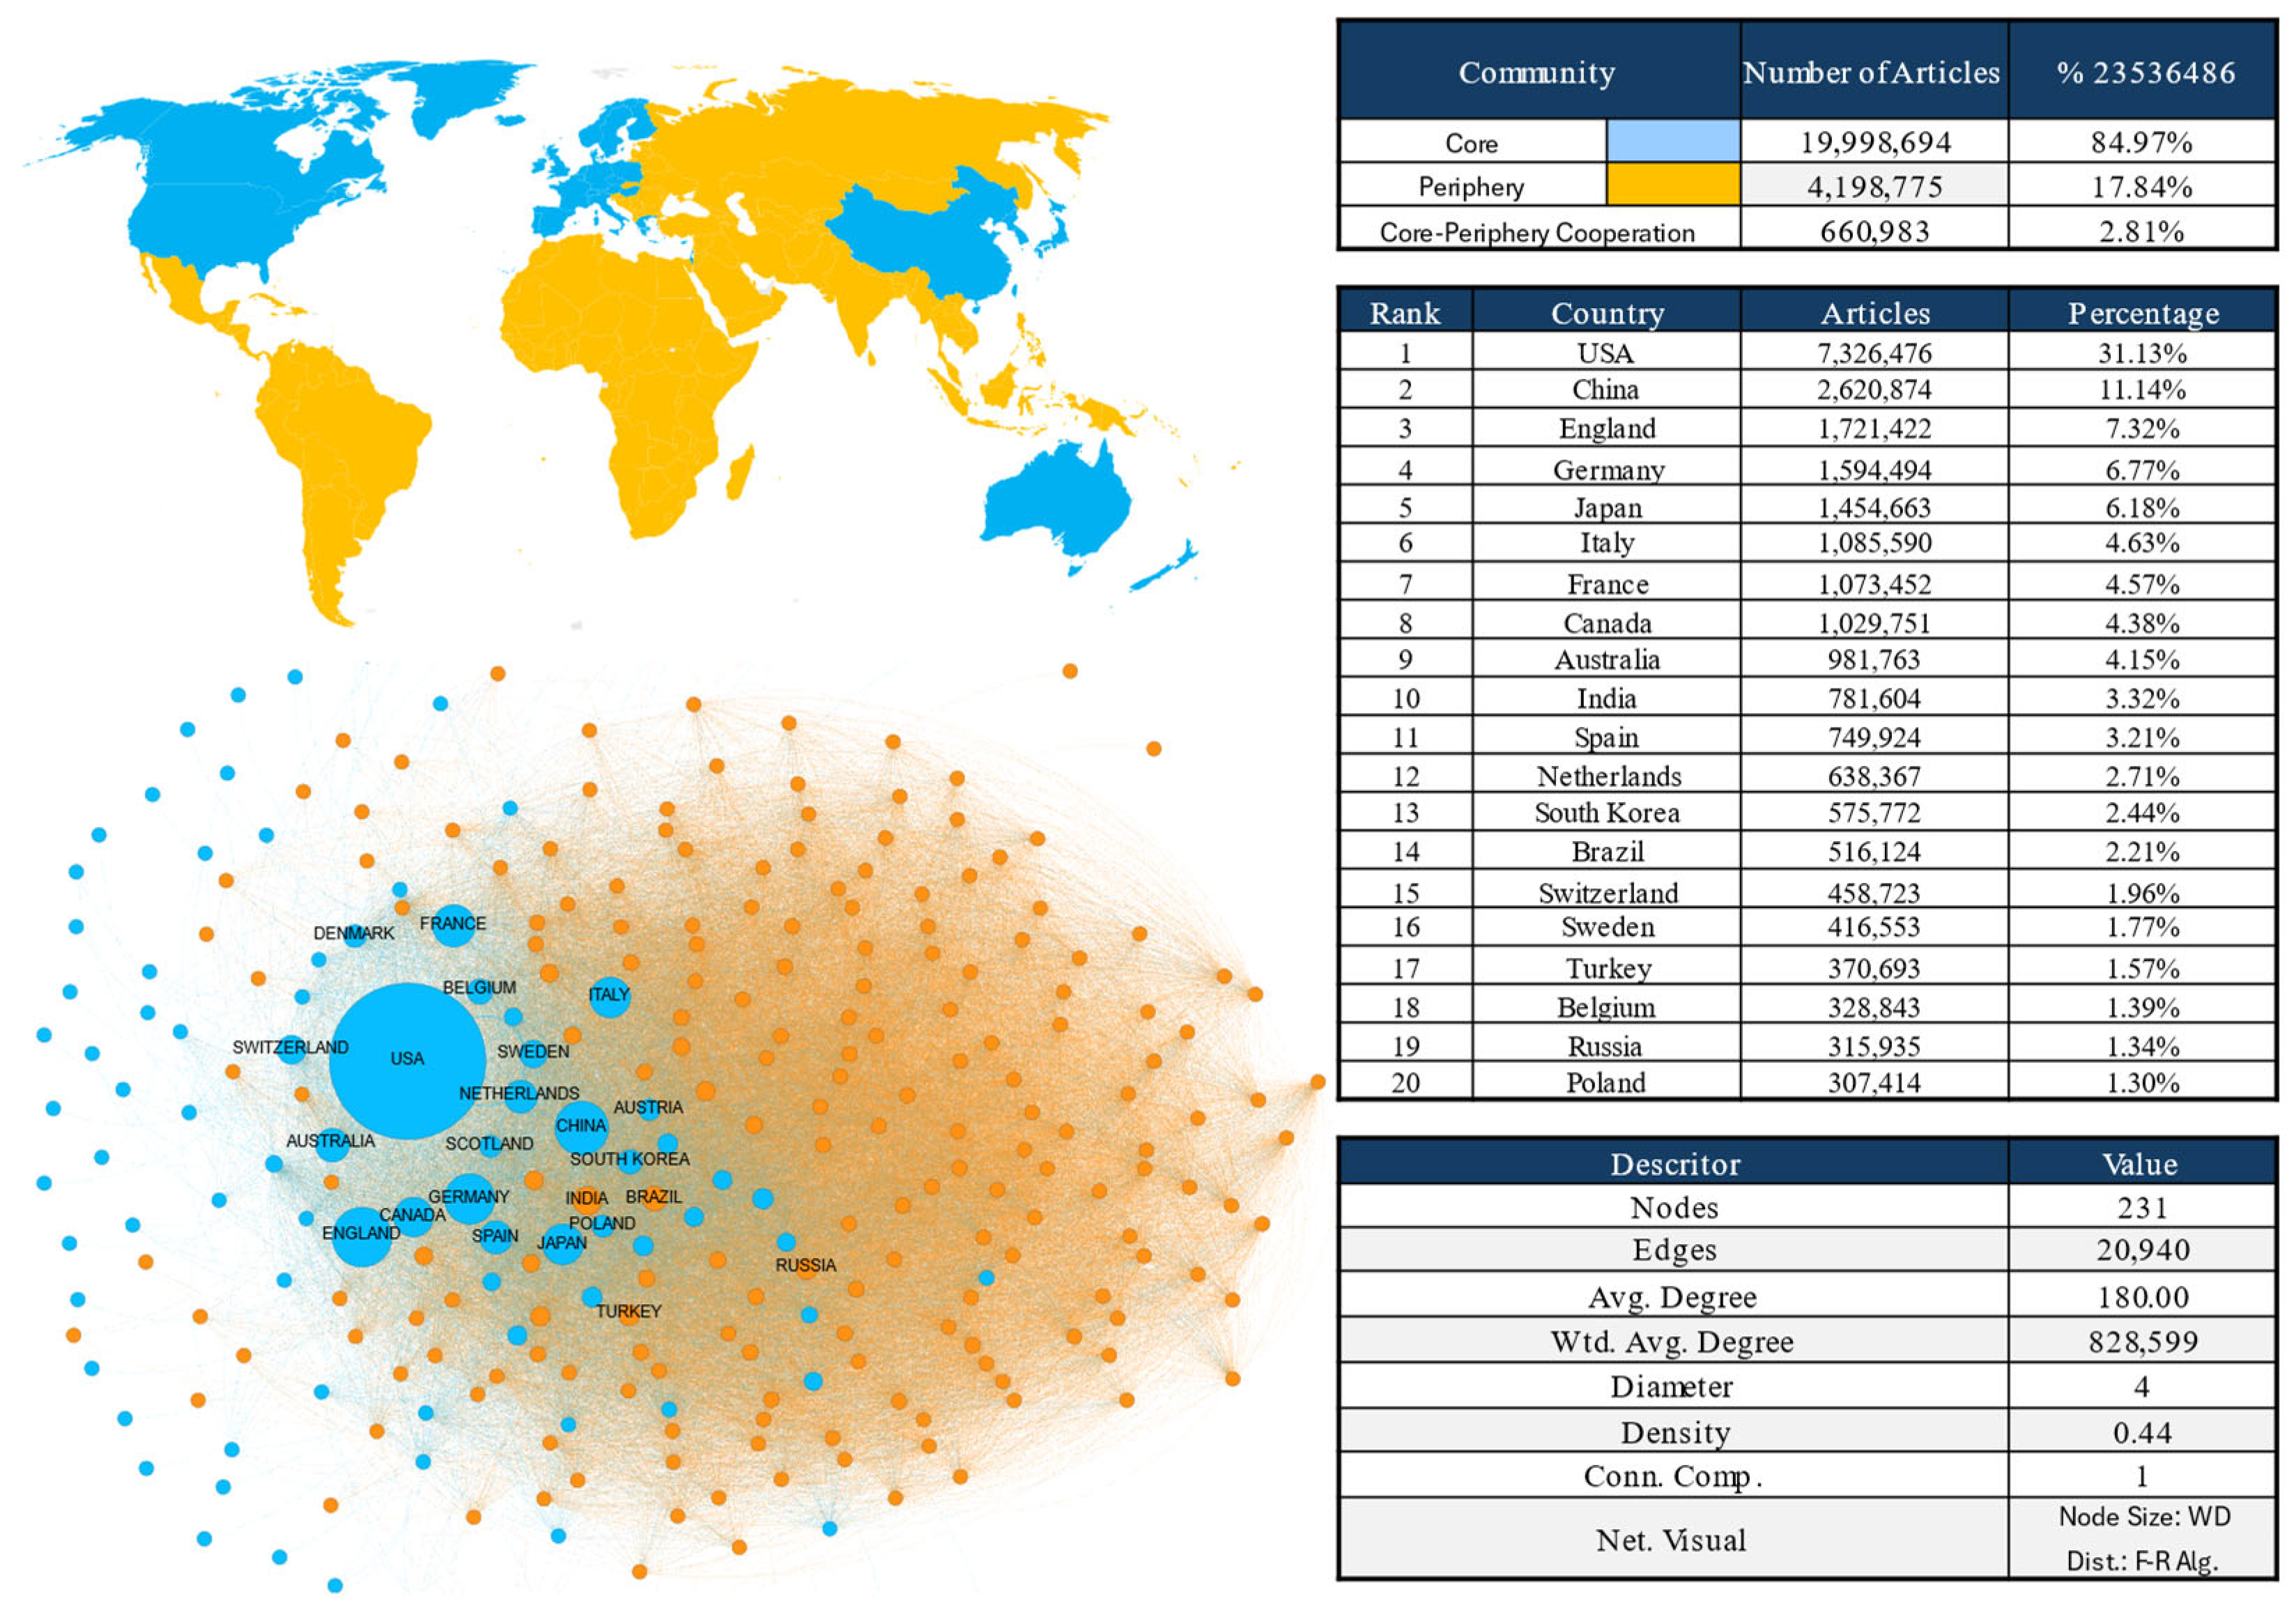
SDG 3 has “Ensure healthy lives and promote well-being for all at all ages” as its central theme and represents more than 23.5 million articles (59%) of the total SDG publications in the database from 1992 to 2023. The cooperation network in SDG 3 is composed of 231 countries that represent the nodes in the network, and the relationships (edges) between them are defined by the number of co-authored publications (
Figure 7). The structure of the cooperation network in SDG 3 is asymmetric, following the power law. This means that the network is characterized by a highly unequal degree distribution, where a few nodes, called hubs, exert disproportionate influence within the knowledge network. These hubs occupy the core of the network, while the other countries are on the periphery. This characteristic is evidenced by the application of the GN algorithm for community detection, which identified only two distinct communities: center (blue) and periphery (orange).
The community at the center of the network included countries such as the United States, Canada, China, Japan, Australia, and member states of the European Union. On the other hand, Brazil, India, Russia, and South Africa stand out as the most influential countries in the peripheral community, which comprises the least number of core countries in the cooperation network. This division of the network into two communities reflects the influence on some key countries, while others occupy a more peripheral position. Only India (3.32%), Brazil (2.19%), Russia (1.34%), and Turkey (1.57%) are among the countries that represent more than 1% of knowledge about SDG 3.
The core community holds 19.9 million articles (84.97%) indexed in SDG 3, while the peripheral community includes almost 4.2 million (17.84%). The sum of the publications of both communities exceeds the total articles by 660,983. This surplus represents articles produced in collaboration between core and peripheral countries, corresponding to 2.81% of the total work on Good Health and Well-Being, showing a modest rate of cooperation between the two spheres.
As for the structure of the collaboration network, the results show the following: (1) An overall density of the network of 0.44, with the periphery showing a density of 0.624 and a weighted degree of 72,372.07 wd, contrasting with the density of the core of 0.230 and a weighted degree of 911,064.86 wd. Smaller production is observed, but the periphery has cooperation, while the center, with its bulky production, exhibits a lower level of cooperation. (2) The diameter of the network is four, with the periphery having a diameter of three and the center of four. This pattern reiterates the previous observation, strengthening the evidence of different modes of interaction within the network. (3) The network exhibits a single connected component, both in the general analysis and in the core–periphery interaction, characterized as a small-world network. This indicates that cooperation tends to occur by similarities and manifests itself in a localized manner. Such dynamics are given by the geographical distribution of the clusters on the map, where regions are predominantly represented by a single color, either blue or orange, denoting the absence of isolated “islands”.
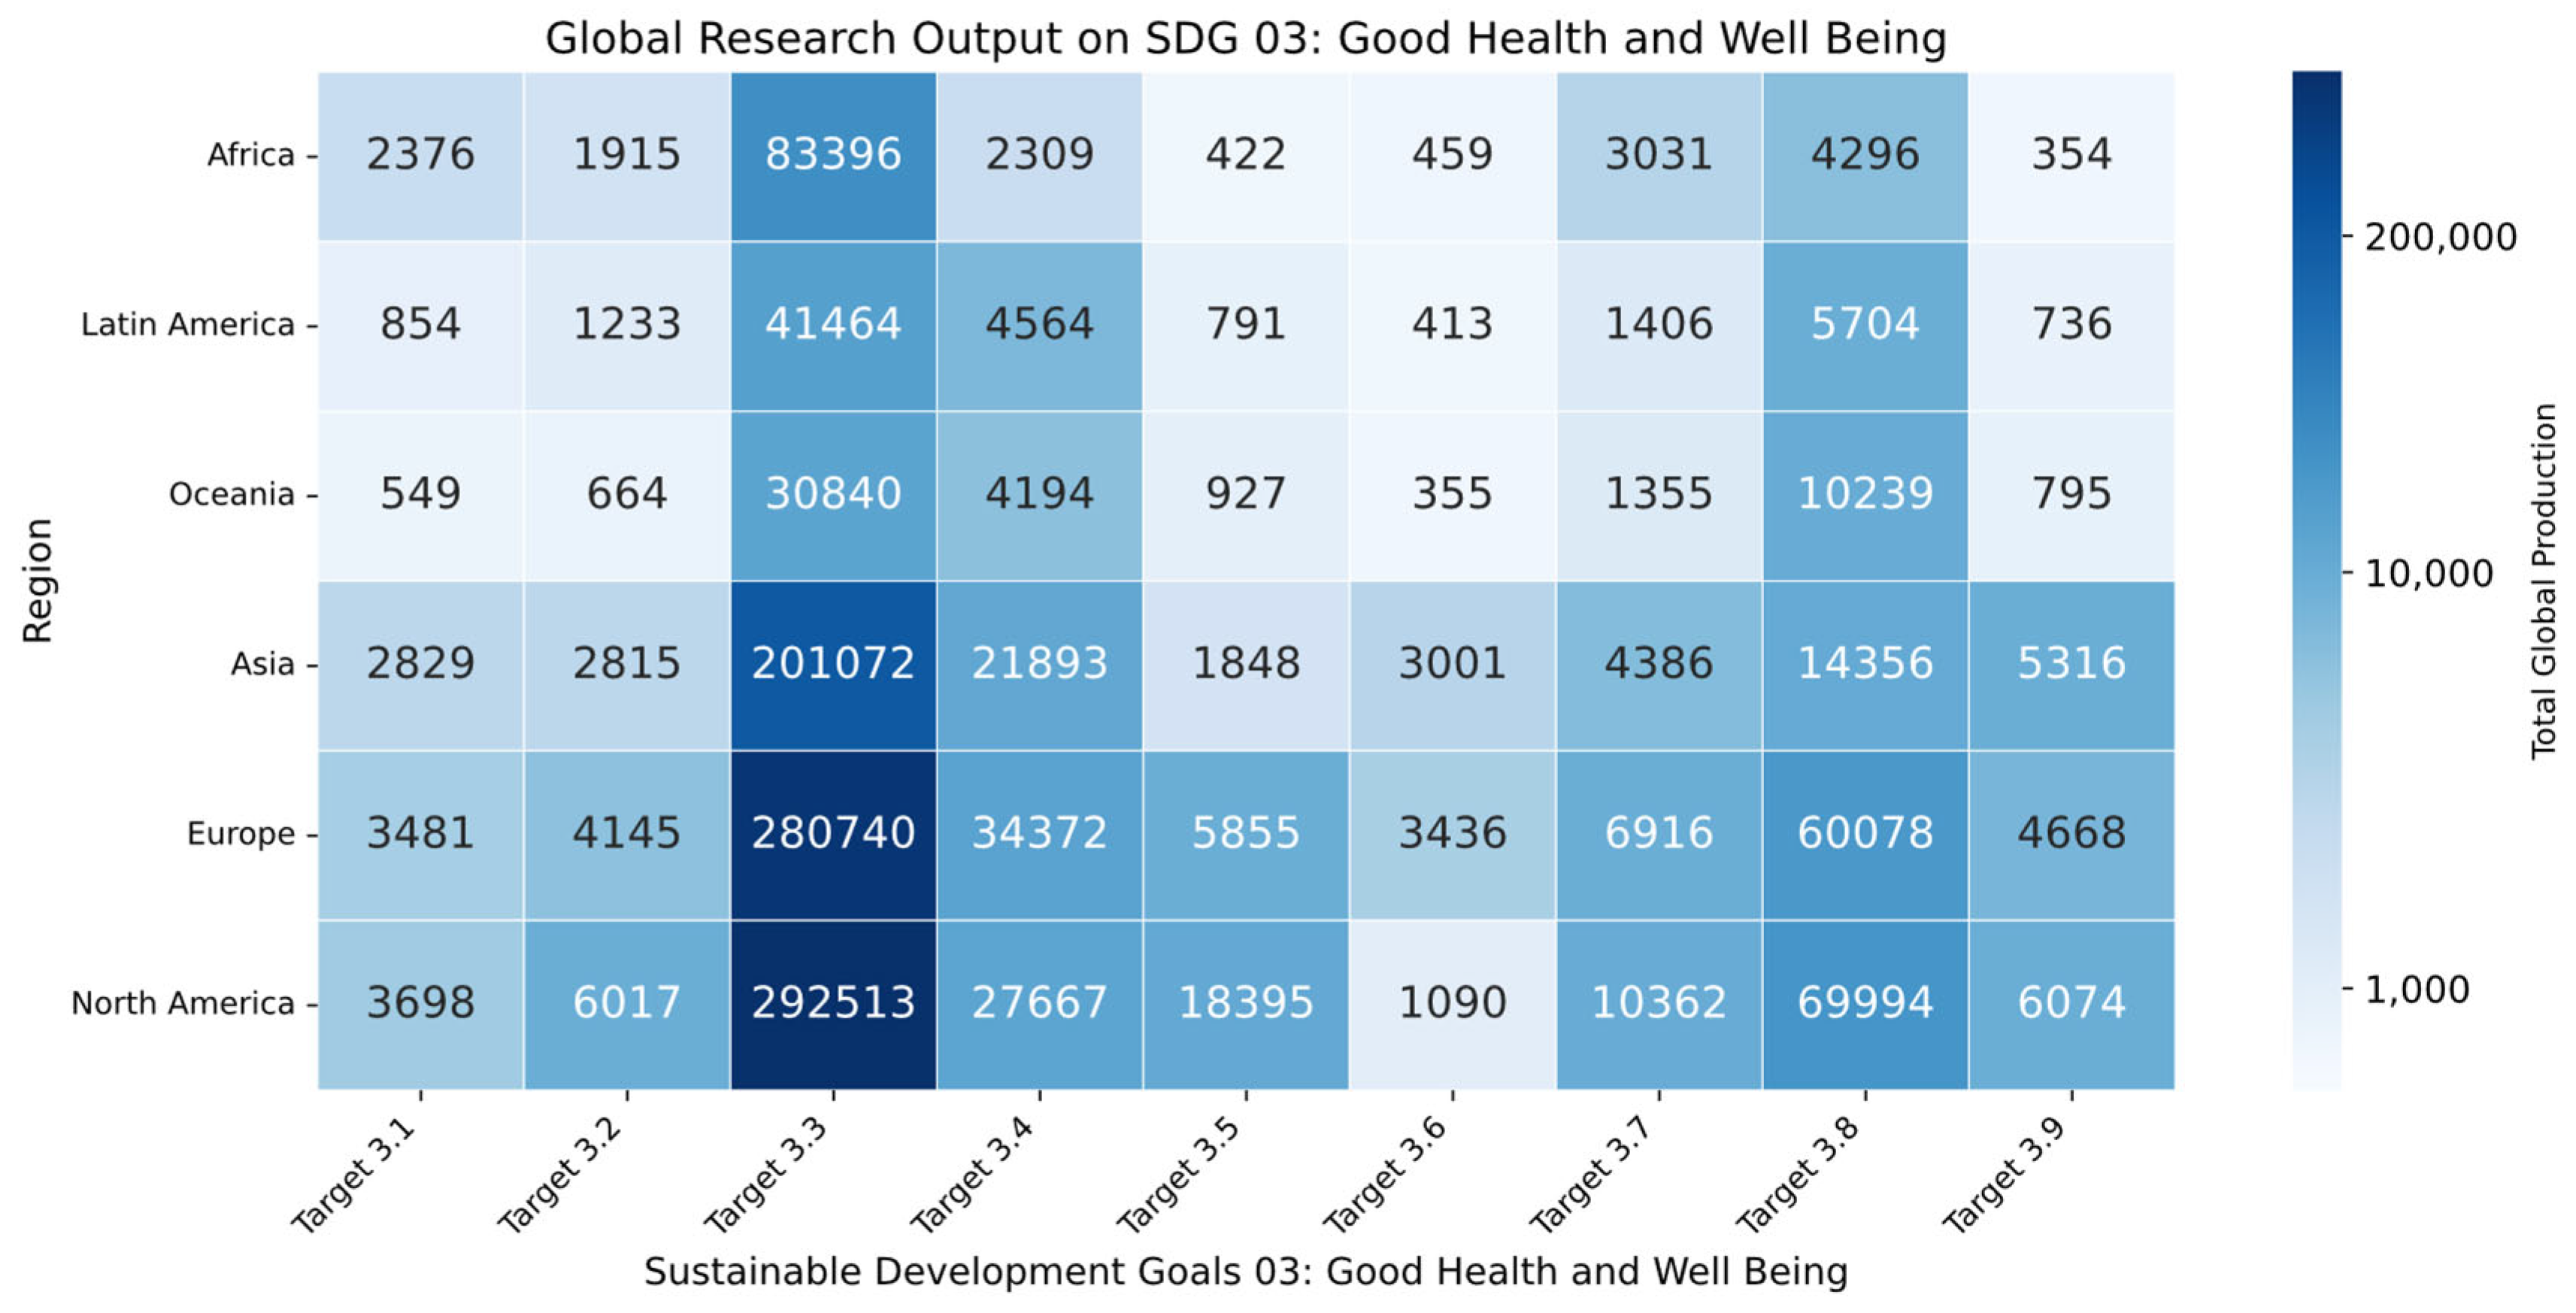
SDG 3 is subdivided into nine specific goals that address different aspects of global health and well-being.
Figure 8 shows that there is a variation in publication density across regions, with some focusing more on certain targets than others. North America and Europe lead in research production on almost all targets. North America shows greater participation in publications on target 3.2, corresponding to 51.31% of the global output on this topic, and 3.5, with a significant 71.25%. Europe stands out in targets 3.3 (49.93%), 3.4 (59.14%), and 3.8 (54.41%). Asia, on the other hand, has significant research production, especially in targets 3.6 (42.13%) and 3.9 (46.17%). Although Oceania contributes less to the total number of publications when compared to other regions, it still shows consistent output across all targets, with a slightly higher emphasis on target 3.8 (7.38%).
In Latin America and Africa, publications are relatively smaller compared to the other continents, but there are still contributions, especially to targets 3.1 and 3.3. Target 3.3 represents 3.6% of the total publications about SDG 3, and target 3.1 represents 0.04%. For example, in targets 3.1 and 3.3, which address the reduction in maternal mortality and the fight against epidemics such as AIDS, tuberculosis, and malaria, peripheral countries such as India, Brazil, and several African nations appear among those that contribute to just over 1% of the global publications. For example, in target 3.1, India (7.35%) and Brazil (3.20%) stand out, along with South Africa (4.58%), Nigeria (4.43%), and Ethiopia (4.28%). However, most publications are still from developed countries, with the US leading with 33.35% of publications. In target 3.3, which aims to eliminate epidemics, there is again a predominance of the USA (36.23%) and England (9.7%). Although Brazil has a significant presence in indicator 3.3.5 on neglected tropical diseases, contributing to 12.26%, it still represents a small fraction of the total publications on this goal.
5. Discussion
We report the results of an analysis of over 49.4 million publications related to the SDGs, revealing that more than 80% were produced between 1992 and 2023. The distribution is markedly uneven: nearly 51% of the publications originated from four countries/regions (the United States, China, England, and Germany), according to clusters identified by the K-means algorithm. In contrast, the group composed of the 195 least productive countries and territories accounts for approximately 5% of the total scientific output on the SDGs, based on the same clustering method.
Our analysis reveals that health is the predominant focus within SDG-related research, accounting for 58.29% of scientific knowledge, followed by climate action (SDG 13) with 8.93%. The findings indicate a highly polarized landscape, with a small group of countries contributing nearly 20 million indexed publications on SDG 3, while others collectively account for only 4.2 million. This disparity extends to international collaboration, with only 2.81% of SDG 3 research resulting from partnerships between the two identified country clusters.
Neglected diseases remain a pressing issue in low-income regions, including Africa [
50] and Latin America [
51]. Although our findings indicate that peripheral countries contribute to knowledge of these diseases, the overall volume of research remains limited. SDG target 3.3, which addresses neglected tropical diseases, accounts for just 3.6% of the total SDG 3 publications, while SDG target 3.1, focused on reducing maternal mortality, represents a mere 0.04%. This gap underscores the persistent challenges in achieving SDG 3.1, as preventable maternal deaths continue to disproportionately affect women in peripheral nations [
52]. In Brazil, challenges in achieving SDG 3.1 persist [
42], compounded by barriers to accessing advanced therapies (SDG 3.4) [
53] and climate-sensitive health crises, such as the impact of heat waves on dengue [
54] outbreaks and Indigenous health vulnerabilities during COVID-19 [
55]. These conditions illustrate the broader issue of health inequities, where socioeconomic and environmental factors exacerbate disparities in disease burden and access to care.
A bibliometric analysis [
56] corroborates our findings, revealing that most Latin American and Caribbean nations—particularly low- and middle-income countries—contribute minimally to global research on poverty-related diseases [
57].
The study by Ma et al. [
58] empirically confirms the segmentation of the world into two development clusters—one specializing in knowledge production and the other with lower research output—aligning with our findings despite using a different methodological approach. While we applied K-means clustering and collaboration networks to analyze scientific publications, their study used an economic complexity framework to define a Country Sustainability Index based on 96 SDG indicators from 2000 to 2022. Both approaches consistently reveal a structural pattern of global disparity in sustainable development specialization.
Amid ongoing and future health and climate crises, low- and middle-income countries will bear the most severe consequences. The unequal distribution of scientific knowledge weakens global preparedness for public health emergencies, contradicting the principles of the 1992 Earth Summit and the 2030 Agenda to “leave no one behind.” Health indicators in many low-income countries have worsened between 2022 and 2023 due to climate-related challenges, including pollution and rising mortality from heat waves. These dynamics create major barriers to achieving the SDGs in Latin America and other vulnerable regions [
59]. The urgent need to address these disparities is underscored by global health reports, including The Lancet—University of Oslo Commission on Global Governance for Health, which highlights governance challenges and structural inequalities that hinder effective responses to health crises. The 2030 Agenda calls for SDG 3 not only to promote good health and well-being but also to reduce systemic inequalities that prevent a coordinated global health response [
60].
To achieve these goals, transformative and interdisciplinary governance is required, integrating inclusive and adaptive approaches to global health policy. Strengthening international research collaboration is essential to ensuring that low- and middle-income countries can actively contribute to scientific knowledge production within the 2030 Agenda’s framework. Studies [
31,
61] emphasize that pluralistic and cooperative governance frameworks are critical for advancing sustainable development [
8]. Likewise, research highlights the importance of knowledge-sharing mechanisms across regions and disciplines, despite the complexity of their implementation [
62].
The COVID-19 pandemic provided a stark example of how knowledge asymmetries exacerbate global health vulnerabilities [
63]. The unequal distribution of vaccines, particularly in Uganda and Sierra Leone [
64], revealed the extent of global health injustices. Similarly, Indigenous populations across Latin America—including in Peru, Bolivia, Colombia, and Ecuador—suffered disproportionately from pandemic-related hardships [
65].
The health sector in Latin America remains marked by structural external dependence. Brazil represents an emblematic case of the scenario of external dependence on medicines, vaccines, and supplies in Latin American countries. The Brazilian Unified Health System (SUS), established under the 1988 Constitution, guarantees free healthcare for its 215 million citizens [
66]. Despite Brazil’s ability to absorb foreign vaccine technologies and mitigate worse outcomes, its reliance on imported pharmaceutical products underscores persistent national health security vulnerabilities [
67]. Strengthening health innovation ecosystems is essential for fostering local production, improving healthcare access, and advancing sustainable development. According to the Health Economic–Industrial Complex (HEIC) approach, health is a tangible solution to contemporary challenges, leading to the formation of a consensus around integrated views of the dimensions of science, technology, and innovation with local production, access to health, and sustainability [
68].
Without dedicated efforts to strengthen the research capacity in developing nations, achieving the SDGs, particularly those related to health, will remain a challenge. Creating equitable funding mechanisms for developing economies is crucial to fostering independent research and enhancing global scientific collaboration.
Given these challenges, our study contributes to the ongoing debate on the intersection of health and climate resilience, emphasizing the urgent need to address systemic asymmetries in global knowledge production. Advancing global health governance depends on strengthening equitable knowledge production, while at the same time, expanding the research capacity in vulnerable regions is essential for shaping more effective and inclusive governance frameworks. Dismantling structural barriers that limit participation in research is a decisive step toward a more resilient and collaborative global scientific landscape.
Limitations
This study has limitations that must be acknowledged. First, while co-authorship networks and publication volume are widely used in bibliometric studies as proxies for knowledge production and scientific collaboration, they may overemphasize quantity at the expense of a qualitative impact. The influence of a research output is often better captured through alternative metrics, such as citation counts, journal impact factors, or evidence of policy uptake, which were not incorporated in this study. Future research could address this gap by integrating such indicators to refine the understanding of global scientific contributions to the SDGs [
69,
70].
Second, the concentration of research funding in the Global North shapes publication patterns by reinforcing national priorities. The fact that 33% of maternal health research originates from the United States reflects the dynamic outlined by Charani et al. [
71], who argue that Northern donors “shape the global health agenda” while directing most of their resources to institutions within their own countries. Consequently, research agendas with stronger financial support in the U.S. tend to be prioritized, even when addressing globally shared challenges. This outcome does not stem from methodological bias but from structural asymmetries: by concentrating funding in Northern institutions, the scientific agenda becomes aligned with their domestic interests. As noted by Charani et al. [
71], this is not due to a lack of technical capacity in low-income countries, as many local laboratories produce high-quality research but remain marginalized in global funding flows. Exposing these imbalances is essential for reframing research policies and fostering greater equity in global health knowledge production.
Another methodological limitation concerns the absence or incompleteness of author affiliation data in the WoS. Liu et al. [
72] demonstrated that from 1900 to 2015, more than 20% of WoS publications do not contain any information in the address field. It is worth noting that most of this absence corresponds to documents published before 1970. Moreover, the impact of this bias has decreased in U.S.-based research since 1998. Savchenko and Kosyakov [
73] complement this analysis by showing that WoS and Scopus retain many records without any country affiliation—the so-called “stateless publications”—whose exclusion may distort indicators of scientific production. These authors suggest a method to reassign such cases to countries and affiliations, which could be implemented in future studies. We acknowledge the regional bias in journal indexation within the Web of Science Core Collection, which disproportionately favors journals from the Global North. Another study has shown that journals from Europe, North America, and other developed regions are significantly more likely to be indexed, while publications from Sub-Saharan Africa and parts of Asia remain underrepresented [
74]. Nevertheless, this limitation does not compromise the results of our study. Since our analysis focuses on aggregated trends in scientific output, the small fraction of records without affiliations is likely to have only a marginal effect on the overall conclusions.
Another limitation concerns the bias in the coverage of funding information. Although the Web of Science database is recognized as the most comprehensive source for funding metadata in scientific publications, as demonstrated by Kokol [
75], who identified the highest proportion of health-related articles with funding data in WoS (29.0%) compared to PubMed (14.6%) and Scopus (7.7%), the representation remains uneven. Known biases in WoS, such as its preference for English-language journals and the greater indexing of research from North America and Europe, can influence the results and limit the generalizability of conclusions regarding the global landscape of research funding. Smirnova and Mayr [
76] found that the full indexing of funding data only began in 2009, and most of the funding metadata appears in English-language publications, with it being rare in other languages. Since our focus is on the general patterns of scientific production and collaboration rather than funding dynamics, the underrepresentation of funding data only has a marginal effect on the conclusions. Moreover, this aspect should be interpreted with caution, as Álvarez-Bornstein et al. [
77] have pointed out limitations in the indexing of funding acknowledgements in the Web of Science Core Collection, particularly regarding the consistency and completeness of the related metadata. In addition, as illustrated in
Figure 4, our results include funded publications from 1945 to 2023, but it is essential to recognize that the systematic indexing of funding information in the WoSCC only began in August 2008, initially restricted to the Science Citation Index Expanded. As noted by Paul-Hus et al. [
78], this limited coverage implies that funding data prior to 2008 are likely incomplete or inconsistently recorded. Consequently, the reliability and comparability of the funding trends across time and regions are stronger from 2008 onward, and interpretations of earlier data should be made with caution.
Finally, the analysis revealed that studies published between 1992 and 2023 totaled more than 40.3 million scientific papers, representing approximately 81.57% of the dataset.
Figure 5 illustrates the growth rate of each SDG over this period, with average annual expansion rates ranging from 4% to 7%. However, the limited number of records available before 1992 reflects structural limitations in the archival coverage of the WoSCC. As demonstrated by Li [
79], systematic gaps in early metadata fields significantly affected the retrieval of the older scientific literature, which limits the historical completeness of bibliometric analyses based on this database. Future studies could benefit from a more detailed investigation of how changes in Web of Science indexing policies and database expansion over time may have influenced the observed bibliometric trends related to the Sustainable Development Goals.


 ,
, 