Article

Moonlit Roads—Spatial and Temporal Patterns of Wildlife–Vehicle Collisions in Serbia

by
Sreten Jevremović
1,*,
Vladan Tubić
2,
Filip Arnaut
1,
Aleksandra Kolarski
1 and
Vladimir A. Srećković
1
1
Institute of Physics Belgrade, University of Belgrade, Pregrevica 118, 11000 Belgrade, Serbia
2
Faculty of Transport and Traffic Engineering, University of Belgrade, Vojvode Stepe 305, 11000 Belgrade, Serbia
*
Author to whom correspondence should be addressed.
Sustainability 2025, 17(14), 6443; https://doi.org/10.3390/su17146443
Submission received: 4 June 2025 / Revised: 2 July 2025 / Accepted: 12 July 2025 / Published: 14 July 2025
(This article belongs to the Special Issue Traffic Safety, Traffic Management, and Sustainable Mobility)

Abstract

Wildlife–vehicle collisions (WVCs) pose a growing threat to road safety and wildlife conservation. This research explores the relationship between the moon phases and the occurrence of nighttime WVCs in Serbia from 2015 to 2023. A total of 2767 nighttime incidents were analyzed to assess whether the full moon is associated with an increased collision frequency. The results revealed a statistically significant rise in the average annual number of WVCs during full moon nights compared to other nights, indicating that increased lunar illumination may affect animal movement and impact collision rates. However, no statistically significant differences were observed when comparing the frequency of WVCs across all four lunar phases. Spatial analysis identified the South Bačka and Podunavlje districts as the most at-risk regions for WVCs during full moon periods. As the first study of its kind in Serbia, this research provides new insights into the spatial and temporal patterns of WVCs. The findings can assist in developing focused mitigation strategies, such as improved signage, speed control strategies, and awareness campaigns, especially in regions with increased risk during full moon nights.

1. Introduction

Wildlife–vehicle collisions (WVCs) provide a considerable challenge to global road safety, resulting in extensive economic losses, injuries, and fatalities. The World Health Organization [1] reports that annually, over 1.2 million fatalities result from road traffic incidents worldwide, a significant portion of which involves wildlife or domestic animals [2,3]. Accidents are more common in areas with dense animal populations or migration path-crossing highways. These occurrences can endanger human lives, damage wildlife populations, and disturb the ecological equilibrium.
The incidence of traffic accidents involving animals correlates with several environmental and temporal parameters, such as the weather conditions, time of day, month, and seasons [4,5,6]. An under-researched yet interesting aspect is the impact of the lunar phases, especially full moons, on WVCs. This issue has only scarcely been addressed in previous years, although the conclusions concerning the dependence of these components remain equivocal. Certain authors have demonstrated a clear increase in the incidence of WVCs during the full moon [7,8,9], whereas others contend that environmental factors, road characteristics, and human behaviors, such as nighttime driving patterns during full moons, may also play roles in this phenomenon [10,11]. These findings emphasize the intricate interplay between natural and human-induced elements in the dynamics of traffic accidents.
Understanding the relationship between the lunar phases and animal-related traffic accidents is not merely an academic curiosity. It has significant ramifications for policy formulation and road safety initiatives. Insights concerning this link might guide the scheduling and implementation of mitigating measures, such as animal crossings, variable message signs (VMSs), and adaptive speed restrictions. Moreover, it may impact emergency response strategies, as well as public awareness initiatives designed to mitigate roadkill and human fatalities.
Nevertheless, despite the potential significance of this subject, it remains little examined in the worldwide literature, particularly within the realm of the transportation safety literature. Hence, the goals of this paper are to examine the differences in the number of WVCs during the lunar phases (specific days), as well as to determine the existence and influence of the full moon on WVCs compared to other days (non-specific days). In this way, a contribution is made to the existing world literature through the presentation and application of another methodological framework for the analysis of WVCs, thereby emphasizing its significance at the national level, as the pioneering work of this type in the Republic of Serbia. Also, this research can serve decision-makers in the process of forming sustainable and adequate policies to prevent the occurrence of WVCs, as well as for identifying specific, high-risk regions where preventive action is needed.

2. Literature Review

Wildlife–vehicle collisions (WVCs) are increasingly being recognized as a significant component of traffic-related risks, with implications for both human safety and wildlife conservation. These events are complex, driven by a combination of environmental, infrastructural, and behavioral factors, and remain an ongoing challenge in transport ecology and sustainable mobility planning.
Traffic accidents are projected to become the seventh leading cause of death globally by 2030, with over 90% attributed to human factors such as distraction, misjudgment, and speeding [12,13]. However, external elements, ranging from the weather and visibility conditions to the road geometry and environmental context, also contribute meaningfully to crash occurrences [14,15]. Among these, collisions with animals represent a distinct category due to their suddenness and the limited response time afforded to drivers. WVCs frequently result from unpredictable animal crossings triggered by light, noise, or habitat fragmentation [16].
Numerous studies have explored the factors that influence the WVC frequency, including the traffic volume [17,18,19], vehicle speed [20], road and roadside characteristics [21,22], and ecological context [23]. Road design and adjacent landscape features, such as fencing and vegetation, can mitigate or aggravate the collision risk depending on the species and behavior [22,23]. These elements interact with temporal variables such as the time of day, the season, and animal migration or breeding periods [24,25], underscoring the dynamic nature of the WVC risk.
More recently, the potential influence of the lunar phases, especially the full moon, on wildlife movement and the collision risk has attracted scientific interest. While some studies report a clear rise in the WVC frequency during full moons [7,8,9], others find no statistically significant link or highlight the influence of confounding factors such as road lighting or driver behavior [26,27,28]. Notably, the increase in nighttime animal movement during full moons may be attributed to the enhanced visibility, either improving predator detection for prey or creating a false sense of safety near roads [8,29].
A comprehensive review by Balčiauskas et al. [30] offers critical context. It emphasizes that WVC research has evolved from simple documentation to the integration of spatial modeling, machine learning, citizen science, and AI-based risk assessments. This evolution reflects the necessity of multi-scalar, interdisciplinary approaches to understanding and managing roadkill, especially as road networks expand. Their work also identifies underreporting, species-specific vulnerability, and a lack of standardized data as persistent limitations in the field. Addressing this, Zou et al. [31] proposed a statistical model that accounts for underreporting in WVC databases, enabling more accurate hotspot detection. This is especially relevant for countries like Serbia, where wildlife reporting remains limited and highly variable across regions.
In addition to statistical and spatial analyses, simulation- and optimization-based approaches have emerged as important tools for traffic accident risk assessment and mitigation. For example, Martolos et al. [32] developed a comprehensive methodology for optimizing wildlife–vehicle collision (WVC) mitigation measures based on the road characteristics, the animal migration potential, and traffic flow parameters such as vehicle gap distributions. This approach enables decision-makers to evaluate the necessity and effectiveness of measures such as fencing and overpasses under varying ecological and traffic conditions. Building on this, recent models have employed traffic conflict techniques within microsimulation frameworks to proactively assess road safety based on surrogate indicators, such as the time-to-collision and post-encroachment time. Such methods allow for the evaluation and ranking of intervention scenarios even in data-sparse or newly developed road environments. The versatility of simulation modeling is further illustrated in smart city contexts, where tools are now being used to simulate accident probabilities involving unmanned ground vehicles (UGVs) [33]. These advances underscore the potential of simulation-based methodologies to extend beyond conventional traffic systems and offer decision support across a variety of emerging transport environments. Incorporating such methods into WVC studies could improve the precision of spatial risk identification and the cost effectiveness of mitigation strategies.
The effects of major societal shifts, such as those during the COVID-19 lockdown, have also been studied as a natural experiment for understanding traffic-related risks. García-Martínez-de-Albéniz et al. [34] found that reduced mobility led to significant declines in WVC rates, particularly on roads with larger traffic volume reductions. Their work confirms the strong influence of human presence and mobility patterns on wildlife movement and accident occurrence. In contrast, the flow rate does not necessarily play a major role in the occurrence of these accidents. The most recent study on this subject was carried out in Texas [35]. The authors examined the timeframe from 2011 to 2020, utilizing around 4.5 million accident reports. The findings indicated a 46% rise in WVCs on full moon nights compared to new moon nights. The authors assert that “brighter moonlight is likely correlated with elevated WVC rates”. This finding indicates that drivers must remain vigilant while driving at night, even when visibility is enhanced by moonlight.
Previous studies on driving behavior provide further insight into the risk dynamics. Chen et al. [36] showed how vehicle trajectory data can be used to detect risky driving behaviors, which could influence WVCs indirectly by shaping nighttime speed patterns or lane positioning. This was confirmed in other similar research [37].
Despite the growing interest, few studies have examined lunar influences on WVCs within Southeastern Europe. While some countries in the region have contributed to this literature, e.g., Slovenia and Croatia [27,28], no comprehensive analysis has yet been conducted in Serbia. This study addresses this gap by exploring the temporal association between the WVC frequency and the moon phases across a multiyear dataset (2015–2023). Moreover, it introduces a spatial risk model using demographic, infrastructural, and environmental indicators to identify collision hotspots during full moons.
Hence, these contributions position this research as the first of its kind in Serbia and a valuable addition to the broader effort to integrate ecological factors into road safety planning. By doing so, it responds to calls in the literature for more context-specific, data-driven studies that inform sustainable and regionally adapted mitigation strategies [25,35].

3. Research Methodology

For the purposes of this paper, a publicly available database of traffic accidents was used, published by the Ministry of Internal Affairs of the Republic of Serbia [38]. Traffic accidents were examined from 2015 to 2023, excluding 2020 owing to significant variations in traffic flows resulting from the COVID-19 pandemic. The total number of road accidents documented for the specified time was 283,564, whilst the incidents involving animals (WVCs) amounted to 5127. This research exclusively investigated 2767 incidents that happened at night.
The comprehensive territory of the Republic of Serbia was examined (Kosovo and Metohija excluded, for which no data was available). This territory was categorized into 25 administrative areas, as per the administrative categorization of the Republic of Serbia: NUTS3—Nomenclature of Territorial Units for Statistics [39].
The methodological procedure applied in this study relied on previous research conducted in Texas [35], with slight modifications and adjustments due to the local conditions and available data.
In this study, three primary analyses were conducted:
  • We conducted a comparative analysis of the total number of WVCs during the several lunar phases: the new moon, first quarter, third quarter, and full moon. Information on the lunar phases, along with moonrise and moonset times, was obtained from Meteogram [40]. The first study hypothesis (H1) posits that a statistically significant difference exists in the number of WVCs observed during the full moon in comparison to the other three studied periods (nights).
  • We conducted a comparative analysis of the yearly average number of WVCs during the full moon and the yearly average number of WVCs during the other days, except for the days of the new moon, first quarter, and third quarter (since these were analyzed through H1). In this way, a small modification of the control groups presented in [41] was made. The goal of this comparison was to determine whether there was a difference in the number of WVCs during the full moon compared to any other period that did not include the previously mentioned specific nights (the second hypothesis (H2)). This covered all the remaining moon phases not analyzed by H1.
  • As an exploratory addition to the main analysis, we examined whether the continuous variables—the percentage of visible moon surface and the duration of daylight—were associated with the number of WVCs. The rationale for this was to test whether gradual changes in the lunar illumination or photoperiod might have influence the collision patterns beyond the categorical moon phase groupings used in the core analysis (the third hypothesis (H3)).

Statistical Assumptions and Model Diagnostics

As stated previously, the dependent variable analyzed was the number of nighttime wildlife–vehicle collisions (WVCs) recorded per night, categorized by moon phase, while the independent variables were the visible moon surface (%), day duration (min), and moon phase defined through four categories: the new moon, first quarter, third quarter, and full moon, based on lunar calendar data. Nighttime was defined as the period between 18:00 and 06:00, based on astronomical twilight data from Meteogram [40]. The final dataset comprised 2767 validated crash events recorded between 2015 and 2023. To better isolate potential full moon effects, an additional binary variable was created for “full moon nights”, defined as the night of the full moon, in line with the ecological and behavioral literature [42,43,44].
Prior to the statistical analysis, the dataset was cleaned to remove incomplete records and temporally duplicated entries. Outliers were not excluded, as all cases represented verified crash occurrences. Descriptive statistics were computed to summarize the central tendencies and dispersion measures across groups. To ensure the robustness of the subsequent analyses, the assumptions of parametric testing were evaluated. The normality of distribution for the dependent variable was assessed using the Shapiro–Wilk test, while Levene’s test was used to verify the homogeneity of variances across the moon phase groups. Where assumptions were met, parametric tests, including independent-sample t-tests, one-way ANOVAs, and repeated-measure ANOVAs, were applied.
All statistical comparisons treated the moon phase categories as independent temporal groups. Although the data are longitudinal in nature, no formal time-series modeling was applied, as the focus was on predefined lunar phases rather than forecasting trends across continuous time. Nonetheless, diagnostic plots, including Q-Q plots and residual histograms, were generated to assess the normality and homoscedasticity of the residuals from the applied parametric models, ensuring the validity of the conclusions.
In order to assess and compare the relative risk of wildlife–vehicle collisions (WVCs) across administrative districts in Serbia during full moon periods, a composite risk index was developed based on three key factors: the population exposure, road network density, and forest area coverage, which were selected as proxies for the human presence, traffic infrastructure, and wildlife habitat availability, respectively. Given the differing scales and potential influence of each indicator, it was necessary to apply an objective method for determining their relative importance in the overall risk calculation.
To achieve this, Principal Component Analysis (PCA) was employed. PCA is a robust statistical technique that reduces dimensionality while preserving the most relevant variance in the dataset, enabling the derivation of empirically based weights for each component. By analyzing the covariance structure among the three selected indicators, the PCA provided a data-driven method for assigning the relative importance to each factor in the spatial risk assessment.
All analyses were conducted using Microsoft Excel, Python (version 3.13.1), and JASP (version 0.19), with statistical significance defined at the conventional threshold of p < 0.05.

4. Results

This section provides a general overview of the analyzed data, as well as the results of the tested hypotheses.

4.1. General Characteristics of the Data

The total number of analyzed WVCs was 5127, of which 4736 (92.4%) resulted in material damage, 387 (7.5%) in injuries, and 4 (0.1%) in fatalities. The number of WVCs that occurred during the night was 2767 (54%).
Figure 1 shows the yearly and monthly trends of WVCs during night. A clear upward trend is visible from 2015 through 2021 (yearly trend), with a peak in 2021 (407 WVCs). While a slight decline is noted in 2022 and 2023, the overall trend indicates a rising burden of nighttime WVCs over time. The significant increase from 2015 to 2016 reflects the improved reporting of WVCs, since 2015 was the year when this metric (variable) was included in the monitoring.
In contrast, the monthly trend analysis indicates that collisions peaked during late autumn and early winter, especially in November (299) and December (273). The lowest numbers occurred in February (152) and January (170). This seasonal pattern can be related to behavioral cycles in wildlife (e.g., mating, migration) and changes in driving conditions (e.g., rainy and snowy seasons).
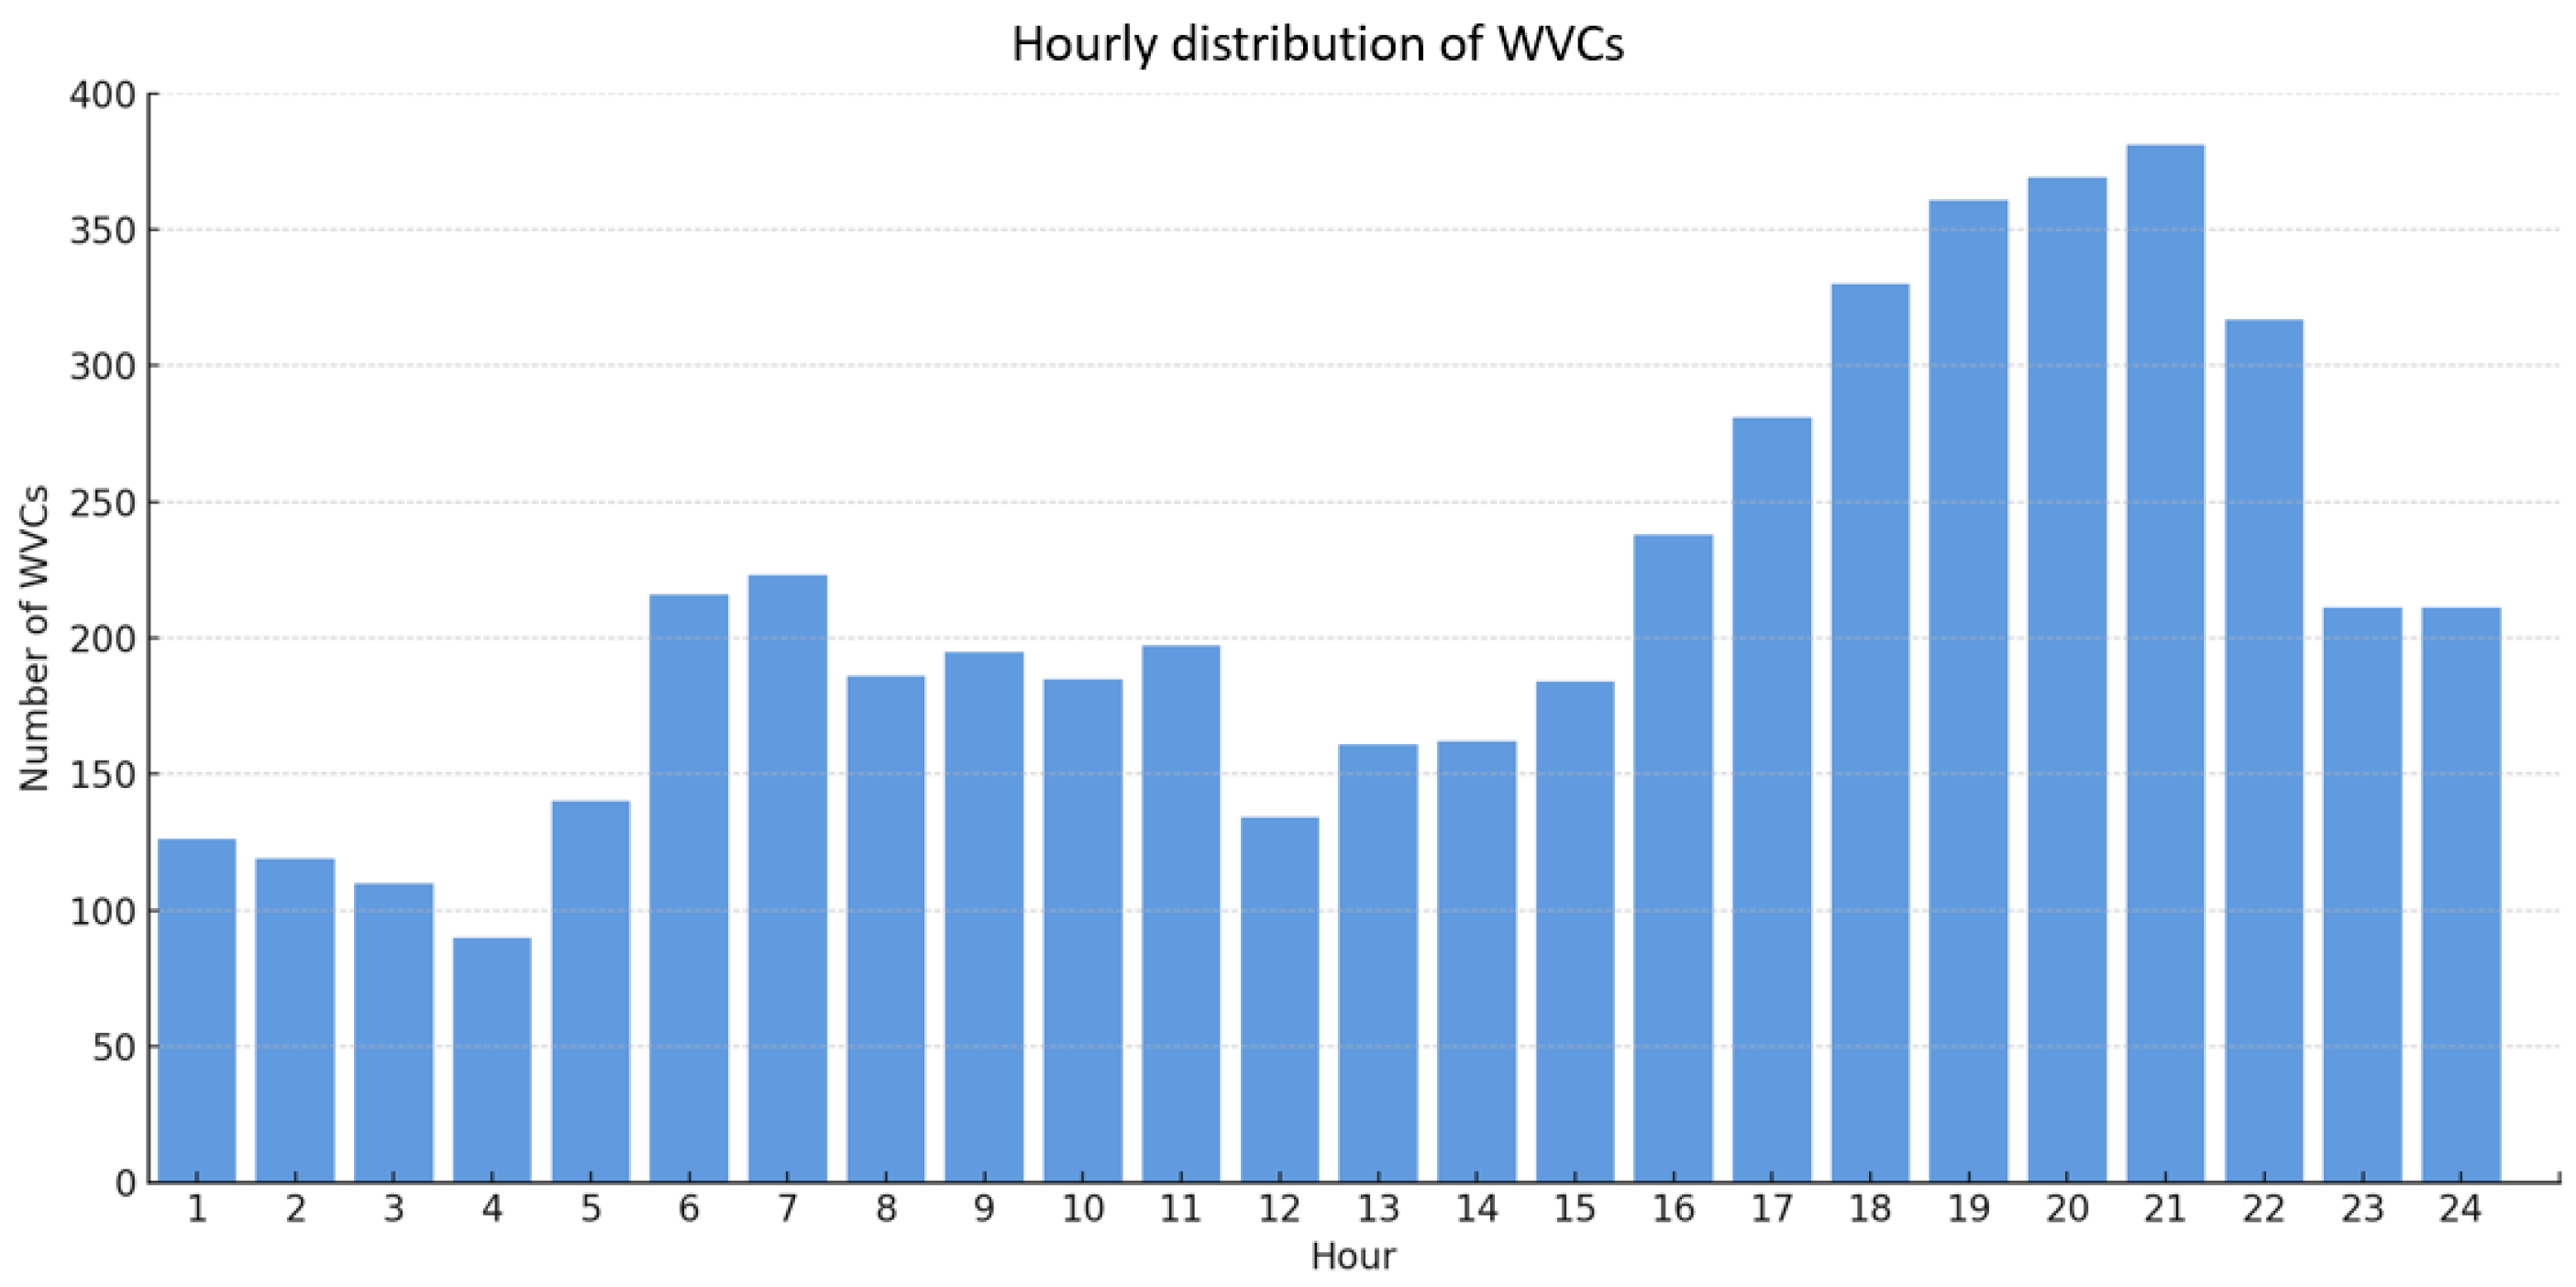
Figure 2 shows the time distribution of WVCs during the day (for the analyzed period), where the ratio of daytime and nighttime WVCs can be seen by hour. Figure 2 shows some characteristic periods, which reflect a higher number of WVCs, mainly in the evening hours when the highest number of WVCs was recorded—381 (9 PM). The lowest number of WVCs occurred at 4 AM and amounted to 90 accidents.
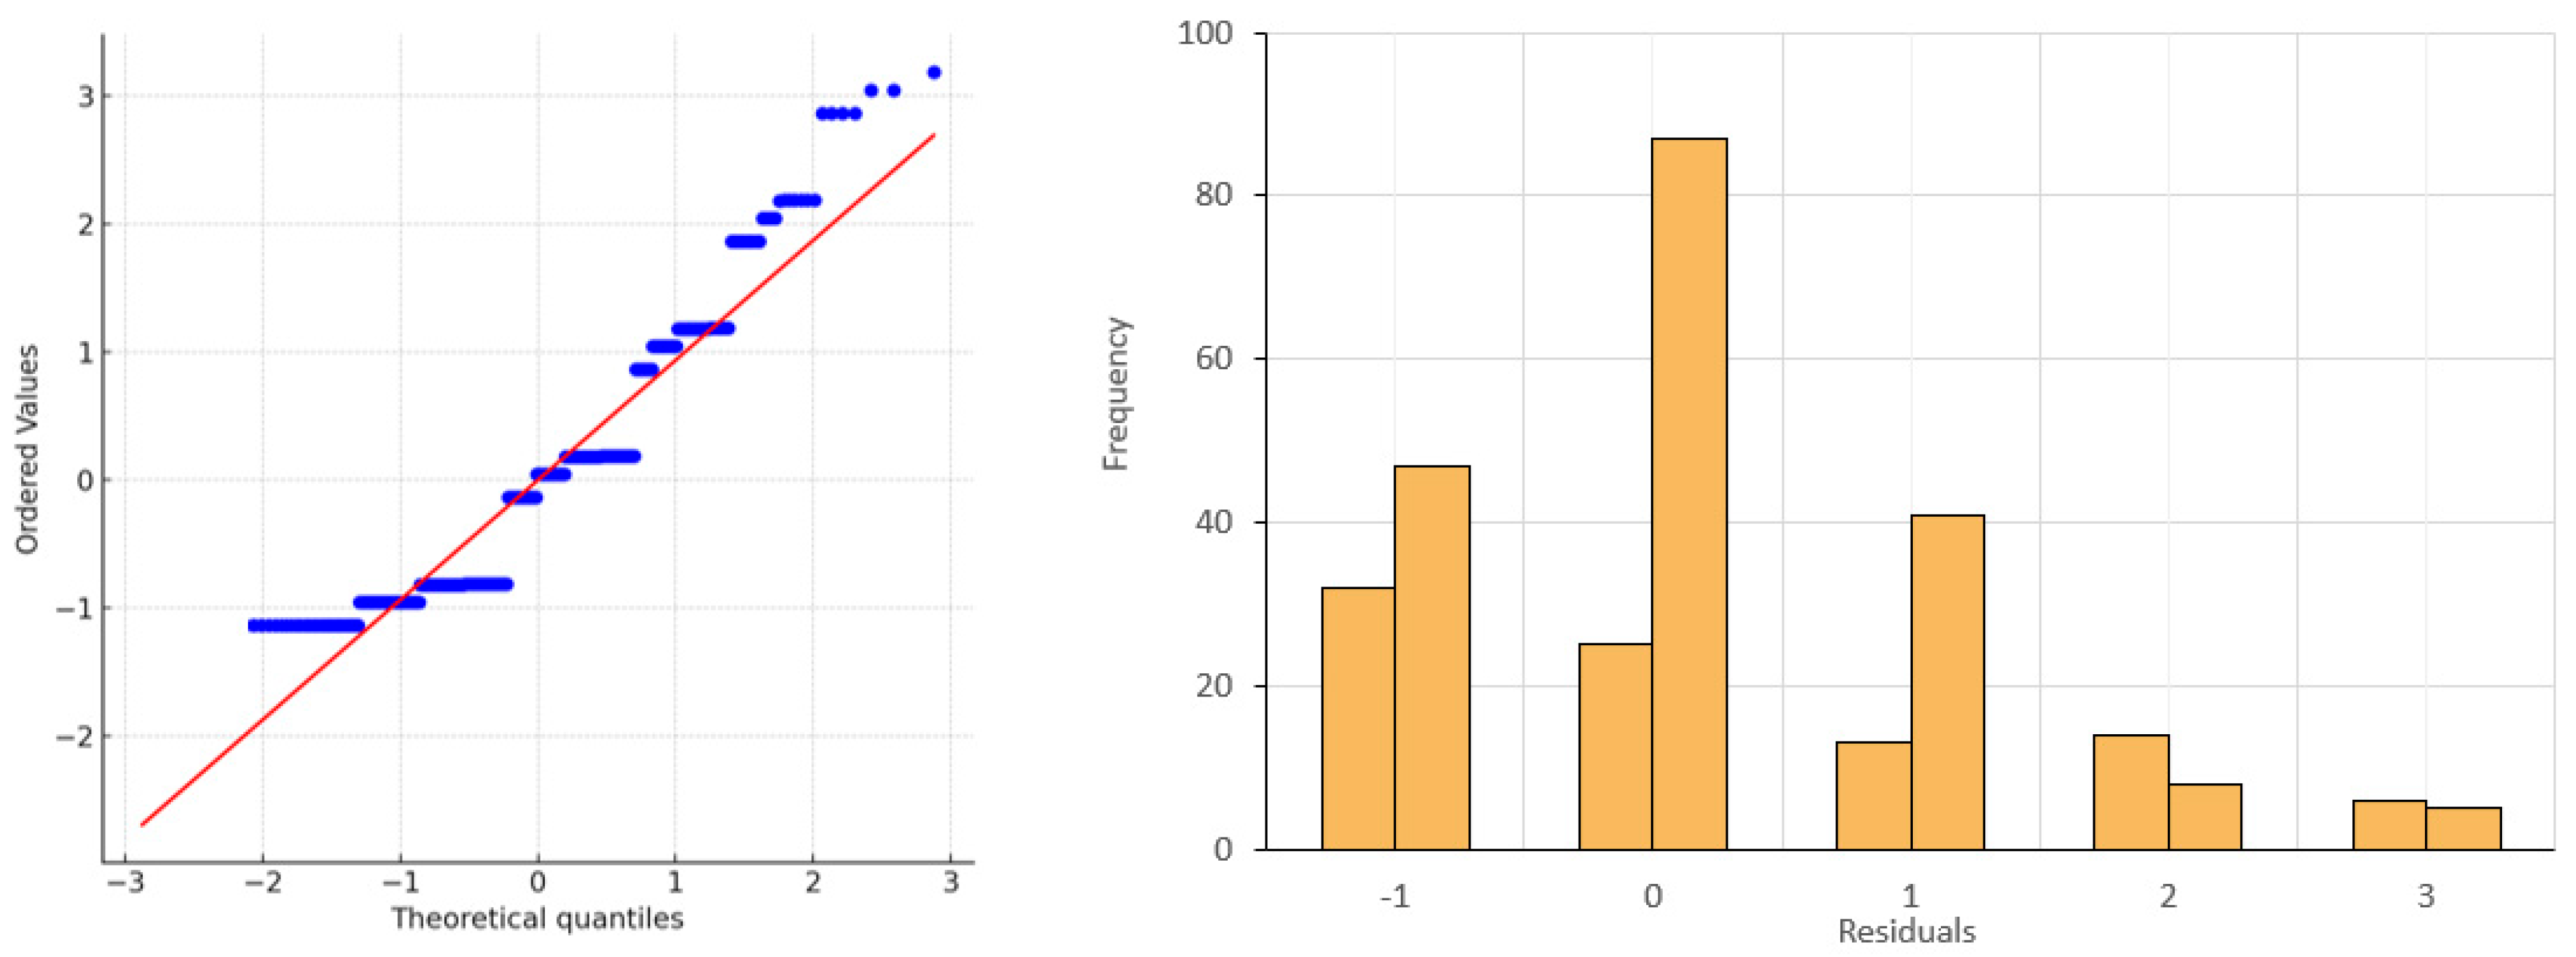
Before conducting hypothesis testing, residual diagnostics were performed to assess the validity of the parametric assumptions. Figure 3 presents the results of the normality checks based on the standardized residuals, confirming the suitability of the parametric methods for the subsequent analyses.
The Q–Q plot (left panel) compares the distribution of the standardized residuals against a theoretical normal distribution. Most data points align closely with the 45-degree reference line, suggesting that the residuals approximate normality. Minor deviations at the tails are visible, indicating slight departures from perfect normality.
The histogram (right panel) presents the frequency distribution of the residuals. The distribution centers around zero with a relatively symmetric pattern and tapering tails, consistent with an approximately normal shape.
These diagnostic plots support the validity of applying parametric statistical procedures such as ANOVAs and t-tests in the analysis. No severe skewness or outlier clusters are apparent, and the central tendency and dispersion appear statistically appropriate.

4.2. Testing Hypothesis 1 (H1)

This section of the paper presents a comparative examination of the overall number of WVCs during the designated time periods. The time periods included in this research were the new moon, first quarter, third quarter, and full moon, during the analyzed period (2015–2023). The objective of this segment of the research was to determine whether there is a disparity in the frequency of WVCs concerning the designated characteristic periods. The research omitted 2020 because of the COVID-19 pandemic, and 2015, the year when the tracking of these incidents commenced, resulting in a markedly lower incidence in the database.
Table 1 illustrates the annual distribution of WVCs in Serbia over the specified periods.
Given that the requirements of normality, homogeneity of variance, and random sampling were satisfied but independence was not, the repeated-measure ANOVA was utilized to evaluate this hypothesis. The normality was tested using the Shapiro–Wilk test (W1 = 0.884, p1 = 0.245; W2 = 0.950, p2 = 0.727; W3 = 0.927, p3 = 0.528; W4 = 919, p4 = 0.460) and a visual examination of the histograms and QQ plots. The homogeneity of variance was tested using Levene’s test (F(3,24) = 0.579, p = 0.635), while the independence was tested using the chi-square test (X2 = 15.238, p < 0.01).
The outcomes of the repeated-measure ANOVA (F(3,18) = 3.045, p = 0.06) demonstrate that there is no statistically significant difference in the frequency of WVCs throughout the specified intervals. Consequently, H1 is dismissed.
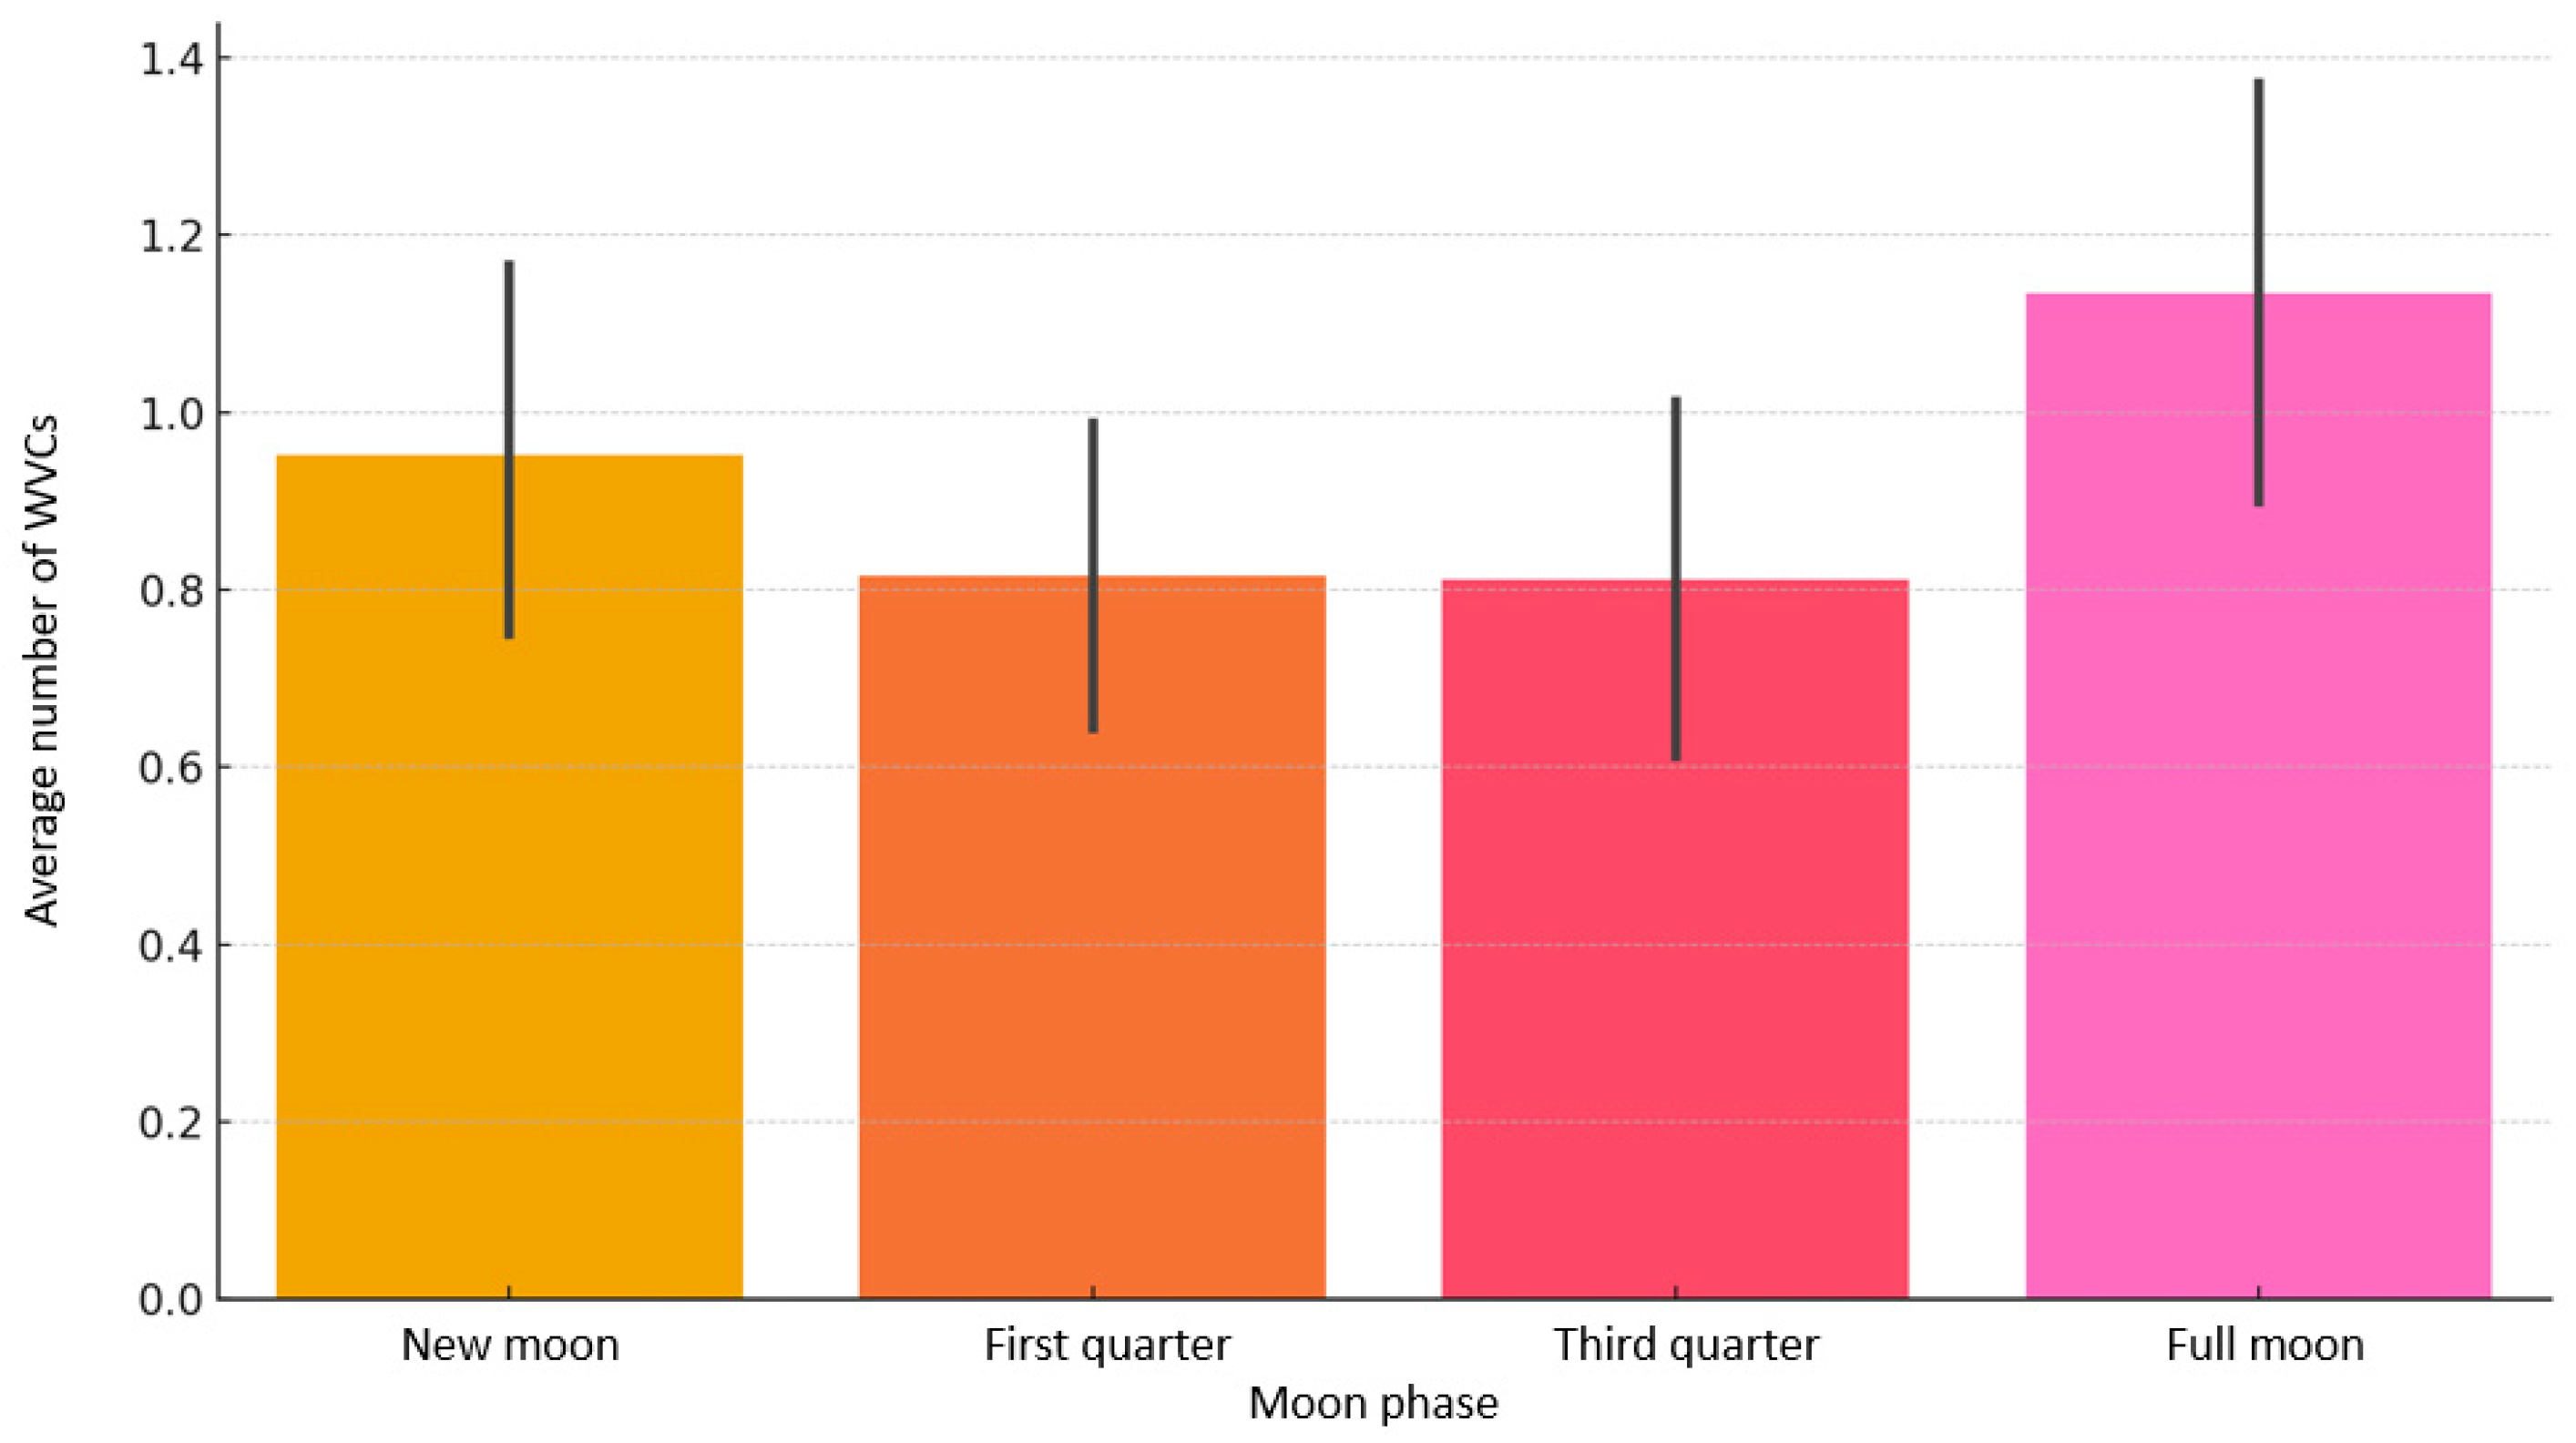
It is also important to show another interesting result here (Figure 4). Although full moon nights exhibit the highest average WVC count (1.13), followed by new moon (0.95), first quarter (0.82), and third quarter (0.81) nights, the differences are not statistically significant (as previously show). This suggests that while the full moon may be associated with a trend toward an increased collision frequency, the inter-annual variability is substantial, and the mean differences across the phases do not reach conventional levels of significance. These findings emphasize the importance of considering year-to-year fluctuations and support the use of multiyear aggregations and more detailed modeling in future analyses.

4.3. Testing Hypothesis 2 (H2)

This segment of the research involved a comparison between the average annual incidence of WVCs during the full moon (WVCf) and the average annual incidence of WVCs on the remaining days (WVCrd). The mentioned data for WVCs in Serbia is presented in Table 2.
For this research, a t-test was employed, ensuring that the requirements of normality, homogeneity of variance, and independence were satisfied. The normality was tested using the Shapiro–Wilk test (W1 = 0.916, p1 = 0.437; W2 = 0.885, p2 = 0.251) and a visual examination of the histograms and QQ plots. The homogeneity of variance was tested using Levene’s test (F(1,12) = 1.660, p = 0.221), while the independence was tested using the chi-square test (X2 = 0.193, p = 0.660).
The results of the t-test indicate a statistically significant difference between the WVCf (M = 1.135, SD = 1.028) and WVCrd (M = 0.819, SD = 0.233) (t(12) = 1.82, p = 0.042). According to the given results, Cohen’s D was calculated in order to determine the effect size of the obtained difference. In this specific case, Cohen’s D is 1.05, which indicates a large effect size [45], meaning the difference between the WVCf and WVCrd is substantial. This suggests that the WVCf values are significantly higher than the WVCrd values, with a strong magnitude of difference. This is also evidenced by the higher risk of WVCf, which is 1.135, compared to the risk of WVCrd during the remaining days, which is 0.820.
In order to assess the relative spatial risk of wildlife–vehicle collisions (WVCs) during the full moon across districts in Serbia, we constructed a composite index based on three key factors: the population-related exposure, road network coverage, and forest habitat availability. While this approach enabled a structured comparison of the WVC incidence, it does have important limitations. Most notably, data on the spatial distribution of specific wildlife species, particularly those most involved in WVCs, were unavailable at the resolution required for district-level analysis. Therefore, species-specific risk differentiation could not be performed and is acknowledged as a limitation of the present study. Similarly, detailed information on the road classification (e.g., motorways vs. rural roads and their length per category) and speed limits across the regions, while relevant for risk estimation, was either not publicly accessible or was inconsistently reported. Including such parameters would enhance the precision but requires more granular geospatial datasets that can link the road type, traffic flow, and collision locations with greater accuracy. Despite these constraints, the selected indicators—public risks, e.g., the population ratio (PR), road network risk (RNR), and forested area risk (FAR)—were chosen due to their relevance as proxies for the human exposure, vehicular presence, and wildlife habitat density, respectively. These dimensions reflect the primary anthropogenic and ecological conditions under which WVCs occur, and they form a foundational framework for comparative spatial risk analysis in the absence of more detailed infrastructure or ecological datasets. Risk is defined as the aggregate value of these three indicators [46]:
Public risk:
P R = T o t a l   n u m b e r   o f   W V C s P o p u l a t i o n × 100,000   ( W V C s   p e r   100,000   p e o p l e )
Road network risk:
R N R = T o t a l   n u m b e r   o f   W V C s R o a d   n e t w o r k   l e n g t h ( k m ) × 100   ( W V C s   p e r   100   k m   o f   r o a d )
Forested area risk:
F A R = T o t a l   n u m b e r   o f   W V C s F o r e s   a r e a ( h a ) × 1000   ( W V C s   p e r   1000   h a   o f   f o r e s t )
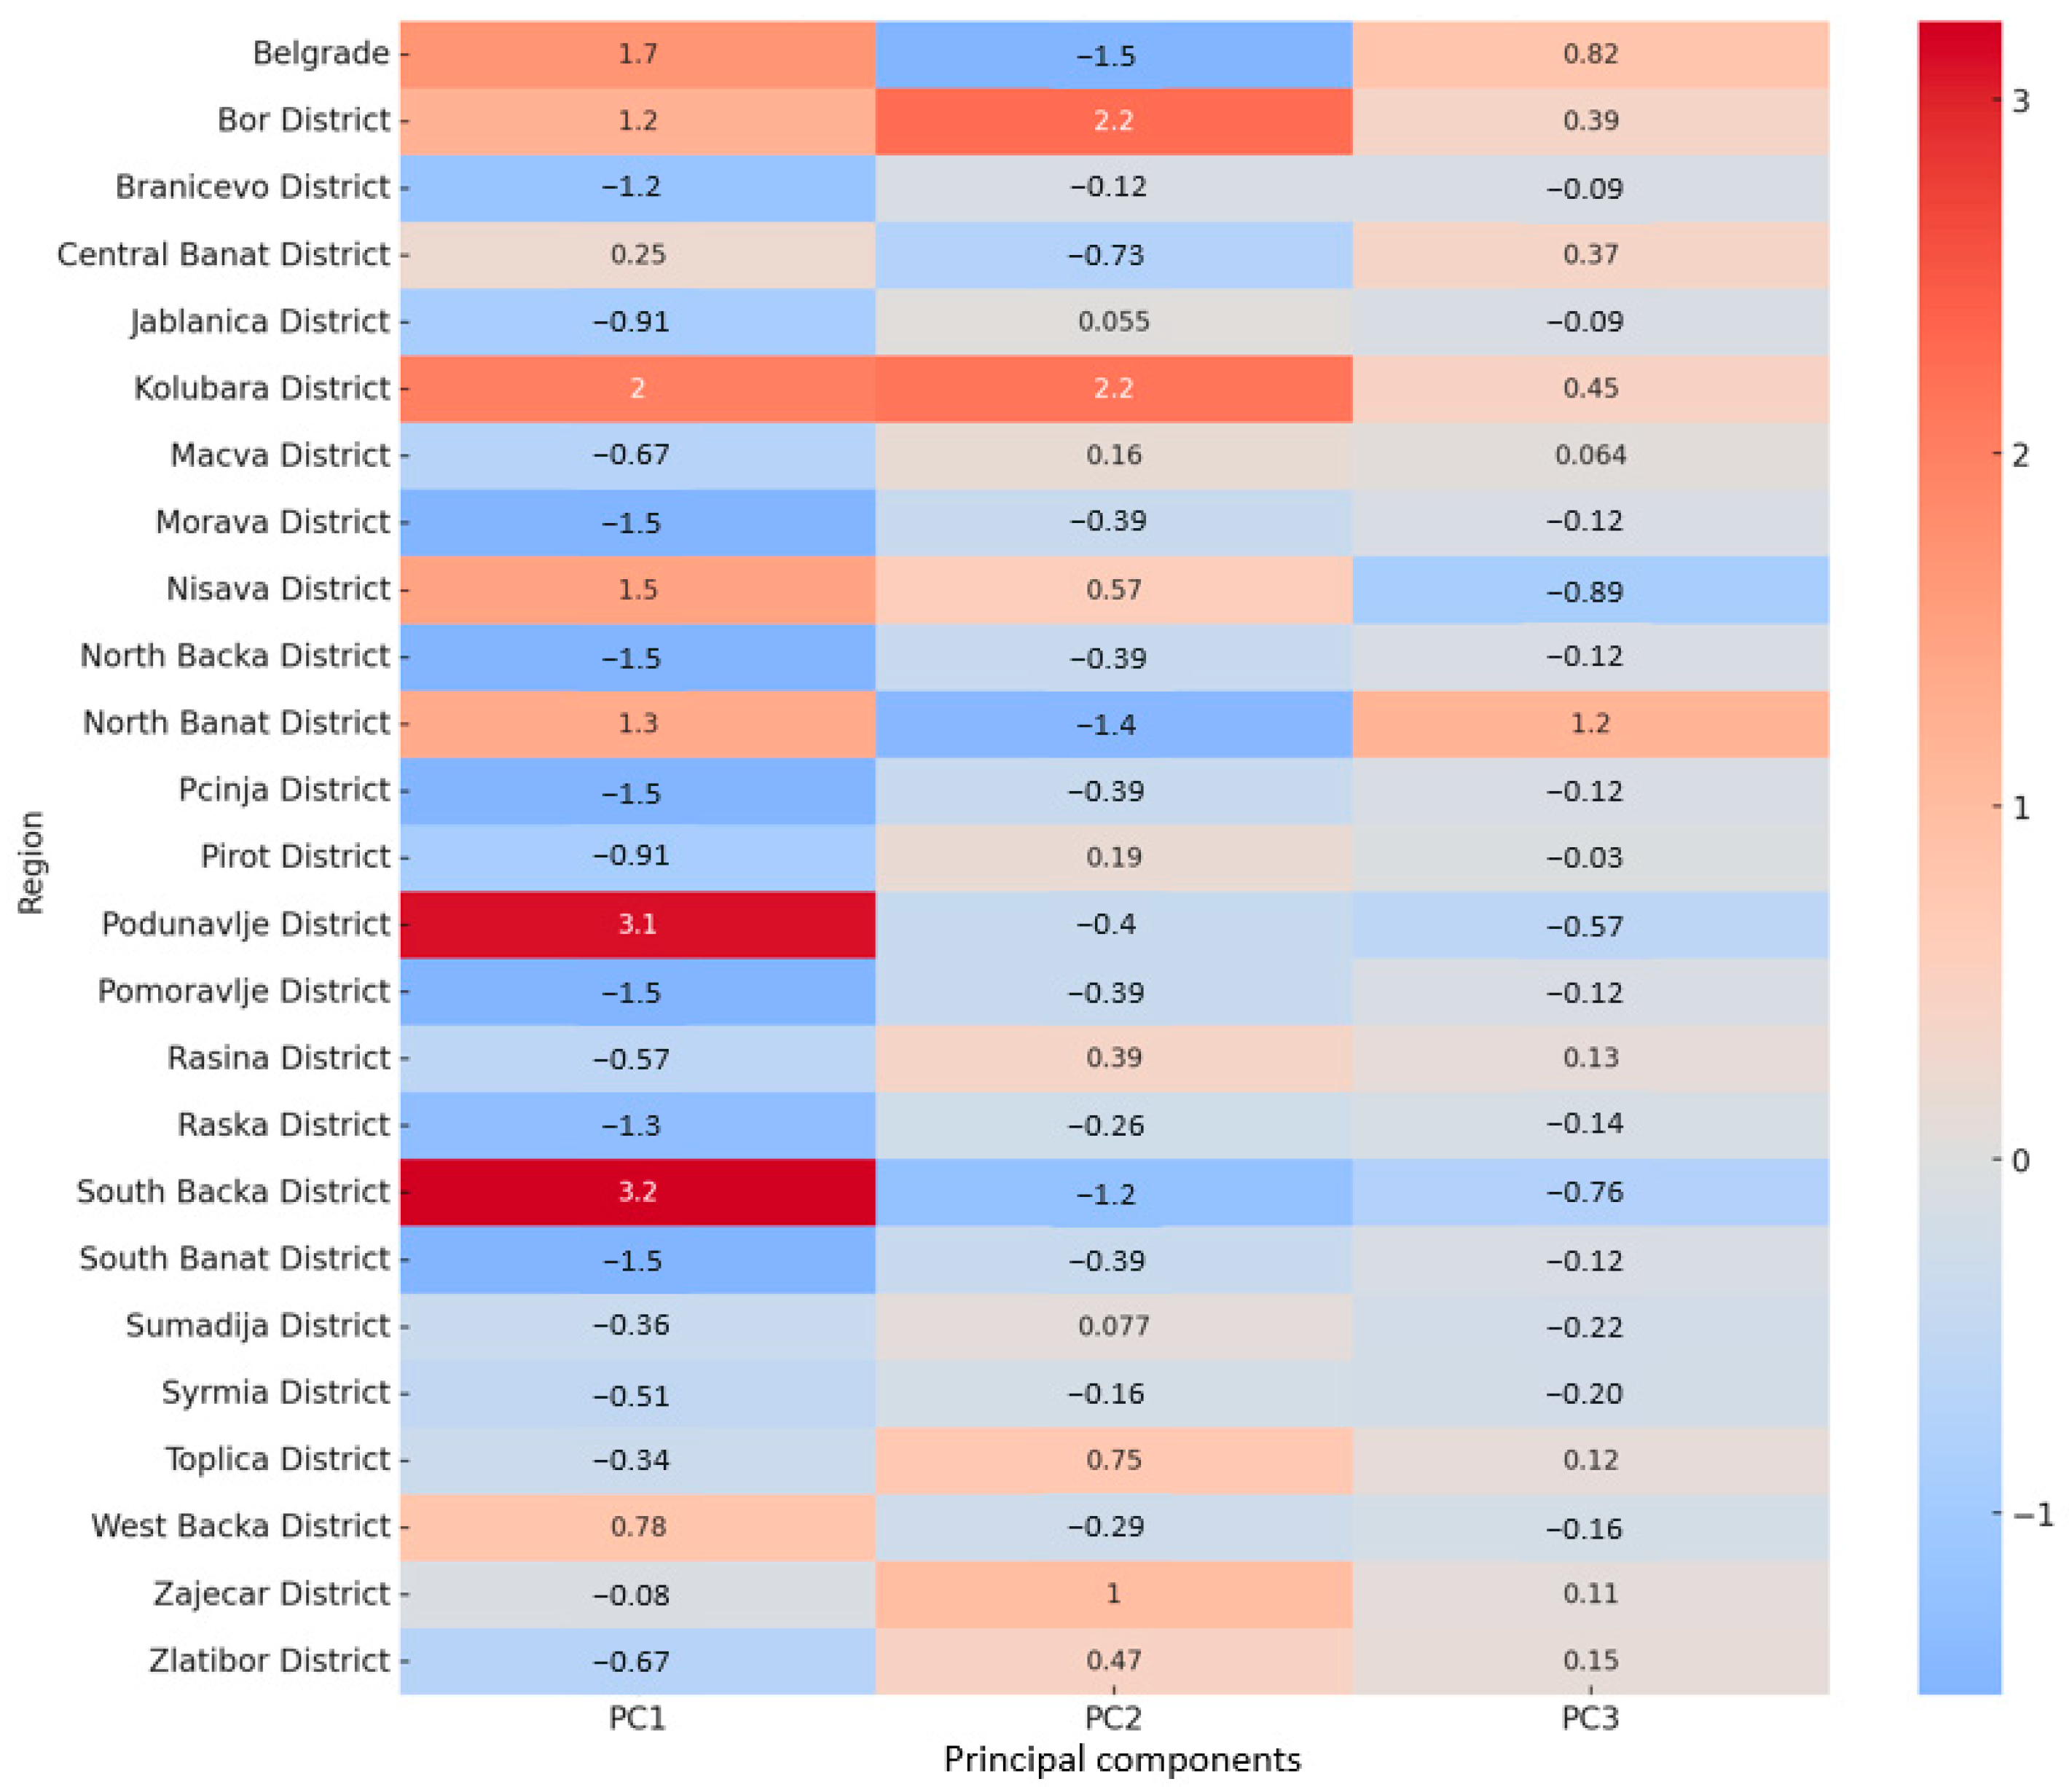
In order to objectively define the weights for the aggregate risk value, a Principal Component Analysis (PCA) was conducted (Figure 5). PCA is a widely used statistical method for dimensionality reduction and feature importance assessment, allowing for the objective derivation of weights based on the variance explained in the dataset [47,48].
The heatmap provides a visual overview of how the Serbian districts differ in their PCA-derived scores across the first three principal components. These components reflect composite patterns obtained from the risk indicators: the PR, RNR, and FAR.
A clear stratification among the districts can be observed. South Bačka and Podunavlje exhibited relatively high positive scores on PC1, indicating a stronger combined influence of the original risk indicators, suggesting greater overall exposure or interaction between the wildlife habitats and road networks in these regions. Conversely, the districts that display negative PC1 scores imply a different risk structure, potentially due to their lower population densities or less fragmented habitats.
PC2 and PC3 further help distinguish specific regional risk nuances. For example, Kolubara and Bor show high PC2 loading, possibly emphasizing their unique balance between infrastructure and natural features, while North Banat stands out in PC3, indicating a distinct pattern not captured in the first two dimensions.
Overall, the first principal component (PC1) explained 67.97% of the total variance, indicating that a single component captured the majority of the information in the three indicators. The loadings for PC1 were as follows: PR = 0.49, RNR = 0.66, and FAR = 0.57. These loadings were used as the empirically derived weights in the composite risk score formula.
Therefore, the aggregate risk value was obtained as the sum of the previously defined risks, following the results from the PCA for weights:
R t o t a l = w 1 × P R + w 2 × R N R + w 3 × F A R
where w1, w2, and w3 are the weights assigned to R1, R2, and R3, respectively, such that w1 = 0.49, w2 = 0.66, and w3 = 0.57.
To ensure comparability across the indicators and prevent scale-induced bias, each of the three risk metrics (PR, RNR, FAR) was first normalized using Min-Max scaling. The normalized values were then aggregated into a composite risk index through Equation (4), shown in Figure 6. This approach allowed for an unbiased summation of the contributions from each indicator, offering a more balanced representation of the overall regional WVC risk exposure. The data used for this analysis was sourced from the annual report of the Statistical Office of the Republic of Serbia [49].
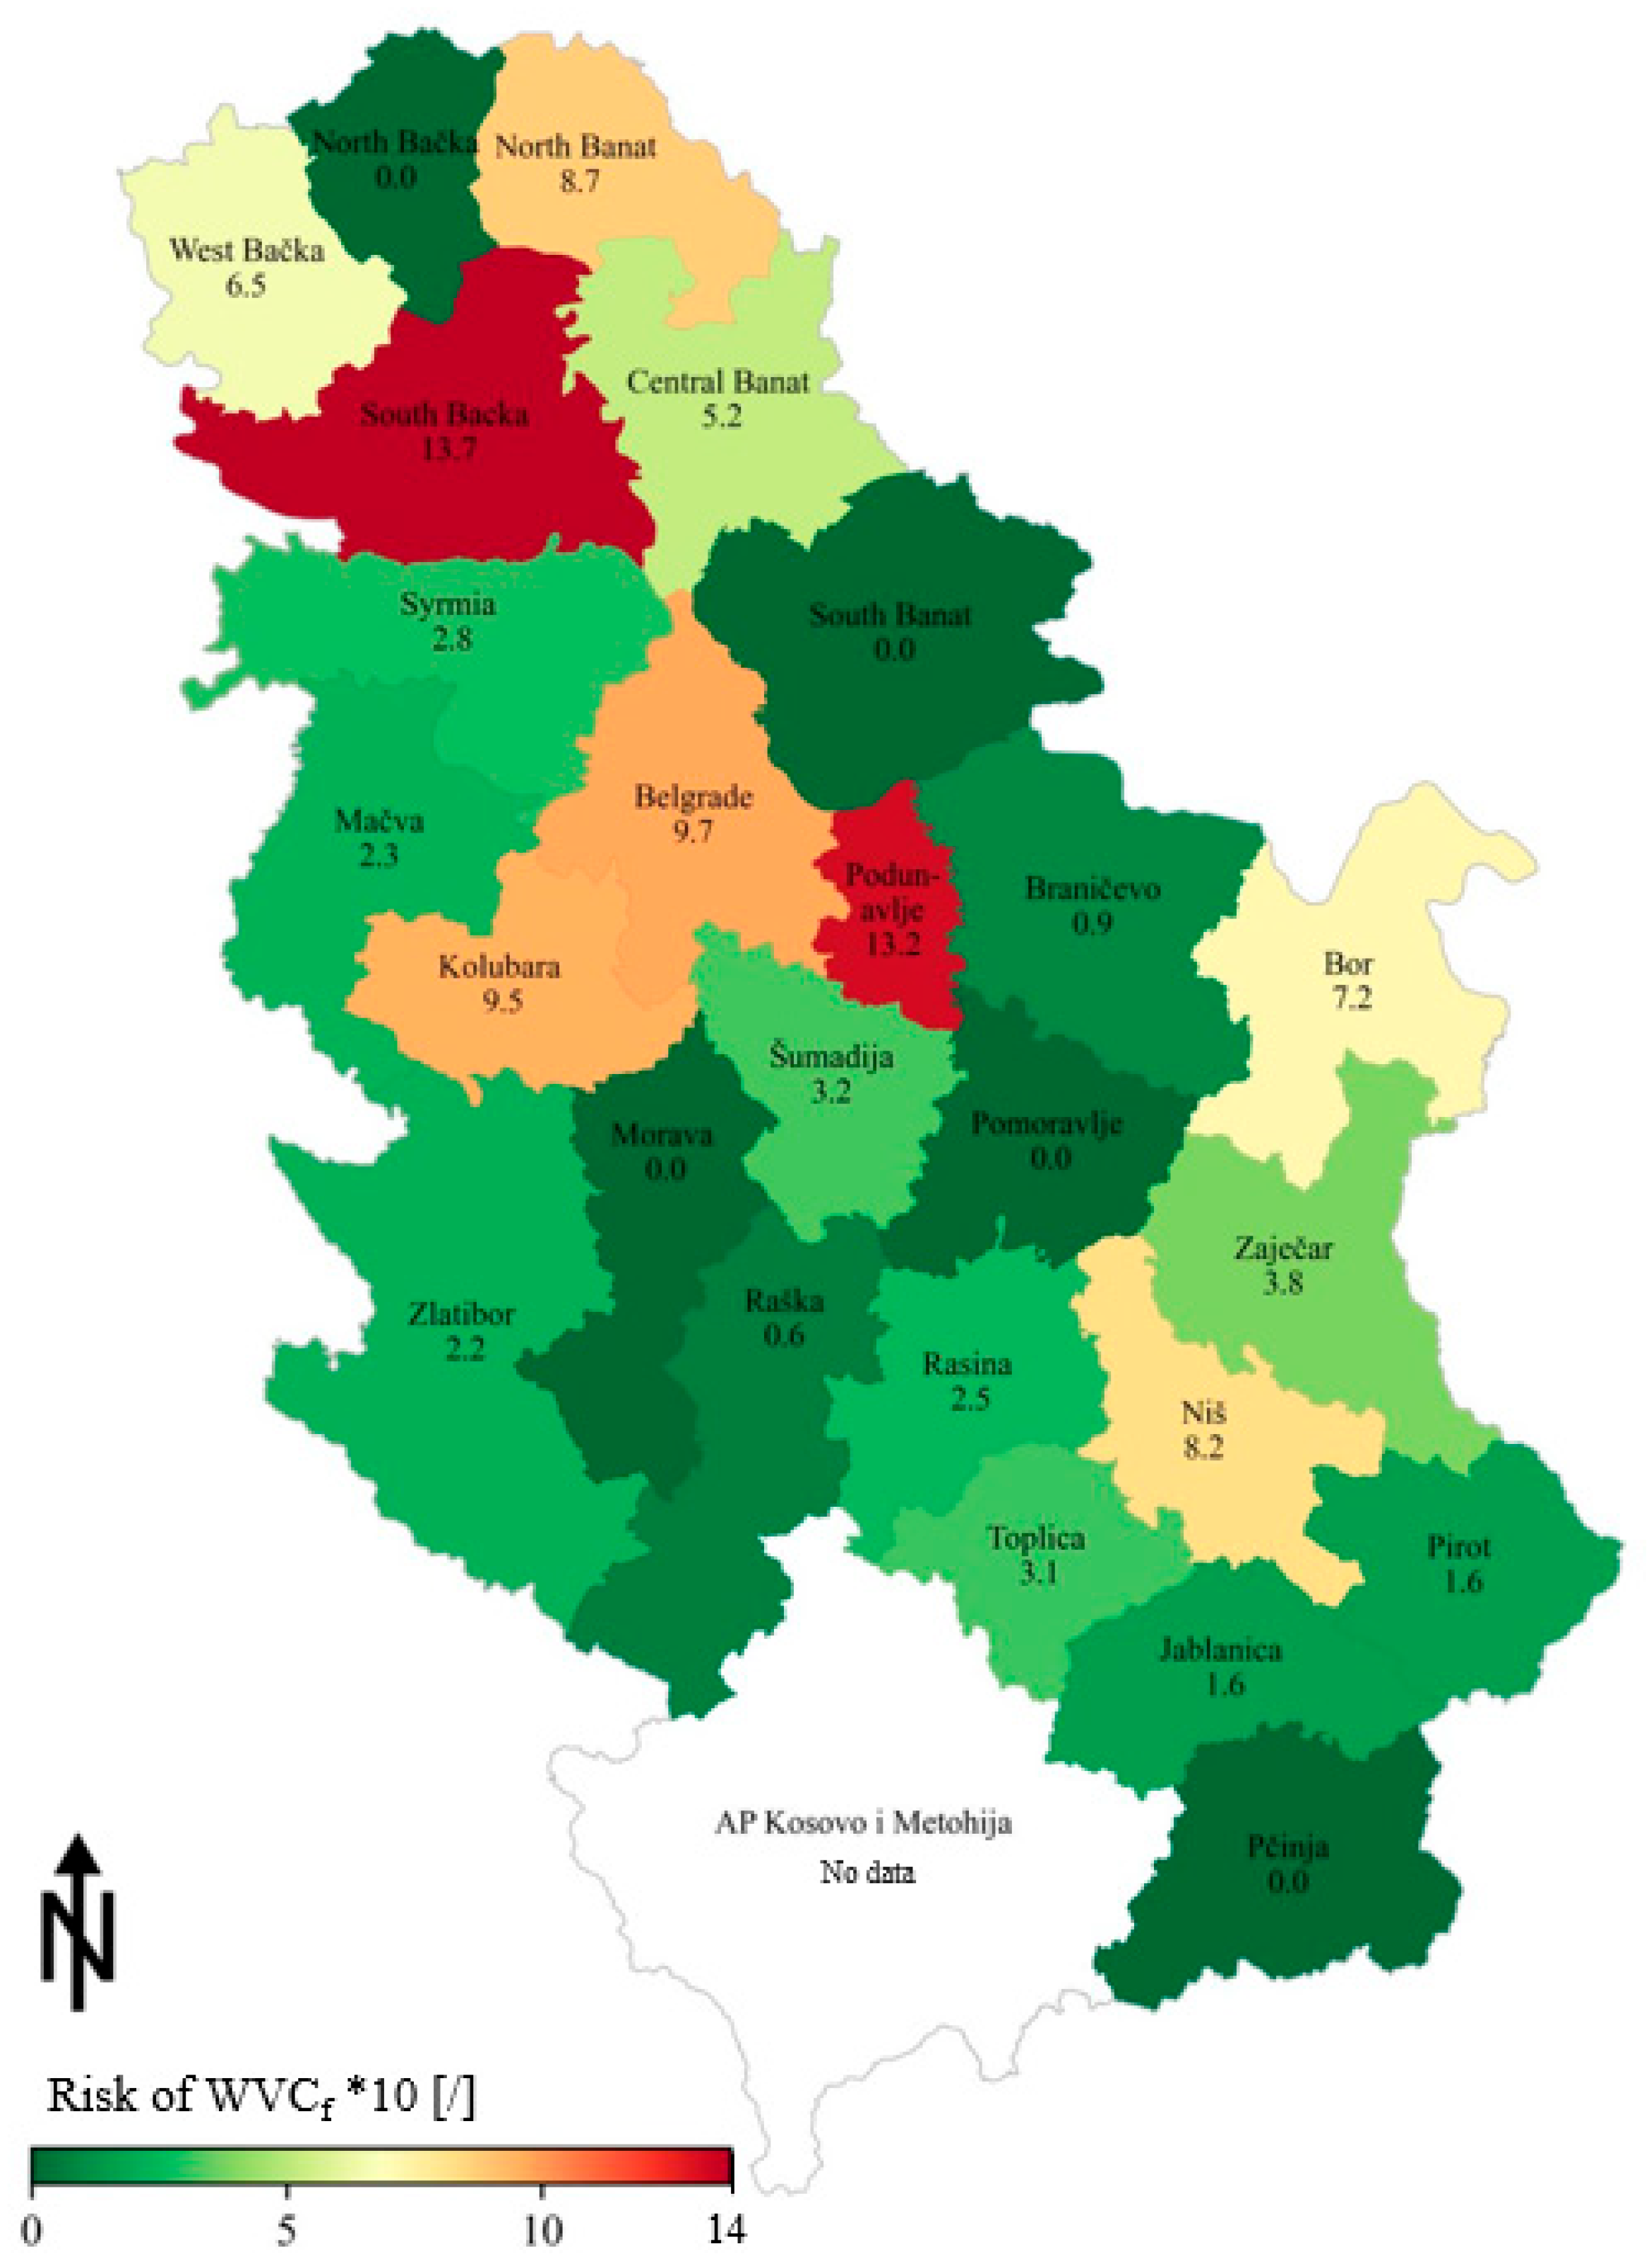
Figure 6 indicates that the South Bačka district (13.7) and Podunavlje district (13.2) show the highest risk of WVCf incidence. The Belgrade (9.7) and Kolubara (9.5) districts indicate medium risks, while the North Bačka, South Banat, Morava, Pomoravlje, and Pčinja districts have the lowest risks, since no WVCf were documented during the investigated period. It is interesting to note that the risk appears to be central and central–north spread when examining the terrain’s topology. Also, a heightened risk was anticipated in southern Serbia, according to the much larger forested regions and, consequently, greater number of wild animals that inhabit those areas. Conversely, the South Bačka district stood out as the one with the highest risk. The reason for this can be found in the large number of WVCf (the administrative region with the largest number of WVCf—14—in Serbia, after Belgrade).
According to the previous analysis, the next study’s endeavors will concentrate on a more thorough and meticulous examination of the terrain topography, forestness, and population, as well as the species of wild animals by administrative regions (for which there was no data on traffic accidents), to obtain a more precise understanding of the unique circumstances.

4.4. Testing Hypothesis 3 (H3)

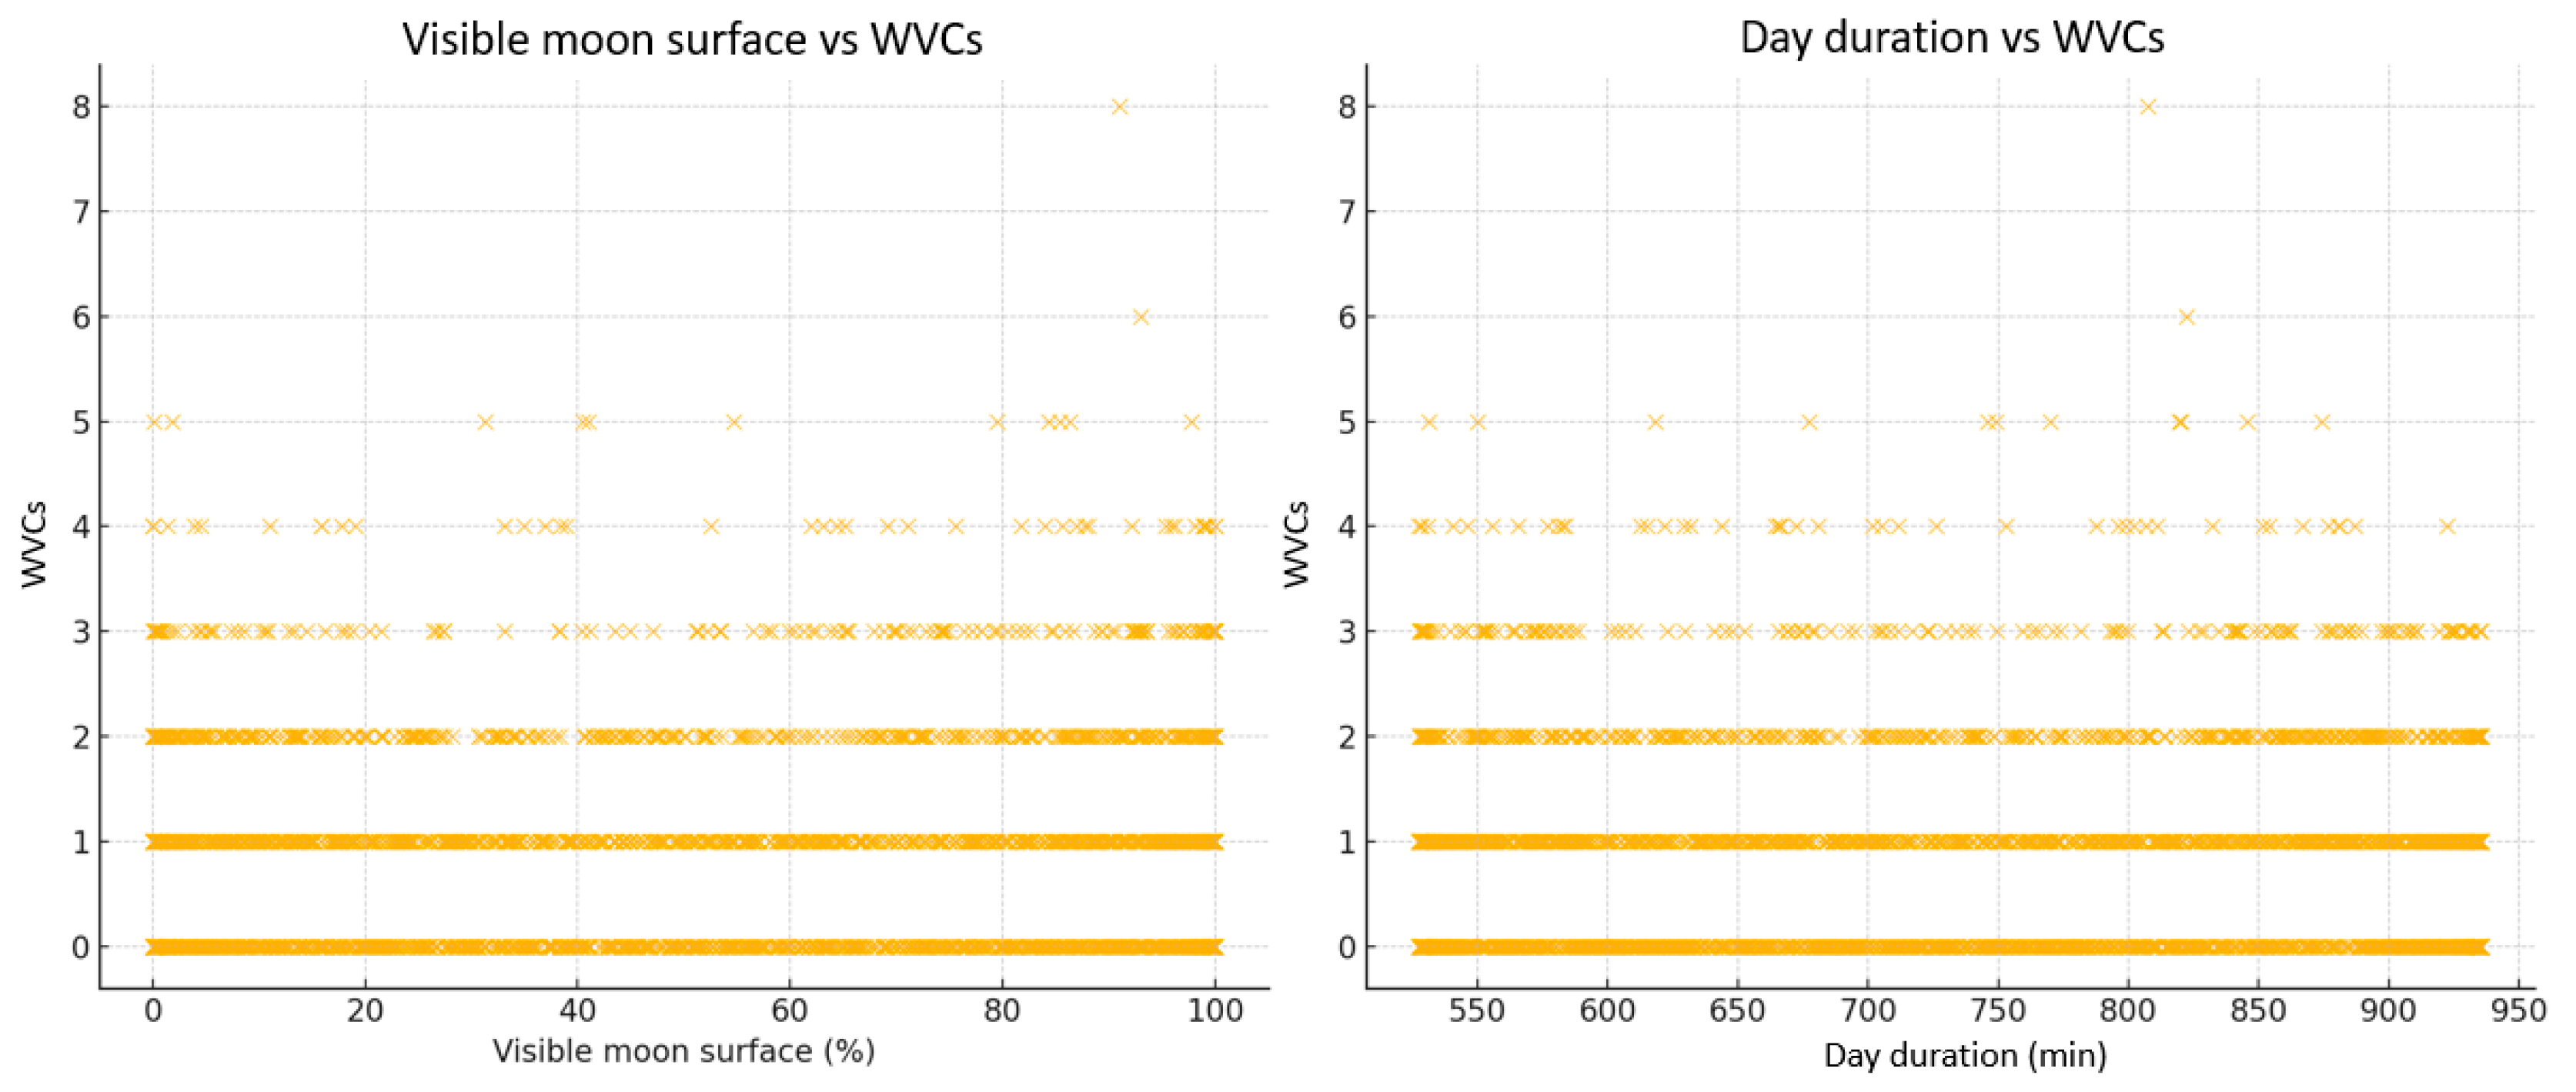
Although the main focus of this study was on the impact of the categorical lunar phases on wildlife–vehicle collisions (WVCs), we conducted an additional exploratory analysis to investigate whether the continuous variables—the visible moon surface (%) and day duration (minutes)—exhibited any measurable association with the number of nighttime WVCs. The rationale behind this analysis was to determine whether more gradual changes in the lunar brightness or seasonal photoperiod could influence animal or driver behavior in ways not captured by the discrete moon phase groupings.
To test these potential relationships, we calculated both the Pearson (linear) and Spearman (non-parametric) correlation coefficients between these variables and the number of recorded WVCs per night. The results indicated a very weak positive correlation between the visible moon surface and nighttime WVCs (Pearson’s r = 0.067, p < 0.001; Spearman’s ρ = 0.049, p = 0.013), which, although statistically significant, lacks practical strength. In contrast, the day duration showed no statistically significant correlation with nighttime WVCs (Pearson’s r = 0.007; Spearman’s ρ = 0.013; both: p > 0.5).
These findings suggest that the continuous measures of the illumination and photoperiod do not provide strong predictive value for the collision frequency during nighttime hours. Instead, our main results, highlighting differences across the categorical moon phases, appear more ecologically meaningful and behaviorally relevant.
The scatterplots presented in Figure 7 reinforce these conclusions: no clear linear or nonlinear patterns are observable, and the data points are widely dispersed across the value ranges.
These results help to rule out simpler response effects of light or daylight and support the idea that animal activity and driver exposure during specific moon phases, such as full moon periods, are more critical for understanding the WVC risk. This analysis complements the core findings by demonstrating that the moon phase categories remain the most robust framework for understanding lunar-related risk patterns in wildlife–vehicle interactions.

5. Discussion

This paper analyzes wildlife–vehicle collisions (WVCs) during full moon phases in the Republic of Serbia (2015 to 2023), revealing significant trends consistent with the existing literature. The findings indicated a statistically significant increase in the annual average WVCs on full moon nights compared with those of other days, suggesting that this factor influences the behavior of wildlife and their vulnerability to traffic accidents. Nevertheless, comparisons across all the lunar phases (full moon, new moon, first quarter, and last quarter) did not reveal significant differences, suggesting that variables outside the lunar phases may influence the WVC risk.
The significant increase in WVCs during full moon nights confirms findings from other studies [9,35]. These studies suggest that increased illumination during full moons may improve road visibility, either bringing wildlife to these locations or elevating their activity levels. This suggests that prey species may utilize brighter evenings to enhance their predator detection while unintentionally elevating their road crossings and associated accident risk. Generally, the observed increase in WVCs during full moon nights may be explained by several interacting behavioral and environmental mechanisms. From an ecological standpoint, increased lunar illumination enhances animal visibility, which may either embolden certain species to move more freely at night or alter their typical movement patterns due to predator–prey dynamics or their feeding cycles. For prey animals, greater visibility may offer improved predator detection, increasing their road-crossing behavior. Conversely, predators may also be more active, further disturbing wildlife near roads. On the human side, improved road visibility under full moonlight may lead to increased nighttime travel or higher vehicle speeds, inadvertently raising the risk of collisions. These factors are difficult to isolate without integrated animal tracking or behavioral monitoring, but their convergence could explain the heightened WVC frequency on full moon nights.
Notably, our inability to identify substantial variations across all lunar phases aligns with the findings from Lithuania [50]. This study emphasizes the intricate interactions of elements affecting WVCs, such as species-specific behaviors, seasonal fluctuations, and local ecological settings, which may obscure the evident impact of the moon phases in larger comparisons.
Our findings spatially indicated the South Bačka and Podunavlje districts as hotspots for wildlife–vehicle collisions during full moon phases. This geographical variance points out that regional characteristics, including the landscape design, population density, and road density, substantially affect the probability of WVCs. Additionally, the spatial heterogeneity observed in high-risk areas such as South Bačka and Podunavlje may reflect a combination of dense road networks intersecting natural habitats, limited roadside fencing, and varying degrees of artificial lighting or urban sprawl. Forest cover, human population pressure, and infrastructure density may all shape localized WVC dynamics. A deeper understanding of these spatial interactions is essential for designing region-specific mitigation strategies and informing land-use planning to reduce future collision risks. It is interesting to note that Belgrade was not found to be the riskiest area despite having the highest number of WVCf (28), due to its large population and extensive road network. Hence, it is suggested that future research consider municipalities within Belgrade in order to gain a more detailed insight into the current situation.
The literature also underscores the need to use geographical data to forecast wildlife–vehicle collision hotspots [24]. The significant forest cover, closeness to water supplies, and presence of ungulate populations in these regions may elucidate their heightened risk. Some studies suggest that seasonal migrations and breeding cycles may aggravate the WVC risks in certain regions [28], potentially aligning with the lunar influence during full moons. The lack of notable results in comparing full moon collisions with the different lunar phases underscores the complex nature of WVCs. Additional research will identify the road design, traffic volume, and driver behavior as important elements that may eclipse lunar influences [25]. The interplay between these anthropogenic and ecological variables likely explains the complex effects seen in our study, which will be further examined in future research.
While the current paper identifies regional risk patterns and highlights full moon nights as a temporal risk amplifier for wildlife–vehicle collisions (WVCs), the implementation of mitigation strategies requires further spatial detailing at the microlevel. At this stage, the proposed measures aim to serve as a strategic framework, which can be adapted and operationalized by transport safety authorities and regional planners. Nonetheless, based on the findings and international practices, the following semi-operational recommendations are proposed:
  • Overlaying WVC spatial hotspots with forest coverage and road curvature to identify likely animal-crossing points for targeted signage installation (as a priority action).
  • The installation of static animal-warning signs on rural roads (curves) and forest-edge segments within districts at elevated risk (e.g., South Bačka, Podunavlje), using frequency maps from this study to prioritize locations.
  • The deployment of VMS panels on roads with recorded nighttime WVC clusters to deliver dynamic messages during full moon phases (±1 day) or migration periods, especially in autumn and spring.
  • Encouraging pilot projects in the most affected districts that would test different signage types and measure their effectiveness at reducing WVCs.
  • Establishing a feedback loop between police crash records and signage effectiveness studies to optimize future interventions.
Another important feature of this research is that this framework can be generalized and transferred to other regions and countries by replicating the key components: (1) temporal risk modeling (e.g., moon phase analysis), (2) regionalized crash indexing (e.g., PCA-based aggregation), and (3) intersection with landscape and road network characteristics. While the specific animal species and road conditions may differ, the methodological structure remains adaptable to various environmental and policy contexts.
Furthermore, it is important to emphasize that careful and extensive data collection, encompassing wide-ranging data from traffic accidents, greatly enhances studies such as this one. In addition, open data was essential for this research paper; as previously stated, there are some limitations caused by the data unavailability. Recommendations for public administration policy may include enhancing the quality of traffic accident data, such as incorporating more detailed records that specify the type of animal involved in the collision. Furthermore, recent advancements in deep learning, such as physics-informed neural networks and hybrid LSTM architectures, have demonstrated remarkable capabilities in complex system modeling and adaptive control under non-stationary conditions [51,52]. While originally applied to mechanical and rail systems, these methodologies could, in the future, be adapted to ecological traffic safety contexts, enhancing the prediction accuracy under dynamic environmental conditions.
One of the limitations of this study lies in the unavailability of detailed traffic volume data, particularly nighttime counts at a fine temporal resolution. This is a critical issue, as the traffic volume is not only a direct contributor to the collision likelihood but may also be influenced by lunar brightness. Brighter nights, such as those during a full moon, may lead to changes in driver behavior, including an increased willingness to travel at night or alterations in speed and alertness. Without controlling for these factors, there remains uncertainty about the extent to which increased WVCs on full moon nights are attributable to changes in animal movement versus changes in human mobility and traffic exposure. While this study focused primarily on animal behavioral aspects, we fully recognize the bidirectional influence between traffic and environmental lighting. The exclusion of traffic volume data was due to the limited data availability for the relevant rural road segments and temporal scope; however, future research should prioritize acquiring continuous traffic data in order to separate exposure effects from behavioral effects. Such data would support the more robust modeling of the collision probability and better inform targeted policy interventions that account for both wildlife and driver behavior under varying lunar conditions.

6. Conclusions

This research underscores the substantial impact of the full moon phase on wildlife–vehicle collisions (WVCs) in the Republic of Serbia (2015 to 2023), noting a rise in the WVC frequency on full moon nights. Nevertheless, no substantial changes were seen across any of the lunar phases, suggesting that other ecological and anthropogenic variables may influence the lunar impacts. Furthermore, the South Bačka and Podunavlje districts were identified as high-risk zones for WVCs during full moons, indicating the necessity for targeted mitigation and sustainable actions.
This study’s limitations encompass the potential underreporting of the WVC occurrences, discrepancies in the data collection methodologies between locations, and the absence of species-specific analysis, which could provide deeper insight into the behavioral patterns across animal groups. Additionally, the conducted risk analysis was constrained by the unavailability of several important variables, most notably traffic volumes, meteorological conditions, and detailed road attributes.
The traffic volume is widely recognized as a fundamental driver of WVC risk, and its absence presents one of the limitations. Although elevated collision frequencies were identified during full moon nights, it is important to acknowledge that the traffic volume itself may vary with lunar illumination. Brighter nights may encourage more nighttime travel or influence driver behavior in ways that increase exposure to wildlife. Therefore, future research should incorporate continuous traffic flow data alongside the moonlight intensity, animal activity patterns, and spatiotemporal modeling. Other potentially relevant factors include road and weather conditions, as well as space weather parameters (e.g., solar flares, sunspot activity, proton density), which may affect animal behavior. Targeted mitigation strategies in high-risk areas such as South Bačka and Podunavlje could include warning signage, wildlife corridors, and public education campaigns linked to full moon phases. Addressing these interdisciplinary dynamics can support safer roads while promoting wildlife protection in Serbia.

Author Contributions

Conceptualization, methodology, software, validation, formal analysis, writing—original draft, writing—review and editing, S.J.; writing—review and editing, supervision, V.T.; conceptualization, software, writing—review and editing, visualization, F.A.; writing—review and editing, supervision, A.K.; writing—review and editing, supervision, V.A.S. All authors have read and agreed to the published version of the manuscript.

Funding

This work was funded by the Institute of Physics Belgrade, University of Belgrade, through a grant by the Ministry of Science, Technological Development and Innovations of the Republic of Serbia.

Institutional Review Board Statement

Not applicable.

Data Availability Statement

The original contributions presented in this study are included in the article. Further inquiries can be directed to the corresponding authors.

Conflicts of Interest

The authors declare no conflicts of interest.

References

  1. World Health Organization (WHO) Road Traffic Injuries. Available online: https://www.who.int/news-room/fact-sheets/detail/road-traffic-injuries (accessed on 15 April 2025).
  2. Skroch, M.; Hilaire, T. Wildlife-Vehicle Collisions Are a Big and Costly Problem and Congress Can Help. Available online: https://www.pewtrusts.org/en/research-and-analysis/articles/2021/05/10/wildlife-vehicle-collisions-are-a-big-and-costly-problem-and-congress-can-help (accessed on 16 April 2025).
  3. Creech, T.G.; Fairbank, E.R.; Clevenger, A.P.; Callahan, A.R.; Ament, R.J. Differences in Spatiotemporal Patterns of Vehicle Collisions with Wildlife and Livestock. Environ. Manag. 2019, 64, 736–745. [Google Scholar] [CrossRef] [PubMed]
  4. Akrim, F.; Mahmood, T.; Andleeb, S.; Hussain, R.; Collinson, W.J. Spatiotemporal Patterns of Wildlife Road Mortality in the Pothwar Plateau, Pakistan. Mammalia 2019, 83, 487–495. [Google Scholar] [CrossRef]
  5. Arevalo, J.E.; Honda, W.; Arce-Arias, A.; Häger, A. Spatio-Temporal Variation of Roadkills Show Mass Mortality Events for Amphibians in a Highly Trafficked Road Adjacent to a National Park, Costa Rica. Rev. Biol. Trop. 2017, 65, 1261. [Google Scholar] [CrossRef]
  6. Wilkins, D.C.; Kockelman, K.M.; Jiang, N. Animal-Vehicle Collisions in Texas: How to Protect Travelers and Animals on Roadways. Accid. Anal. Prev. 2019, 131, 157–170. [Google Scholar] [CrossRef]
  7. Templer, D.I.; Veleber, D.M.; Brooner, R.K. Geophysical Variables and Behavior: VI. Lunar Phase and Accident Injuries: A Difference between Night and Day. Percept. Mot. Skills 1982, 55, 280–282. [Google Scholar] [CrossRef]
  8. Steiner, W.; Scholl, E.M.; Leisch, F.; Hacklander, K. Temporal Patterns of Roe Deer Traffic Accidents: Effects of Season, Daytime and Lunar Phase. PLoS ONE 2021, 16, 16–19. [Google Scholar] [CrossRef] [PubMed]
  9. Colino-Rabanal, V.J.; Langen, T.A.; Peris, S.J.; Lizana, M. Ungulate: Vehicle Collision Rates Are Associated with the Phase of the Moon. Biodivers. Conserv. 2018, 27, 681–694. [Google Scholar] [CrossRef]
  10. Sitar, J. K Semilunárnímu Zvýsení Dopravní Nehodovosti [The Effect of the Semilunar Phase on an Increase in Traffic Accidents]. Cas Lek Ces. 1994, 133, 596–598. [Google Scholar]
  11. Onozuka, D.; Nishimura, K.; Hagihara, A. Full Moon and Traffic Accident-Related Emergency Ambulance Transport: A Nationwide Case-Crossover Study. Sci. Total Environ. 2018, 644, 801–805. [Google Scholar] [CrossRef]
  12. World Health Organization (WHO) Road Traffic Mortality. Available online: https://www.who.int/data/gho/data/themes/topics/topic-details/GHO/road-traffic-mortality#:~:text=Road%20traffic%20injuries%20are%20currently,traffic%20injuries%20can%20be%20prevented (accessed on 26 May 2025).
  13. Lipovac, K. Bezbednost Saobraćaja [Road Traffic Safety]; Public enterprise Official Gazette of the Republic of Serbia: Belgrade, Serbia, 2008; ISBN 978-86-355-0747-7. [Google Scholar]
  14. Becker, N.; Rust, H.; Ulbrich, U. Weather Impacts on Various Types of Road Crashes: A Quantitative Analysis Using Generalized Additive Models. Eur. Transp. Res. Rev. 2022, 14, 37. [Google Scholar] [CrossRef]
  15. Das, S.; Bura, S.; Hossain, A. Unraveling the Complex Relationship between Weather Conditions and Traffic Safety. J. Transp. Saf. Secur. 2024, 17, 572–611. [Google Scholar] [CrossRef]
  16. Murphy, F.M. Car Accidents & Animals: What You Need to Know. Available online: https://www.murphyfalcon.com/news/car-accidents-animals-what-you-need-to-know/ (accessed on 28 May 2025).
  17. Jakubas, D.; Ryś, M.; Lazarus, M. Factors Affecting Wildlife-Vehicle Collision on the Expressway in a Suburban Area in Northern Poland. North. West. J. Zool. 2018, 14, 107–116. [Google Scholar]
  18. Su, H.; Wang, Y.; Yang, Y.; Tao, S.; Kong, Y. An Analytical Framework of the Factors Affecting Wildlife–Vehicle Collisions and Barriers to Movement. Sustainability 2023, 15, 11181. [Google Scholar] [CrossRef]
  19. Llagostera, P.; Comas, C.; López, N. Modeling Road Traffic Safety Based on Point Patterns of Wildlife-Vehicle Collisions. Sci. Total Environ. 2022, 846, 157237. [Google Scholar] [CrossRef]
  20. Sullivan, J.M. Trends and Characteristics of Animal-Vehicle Collisions in the United States. J. Saf. Res. 2011, 42, 9–16. [Google Scholar] [CrossRef]
  21. Laliberté, J.; St-Laurent, M.H. In the Wrong Place at the Wrong Time: Moose and Deer Movement Patterns Influence Wildlife-Vehicle Collision Risk. Accid. Anal. Prev. 2020, 135, 105365. [Google Scholar] [CrossRef] [PubMed]
  22. Kučas, A.; Balčiauskas, L. Impact of Road Fencing on Ungulate–Vehicle Collisions and Hotspot Patterns. Land 2021, 10, 338. [Google Scholar] [CrossRef]
  23. Keken, Z.; Sedoník, J.; Kušta, T.; Andrášik, R.; Bíl, M. Roadside Vegetation Influences Clustering of Ungulate Vehicle Collisions. Transp. Res. Part D Transp. Environ. 2019, 73, 381–390. [Google Scholar] [CrossRef]
  24. Bénard, A. Road Ecology: Toward a Predictive Model of Wildlife-Vehicle Collisions. Ph.D. Thesis, Université Claude Bernard Lyon, Villeurbanne, France, 2023. [Google Scholar]
  25. Pagany, R. Wildlife-Vehicle Collisions—Influencing Factors, Data Collection and Research Methods. Biol. Conserv. 2020, 251, 108758. [Google Scholar] [CrossRef]
  26. Laverty, W.H.; Kelly, I.W.; Flynn, M.; Rotton, J. Geophysical Variables and Behavior: LXVIII. Distal and Lunar Variables and Traffic Accidents in Saskatchewan 1984 to 1989. Percept. Mot. Skills 1992, 74, 483–488. [Google Scholar] [CrossRef]
  27. Cerri, J.; Stendardi, L.; Bužan, E.; Pokorny, B. Accounting for Cloud Cover and Circannual Variation Puts the Effect of Lunar Phase on Deer–Vehicle Collisions into Perspective. J. Appl. Ecol. 2023, 60, 1698–1707. [Google Scholar] [CrossRef]
  28. Vrkljan, J.; Hozjan, D.; Barić, D.; Ugarković, D.; Krapinec, K. Temporal Patterns of Vehicle Collisions with Roe Deer and Wild Boar in the Dinaric Area. Croat. J. For. Eng. 2017, 41, 13. [Google Scholar] [CrossRef]
  29. Bil, M.; Andrášik, R.; Bilova, M. Wildlife-Vehicle Collisions: The Disproportionate Risk of Injury Faced by Motorcyclists. Injury 2024, 55, 111301. [Google Scholar] [CrossRef] [PubMed]
  30. Balčiauskas, L.; Kučas, A.; Balčiauskienė, L. A Review of Wildlife–Vehicle Collisions: A Multidisciplinary Path to Sustainable Transportation and Wildlife Protection. Sustainability 2025, 17, 4644. [Google Scholar] [CrossRef]
  31. Zou, Y.; Zhong, X.; Tang, J.; Ye, X.; Wu, L.; Ijaz, M.; Wang, Y. A Copula-Based Approach for Accommodating the Underreporting Effect in Wildlife-Vehicle Crash Analysis. Sustainability 2019, 11, 418. [Google Scholar] [CrossRef]
  32. Martolos, J.; Šikula, T.; Libosvár, T.; Anděl, P. Optimization of Measures to Prevent Collisions of Animals and Road Traffic. Trans. Transp. Sci. 2014, 7, 125–134. [Google Scholar] [CrossRef]
  33. Akopov, A.S.; Beklaryan, L.A. Simulation of Rates of Traffic Accidents Involving Unmanned Ground Vehicles within a Transportation System for the “Smart City. ” Bus. Inform. 2022, 16, 19–35. [Google Scholar] [CrossRef]
  34. García-Martínez-de-albéniz, Í.; Ruiz-De-villa, J.A.; Rodriguez-Hernandez, J. Impact of COVID-19 Lockdown on Wildlife–Vehicle Collisions in NW of Spain. Sustainability 2022, 14, 4849. [Google Scholar] [CrossRef]
  35. Iio, K.; Lord, D. Does Wildlife-Vehicle Collision Frequency Increase on Full Moon Nights? A Case-Crossover Analysis. Transp. Res. Part D Transp. Environ. 2024, 135, 104386. [Google Scholar] [CrossRef]
  36. Chen, S.; Cheng, K.; Yang, J.; Zang, X.; Luo, Q.; Li, J. Driving Behavior Risk Measurement and Cluster Analysis Driven by Vehicle Trajectory Data. Appl. Sci. 2023, 13, 5675. [Google Scholar] [CrossRef]
  37. Chen, S.; Piao, L.; Zang, X.; Luo, Q.; Li, J.; Yang, J.; Rong, J. Analyzing Differences of Highway Lane-Changing Behavior Using Vehicle Trajectory Data. Phys. A Stat. Mech. Its Appl. 2023, 624, 128980. [Google Scholar] [CrossRef]
  38. Ministry of Internal Affairs of the Republic of Serbia. Data on Traffic Accidents by Police Departments and Municipalities. Available online: https://data.gov.rs/sr/datasets/podatsi-o-saobratshajnim-nezgodama-po-politsijskim-upravama-i-opshtinama/ (accessed on 15 May 2025).
  39. Statistical Office of the Republic of Serbia Administrative Categorization of the Republic of Serbia. Available online: https://www.stat.gov.rs/en-US/oblasti/registar-prostornih-jedinica-i-gis/administrativno-teritorijalna-podela-i-nstj-nivoi-1-2-3/nstj-3 (accessed on 18 May 2025).
  40. Meteogram Moon Phase and Times of Moonrise and Moonset. Available online: https://meteogram.org/moon/serbia/belgrade/ (accessed on 15 May 2025).
  41. Redelmeier, D.A.; Shafir, E. The Full Moon and Motorcycle Related Mortality: Population Based Double Control Study. BMJ 2017, 359, j5367. [Google Scholar] [CrossRef] [PubMed]
  42. Parmar, V.S.; Talikowska-Szymczak, E.; Downs, E.; Szymczak, P.; Meiklejohn, E.; Groll, D. Effects of Full-Moon Definition on Psychiatric Emergency Department Presentations. ISRN Emerg. Med. 2014, 2014, 1–6. [Google Scholar] [CrossRef]
  43. Todd, J.J.; Barakat, B.; Tavassoli, A.; Krauss, D.A. The Moon’s Contribution to Nighttime Illuminance in Different Environments. Proc. Hum. Factors Ergon. Soc. 2015, 59, 1056–1060. [Google Scholar] [CrossRef]
  44. Roy, A.; Biswas, T.; Roy, A.K. A Structured Review of Relation between Full Moon and Different Aspects of Human Health. SM J. Biometr. Biostat. 2017, 2, 1007. [Google Scholar] [CrossRef]
  45. Téllez, A.; García, C.H.; Corral-Verdugo, V. Effect Size, Confidence Intervals and Statistical Power in Psychological Research. Psychol. Russ. State Art 2015, 8, 27–47. [Google Scholar] [CrossRef]
  46. Ha, H.; Shilling, F. Modelling Potential Wildlife-Vehicle Collisions (WVC) Locations Using Environmental Factors and Human Population Density: A Case-Study from 3 State Highways in Central California. Ecol. Inform. 2018, 43, 212–221. [Google Scholar] [CrossRef]
  47. Lykov, S.; Asakura, Y. Tensor Robust Principal Component Analysis with Continuum Modeling of Traffic Flow: Application to Abnormal Traffic Pattern Extraction in Large Transportation Networks. Transp. Res. Procedia 2018, 34, 187–194. [Google Scholar] [CrossRef]
  48. Saha, P.; Roy, N.; Mukherjee, D.; Sarkar, A.K. Application of Principal Component Analysis for Outlier Detection in Heterogeneous Traffic Data. Procedia Comput. Sci. 2016, 83, 107–114. [Google Scholar] [CrossRef]
  49. Statistical Office of the Republic of Serbia. Municipalities and Regions in the Republic of Serbia; Statistical Office of the Republic of Serbia: Belgrade, Serbia, 2024; ISSN 1450-9075.
  50. Ignatavičius, G.; Ulevičius, A.; Valskys, V.; Galinskaitė, L.; Busher, P.E.; Trakimas, G. Lunar Phases and Wildlife–Vehicle Collisions: Application of the Lunar Disk Percentage Method. Animals 2021, 11, 908. [Google Scholar] [CrossRef]
  51. Ji, Y.; Huang, Y.; Yang, M.; Leng, H.; Ren, L.; Liu, H.; Chen, Y. Physics-Informed Deep Learning for Virtual Rail Train Trajectory Following Control. Reliab. Eng. Syst. Saf. 2025, 261, 111092. [Google Scholar] [CrossRef]
  52. Chen, Y.; Liu, X.; Rao, M.; Qin, Y.; Wang, Z.; Ji, Y. Explicit Speed-Integrated LSTM Network for Non-Stationary Gearbox Vibration Representation and Fault Detection under Varying Speed Conditions. Reliab. Eng. Syst. Saf. 2025, 254, 110596. [Google Scholar] [CrossRef]
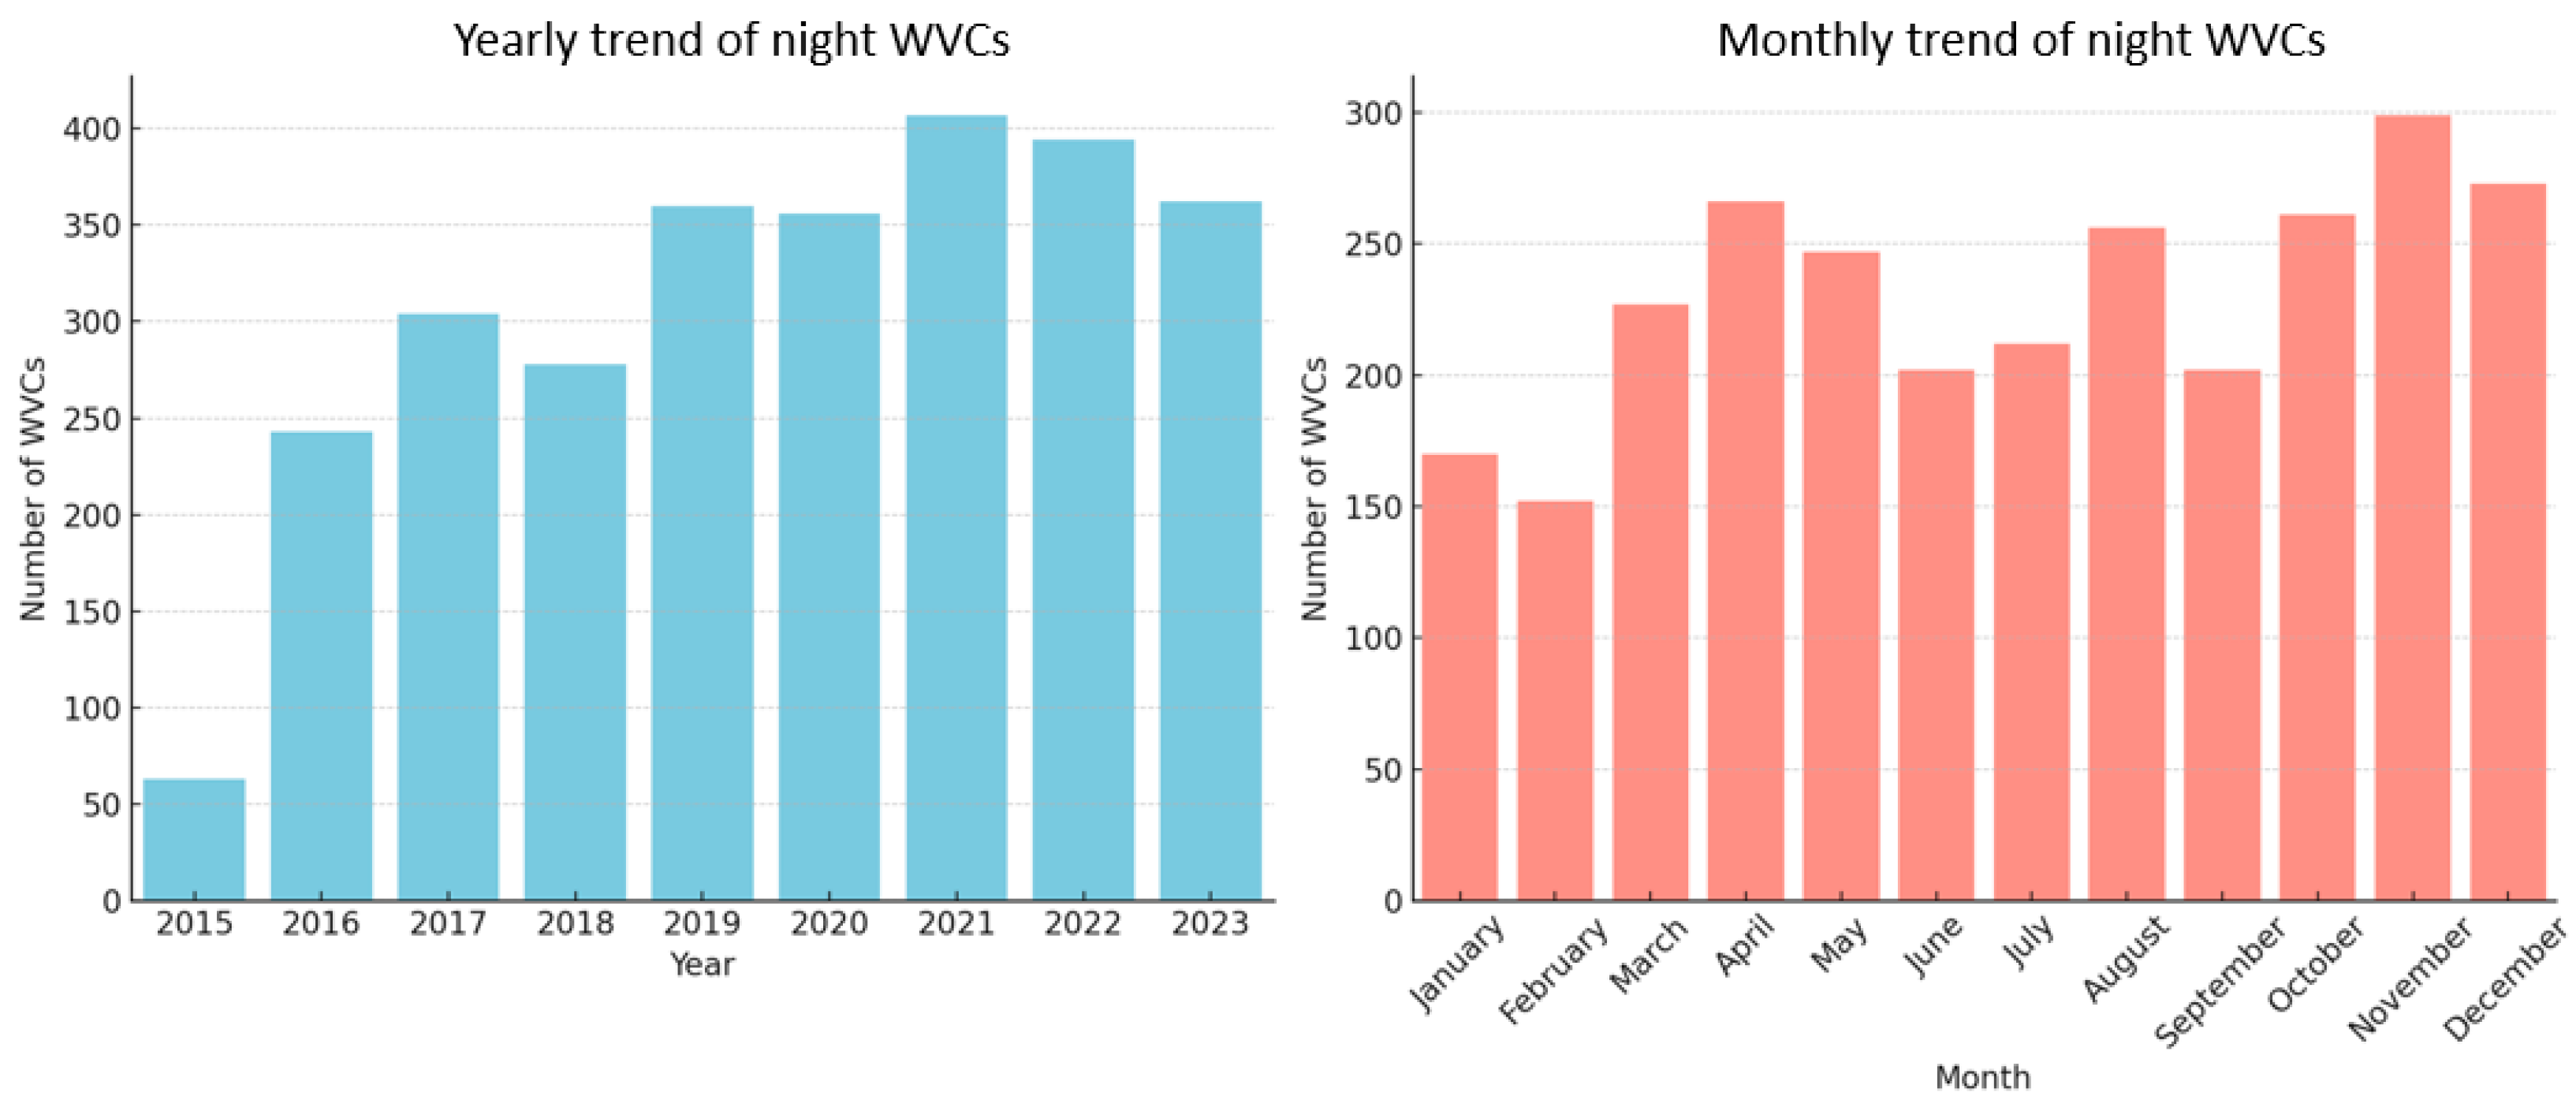
Figure 1. Yearly and monthly trends of WVCs during night.
Sustainability 17 06443 g001
Figure 2. Hourly distribution of WVCs during the day for the analyzed period.
Sustainability 17 06443 g002
Figure 3. Residual normality diagnostics.
Sustainability 17 06443 g003
Figure 4. Average number of WVCs per moon phase with 95% confidence intervals.
Sustainability 17 06443 g004
Figure 5. PCA-derived scores for districts in Serbia.
Sustainability 17 06443 g005
Figure 6. Modified risk for the administrative regions of the Republic of Serbia.
Sustainability 17 06443 g006
Figure 7. Relationship between visible moon surface, day duration, and nighttime WVCs.
Sustainability 17 06443 g007
Table 1. Annual distribution of WVCs in Serbia.
2016201720182019202120222023
New moon1471010151014
First quarter71161413119
Third quarter1098616137
Full moon816716192114
Table 2. Average annual numbers of WVCf and WVCrd in Serbia for the analyzed period.
2016201720182019202120222023
WVCf0.6671.2310.5381.2311.5831.6151.077
WVCrd0.5430.6260.6840.9641.0380.9760.906
WVCf—average wildlife–vehicle collisions during the full moon; WVCrd—average wildlife–vehicle collisions for the remaining days except for the days of the new moon, first quarter, and last quarter.
Disclaimer/Publisher’s Note: The statements, opinions and data contained in all publications are solely those of the individual author(s) and contributor(s) and not of MDPI and/or the editor(s). MDPI and/or the editor(s) disclaim responsibility for any injury to people or property resulting from any ideas, methods, instructions or products referred to in the content.