All articles published by MDPI are made immediately available worldwide under an open access license. No special
permission is required to reuse all or part of the article published by MDPI, including figures and tables. For
articles published under an open access Creative Common CC BY license, any part of the article may be reused without
permission provided that the original article is clearly cited. For more information, please refer to
https://www.mdpi.com/openaccess.
Feature papers represent the most advanced research with significant potential for high impact in the field. A Feature
Paper should be a substantial original Article that involves several techniques or approaches, provides an outlook for
future research directions and describes possible research applications.
Feature papers are submitted upon individual invitation or recommendation by the scientific editors and must receive
positive feedback from the reviewers.
Editor’s Choice articles are based on recommendations by the scientific editors of MDPI journals from around the world.
Editors select a small number of articles recently published in the journal that they believe will be particularly
interesting to readers, or important in the respective research area. The aim is to provide a snapshot of some of the
most exciting work published in the various research areas of the journal.
Establishing a sustainable production system requires a more efficient utilization of resources and the adoption of cleaner production methodologies. Specifically, industrial symbiosis promotes collaboration among interconnected industries by exchanging waste, byproducts, and utilities, thereby providing innovative ways to enhance the efficiency of production processes. However, the sustainability of agricultural products and agro-based industries is essential for human survival. This study proposed an integrated symbiotic production system that targets agro-based industries. The system includes seven plants: a sugar production plant, a corn-integrated industrial plant, an alcohol production plant, a feed production plant, a fertilizer plant, a bioethanol production plant, and a wastewater treatment plant. The study aimed to design a sustainable industrial system that shares byproducts, waste, and water reuse. Symbiotic relations between production plants are designed in a provided multi-objective optimization model that considers both the mitigation of CO2 emissions and the maximization of system profit. The multi-objective model with the epsilon-constraint method results in Pareto-efficient solutions that address the tradeoff between the objectives. This allows decision makers to select a suitable one among the solution set that prioritizes conflicting objectives. We developed ten scenarios to assess costs, revenue, profit, and CO2 emissions, offering significant insights into how model parameters affect managerial knowledge. This study also addresses environmental and economic concerns, thereby making the development of agro-based industries more sustainable.
The global population has grown steadily despite a decline in population growth. The global population is projected to rise from over 8 billion in 2024 to more than 9.7 billion by 2050 and 10.4 billion by 2100 [1]. An increased population leads to a higher demand, which in turn stimulates industrial development. Moreover, the environmental problems resulting from the increase in global industrialization have reached significant magnitudes. Since 1990, the overall amount of CO2 emissions has increased by approximately 60% [2]. International environmental legislation, such as the European Green Deal and the United Nations Framework Convention on Climate Change, restricts countries from dealing with the economy and cleaner production. Any country that engages with a different country must abide by the laws and regulations establishing trade. On the other hand, following a circular economy, instruments are necessary for a developing nation’s eco-industrial development. Industrial symbiosis is a tool used in a circular economy. It transforms waste materials and byproducts into commercially viable products. Industrial symbiosis refers to the collaborative efforts of different sectors to acquire a competitive advantage by sharing resources, energy, water, and byproducts [3]. Consequently, the utilization of natural resources has a reduced impact on the ecological system, fostering the development of more sustainable systems. As a result, integrated industries with symbiotic connections and strategically designed production systems are essential for achieving both economic and environmental goals.
Agriculture is one of the most important sectors for humans. Satisfying human primal needs such as nutrition is crucial for survival. The results show that, in an income-driven food demand case, the production of world crop calories increased by 47% from 2011 to 2050 [4]. Recent events, such as the COVID-19 pandemic, regional wars, and the anticipated impact of climate change, have highlighted the vulnerability of agriculture. These factors may cause delays in supply chain operations, such as shortages and overstocks caused by uncertain demand, high production costs, high food prices, and famine. Agriculture also affects other sectors because of its interdependency with other sectors. Therefore, the agricultural sector should be resilient to such uncertainties. Moreover, agriculture and agro-based industries should survive, considering both economic and environmental sustainability.
This study considered a symbiotic production system for agro-based industries in a sustainable framework. It presents a multi-objective optimization model that considers profit maximization and the mitigation of CO2 emissions. The proposed symbiotic system in an organized zone includes seven plants: a sugar production plant, a corn-integrated industrial plant, an alcohol production plant, a feed production plant, a fertilizer production plant, a bioethanol production plant, and a wastewater treatment plant. Byproducts from previous industries serve as inputs for subsequent production plants. This study aimed to design a sustainable industrial system that shares byproducts, waste, and water reuse. First, we concentrate on maximizing the system profit, called the base model, which has a single objective. Similarly, we solved the model for a single objective that minimizes the CO2 emissions of the system. Then, we solved the multi-objective model using the epsilon-constraint method to achieve Pareto-efficient solutions for both target objectives. We also investigate ten generated scenarios and two base models to assess the profit, revenue, cost, and CO2 emission values.
In this study, the following research questions (RQ) were considered for the sustainable design of integrated agro-based industries.
RQ-1: What are the economic and environmental impacts of the proposed system for symbiotic agro-based industries?
RQ-2: What are the impacts of the model parameters in terms of the planning horizon on cost, revenue, profit, and emission values?
RQ-3: What is the tradeoff between the profit and emission values of the proposed system?
RQ-4: What is the environmental impact of the wastewater treatment plant in the proposed system?
The main contributions of this study are summarized from several aspects as follows:
A multi-objective model ensures sustainable design for symbiotic agro-based industries considering system profitability and CO2 emission values.
Sugar and corn are the two main feedstocks used in the sugar industry. These two are concurrently considered in the design of rivalry industries, such as the sugar, alcohol, feed, fertilizer, and bioethanol industries. These industries have strategic value for the sustainable economic development of any country.
From a practical perspective, the study was conducted in Türkiye. Real and hypothetical data were used to model this system. It will be the first study to design such a system that deals with integrated industries, considering economic and environmental consequences. Moreover, changing the model parameter values allows the model to evaluate the impact of the model parameters on the cost, revenue, profit, and emission values. These findings offer significant insights into the effects of varying parameters on managerial understanding.
This study proposes a potential improvement in a sustainable system comprising agro-based industries. Reducing industrial waste and emissions can enhance economic and environmental sustainability. Furthermore, it fosters collaborative and integrated frameworks for socio-economic advancement.
The structure of this paper is as follows: Section 2 provides a background on industrial symbiosis, agriculture, and agro-based industries. Section 3 explains the system of agro-based industries, followed by the presentation of a mathematical model and computational study. Section 4 presents the results of a single-objective model. Section 5 describes the epsilon-constraint method for Pareto solutions to a multi-objective model. In this section, the generated scenarios are solved, analyzed, and compared with the base model. Section 6 concludes the study and provides a summary, limitations, and scope for further research.
2. Background
The following sections explain industrial symbiosis, agriculture, and agro-based industries in this study.
2.1. Industrial Symbiosis
Industrial symbiosis is a subset of industrial ecology in which firms engage in a mutually beneficial relationship regardless of their sector affiliation. The objective of this framework is to promote effective and cooperative utilization of resources, utilities, knowledge, byproducts, and waste materials. Industrial symbiosis (IS) functions within the context of a circular economy. This concept clarifies how a network of varied enterprises can promote eco-innovation, facilitate sustainable cultural transformation, create and exchange mutually beneficial transactions, and enhance commercial and technical processes [5]. Consequently, these efforts efficiently address waste management, pollution, and disposal challenges while generating economic benefits from waste materials, thereby revealing business opportunities that emphasize resource underutilization. Sustainable industrial production promotes the development of new synergies among industries within industrial symbiotic networks. Newly created employment can promote the advancement of new technologies and the implementation of innovative industrial processes. Furthermore, it improves communication, which enables the exchange of knowledge and skills among firms.
Industrial symbiosis is a thoroughly examined subject in the academic literature. Chertow [3], a pioneer in this field, reviewed early studies that applied industrial symbiosis to develop eco-industrial parks. An Eco-Industrial Park (EIP) is a consortium of companies situated together to enable material exchange, thereby achieving sustainability advantages for participants [6]. EIPs gain advantages from the three key dimensions of sustainability: economic, environmental, and social. Chertow [7] provides a historical analysis of the motivations and strategies for participating in industrial symbiosis, which involves the physical exchange of materials, energy, water, and byproducts among various groups of businesses. Ehrenfeld and Gertler [8] examined the industrial district of Kalundborg, Denmark, which is acknowledged as the first area to adopt industrial symbiosis strategies. They outlined and analyzed the development and interrelations among businesses. Similarly, the Ulsan District in Korea initiated a pilot project in 2005, marking one of the earliest attempts at EIPs. Park et al. [9] investigated the environmental and economic benefits of sharing water, energy, and materials in the Ulsan EIP pilot project, which consists of six industrial complexes. Assessing the benefits of EIPs based on economic, environmental, and social dimensions provides valuable information for the current state of EIPs and guides future improvements. Zhao et al. [10] evaluated the benefits of EIPs in China in terms of the circular economy and sustainability issues using a comprehensive index system. Leblanc et al. [11] assessed the potential for ecological development of a growing industrial park in Canada based on the principles of industrial ecology. Strategies to encourage industrial park development have been identified in several categories.
Susur et al. [12] performed a systematic literature study on EIP. Neves et al. [13] conducted a rigorous review of the literature. The investigation focused on potential applications and synergies within the manufacturing sectors, encompassing geography, industry type, and utilized processes. Domenech et al. [14] conducted a study on mapping existing IS projects and their attributes across European nations.
Policy-based studies explore the functions of local governments and financing strategies by scrutinizing the design of future policy frameworks [15,16,17]. Researchers categorize factors affecting symbiotic systems into economic, technical, social, organizational, and institutional categories and then analyze these impacts to develop [18,19]. In contrast, researchers have created mathematical models of IS that optimize one or several objectives, including economic, environmental, and social factors. Researchers employ a variety of methods, including agent-based modeling [20,21], qualitative methods [22], and optimization tools and algorithms such as linear programs (LP) and stochastic models [23,24,25,26]. The majority of studies have found applications in manufacturing IS systems, energy-based firms, solid waste, and water waste recovery firms, with some also finding applications in food waste and agro-production firms.
2.2. Agriculture and Agro-Based Industries
The agricultural sector provides for human needs while promoting employment and wealth. Approximately one billion individuals worldwide work in the agricultural sector, representing approximately 28 percent of the total workforce [27]. However, some countries dominate their agricultural sectors. In 2021, China constituted the predominant agricultural economy in Asia, contributing over 50% of the region’s agricultural value-added, followed by India (18.7%), Indonesia (5.7%), and Pakistan (3.3%) [28]. In European nations, agriculture holds considerable significance in Albania at 17.7% of the GDP, Ukraine at 10.6%, and the Republic of Moldova at 10.6% [29]. Moreover, Europe is the leading global producer of sugar beets, generating approximately 181 million metric tons in 2021 [30]. Similarly, the feed and sugar industries depend on corn as a crucial crop. The European Union anticipates its production volume to attain 66.7 billion metric tons by 2030 [31]. Corn is cultivated for conversion into ethanol, used as animal feed, and is produced as high-fructose corn syrup.
Agro-based production techniques generate byproducts and residues. Câmara-Salim et al. [32] examined maize stover and sugar beet pulp as possible cellulosic feedstocks. They looked at environmental and economic factors to determine how much they were worth in a biorefinery. Gopinath et al. [33] introduced a circular framework delineating the symbiotic interaction between sugar, construction, and energy by utilizing byproducts from the sugar industry. They established a system that uses the main and secondary byproducts from the sugar industry as raw materials for energy generation and sustainable construction materials. Bioethanol is a renewable energy source that reduces fossil fuel consumption and greenhouse gas (GHG) emissions. Sugar beets are an agricultural commodity that serves as a feedstock for bioethanol production. Rajaeifar et al. [34] examined waste-to-energy methodologies throughout several stages of sugar beet processing. Isler-Kaya and Karaosmanoglu [35] assessed the environmental impact of bioethanol production derived from safflower oil and molasses. The life-cycle assessment framework compared the results with those of fossil fuels. Salazar-Ordóñez et al. [36] examined the possible impact on the efficiency of sugar beet production for bioethanol and the utilization of inputs. Marttila et al. [37] examined how industrial waste heat and CO2 enrichment could be used in greenhouses to show “agro-industrial symbiosis” (AIS). Research is ongoing on alternative heating technologies, including combined heat and power (CHP), biogas, and industrial waste heat, to mitigate the environmental impacts of greenhouses.
The literature on agro-based industries concentrates on a few elements of larger systems. Using a systems engineering approach, we should consider subsystems within a larger system. Our research on promoting sustainable industrial systems is driven by the structure of agricultural products and their associated agro-based industries. Our research focuses on a sugar production plant, a corn-integrated industrial plant, an alcohol production plant, a feed production plant, a fertilizer production plant, a bioethanol production plant, and a wastewater treatment plant, with the aim of establishing a design for a sustainable industrial symbiosis system using mathematical programming and optimization techniques.
3. The System of Agro-Based Industries
This study introduces a symbiotic production system that establishes relationships between industries arising from enhanced interactions, connections, and dependencies. It addresses both economic and environmental objectives to ensure the sustainability of the industrial ecology over time. Many studies have analyzed the life-cycle assessment of the sugar manufacturing process. These studies do not have a systems engineering perspective, only an engineering approach. From a systems engineering perspective, a system must be managed by considering its external environment. The role of the sugar manufacturing system is to produce sugar. However, an industrial ecosystem is made up of sugar beets, an agricultural feedstock, and its byproducts, including molasses, beet pulp, organic wastes, and their life cycle in the following industries. This research focuses on eco-industrial development, but the system starts with raw materials such as agricultural feedstock. This study is motivated by the sustainability of agriculture and related businesses. Therefore, these two sectors guarantee sustainable growth while fostering economic and social development. This study also considered environmental sustainability in terms of emission reduction, efficient use of raw materials and byproducts, and reuse of water. Consequently, fewer products end up in landfills. The agriculture sector and integrated industries will eventually work together to establish a sustainable industrial ecology.
3.1. Problem Description and Formulation
A symbiotic system model has been designed for a symbiotic production system.
3.1.1. Symbiotic Production System
A single decision maker governs a symbiotic production system that focuses on agro-based industries. The system consists of seven plants: a sugar production plant, a corn-integrated industrial plant, an alcohol production plant, a feed production plant, a fertilizer production plant, a bioethanol production plant, and a wastewater treatment plant, all located inside a structured industrial zone. The relationship between the sugar production plant and the corn-integrated industrial plant is founded on their analogous final products and byproducts, which can be utilized for comparable subsequent production processes. The system’s general director determines the interdependent production of participating plants within a highly collaborative, organized industrial zone. Consequently, this system should continue to achieve optimal profits to ensure efficient production. Furthermore, environmental objectives must be met to ensure cleaner production and a sustainable ecosystem based on international rules, regulations, and trade agreements.
In this system, the sugar production plant and corn-integrated industrial plant are classified as first-stage plants; alcohol, bioethanol, feed, and fertilizer plants are classified as second-stage plants. The production of sugar, including beet sugar and starch-based sugar, utilizes raw materials, specifically, sugar beets and corn. First-stage plants produce byproducts and final products. Second-stage plants, however, use these byproducts and other materials to produce their final products. The planning horizon may involve storage of raw materials, byproducts, and final products in the inventory. Second-stage plants can utilize byproducts, while customers outside the industrial zone can purchase the remaining byproducts. We also market the final product to external customers. During the planning period, the system integrated a wastewater treatment facility to process wastewater. The plants direct all of their produced wastewater to a centralized wastewater treatment facility. Based on these specifications, the production facilities receive processed water. We can obtain freshwater to satisfy all the water requirements of the plants. We excluded transportation costs for byproducts moved between the first- and second-stage plants owing to their proximity within the designated area. Manufacturing facilities and wastewater treatment plants emit carbon dioxide during the production of raw materials and byproducts.
We categorized the products into three types: raw materials, byproducts, and final products. Every plant requires a particular type of raw material and ultimately produces byproducts and final products. The final products and byproducts can be used as raw materials in other operations. Agro-based industries constitute the basis for the proposed symbiotic production system, as depicted in Figure 1.
We formulate a symbiotic production system based on a multicommodity network optimization problem. In this situation, several types of commodities are transferred from the source nodes to sink nodes [38]. The commodities used in our study were raw materials, byproducts, and final products. Raw materials (sugar beet and corn) were used by the first-stage plants. The byproducts are used by second-stage plants as raw materials. Producing final products by first- and second-stage plants satisfies the market demand. The source nodes are the supply of sugar beet and corn farmers. Sink nodes are first- and second-stage production facilities as well as market demand. All sink nodes have capacity constraints similar to those of network-flow problems. The multicommodity network-flow problem considers the minimum cost. However, in our study, we consider multi-objective optimization, profit maximization, and CO2 emission minimization. In addition, our study considered a multi-period aspect. Consequently, we formulate a symbiotic production system as a special case of a multicommodity network optimization problem.
Model Assumptions
(1)
We presume that all the potential plants are inclined to engage in a symbiotic network within a structured area.
(2)
We only considered the inputs and outputs of the plants because of the lack of internal processing of the plants.
(3)
Due to the hierarchy of the system, we classified the sugar production plant and corn-integrated industrial plant as first-stage plants, while the others were classified as second-stage plants.
(4)
We calculated the unit production cost, which is 30% of the unit sales price of that product.
(5)
The plants in the symbiotic network use the byproducts produced, and they can sell the remaining products to customers outside the network.
(6)
We assumed no yield loss from raw material to final products; the conversion factors of products between the plants are known.
(7)
The maximum production capacities of plants are known.
(8)
The active sugar production plant lasts nearly 160–180 days per year (6 months). However, we consider the planning horizon to be 12 time periods per year to apply the optimization model.
(9)
We consider maintaining an inventory of raw materials, byproducts, and final products. We assume that the starting inventories of raw materials, byproducts, and final products for the initial period are zero.
(10)
We ignored the exporting and importing activities for raw materials, byproducts, and final products.
(11)
Waste disposal was ignored. We assumed that the fertilizer plant compensated for organic waste (materials).
(12)
There is no capacity restriction for the centralized wastewater treatment plant.
(13)
All the parameters (price, cost, capacity, etc.) are known and deterministic.
These assumptions allow the model to be sufficiently realistic to represent real-world processes, while also being practical for use. The index set, parameters, and decision variables are presented in Table 1.
3.1.2. Formulation of the Problem
The objective function of the model consists of two elements: system profit and environmental objectives. Objective functions (1) and (2) aim to maximize profit and minimize environmental objectives, respectively. The Profit Objective (PRO) is the primary objective that aims to maximize total profit, calculated by subtracting the total cost from the total revenue.
PRO = Total Revenue − Total Cost
The revenue is derived from the sale of byproducts generated in sugar production and corn-integrated industrial facilities, as well as the final products from all production plants, to external customers (market demand).
The costs encompass the acquisition expenses of sugar beet and corn, the production costs associated with all manufacturing facilities, the inventory costs of all raw materials, byproducts, and final products, the processing costs of the wastewater treatment facility, the costs of purchasing fresh water, and the costs of acquiring treated water for all production plants within the objective function.
The second objective pertains to environmental considerations, specifically minimizing the total CO2 emissions generated by the production processes in sugar production, corn-integrated industrial plants, and facilities for alcohol, feed, fertilizer, and bioethanol production, as well as the wastewater treatment facility.
Multi-objective linear programming model for the symbiotic production system
Descriptions of the constraints are given below in detail.
The annual amount of raw material (feedstocks: sugar beet and corn) processed in sugar production and corn-integrated industrial plants is restricted by the annual supply of each raw material in constraint (3).
The demand limitations for final products sold by sugar production and corn-integrated industrial plants are provided by constraint (4).
Demand limitations for final products sold by alcohol, feed, fertilizer, and bioethanol production plants are provided by constraint (5).
Equation (6) ensures that the amount of final products produced from raw materials in sugar production and corn-integrated industrial plants is calculated by multiplying the amount of raw material used by the conversion factor, which is the amount of final product obtained from one unit of raw material.
Equation (7) delineates the quantity of byproducts generated from raw materials in sugar production and corn-integrated industrial facilities. This is determined by multiplying the quantity of raw material utilized by the conversion factor, which represents the amount of byproduct derived from one unit of raw material.
The mathematical model allows for inventory keeping, which provides a buffer against stock-out risk. Equation (8) provides the inventory balance equation for raw materials in sugar production and corn-integrated industrial plants. The sum of the initial inventory of the raw material and the amount purchased by that plant, subtracting the amount processed in the plant during that time period, is equal to the amount of ending inventory of that raw material.
The balance equations for byproducts and final products generated in sugar production and corn-integrated industrial facilities are delineated in Equations (9) and (10), respectively. In Equation (9), the sum of the initial inventory of the byproduct and the quantity acquired from sugar production and corn-integrated industrial plants, minus the amount sold and the quantity procured from alcohol, feed, fertilizer, and bioethanol production facilities during the specified period, equates to the ending inventory of the byproduct.
In Equation (10), the sum of the amount of the initial inventory of the final product and the amount of final product produced in that plant, subtracting the amount sold to meet market demand during that time period, is equal to the amount of the final product’s ending inventory.
Equation (11) represents the wastewater that emerged after processing raw materials in the sugar production and corn-integrated industrial plants. The amount of wastewater produced is equal to the multiplication of the amount of raw material processed and the conversion factor, which is the amount of wastewater released from one unit of raw material processed in the plant.
Equation (12) represents the wastewater that emerged after processing byproducts in the alcohol, feed, fertilizer, and bioethanol production plants. The amount of wastewater generated is equal to the multiplication of the amount of byproducts processed and the conversion factor, which is the amount of wastewater released from one unit of byproducts processed in the plants.
The total volume of treated water at the wastewater treatment facility, as indicated in Equation (13), corresponds to the aggregate wastewater output from the sugar production, corn-integrated industrial plant, alcohol, feed, fertilizer, and bioethanol production facilities during each specified time period.
The total amount of treated water guaranteed by constraint (14) is less than or equal to the total amount of treated water sent to each production plant.
Constraint (15) shows that the water requirement for sugar production and corn-integrated industrial plants can be satisfied by freshwater and/or treated water.
Constraint (16) guarantees that the water requirement in each of the alcohol, feed, fertilizer, and bioethanol production plants can be satisfied by freshwater and/or treated water.
Equation (17) provides the amount of final products produced by using byproducts of alcohol, feed, fertilizer, and bioethanol production plants equal to the multiplication of the amount of byproducts used and the conversion factor, which is the amount of final products obtained from a unit of byproduct.
The calculation of the inventory balance for byproducts from alcohol, feed, fertilizer, and bioethanol production facilities is articulated in Equation (18). This balance is determined by the sum of the initial inventory of the byproduct and the quantity acquired from sugar production and corn-integrated industrial plants, minus the quantity processed during the specified period, resulting in the final inventory amount of the byproduct.
Equation (19) provides the inventory balance formula for the final products of alcohol, feed, fertilizer, and bioethanol production plants. The sum of the amount of the initial inventory and the amount of final products produced in that plant, subtracting the amount sold to meet market demand during that time period, is equal to the amount of the final product’s ending inventory.
Constraint (20) ensures that the amount of final products of the sugar production plant and corn-integrated industrial plant cannot exceed their production capacities.
Constraint (21) guarantees that alcohol, feed, fertilizer and bioethanol production plants can produce the final products up to their own capacities.
Constraint set (22) restricts the signs of the decision variables. All decision variables were non-negative and continuous.
The last constraint (23) stipulates that there is no initial inventory of raw materials, byproducts, or final products across all production facilities. During the first period, the volume of wastewater dispatched from all production plants to the wastewater treatment facility was zero, as the wastewater was prepared at the commencement of the second period. Similarly, the volume of treated water sent to all production plants was zero during the first period. The optimization model incorporates continuous variables and multiple objectives, thereby classifying it as a multi-objective linear programming model.
3.2. Computational Study
In this computational investigation, we examined a symbiotic system comprising seven distinct plants: a sugar production facility, a corn-integrated industrial plant, an alcohol production plant, an animal feed production plant, an organic fertilizer plant, a bioethanol production plant, and a centralized wastewater treatment facility. The system processes wastewater through various methods before returning it to the production plants for reuse. Should the treated water prove insufficient for the plants’ needs, they will procure the necessary fresh water. Specifically, we focus on farmers cultivating sugar beet and corn on their lands. These farmers can deliver sugar beets and corn to the sugar production plant and the corn-integrated industrial plant, where they undergo multiple processes to yield sugar and other byproducts. The alcohol, feed, fertilizer, and bioethanol production plants are capable of receiving byproducts generated by the sugar production plant and the corn-integrated industrial plant. These facilities utilize these byproducts to manufacture their final products.
Both hypothetical and real-world data were included in the model. A sugar production plant in Ankara, Türkiye, provided the field data used to calculate the parameters; the remaining industries were hypothetical. We expected that every plant would be located next to one another in Ankara’s organized industrial zone. Real sources, such as related ministries in Türkiye and shared agricultural sectoral reports, provide data for the models. Refs. [39,40,41] provide information about sugar beet, corn, and their byproducts to further the final products. Price and cost parameters are calculated from [42,43,44], and the market sales prices in June 2024, in Türkiye. The unit purchasing costs of feedstocks (sugar beet and corn) were taken from [43,44]. Sales price of beet sugar was taken from [45]. Production plants burn fossil fuels to generate electricity to meet energy needs, resulting in CO2 emissions. Production plants calculate CO2 emission values by considering the energy required for processing unit raw materials or byproducts [46]. Owing to restrictions in real data on all production and inventory costs, we estimate these cost parameters at 30% and 1% of sales prices, respectively. The data used in the application and their values are listed in Table 2. Finally, we chose the raw material supply, demand for final products, and production capacity parameters based on feasibility concerns rather than relying on other real data. Capacity of sugar production plant is derived from [47]. We chose annual sugar beet and corn supplies are both 70,000,000 tons. The water requirements for the sugar production plant is derived from Canıtez [48]. Conversion factors for the rate of wastewater generated by the plants take the values between 0.89 and 0.93 for the corresponding water usage. Furthermore, a wastewater treatment plant produces 0.88 tons of treated water from 1 ton of wastewater.
Note: Based on the average exchange rate as of June 2024, we converted Turkish liras to dollars and used the dollar unit in the cost and price parameters.
To check the reliability of the proposed multi-objective optimization formulation, the formulated model was solved using a small-sized problem instance for four months to verify that the solutions to the problem are valid and reasonable. We conclude that model implementation accurately represents the conceptual description of the model and its solution. After this process, the model was tested for the full-size integrated symbiosis system for 12 months, in which it efficiently derived the best quantities of products produced, flowed to the plants, sold, and kept in inventory. Consequently, a large number of plants across an extended planning time horizon can use this formulation.
The values and the references of the conversion factors used in the mathematical models are listed in Table 3. For example, wastes are reused as byproducts in the fertilizer production plant instead of in a landfill. Notably, 1 ton of organic waste can be converted to 400 kg of fertilizer in that plant.
4. Results of Single-Objective Models
We built a mathematical model using the GAMS programming language with version 46.5.0. The mathematical model consisted of 822 equations and 941 variables. We initially addressed single-objective models independently over a multi-period planning horizon of 12 months. The model with the single objective of profit maximization is solved within 594 iterations, whereas the model with a single objective of environmental optimization is solved within 99 iterations. Table 4 shows the results of the profit and environmental objective models over a year.
Each objective allowed for a comparison of the results. The first objective maximizes profit, and its revenue value surpasses that of the environmental objective. The second objective model minimizes CO2 emissions, but its profit value is lower than that of the first objective model. However, the production cost and CO2 emission value in the profit objective model were higher than those of the environmental objective model. Because it increases output to maximize profit. Only the storage cost of the profit objective model is lower than that of the environmental objective model. To increase revenue, the profit objective model keeps inventory low, creates more products, and sells more of them. However, the environmental objective model keeps more inventory. It generates a reduced output and meets the system’s requirement regarding environmental goals rather than profitability.
The base model constitutes a symbiotic production model, with the goal of maximizing the total profit of the system. In this model, all demand remains constant, meaning that it does not fluctuate throughout the time period.
The mathematical model provides the results for each month (12 months). Table 5 shows the annual results in tons for the base model for simplicity. The sugar production plant produced the highest CO2 emissions, the corn-integrated industrial plant had the second rank, and the wastewater treatment plant had the third rank. The sugar production plant used sugar beets, and a corn-integrated industrial plant used corn as the raw material. Beet sugar and starch-based sugar are the final products of sugar production and corn-integrated industrial plants, respectively. The remaining plants used byproducts and their final products. We realize that the sugar production plant consumes approximately 100% of the annual sugar beet supply, whereas the corn-integrated industrial plant consumes 79% of the annual corn supply. It indicates that sugar beet is a more significant feedstock in the integrated symbiotic system. Any shortage of sugar beet can affect the profitability of this system. Sugar beet is a more economical feedstock than corn. Moreover, the profitability of sugar beet usage is greater than that of corn. It stems from sugar beet being a cheaper feedstock than corn. However, the corn-integrated industrial plant produces more byproducts than the sugar production plant. It stems from corn being a higher-yield feedstock than the sugar beet. For example, one ton of sugar beets generates 0.14 ton of the final product (beet sugar), whereas one ton of corn produces 0.40 ton of the final product (starch-based sugar).
Water Consumption of the Integrated System
The water consumption of the system is analyzed through the application of a single-objective model focused on profit maximization (base model). Within this system, production facilities procure fresh water and utilize treated water to fulfill the water requirements for production processes. During the initial planning phase, treated water is unavailable due to the absence of wastewater generation at the onset of the planning period. In subsequent phases, the generated wastewater is directed to a centralized wastewater treatment facility, enabling the use of treated water for production purposes. If necessary, the production facility also acquires fresh water throughout the planning period. The model indicates an annual generation of 305,321,426 tons of wastewater, with 268,942,152 tons of treated water being allocated to the plants for reuse. The symbiotic system employs treated water for an average of 83% of the freshwater requirements. Table 6 illustrates a high percentage of freshwater usage by the sugar production plant, attributed to the substantial demand for beet sugar. Conversely, the corn-integrated industrial plant utilizes a greater proportion of treated water compared to the sugar production plant.
5. Epsilon-Constraint Method
The multi-objective optimization method offers a practical advantage for addressing real-world problems by enabling the optimization of multiple conflicting objectives. However, optimization problems involving multiple objective functions may not yield a unique solution. In situations where conflicting goals, such as profit maximization and CO2 emissions reduction, are present, a decision-making process is required to identify a compromise solution for the decision maker. In such cases, a compromise solution set is generated, resulting in multiple Pareto-efficient solutions. The notion of optimality is thus supplanted by Pareto efficiency. The Pareto method seeks to identify a set of non-dominated solutions, where Pareto-efficient (optimal) solutions are those that cannot be improved in one objective without a deterioration in at least one other objective. Figure 2 illustrates the Pareto front, depicted by the red curve, which includes the Pareto optimal solutions. The blue and green dotted solutions represent dominated (inefficient) solutions, indicating the existence of at least one superior solution for both objectives. The objective may be to identify an appropriate set of Pareto-efficient solutions, quantify the tradeoffs involved in achieving multiple objectives, or determine a single solution that aligns with a decision maker’s subjective preferences. Upon establishing the Pareto-efficient set, the user evaluates the options and selects the preferred alternative.
For multi-objective models, the most commonly utilized options are the weighting and epsilon-constraint methods. The epsilon-constraint method is recommended for generating Pareto fronts because it provides a more robust curve and avoids non-convex situations, which can be problematic with the weighted-sum method. This method also allows us to quickly alter the spacing for a Pareto front. It is easy to set the spacing that arises after a series of optimizations directly. Therefore, the epsilon-constraint method was used in this study.
The epsilon-constrained multi-objective linear programming model (-MOLPM) is constructed as
The epsilon-constraint method employs ε as a parameter, with the primary aim of profit maximization, while environmental considerations function as constraints. Consequently, the multi-objective model is transformed into a single-objective model. It is imperative to thoroughly evaluate the environmental objective value when selecting the ε value. Initially, a range was established for this parameter. Accordingly, the mathematical model was solved using an environmental objective. Ultimately, the upper and lower bounds of the parameter were determined. The epsilon-constraint method was applied across all values within this range using the solution method, resulting in efficient solutions.
We solved a multi-objective model using the epsilon-constraint method. The steps of the solution algorithm are as follows.
Step (1) At first, we decide the environmental objective as a constraint.
Step (2) We relax the feasible region to find the range for the environmental objective. We determine this range, such as the optimal minimum and maximum CO2 emission values, by solving two consecutive single-objective models: a model that minimizes the environmental objective, and a model that maximizes the environmental objective, trying to reach the limits of the values. The minimum and maximum optimal values for the environmental objective were 24,664,710 tons of CO2 and 69,944,116 tons of CO2, respectively.
Step (3) The multi-objective model becomes a single-objective model with profit maximization subject to an epsilon constraint on the environmental objective.
Step (4) Then, we narrow the single-objective model with profit maximization stepwise by changing the epsilon value in the range.
Step (5) The method consecutively solves the model by changing the epsilon values and records all the results corresponding to various epsilon values.
Step (6) The algorithm compares the current solution with the previous solutions found. If there is no alternative solution that improves at least one of the objectives of the current solution, the current solution is named as non-dominated. Otherwise, the current solution is dominated. It means that at least one efficient solution dominates the current solution.
Step (7) The algorithm continues by updating the epsilon value and resolving the model. This method finds all possible solutions for both objectives and checks if the solution is efficient or inefficient based on Step 6. The algorithm stops at the end of all possible epsilon values within the bounds.
Step (8) Finally, the epsilon-constrained multi-objective model (-MOLPM) yielded Pareto-efficient solutions.
A Pareto frontier is a collection of efficient solutions for the multi-objective model. It consists of a set of non-dominated (efficient) solutions in terms of both objectives. Thus, solutions that deal with both objectives simultaneously are created to determine which solutions are compromised. There are 28 Pareto-efficient solutions remaining from all possible solutions.
Figure 3 provides a Pareto front that consists of efficient solutions for the multi-objective model. We interpret this solution set for the multi-objective model as the compromise set between the conflicting objectives. These alternative solutions offer different CO2 emissions and corresponding profit values; thereby, the decision maker can select one of the 28 efficient solutions according to their preferences. However, environmental rules and regulations can also affect the decisions on manufacturing plans. In this situation, the decision maker can select the solution that fits the emission limits.
We investigate the efficient solutions further for a decision maker, the manager of the integrated symbiotic system. To provide additional relevant information, we calculated the profit/CO2 emissions rate. Figure 4 illustrates the profit rate for the CO2 emission value for 28 Pareto-efficient solutions that were found by solving the multi-objective model with the epsilon-constraint method. Following the initial 18 solutions, the profit/CO2 emission rate exhibits an upward trend. This means that emitting one ton of CO2 emission raises the value of profit ($). However, the rate declines after the 18th efficient solution. The profit/CO2 emission rate decreases between the 19th and the 28th efficient solutions. The decision maker considers the 17th and 18th solutions, with rates of $737/ton, as compromise alternatives to maximize profit by allowing for higher CO2 emission levels. As a result, the decision maker is more willing to consider higher rates.
5.1. Scenarios
We employed the base model with a single objective of profit maximization by generating scenarios. The base model considers constant sales prices, production costs, and demand for byproducts and final products over the planning horizon. For each scenario in various situations, we modified the parameter setup of the base model.
We developed ten scenarios that emerged under various situations, including market demand, climate change, economic instability, and regulatory framework. Specifically, developing countries with fluctuating economies are unable to adapt to climate change. Furthermore, regulatory frameworks are concerned with all countries’ commercial operations and government sites. Table 7 lists all scenarios and their descriptions.
Scenario 1 represents varying market demand for the final products (beet sugar and starch-based sugar) of first-stage plants instead of constant demand throughout the planning horizon. Scenario 2 represents the varying production costs of the beet sugar and corn industries rather than the constant production costs throughout the planning horizon in the base model. The varying production costs indicate that the inflation rate has risen in the country. Scenario 3 exhibits varying production costs of the alcohol, feed, fertilizer, and bioethanol industries over time, instead of the constant production costs of the base model. This demonstrates that production processes require higher expenditures from one period to the next, which means that the inflation rate has risen. Scenario 4 represents a higher inventory cost. All inventory costs of the base model are increased by 100% but remain constant throughout the time horizon. Scenario 5 represents a higher sales price. The sales prices of the base model increased by 100% but remained constant throughout the time horizon. Market demand and product deficiencies may affect sales prices. Scenario 6 represents the varying sales prices over time. Sales prices in the base model were constant during the planning horizon. The average sales prices of the base model and the model in Scenario 6 are equal; however, the sales prices in the model of Scenario 6 increase from one period to the following period. This situation results from the unpredictability of economic conditions. Scenario 7 represents the varying inventory costs. In this situation, inventory costs for all products increase from one period to the following period. Inventory costs in the base model were constant during the planning horizon. The average inventory costs of the base model and the model in Scenario 7 are equal; however, inventory costs in the model of Scenario 7 increase from period to period. This situation depends on uncertain market demand and requires keeping safety stocks to mitigate stock-out risk. Furthermore, climate conditions cause product prices to fluctuate, which can impact inventory management and costs. Scenario 8 represents the varying purchasing costs of feedstocks (sugar beets and corn). The purchasing costs of sugar beet and corn in the base model are increased by 100% and remain constant throughout the time horizon. Climate change influences agricultural production yield. As a result, markets maintain high prices to fulfill the demand. Scenario 9 shows a decrease in first-stage plants’ production capacities. The capacity in the base model decreased by 20%. Similarly, Scenario 10 showed a 20% decrease in the production capacity of each second-stage plant. High production costs, personnel needs, and facility investment concerns are all factors that contribute to capacity restrictions.
We illustrate the data setting for Scenario 1 with an example for beet sugar demand.
Demand for beet sugar (white sugar) = 400,000 tons/month
In Scenario 1, we retain the annual demand the same as in the base model; however, the monthly demand increases over time.
Month
1
2
3
4
5
6
7
8
9
10
11
12
Demand (tons)
344,989
356,989
368,989
380,989
392,989
404,989
416,989
428,989
440,989
452,989
464,989
476,989
We illustrate the data setting for Scenario 5 with an example for the sales price of beet sugar.
Unit sales price for beet sugar = $1060/ton.
The sales price increased by 100% and remained constant throughout the planning horizon.
Unit sales price of beet sugar (white sugar): 1060 × 2 = $ 2120/ton.
Month
1
2
3
4
5
6
7
8
9
10
11
12
Unit sales price ($/ton)
2120
2120
2120
2120
2120
2120
2120
2120
2120
2120
2120
2120
Scenario 10 is illustrated with an example of the production capacity of a bioethanol production plant. The production capacity of the bioethanol production plant was reduced by 20% that of the base model.
Capacity of bioethanol production plant = 3000 tons/period.
A 20% decrease in production capacity was equal to 2400 tons per period. This revised capacity was retained constant throughout the planning horizon.
5.2. Results and Discussion
We solved the single objective of the profit maximization model with the modified data settings for each scenario and recorded the results. Then, we compare their results with those of the base model with a profit objective. The model in Scenario 1 assumes that the demand for final products, beet sugar, and starch-based sugar is not constant throughout the planning horizon. Annual total demand was the same as that of the base model; however, monthly demand followed an increasing pattern over time. Increased demand patterns require keeping higher inventory levels. Consequently, Scenario 1’s overall profit is lower than the base model’s total profit.
The model in Scenario 2 assumes that the production costs of beet sugar and starch-based sugar fluctuate over the planning horizon. The average production costs remain the same as those of the base model; however, the production costs exhibit an increasing trend throughout the periods. Although the average production costs were the same as the base model, Scenario 2 resulted in a higher inventory cost. The first- and second-stage plants stock their final products to meet future demand. Although the total revenue is lower than that of the base model, increasing the cost pattern results in maintaining more inventories and incurring lower production costs. As a result, the total profit in Scenario 2 was higher than that of the base model.
Scenarios 3, 6, and 7 exhibit an increasing pattern of price and cost parameters. These scenarios consider varying parameter patterns throughout the periods. However, the average of the parameters is the same as that of the base model. Table 8 presents the results of the scenarios in million-dollar (m. $) and million-ton (m. ton) units.
Figure 5 demonstrates that Scenario 5 has the highest optimum profit value due to higher sales prices. The base model generated results similar to Scenarios 1, 4, and 7. Scenarios 2 and 3 imply increased production costs for first- and second-stage plants, respectively. Profit values are higher than in the base model due to increased inventory and lower production costs. The increase in profit value is greater in first-stage plants than in second-stage plants. Moreover, the annual production cost of Scenario 2 is lower than that of Scenario 3. As a result, production cost changes in first-stage plants affect the integrated system more than those in second-stage plants. Scenarios 4 and 7 pertain to the inventory cost parameters. This cost is lower than the price, and its impact on the overall profit value is less. The base model that prioritizes the environmental objective generates the lowest profit. The goal is to reduce CO2 emissions while meeting internal demand. Because sales prices follow an increasing pattern, Scenario 6 has a higher profit value than the base model. Thus, the system sells the products at higher prices. In Scenario 8, a 100% increase in the unit cost of purchasing raw materials leads to a decrease in profit.
When we evaluate the effects of capacity parameter changes on profit value, we notice that first-stage plants (Scenario 9) have a greater impact on the system than second-stage plants (Scenario 10).
Table 8 displays the optimal CO2 emission values of the scenarios. The base model with the environmental objective (BM_Env) had the lowest emission value, as expected. In Scenarios 9 and 10, a decrease in the production capacities of the plants reduced the emission value. Scenario 5 had the highest emission values owing to its high sales price and high production volume. To maximize profit, the system wants to increase its production. Therefore, the emissions values increased. The other scenarios had similar results to the base model regarding CO2 emission values.
Scenario 5 has the maximum profit owing to high sales prices, as expected. Similarly, the base model with an environmental objective has the lowest revenue, because it aims to reduce CO2 emissions. Owing to the ascending trend in sales prices, Scenario 6 exhibited a greater revenue value than the base model. Consequently, the system markets products at high prices. In terms of revenue values, the other scenarios had results similar to those of the base model. When we compare the capacity parameters to the profit value, we can see that the capacity of first-stage plants (Scenario 9) has a greater impact than that of second-stage plants (Scenario 10), and both have lower revenue when compared to the base model.
Scenario 8’s optimal production cost has the highest value because of the high purchasing cost of the raw materials. As expected, a decrease in production capacities in Scenarios 9 and 10 decreases production costs. Scenarios 4, 5, and 6 had higher production costs than the base model. Increases in unit inventory cost and unit sales prices increase the production costs. Increasing the production costs of the first- and second-stage plants reduces the overall production costs. The system generates more products at reduced prices, thereby maintaining a higher level of inventory.
Scenario 6 has the highest total inventory costs as the sales prices increase, as shown in Figure 5. The system holds more inventory to sell products at higher prices. In the base model, the environmental objective ranked second in terms of inventory cost. This scenario preserves inventories to reduce emissions rather than to maximize profits.
We compared the solutions of the generated scenarios and the base model with a profit objective. The key results of the scenarios are as follows.
Scenario 1 did not reduce CO2 emissions while maintaining 99.96% profitability.
Scenario 2 reduced CO2 emission by 0.4% while increasing profitability by 7%.
Scenario 3 increased CO2 emission by 0.03% while increasing profitability by 2%.
Scenario 4 did not reduce CO2 emissions while maintaining 98% profitability.
Scenario 5 increased CO2 emission by 1.2% while increasing profitability by 83%.
Scenario 6 did not reduce CO2 emissions while increasing profitability by 11%.
Scenario 7 did not reduce CO2 emissions while maintaining 99.8% profitability.
Scenario 8 did not reduce CO2 emissions while maintaining 68% profitability.
Scenario 9 reduced CO2 emission by 10% while maintaining 86% profitability.
Scenario 10 reduced CO2 emission by 1.1% while maintaining 98.7% profitability.
In Scenario 1, an increase in the demand for the final products of first-stage plants leads to a small decrease in profitability and no impact on the CO2 emission value. However, in Scenario 8, increasing the purchasing costs of feedstocks (sugar beet and corn) by 100% reduces profitability by 32%. Scenarios 2 and 3 exhibit the effects of increases in the production costs for the first- and second-stage plants, respectively. Increasing production costs increase the amount of inventory kept. This situation increases profitability by 7% in Scenario 2 and by 2% in Scenario 3. Changing the parameters of the first-stage plants has a greater impact than that of the second-stage plants. In Scenario 6, increasing sales prices throughout the planning horizon increases profits by 11%. We evaluated the implications of 20% capacity decreases in first- and second-stage plants in Scenarios 9 and 10, respectively. In Scenario 9, the capacity reduction in first-stage plants reduces CO2 emissions by 10%, whereas in Scenario 10, the capacity reduction in second-stage plants reduces CO2 emissions by 1.1%. Reducing production capacity in first-stage plants has significant effects on profitability and CO2 emission levels. In Scenario 6, changing the sales price pattern improves profitability by 11%, even though the annual average sales price remains the same as in the base model.
In this study, ten scenarios give insight for the managers when deciding on strategies and actions. Possible changes based on unit costs, sales prices, and monthly production capacities affect the profitability of the system. A manager can decide on appropriate actions for the possible scenarios. The system manager can evaluate the performance of the participant plants regularly according to capacity usage, resource utilization, and expenditures. Strong communication and collaboration are crucial for such integrated systems. Sugar production and corn-integrated industrial plants are crucial to the integrated system because they provide byproducts as feedstocks for second-stage processes. The results imply that any changes in first-stage plants have a greater impact on the system’s profitability than those of the second-stage plants. Financial investment to maintain actual production capacity, employee participation, and financial regulations are among the critical tasks in the case of plant capacity reduction. The findings are useful in allocating resources and requirements for annual production plans, as well as distributing workers, utilities, machines, and equipment across the companies that participated. The system manager can rotate idle staff in the required manufacturing plants. Due to the location of these plants in an industrial zone, the system manager can make resource utilization efficient. Demand-supply analysis can be useful in addressing fluctuating demand and inefficient raw material supply. Feedstock availability can be a possible problem for agro-based industries due to yield loss caused by climate issues. The situation resulted in high feedstock procurement expenses, which led to a loss. The manager can contract with the farmer for a predetermined price. The manager is able to look at a feasible production plan for the following year. The manager should arrange to achieve the business goals, such as profitability, cost reduction, capital management, and productivity improvement. Markets determine the prices and costs of the products. However, mathematical approaches can be useful to predict these parameters. Pricing and cost foreknowledge imply manageable decisions and actions take place before the expected results occur. Industrial systems must adapt dynamically to changes to improve the system’s performance measures.
6. Conclusions
Eco-industrial development in developing countries requires collaborative production that considers both economic and environmental issues. This study contributes to the existing analysis and synthesis of a broad spectrum of integrated industries. The integrated system consisted of seven plants. This study includes research on the concept of industrial symbiosis in the agricultural sector through multi-objective optimization. Conflicting objectives, profit maximization and CO2 emission minimization, were handled by addressing both objectives. We solved the model with single objectives independently, before using the Pareto front for the multi-objective model. The results of the models with environmental and profit objectives were then compared. The findings show that, compared to the profit objective model, the environmental model reduces CO2 emissions by 61%. However, we observed a significant tradeoff between CO2 emissions and profit value. This implies that a reduction in emissions is guaranteed at the expense of a larger profit margin of approximately 80%. Because there is no unique solution that is satisfied by single-objective models, we use the epsilon-constraint method, which deals with both objectives simultaneously, to obtain efficient solutions. A set of solutions that is non-dominated with respect to both objectives is known as a Pareto-efficient solution. We obtain 28 Pareto-efficient solutions, allowing the decision maker to select one of them based on his/her preferences. In addition, we calculate the rate of profit/CO2 emission for each efficient solution. We provide the value of profit ($) gained for emitting one ton of CO2 for the decision maker. On the other hand, water consumption is another significant issue for integrated industries. In this study, treated water accounted for 83% of total water usage. The use of treated water in industry is vital for water sustainability and economic sites. Such an integrated symbiotic industrial system promotes waste valorization, increases resource efficiency, and promotes regional economic development.
We created ten scenarios by considering climate change, economics, and other factors. In each scenario, all parameters are identical to those of the single-objective model with profit maximization, with the exception of one parameter change. We analyzed the scenarios and compared the results with those of a single-objective model with a profit objective. We assessed the results based on cost, revenue, profit, and CO2 emission values. Any changes in the parameters of the first-stage plants have a higher impact on system profitability and CO2 emission values than the changes in the second-stage plants. A 20% capacity reduction in first-stage plants decreases profitability by 7%, whereas a 20% capacity reduction in second-stage plants decreases profitability by 2%. If the purchasing cost of feedstocks increases by 100%, it would decrease the system’s profitability by 32%.
This study promotes collaborative and integrated approaches for creating production strategies for regional development in any country. While agriculture provides employment in rural areas, agro-based industries also provide employment opportunities in various sectors. Such socio-economic benefits build long-term wealth for individuals and society. The agricultural and industrial sectors of sugar production, as well as the corn-integrated industry, enable the development of new business models that pursue innovative and efficient solutions to economic, social, and environmental concerns. However, it is critical to assess the relationships between various agricultural products and agro-based industries to represent the socio-economic system in terms of national growth. The study provides information for future emerging sectors as well as the connections associated with current ones, revealing information that was previously hidden in the system and expediting the spread of industrial symbiotic processes.
This study considers a decision maker in charge of the symbiotic system as a whole. This is a centralized system. However, all participating plants could clearly define what they wanted to accomplish. It is a decentralized system, with more than one decision maker seeking to maximize profit. This study incorporates decentralized systems for future research. In this study, we considered the epsilon-constraint method to solve the multi-objective model. Another method, known as weighted sum, provides different weights to the objectives based on their importance. However, scalarization is required for many types of objectives. One issue with this method is determining how the weights are allocated to the objectives. All price and emission parameters were based on real data in our study. Owing to restrictions in real data on production and inventory costs, we estimate the cost parameters with a portion of the sales prices. CO2 is the major greenhouse gas (GHG) emitted by manufacturing facilities. There are many GHG gases; however, we consider only CO2 in our study due to a lack of real data about other gases.
Furthermore, we can expand our system to include many other relevant industries in future research. This study considered an annual production period of 12 months. The proposed integrated symbiotic system provides the annual cost, revenue, and emission values. In future work, the model can handle three or five years of strategic planning. However, the uncertainty in agricultural products due to climate change and economic concerns can make plans difficult to forecast. Stochastic approaches may be necessary to model such systems.
Author Contributions
Conceptualization, M.G.; Methodology, M.K.A. and M.G.; Software, M.K.A.; Validation, G.B.; Writing—review & editing, G.B. and M.K.A. All authors have read and agreed to the published version of the manuscript.
Funding
This research received no external funding.
Institutional Review Board Statement
Not applicable.
Informed Consent Statement
Not applicable.
Data Availability Statement
The data that supports this study’s findings are available on request from the corresponding author.
Acknowledgments
The corresponding author is grateful to the YÖK 100/2000 doctorate fellowship program of the Council of Higher Education (Türkiye) for the priority area, which is systems engineering.
Conflicts of Interest
The authors declare that they have no competing interests.
Ehrenfeld, J.; Gertler, N. Industrial ecology in practice: The evolution of interdependence at Kalundborg. J. Ind. Ecol.1997, 1, 67–79. [Google Scholar] [CrossRef]
Park, H.S.; Rene, E.R.; Choi, S.M.; Chiu, A.S. Strategies for sustainable development of industrial park in Ulsan, South Korea—From spontaneous evolution to systematic expansion of industrial symbiosis. J. Environ. Manag.2008, 87, 1–13. [Google Scholar] [CrossRef]
Zhao, H.; Guo, S.; Zhao, H. Comprehensive benefit evaluation of eco-industrial parks by employing the best-worst method based on circular economy and sustainability. Environ. Dev. Sustain.2017, 20, 1229–1253. [Google Scholar] [CrossRef]
LeBlanc, R.; Tranchant, C.; Gagnon, Y.; Côté, R. Potential for eco-industrial park development in Moncton, New Brunswick (Canada): A comparative analysis. Sustainability2016, 8, 472. [Google Scholar] [CrossRef]
Susur, E.; Hidalgo, A.; Chiaroni, D. A strategic niche management perspective on transitions to eco-industrial park development: A systematic review of case studies. Resour. Conserv. Recycl.2019, 140, 338–359. [Google Scholar] [CrossRef]
Neves, A.; Godina, R.; Azevedo, S.G.; Matias, J.C. A comprehensive review of industrial symbiosis. J. Clean. Prod.2020, 247, 119113. [Google Scholar] [CrossRef]
Domenech, T.; Bleischwitz, R.; Doranova, A.; Panayotopoulos, D.; Roman, L. Mapping Industrial Symbiosis Development in Europe_ typologies of networks, characteristics, performance and contribution to the Circular Economy. Resour. Conserv. Recycl.2019, 141, 76–98. [Google Scholar] [CrossRef]
Lybæk, R.; Christensen, T.B.; Thomsen, T.P. Enhancing policies for deployment of Industrial symbiosis–What are the obstacles, drivers and future way forward? J. Clean. Prod.2021, 280, 124351. [Google Scholar] [CrossRef]
Södergren, K.; Palm, J. The role of local governments in overcoming barriers to industrial symbiosis. Clean. Environ. Syst.2021, 2, 100014. [Google Scholar] [CrossRef]
Liu, Z.; Ashton, W.S.; Adams, M.; Wang, Q.; Cote, R.P.; Walker, T.R.; Sun, L.; Lowitt, P. Diversity in financing and implementation pathways for industrial symbiosis across the globe. Environ. Dev. Sustain.2023, 25, 960–978. [Google Scholar] [CrossRef]
Jensen, P.D. The role of geospatial industrial diversity in the facilitation of regional industrial symbiosis. Resour. Conserv. Recycl.2016, 107, 92–103. [Google Scholar] [CrossRef]
Bichraoui, N.; Guillaume, B.; Halog, A. Agent-based modelling simulation for the development of an industrial symbiosis-preliminary results. Procedia Environ. Sci.2013, 17, 195–204. [Google Scholar] [CrossRef]
Albino, V.; Fraccascia, L.; Giannoccaro, I. Exploring the role of contracts to support the emergence of self-organized industrial symbiosis networks: An agent-based simulation study. J. Clean. Prod.2016, 112, 4353–4366. [Google Scholar] [CrossRef]
Chertow, M.; Miyata, Y. Assessing collective firm behavior: Comparing industrial symbiosis with possible alternatives for individual companies in Oahu. HI. Bus. Strategy Environ.2011, 20, 266–280. [Google Scholar] [CrossRef]
Cao, X.; Wen, Z.; Xu, J.; De Clercq, D.; Wang, Y.; Tao, Y. Many-objective optimization of technology implementation in the industrial symbiosis system based on a modified NSGA-III. J. Clean. Prod.2020, 245, 118810. [Google Scholar] [CrossRef]
Gonela, V.; Zhang, J. Design of the optimal industrial symbiosis system to improve bioethanol production. J. Clean. Prod.2014, 64, 513–534. [Google Scholar] [CrossRef]
Huang, L.; Zhen, L.; Yin, L. Waste material recycling and exchanging decisions for industrial symbiosis network optimization. J. Clean. Prod.2020, 276, 124073. [Google Scholar] [CrossRef]
Galvan-Cara, A.L.; Graells, M.; Espuña, A. Application of Industrial Symbiosis principles to the management of utility networks. Appl. Energy2022, 305, 117734. [Google Scholar] [CrossRef]
Câmara-Salim, I.; Conde, P.; Feijoo, G.; Moreira, M.T. The use of maize stover and sugar beet pulp as feedstocks in industrial fermentation plants–An economic and environmental perspective. Clean. Environ. Syst.2021, 2, 100005. [Google Scholar] [CrossRef]
Gopinath, A.; Bahurudeen, A.; Appari, S.; Nanthagopalan, P. A circular framework for the valorisation of sugar industry wastes: Review on the industrial symbiosis between sugar, construction and energy industries. J. Clean. Prod.2018, 203, 89–108. [Google Scholar] [CrossRef]
Rajaeifar, M.A.; Hemayati, S.S.; Tabatabaei, M.; Aghbashlo, M.; Mahmoudi, S.B. A review on beet sugar industry with a focus on implementation of waste-to-energy strategy for power supply. Renew. Sustain. Energy Rev.2019, 103, 423–442. [Google Scholar] [CrossRef]
Isler-Kaya, A.; Karaosmanoglu, F. Life cycle assessment of safflower and sugar beet molasses-based biofuels. Renew. Energy2022, 201, 1127–1138. [Google Scholar] [CrossRef]
Salazar-Ordóñez, M.; Pérez-Hernández, P.P.; Martín-Lozano, J.M. Sugar beet for bioethanol production: An approach based on environmental agricultural outputs. Energy Policy2013, 55, 662–668. [Google Scholar] [CrossRef]
Marttila, M.P.; Uusitalo, V.; Linnanen, L.; Mikkilä, M.H. Agro-industrial symbiosis and alternative heating systems for decreasing the global warming potential of greenhouse production. Sustainability2021, 13, 9040. [Google Scholar] [CrossRef]
Salimifard, K.; Bigharaz, S. The multicommodity network flow problem: State of the art classification, applications, and solution methods. Oper. Res.2022, 22, 1–47. [Google Scholar] [CrossRef]
Canıtez, M. Determination of Enviromental Effects on Sugar and Sugar Beet Production Processes by Life Cycle Assessment. Master’s Thesis, Erciyes University, Kayseri, Türkiye, 2022. [Google Scholar]
Yang, L.; Zhu, A.; Shao, J.; Chi, T. A Knowledge-Informed and Pareto-Based Artificial Bee Colony Optimization Algorithm for Multi-Objective Land-Use Allocation. ISPRS Int. J. Geo-Inf.2018, 7, 63. [Google Scholar] [CrossRef]
Figure 1.
A symbiotic integrated system based on agricultural feedstocks (sugar beet and corn) and seven related industries.
Figure 1.
A symbiotic integrated system based on agricultural feedstocks (sugar beet and corn) and seven related industries.
Table 4.
Optimal results for the single-objective models.
Table 4.
Optimal results for the single-objective models.
Models
Objective Function Value (Annual)
Annual Revenue and Costs
Single-Objective Models
zPRO (Million $)
zENV (Tons CO2)
Revenue (Million $)
Production Cost (Million $)
Storage Cost (Million $)
Profit Objective Model
13,635.78
29,448,800
30,310
16,278.52
395.61
Environmental Objective Model
8054.52
24,664,711
27,670.85
14,142.12
5474.21
Table 5.
Annual results (in tons) of the base model with profit maximization objective.
Table 5.
Annual results (in tons) of the base model with profit maximization objective.
Plants *
CO2 Emission
Raw Material Used
Final Product Produced
Byproduct Produced
Byproduct Used
SPP
59,571,431
69,999,996
9,799,999
20,000,003
CIIP
22,000,000
55,000,000
22,000,000
39,050,000
EAPP
1,320,000
660,000
1,885,708
AFPP
910,000
84,000
1,200,000
OFPP
1,930,000
470,000
2,757,146
BPP
780,000
410,000
1,114,285
WTP
18,282,604
* Plants. SPP, Sugar Production Plant; CIIP, Corn-Integrated Industrial Plant; EAPP, Ethyl Alcohol Production Plant; AFPP, Animal Feed Production Plant; OFPP, Organic Fertilizer Production Plant; BPP, Bioethanol Production Plant; WTP, Wastewater Treatment Plant.
Table 6.
Percentage of types of fresh water used, wastewater generated, and wastewater reused.
Table 6.
Percentage of types of fresh water used, wastewater generated, and wastewater reused.
Percentages of
* Plants
Total Fresh Water Used
Wastewater Generated
Treated Water Used
SPP
81.14
27.40
18.88
CIIP
17.32
67.01
74.37
EAPP
0.74
2.78
3.19
AFPP
0.09
0.35
0.41
OFPP
0.17
0.81
0.74
BPP
0.54
1.64
2.41
* Plants. SPP, Sugar Production Plant; CIIP, Corn-Integrated Industrial Plant; EAPP, Ethyl Alcohol Production Plant; AFPP, Animal Feed Production Plant; OFPP, Organic Fertilizer Production Plant; BPP, Bioethanol Production Plant.
Table 7.
List of the scenarios that are generated according to the modified parameter settings.
Table 7.
List of the scenarios that are generated according to the modified parameter settings.
Scenarios
Descriptions
BM_Pro
Single objective with profit maximization (Base Model—Profit Objective)
BM_Env
Single objective with minimization of CO2 emission (Base Model—Environmental Objective)
Scenario 1
Monthly demand for the first-stage final products increases throughout the planning horizon.
Scenario 2
The unit production cost of the final products from the first-stage plants increases throughout the planning horizon.
Scenario 3
The unit production cost of the final products from the second-stage plants increases throughout the planning horizon.
Scenario 4
All unit inventory costs increase by 100% over those of the base model and remain constant throughout the planning horizon.
Scenario 5
All unit sales prices increase by 100% over those of the base model and remain constant throughout the planning horizon.
Scenario 6
Unit sales prices of all final products increase throughout the planning horizon.
Scenario 7
Unit inventory costs of all products increase throughout the planning horizon.
Scenario 8
Unit purchasing costs of feedstocks (sugar beet and corn) increase by 100% over those of the base model and remain constant throughout the planning horizon.
Scenario 9
Production capacities of the first-stage plants decrease by 20% and remain constant throughout the planning horizon.
Scenario 10
Production capacities of the second-stage plants decrease by 20% and remain constant throughout the planning horizon.
Table 8.
Results of the scenarios that are generated according to different patterns of parameters.
Table 8.
Results of the scenarios that are generated according to different patterns of parameters.
Scenarios
Profit (m. $)
CO2 Emission (m. ton)
Revenue (m. $)
Production Cost (m. $)
Inventory Cost (m. $)
BM_Pro
43,522.31
64.80
78,949.70
35,340.61
86.52
BM_Env
7680.24
24.66
27,222.82
14,068.36
5474.21
Scenario 1
43,507.99
64.80
78,949.70
35,340.91
100.52
Scenario 2
46,706.07
64.53
78,563.03
30,589.70
1267.32
Scenario 3
44,235.08
64.82
78,908.18
34,517.27
155.72
Scenario 4
43,440.06
64.80
78,949.70
35,336.36
173.03
Scenario 5
123,282.24
65.53
159,638.48
36,269.70
86.52
Scenario 6
48,293.70
64.80
92,694.24
35359.39
9041.06
Scenario 7
43,512.15
64.80
78,949.70
35,336.36
100.94
Scenario 8
29,284.15
64.80
78,949.70
49,578.79
86.52
Scenario 9
37,417.69
58.24
69,476.36
31,972.12
86.52
Scenario 10
42,966.98
64.08
77,550.30
34,496.06
87.42
Disclaimer/Publisher’s Note: The statements, opinions and data contained in all publications are solely those of the individual author(s) and contributor(s) and not of MDPI and/or the editor(s). MDPI and/or the editor(s) disclaim responsibility for any injury to people or property resulting from any ideas, methods, instructions or products referred to in the content.
Kaya Akça, M.; Gündoğan, M.; Budak, G.
An Integrated Symbiotic Production System Design of Agro-Based Industries with Profit and Environmental Objectives. Sustainability2025, 17, 6396.
https://doi.org/10.3390/su17146396
AMA Style
Kaya Akça M, Gündoğan M, Budak G.
An Integrated Symbiotic Production System Design of Agro-Based Industries with Profit and Environmental Objectives. Sustainability. 2025; 17(14):6396.
https://doi.org/10.3390/su17146396
Chicago/Turabian Style
Kaya Akça, Melike, Mete Gündoğan, and Gerçek Budak.
2025. "An Integrated Symbiotic Production System Design of Agro-Based Industries with Profit and Environmental Objectives" Sustainability 17, no. 14: 6396.
https://doi.org/10.3390/su17146396
APA Style
Kaya Akça, M., Gündoğan, M., & Budak, G.
(2025). An Integrated Symbiotic Production System Design of Agro-Based Industries with Profit and Environmental Objectives. Sustainability, 17(14), 6396.
https://doi.org/10.3390/su17146396
Note that from the first issue of 2016, this journal uses article numbers instead of page numbers. See further details here.
Article Metrics
No
No
Article Access Statistics
For more information on the journal statistics, click here.
Multiple requests from the same IP address are counted as one view.
Kaya Akça, M.; Gündoğan, M.; Budak, G.
An Integrated Symbiotic Production System Design of Agro-Based Industries with Profit and Environmental Objectives. Sustainability2025, 17, 6396.
https://doi.org/10.3390/su17146396
AMA Style
Kaya Akça M, Gündoğan M, Budak G.
An Integrated Symbiotic Production System Design of Agro-Based Industries with Profit and Environmental Objectives. Sustainability. 2025; 17(14):6396.
https://doi.org/10.3390/su17146396
Chicago/Turabian Style
Kaya Akça, Melike, Mete Gündoğan, and Gerçek Budak.
2025. "An Integrated Symbiotic Production System Design of Agro-Based Industries with Profit and Environmental Objectives" Sustainability 17, no. 14: 6396.
https://doi.org/10.3390/su17146396
APA Style
Kaya Akça, M., Gündoğan, M., & Budak, G.
(2025). An Integrated Symbiotic Production System Design of Agro-Based Industries with Profit and Environmental Objectives. Sustainability, 17(14), 6396.
https://doi.org/10.3390/su17146396
Note that from the first issue of 2016, this journal uses article numbers instead of page numbers. See further details here.


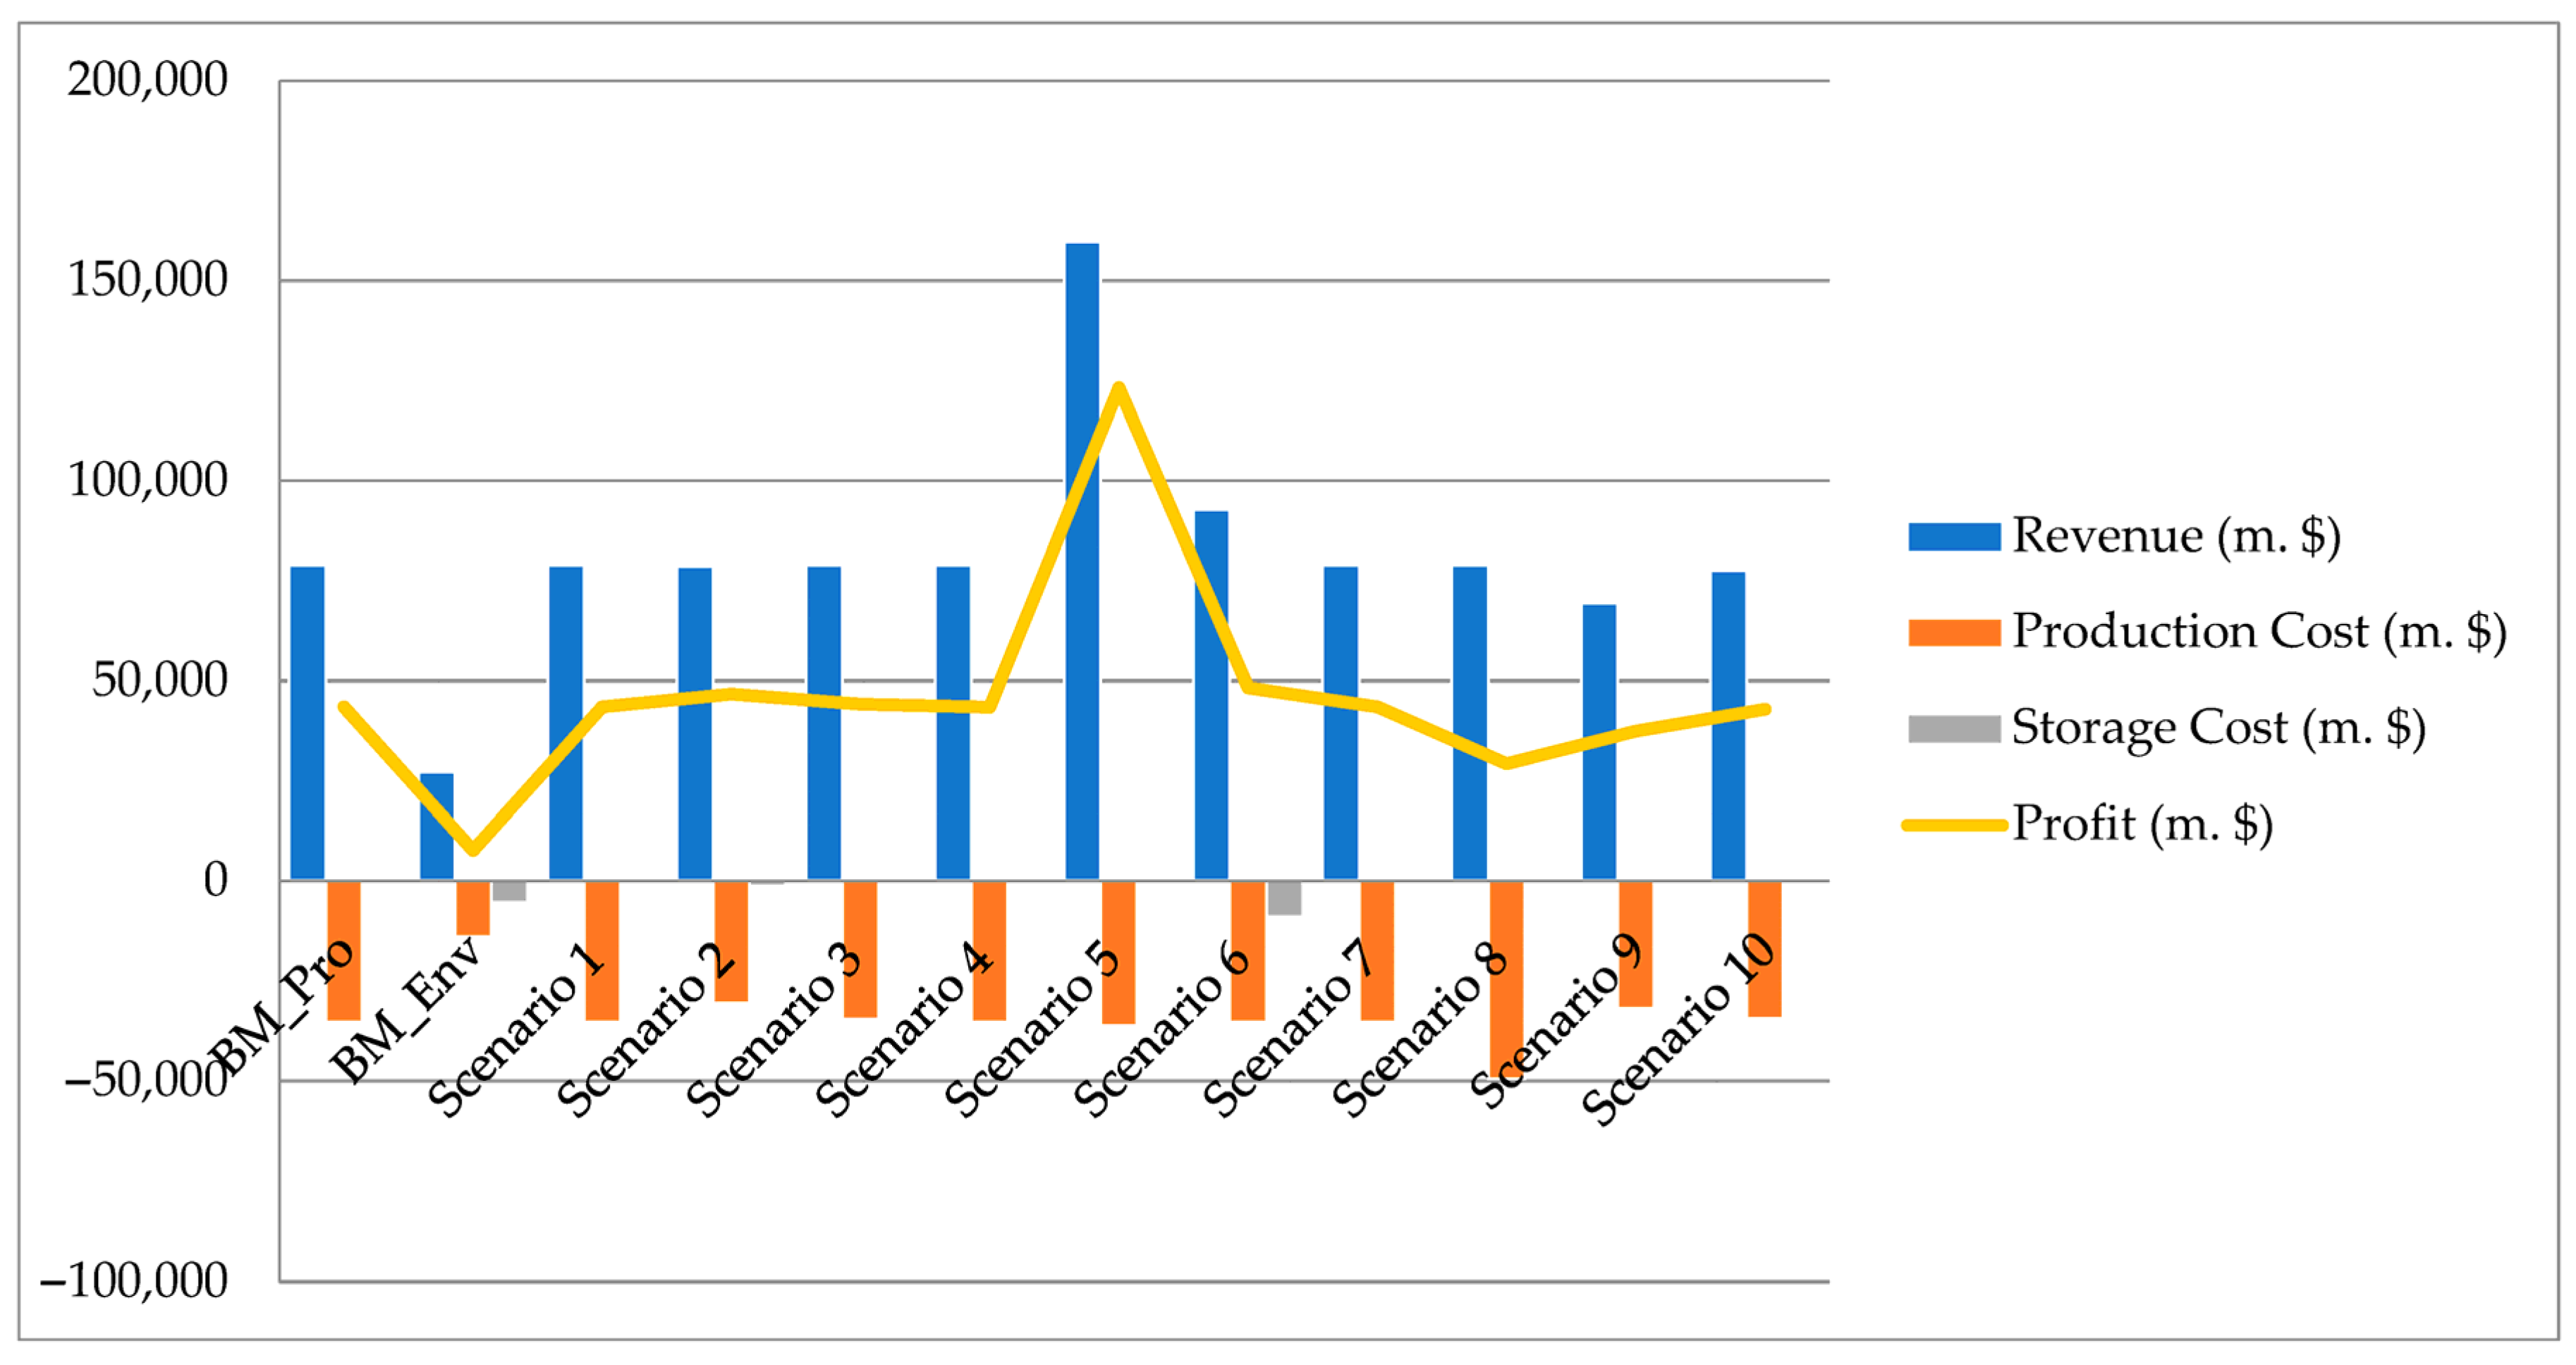
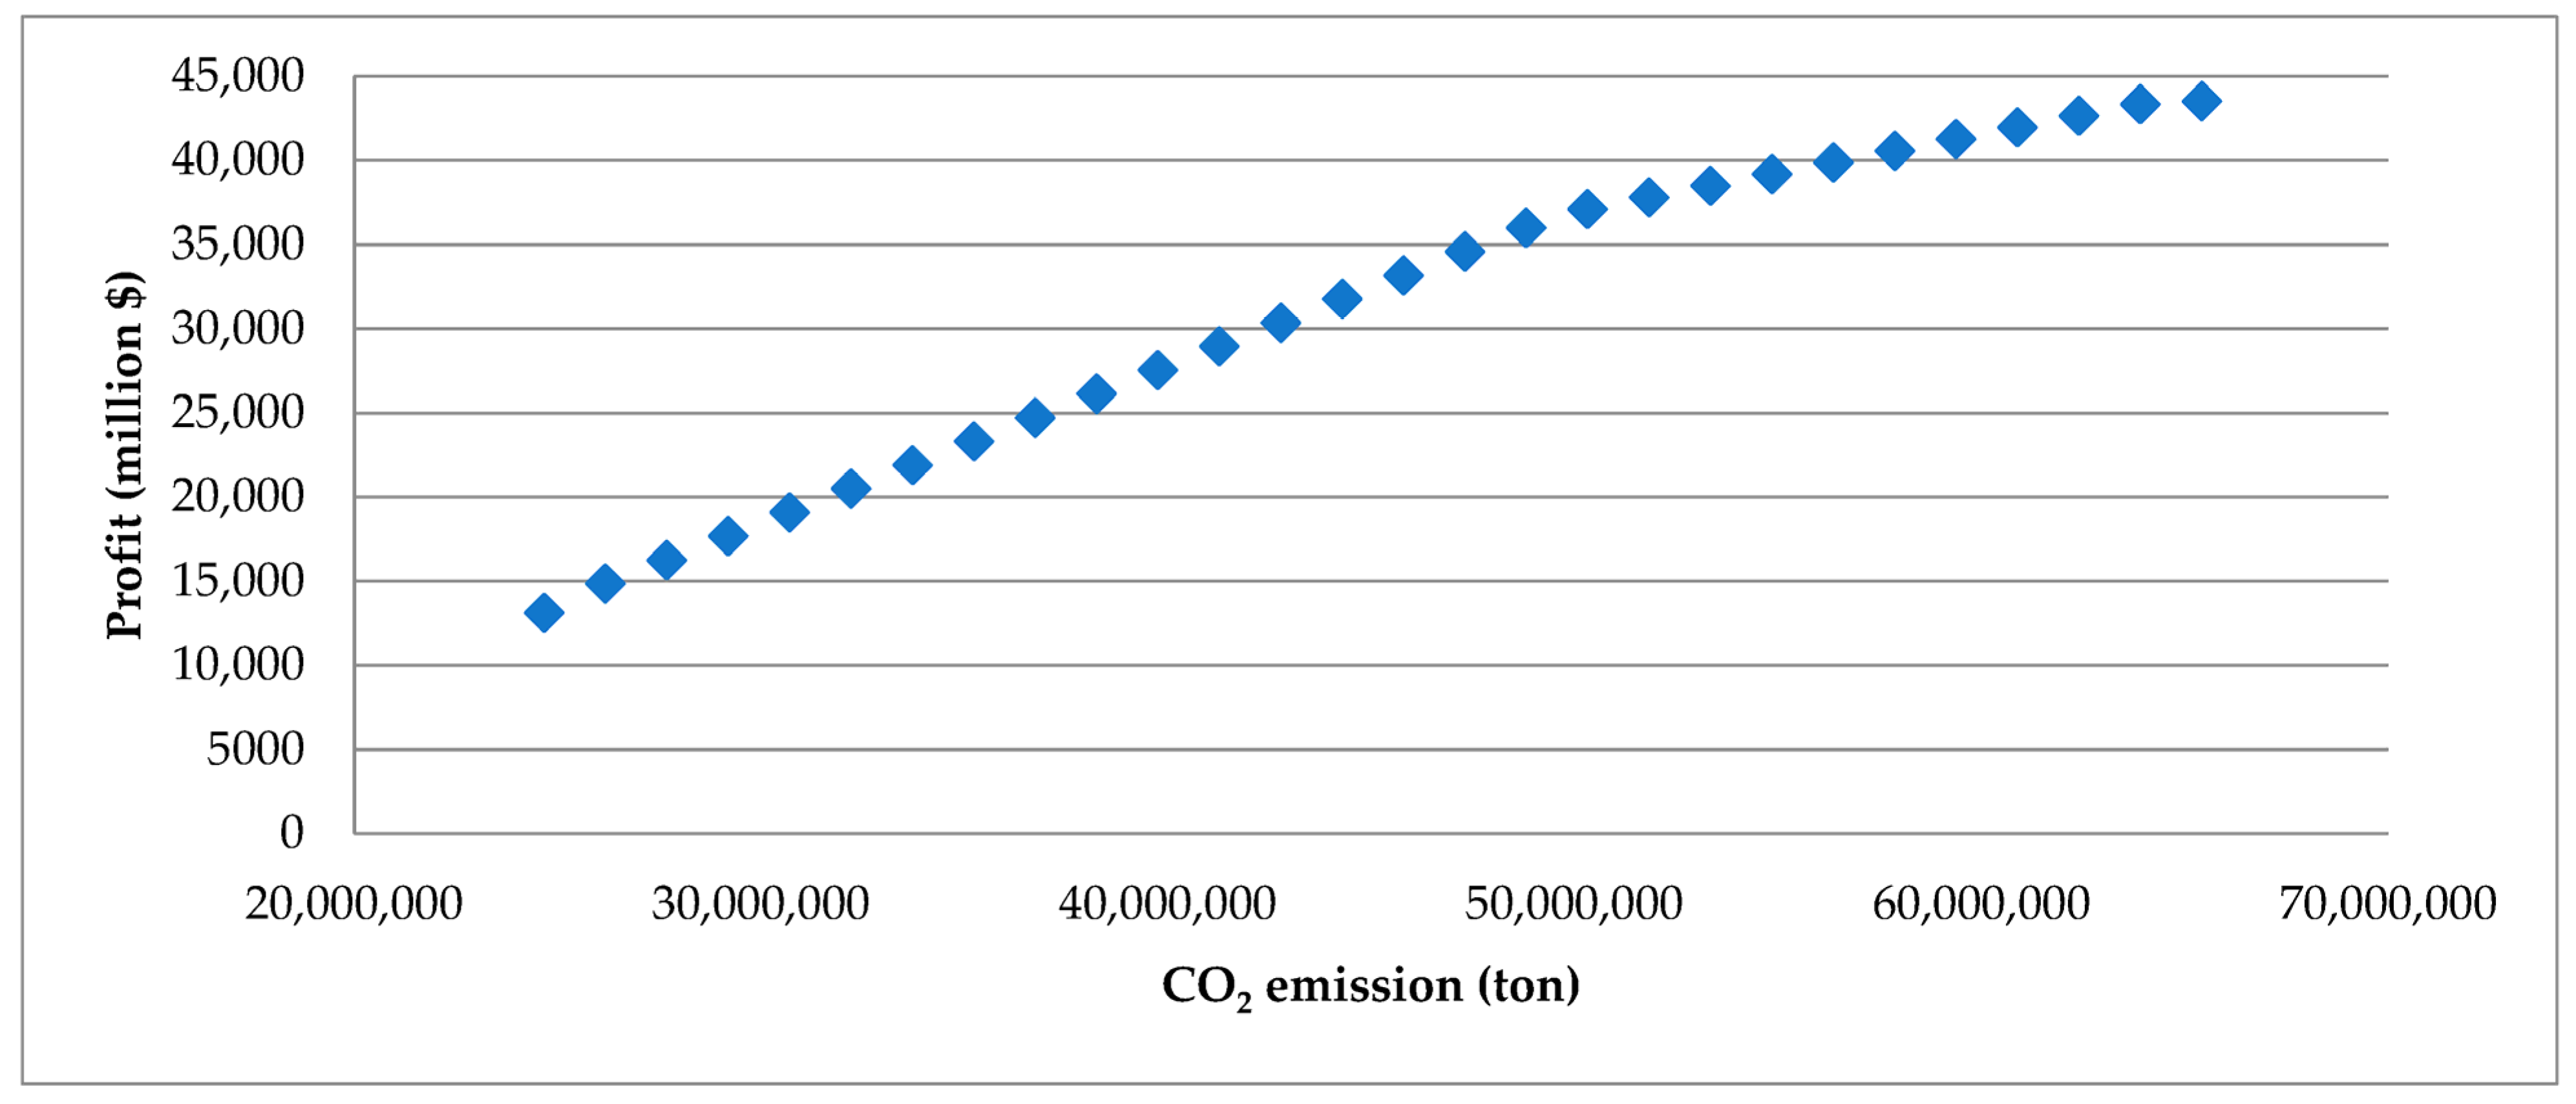
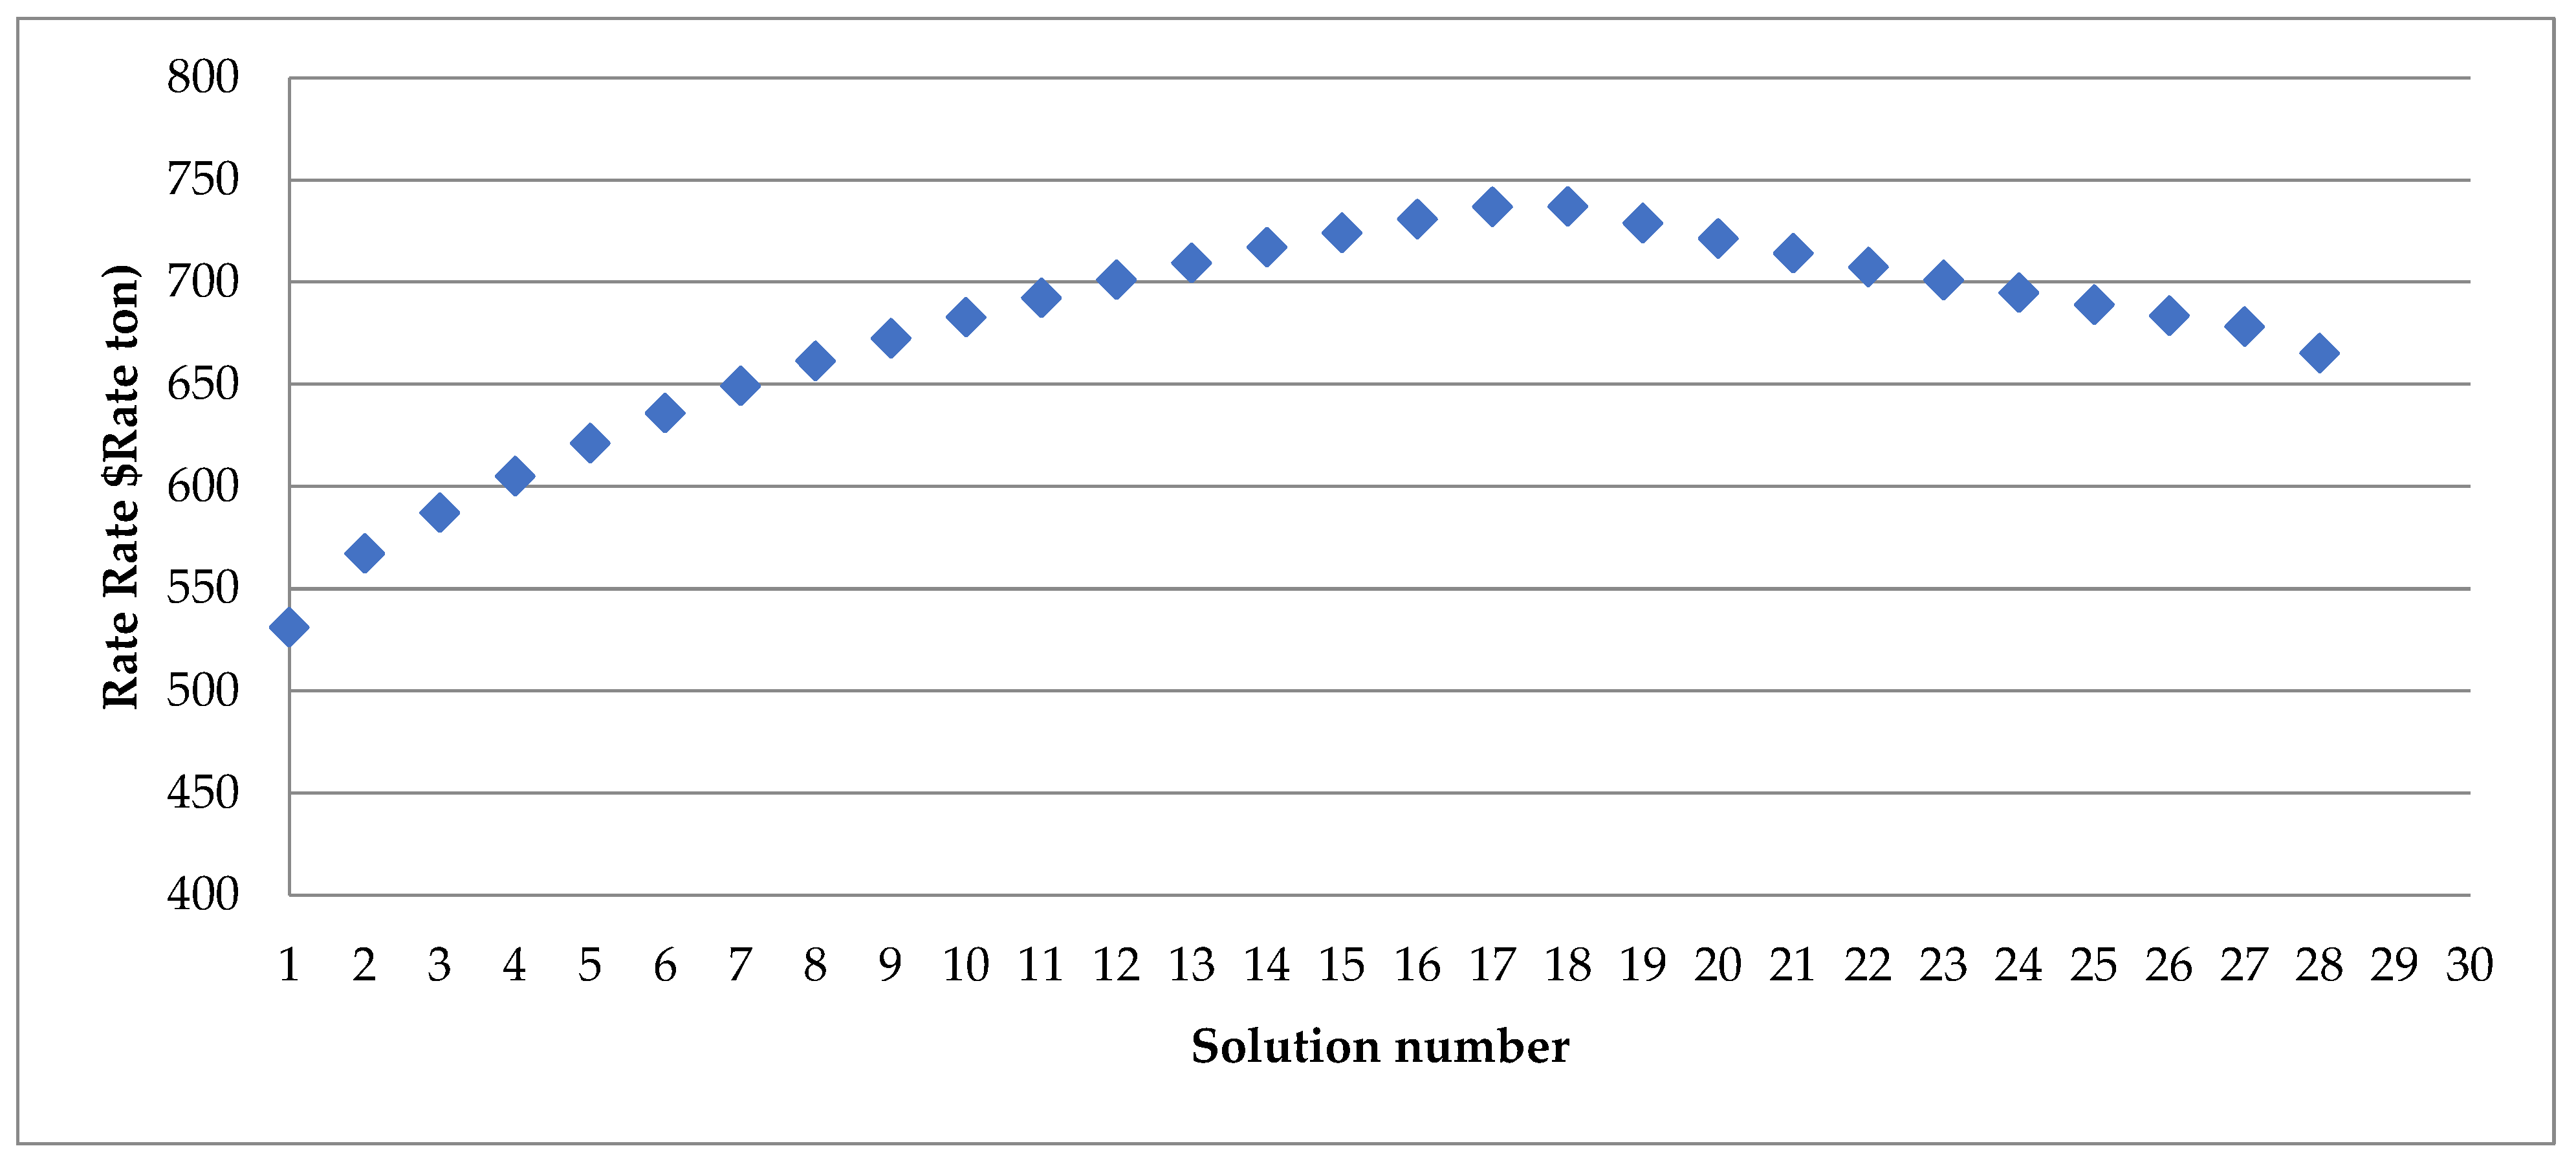
