Article

The Effects of Interventions Using Support Tools to Reduce Household Food Waste: A Study Using a Cloud-Based Automatic Weighing System

1
Graduate School of Life and Environmental Sciences, Kyoto Prefectural University, Kyoto 606-8142, Japan
2
Faculty of Regional Development, Taisho University, Tokyo 170-8470, Japan
3
Faculty of Liberal Arts, Teikyo University, Hachioji Campus, Hachioji 192-0395, Japan
4
Faculty of International Agriculture and Food Studies, Tokyo University of Agriculture, Tokyo 156-8502, Japan
*
Author to whom correspondence should be addressed.
Sustainability 2025, 17(14), 6392; https://doi.org/10.3390/su17146392
Submission received: 20 May 2025 / Revised: 1 July 2025 / Accepted: 4 July 2025 / Published: 12 July 2025

Abstract

Food waste is a global sustainability issue, and in Japan, approximately half of all food waste is generated in households. This study focused on refrigerator management behaviors aimed at using up the food inventory in the home. An intervention study involving 119 households with two or more members across Japan, with a two-week baseline period and a two-week intervention, was conducted. Target behaviors were set as “search food that should be eaten quickly,” “move it to a visible place,” and “use the foods that should be eaten quickly,” and tools to support these behaviors were selected, including an organizer for the refrigerator, photos, and food management apps. Each tool was assigned to approximately 30 households, and a control group was established. Food waste was measured using a cloud-based automatic weighing system, and all participants were asked to separate avoidable food waste at home and dispose of it in the designated waste bin. During the intervention period, the average weekly food waste per household decreased by 29% to 51% in the intervention group, while there was little change in the control group. An analysis using a two-way mixed ANOVA revealed a marginally significant interaction (p < 0.10), indicating moderate effectiveness. Among the behaviors contributing to reduced food waste, three actions—“having trouble not being able to recall food inventory at home during shopping,” “moving foods that should be used sooner,” and “organizing refrigerator”—showed significant interaction effects (p < 0.05) in a two-way mixed ANOVA, indicating the effectiveness of the intervention.

1. Introduction

1.1. Background

According to the United Nations Food and Agriculture Organization (FAO), one-third of the world’s food production is wasted [1], and in developed countries, more than 40% of food waste (see Note 1) occurs at the retail and consumption stages. Reducing food waste at the retail and consumption stages by half by 2030 is one of the United Nations Sustainable Development Goals (SDGs) [2]. Food waste occurs at all stages of the supply chain, but when food is discarded at the final stage of the supply chain in households, the energy that has been invested in its production, processing, transportation, cooling, and cooking is also wasted [3]. Reducing household food waste is important for achieving Sustainable Development Goal 12.3. Food waste is also an important issue in Japan. In 2019, the Act on Promotion of Food Loss and Waste Reduction was passed, calling for food waste reduction efforts by the national government, local governments, businesses, and consumers. Among these, local government policies are expected to play an important role in reducing food waste [4]. In Japan, it is estimated that approximately 4.72 million tons of food waste were generated in the 2022 fiscal year, with half of that amount (2.36 million tons, or 50%) coming from households [5].
Previous studies on the causes of food waste generation in households and consumer behavior have identified various behaviors that influence food waste generation, including unplanned shopping, improper storage methods, forgetting about food items in the refrigerator, inadequate management of leftovers, and overcooking or leaving food uneaten during consumption [6,7]. Various actions have been proposed to reduce food waste in response to these factors, but among these, refrigerator management actions aimed at using up stored food differ from other actions such as shopping behavior or improvements in storage and cooking methods. Refrigerator management actions directly lead to waste if unsuccessful and are particularly significant because they target food waste components such as unused ingredients and leftover food in refrigerators, thereby having the potential for a substantial impact [8,9,10]. Furthermore, while many initiatives to promote food waste reduction in households are information-providing in nature [9,10,11], informational interventions are generally considered to have limited effectiveness [11,12,13]. Therefore, this study focuses on refrigerator management behaviors aimed at reducing food waste by using up foods in households and through interventions that are not informational.
Note 1: In this paper, we use “food waste” to mean “avoidable food waste”, unless specifically stating “including unavoidable parts”.

1.2. Literature Review

1.2.1. Intervention Using Tools for Refrigerator Organization

One example of a non-informational intervention targeting refrigerators is the provision of tools that can be used for refrigerator organization. Farr-Wharton et al. [14] conducted an intervention study using color coding, an approach that involves assigning specific storage locations for different types of food and improving spatial awareness. While this intervention with color coding was reported to reduce waste, the study did not include a control group in which only measurements were conducted, and the intervention was not implemented. Waste discarded by seven households over two weeks before and after the intervention was observed, and qualitative evaluations based on interviews were conducted. An intervention study by Boulet et al. [15] using “USE IT UP” tape involved marking spaces for foods that needed to be consumed. By attaching the “USE IT UP” tape to foods that needed to be used to make them more visible, participants were encouraged to use those foods in their refrigerators. The results from 76 households who responded to the pre- and post-surveys showed a significant reduction in food waste, but no significant differences were observed in behaviors that could have led to reductions in food waste. The amount of food waste was estimated based on weight conversions from survey responses, and no control group was established. Cooper et al. [16] conducted a study using the intervention program “Use-up day and Flexible recipes,” in which participants chose a day and utilized provided recipe information to use foods that were likely to be discarded. They carried out a second study providing participants with either a storage basket (“Collect”), tag (“Tag”), or memo magnet board (“Track”) as tools to highlight foods that should be used, while setting a condition in which participants could choose one of the three tools within the Use-up day program that was utilized in the first study. The additional study was conducted with a control group. Data from 909 households who completed the surveys showed that the intervention group achieved an average reduction of 33.4% between the pre- and post-intervention stage and an average reduction of 26.5% compared with the control group, with statistically significant interaction effects. However, there was no observable additional effect of the provided tools for the Use-up day program. The amount of food waste was estimated based on responses to weekly questionnaire surveys.
An intervention study by van Herpen et al. [17] used a package of nine tools designed to assist with all stages of food management, from planning to consumption. The tools included refrigerator and freezer stickers, an app providing information on expiration dates, and a leaflet on how to use the refrigerator. In the first study (n = 150), food waste was reduced by 39%, and the tool package was found to significantly reduce food waste. In the second study (n = 279), a control group was established to measure and verify the effectiveness of the tool package. Food waste decreased by 23%, but the reduction was not statistically significant, although a trend toward reduction was observed. Participants were free to use the tools as they saw fit, and some chose not to use them at all. Food waste was self-reported through pre- and post-surveys. In a study by van der Werf et al. [18] focusing on the “Reduce Food Waste, Save Money” campaign, participants received five emails about the negative impacts of food waste and information on how to reduce it, along with a package of refrigerator-friendly items such as freshness-preserving containers, magnets, and stickers; a control group (n = 58) was also established. The intervention effects showed significant interaction and a 30% reduction in food waste. Food waste quantities were measured through household garbage collection and composition analysis, but the effectiveness of individual items was not evaluated. van Herpen et al. [17] reported a significant reduction in food waste in their first study, but the measurement of food waste was based on self-reports, and the empirical evidence supporting the results was not strong. Additionally, refrigerator management tools were related to food storage methods and expiration date management, and their use was optional for participants, so the impact of individual tools on behavior was not clearly defined. The study by van der Werf et al. [18], which included a control group and measured food waste by weight, provided results that were statistically significant and reliable. However, the intervention involved a combination of continuous informational intervention, the provision of tools, and prompt-based interventions such as magnets and stickers; the authors did not evaluate the effects of environmental changes that increase the visibility of foods that should be used. Studies by Farr-Wharton et al. [14] and Boulet et al. [15] suggested the effectiveness of interventions that change the environment inside the refrigerator, but Cooper et al. [16] found no additional effects on regular consumption habits. In addition, none of these studies directly measured food waste by weight, meaning that the effects based on weight are not fully clear. Environmental change interventions have been reported to be effective in promoting recycling behavior [19]. Verifying the effects of food waste reduction interventions based on measured weight would be useful.

1.2.2. ICT-Based Interventions Targeting Refrigerators

To properly manage refrigerators in order to use up stored food, it is necessary to manage various types of information related to shopping, storage, cooking, etc. Since consumers are likely to find information management burdensome, interventions utilizing ICT tools are expected to be effective as non-informational interventions.
ICT-based interventions using smartphones, which are widely used, can be implemented through devices that consumers always carry with them. For example, app notifications, recipe features, and checking photos or information in apps on smartphones while shopping can serve as prompts. By providing information when needed, time and effort are reduced, opportunities for action are created, and abilities such as knowledge of inventories and expiration dates can be improved. Additionally, ICT-based tools can reach consumers across all sectors of society, making them a powerful tool for policy implementation [20].
Farr-Wharton et al. [21] conducted an intervention study involving the use of food management and food-sharing apps. The food management apps used were FridgePal and EatChaFood, with four households participating in each over three weeks. Participants reported that the apps helped reduce their food waste, suggesting their effectiveness during the shopping stage. The apps’ food inventory lists and photos of the refrigerator were found to be effective in improving knowledge of food inventories, and the ability to manage inventory information in real time using mobile devices was cited as an advantage. However, the evaluation was qualitative and based on a small sample size, and while questions were raised about the apps’ impact on reducing food waste, the actual amount of food that was wasted was not evaluated. In an evaluation of the usability and effectiveness of ICT tools by Vogels et al. [20], 28 participants were divided into three groups based on three different apps for three weeks. Two apps were comprehensive apps that included inventory management, reminders, shopping lists, and recipes, while the remaining one was a shopping-list-specific app. Focus group interviews were conducted, but food waste quantities were not investigated. None of the apps demonstrated effectiveness in terms of influencing behaviors relating to self-reported food waste (such as meal planning or shopping). In a pilot study by Mathisen et al. [22] using the food management app TotalCtrlHome and involving six students, app use was reported to increase participants’ awareness of food waste. Food waste quantities were measured by participants using kitchen scales. However, with only six participants, no significant reduction in food waste was observed. A review of interventions by Swanell et al. [23] cited a study involving two apps, Cozzo (11 participants) and Nosh (36 participants), which included features such as notifications for foods nearing their expiration dates, inventory knowledge, and recipes using available ingredients. The group using the Cozzo app reported reductions in food waste compared with other groups. Food waste was measured through a waste audit; however, no control group was established. It was unclear how the evaluation was conducted and whether the reduction was due to the use of the app or not.
Other ICT tools besides apps were discussed in a study by Ganglbauer et al. [24], who used a refrigerator camera (FridgeCam). The study was designed to help participants access images of their home refrigerators, mainly via mobile devices, and use them to think about their shopping plans and eating habits. The one-month study involved a qualitative evaluation of five households. Some participants reported that the tool was helpful for shopping and inventory management, but the quantity of food waste was not evaluated. The aforementioned study by Farr-Wharton et al. [14] was a qualitative study using the same refrigerator camera (FridgeCam) and involving only four households; the camera images provided location information that was evaluated as useful for inventory management. Food waste was registered weekly by having participants record the number and contents of expired products and dispose of them in a designated waste bin, but no quantitative analysis was conducted.
Within research on app-based interventions, the studies by Farr-Wharton et al. [21] and Vogels et al. [20] only used qualitative surveys and did not measure food waste quantities. In a study by Mathisen et al. [22], food waste was measured, but the sample size was small, and the results were not statistically significant. In studies reviewed by Swanell et al. [23], food waste quantities were measured through waste audits, but the analysis methods were unclear. Research using apps has suggested that food waste may decrease, but there are no studies with appropriate measurements or reliable analyses. Additionally, two studies using refrigerator cameras, by Ganglbauer et al. [24] and Farr-Wharton et al. [21], suggested some effectiveness, but quantitative evaluations were not conducted.
Based on our review, while ICT-based tools showed potential effectiveness, no studies have quantitatively evaluated food waste levels by measuring actual waste and establishing control groups.

1.2.3. Measurement of Food Waste and Evaluation of Interventions

The necessity of characterizing and quantifying food waste in a reliable and effective manner has been pointed out in previous studies [11,25,26,27]. In intervention studies on consumer food waste, while research designs with pre- and post-intervention studies are commonly adopted, few include control groups or quantitative evaluations [13].
As discussed in Section 1.2 and Section 1.3, one of the major challenges in previous intervention studies on household food waste was the difficulty of measuring food waste quantities by weight. The need to characterize and quantify food waste quantities using reliable and valid methods has been highlighted in previous studies [11,25,26,27]. Methods for measuring food waste include surveys, food waste diaries, photography or observation, direct measurements, waste composition analyses, and the use of secondary data. However, the units that are used to report food waste quantities vary widely. Additionally, establishing rules regarding whether discarded items are potentially avoidable or not has been challenging, making comparisons difficult at present [27,28,29]. Furthermore, evaluations of the reduction effects of interventions that are aimed at reducing household food waste generation have mostly been conducted through self-reported data from participants. However, diary-based measurements have been considered problematic for tracking food waste quantities due to issues such as under-reporting and measurement biases [26,28]. Direct measurement by participants is generally accurate but may be influenced by feedback from self-measurement. However, it has been suggested that this influence can be mitigated by minimizing interaction with households [26]. Additionally, the effects associated with self-reported measurement methods for household food waste can be mitigated by carefully selecting control groups [26]. Measuring food waste through a waste audit is objective and considered ideal, but it faces challenges such as costs, difficulties in addressing geographically dispersed survey sites, and logistical and methodological issues [26,30,31], making its adoption relatively challenging. As noted in Section 1.2 and Section 1.3, most previous intervention studies on household refrigerator management have not analyzed the effects of interventions based on actual measurements of food waste by weight. Additionally, while establishing a control group is desirable [32] to objectively evaluate intervention effects, few studies have conducted analyses with a control group.

1.3. Purpose of This Study

Based on the above review, interventions that encourage consumers to change the environment inside their refrigerators by providing them with tools to highlight foods that should be consumed quickly, as well as interventions that utilize ICT tools to support inventory management, are expected to be effective. However, no studies have been found that measure food waste quantities, compare them with a control group, and analyze the results, making it necessary to quantitatively verify the effectiveness of interventions.
This study focused on the management of refrigerators at home and aimed to reduce food waste generated in households. Therefore, the objective of this study was to quantitatively evaluate the effects of the abovementioned interventions using measurement data on food waste by weight, in both intervention and control groups, and to clarify their impact on related behaviors.
This study was conducted with a total of four groups: three intervention groups corresponding to three support tools and one control group. Additionally, to minimize bias in measuring the weight of food waste by participants who were widely dispersed across a large area, this study adopted a new method of directly measuring the food waste generated in households using dedicated food waste bins and a cloud-based automatic weighing system. The effects of measurements on household behavior were also verified. Details of the measurement method are described in Section 3.3.

2. Intervention Design

2.1. Theoretical Framework for Intervention Strategies

In this study, we adopted the MOA framework as our theoretical framework [33], which posits that motivation, opportunity, and ability are necessary for behavioral change. The MOA framework is considered applicable to food waste reduction behavior, and it has been used as a theoretical framework for designing intervention strategies aimed at reducing food waste among consumers, with studies reporting significant reductions in food waste [16,17,34,35].
In previous studies on consumer food waste, the MOA framework has been considered to identify barriers to implementation, including environmental structures (opportunities) and skill or knowledge gaps (abilities), in addition to motivations for setting specific goals. Motivation is further categorized into factors that drive intention setting, such as behavioral intentions, values, attitudes, subjective norms, needs, and habits [34,36].
In this study, we utilized the MOA framework to design intervention strategies for behavioral change aimed at reducing food waste. This involved using informational interventions to promote behavioral intent and combining them with non-informational interventions.

2.2. Target Behaviors in the Intervention

To reduce food waste in households, we identified three specific behaviors that participants should adopt as part of their refrigerator management: “search for food that should be eaten quickly”, “move it to a visible place”, and “use the food that should be eaten quickly” (hereinafter referred to as the “Three Steps”). The actions included in the Three Steps simplified refrigerator management by creating a simple sequence of actions: finding food in the refrigerator, moving it, and using it. These actions were selected based on existing studies, which demonstrated that they were easy to implement, had potential for widespread adoption, and were effective [10].
Figure 1 shows the process of how the target behaviors affected food waste reduction. Participants in the intervention group used the assigned support tools to practice the Three Steps for managing their refrigerators. The use of support tools was expected to encourage refrigerator organization, leading to increased inventory knowledge through the actions of finding foods that should be eaten quickly (Step 1) and moving them to visible places (Step 2). Increased inventory knowledge was then expected to prevent over-buying and promote food usage (Step 3), leading to food waste reduction. There was no causal relationship between each step, and each action was independent; however, it was assumed that actions on the right side were supported by actions on the left side.

2.3. Intervention Method 1: Information Provision

For the informational intervention, information on food waste issues and their impact on the environment was provided to participants in the intervention group through an information session and leaflet distribution to increase motivation.
At the information session, the current situation of household food waste, its impact on the environment, and the importance of reducing food waste at home were explained. Examples of similar initiatives that have reduced food waste by more than 40% in the past were shared to add information that enhanced participants’ sense of the effectiveness of these efforts. The importance of refrigerator management for reducing food waste and the use of the Three Steps of “search, move, and use” to easily implement this were explained. Detailed instructions on the use of the support tools were provided. The leaflet included information on the benefits of reducing food waste, such as saving money.

2.4. Intervention Method 2: Support Tools

For the non-informational interventions, three tools to assist participants in practicing the Three Steps, the target behaviors for refrigerator management, were selected. The circumstances surrounding food waste generation, as well as lifestyles, vary among households. Hence, we selected three tools that could provide opportunities and abilities for actions under the MOA framework, so that the range of situations in the different households could be accommodated. In this study, we focused on the effectiveness of interventions and formulated hypotheses focusing on the relationships between interventions and behavioral changes, interventions and food waste reduction, and behavioral changes and changes in the amount of food waste.

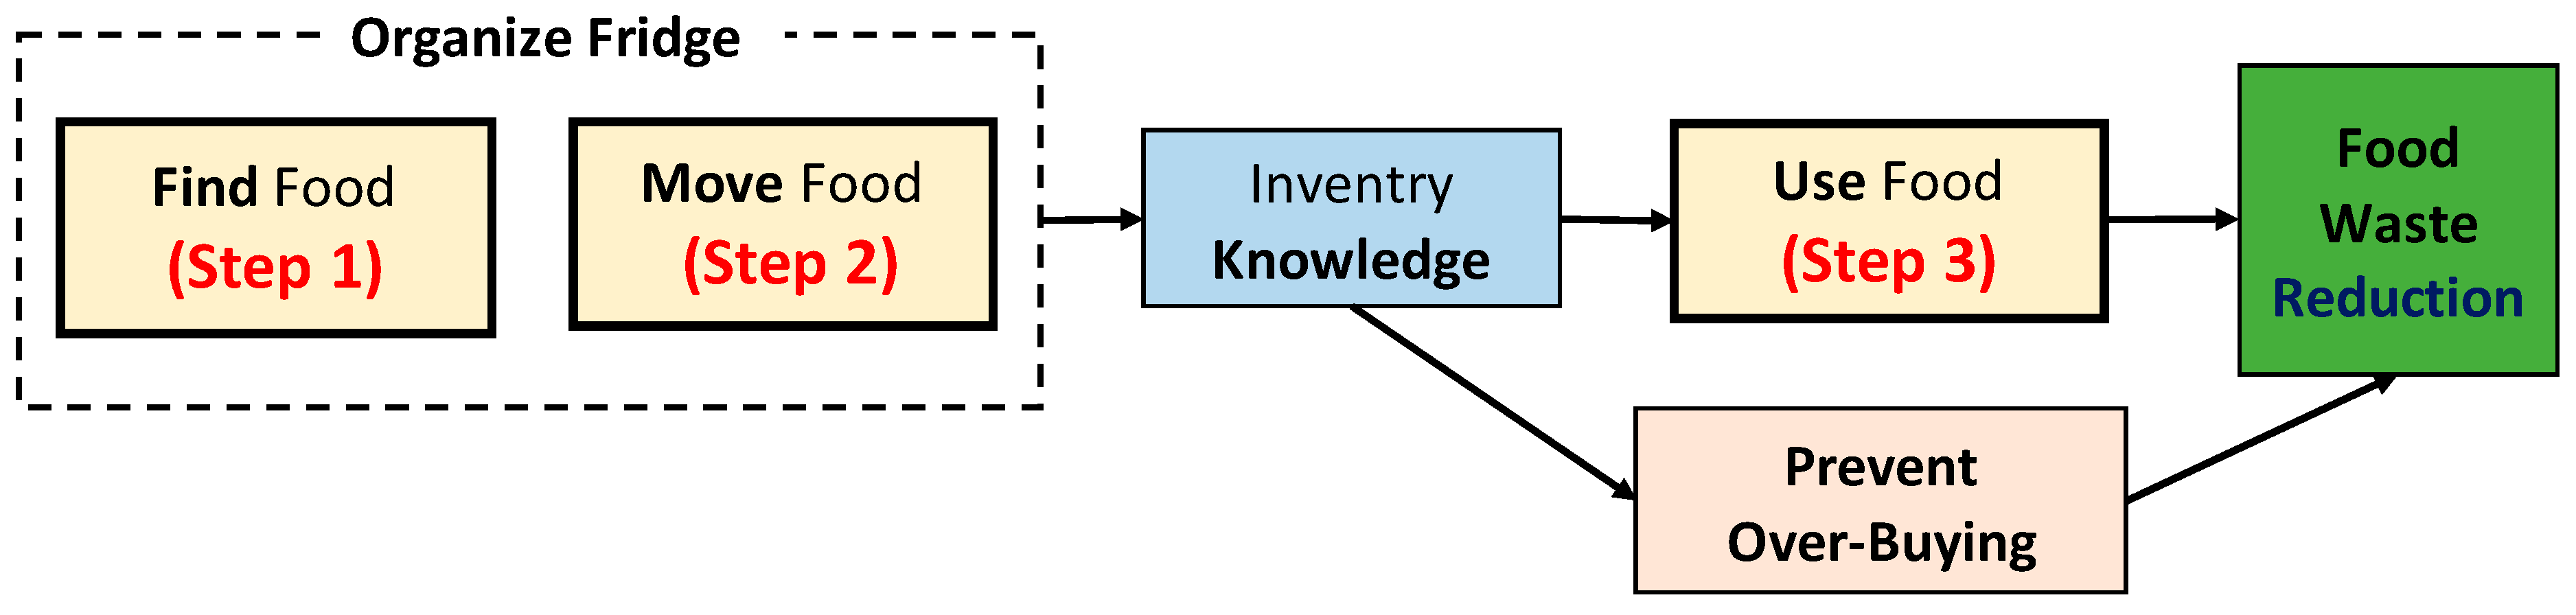
2.4.1. Refrigerator Organization Tools
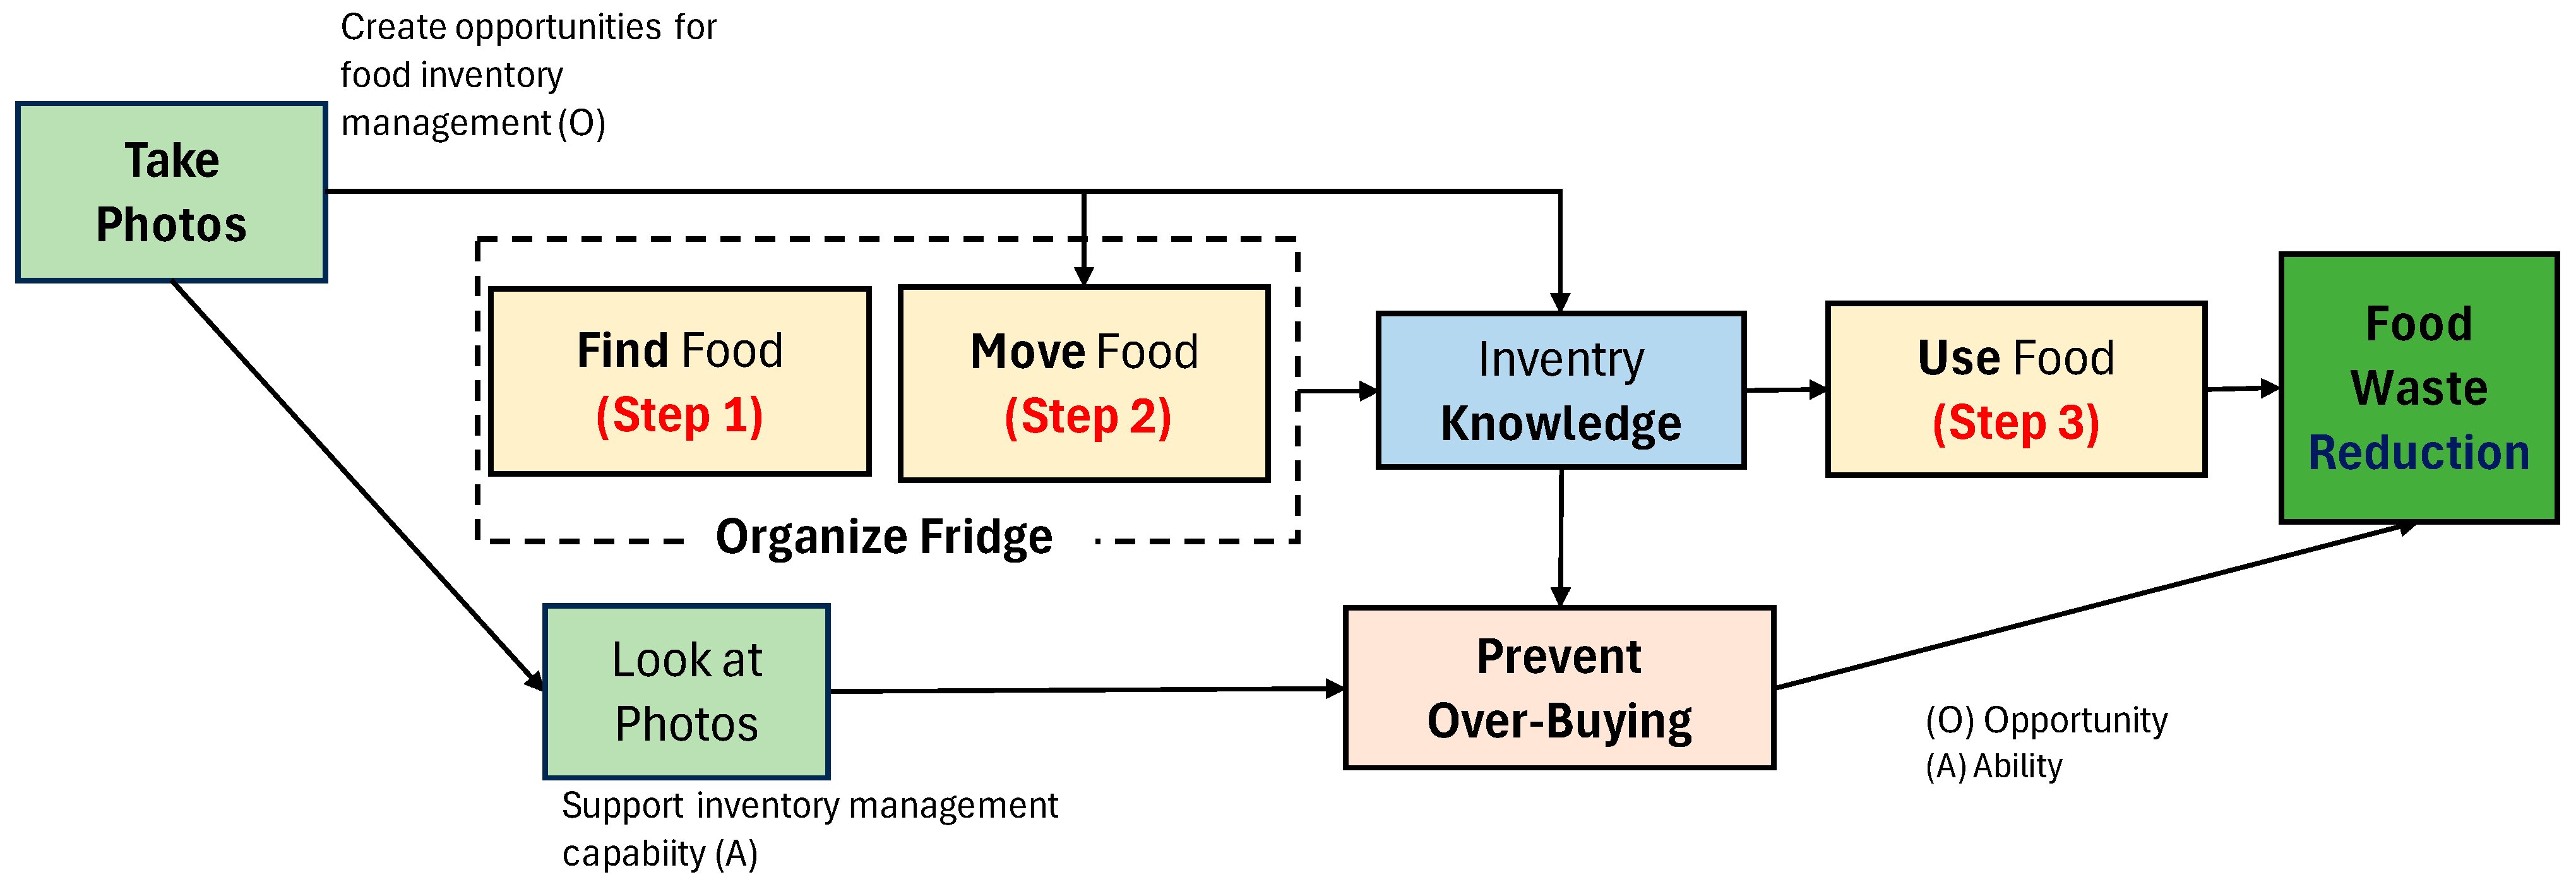
The first intervention included the use of refrigerator organization tools (hereinafter referred to as “Organizer”). Participants were provided with a narrow plastic crate and red-striped masking tape that stood out well and could be used inside the refrigerator. These were used as tools to encourage physically rearranging food items that were stored in the refrigerator. The crate could be used to store food that needed to be used quickly or to divide the refrigerator into zones. The tape could also be used to divide areas and mark food items. The crate was similar in purpose to those described by Cooper et al. [16], and the masking tape was similar in purpose to that described by Boulet [15], but this study combined these two approaches. It was hypothesized that changing the environment inside the refrigerator would help make items that should be used quickly more visible. Changing the environment has been shown to be effective in promoting behavioral change [19], so it was considered a promising intervention strategy.
The Organizer intervention was expected to create an environment where priority foods in the refrigerator would be more visible, thereby generating opportunities for the Three Steps for managing the refrigerator: searching, moving, and using foods that should be used sooner. This was expected to lead to food waste reductions. Additionally, moving foods would increase inventory knowledge, which was anticipated to be beneficial during shopping, thereby contributing to food waste reduction. The hypotheses regarding the use of the Organizer intervention are outlined below, and the intervention’s mechanism of influence is illustrated in Figure 2.
Note that the hypotheses that apply to all three interventions are marked as “Common H”.
Hypothesis 1-1 (H1-1).
The Organizer intervention will lead to searching more for foods that should be used sooner.
Hypothesis 1-2 (H1-2).
The Organizer intervention will lead to moving more foods that should be used sooner.
Hypothesis 1-3 (H1-3).
The Organizer intervention will lead to increased knowledge of the contents of the refrigerator.
Hypothesis 1-4 (H1-4).
The Organizer intervention will lead to using more foods that should be used sooner.
Hypothesis 1-5 (H1-5).
The more that foods that should be used sooner are used, the more food waste is reduced (Common H).
Hypothesis 1-6 (H1-6).
The Organizer intervention will lead to a reduction in over-buying.
Hypothesis 1-7 (H1-7).
The more over-buying is reduced, the more food waste is reduced (Common H).
Hypothesis 1-8 (H1-8).
The Organizer intervention will lead to a reduction in food waste.

2.4.2. Photo Taking

The second intervention involved taking photos of the inside of the refrigerator (hereinafter referred to as “Photos”). We devised this intervention by utilizing the camera function of smartphones to regularly take photos of the contents of their refrigerator, enabling participants to visually recall the location and inventory status of food items. This initiative involved participants taking photos of the refrigerator interior at their own discretion, as regularly as possible. In Japan, smartphone penetration rates are high, and smartphone camera functions are frequently used, making this approach feasible (see Note 2 below). The Photos intervention was expected to assist the use of inventory knowledge by checking the photos while shopping. This approach had the potential to reduce over-buying and thereby contribute to reducing food waste. Similar interventions included those using refrigerator cameras such as FridgeCam [21,24], but in the present study, the novelty lies in the fact that participants take photos of their refrigerators themselves. Since participants would take photos themselves, it was expected that they would move or organize the food in the refrigerator to make it easier to see the inventory in the photos. The Photos intervention was expected to support consumers’ refrigerator management by creating opportunities for refrigerator organization and enhancing their inventory knowledge, thereby promoting the usage of food. The hypotheses regarding the Photos intervention are outlined below, and the mechanism of influence of this intervention is shown in Figure 3.
Note 2: According to the Mobile White Paper published by the Mobile Society Research Institute, smartphones accounted for 94% of all mobile phones owned in Japan in 2022 (including second phones) [37]. According to a survey conducted by MyVoiceCom [38], the most frequently used smartphone functions are calls (86.2%), followed by camera functions (73.5%) and web searches (69.7%).
Hypothesis 2-1 (H2-1).
The Photos intervention will lead to a reduction in over-buying.
Hypothesis 2-2 (H2-2).
The Photos intervention will lead to more food being moved in the refrigerator.
Hypothesis 2-3 (H2-3).
The Photos intervention will lead to increased knowledge of the contents of the refrigerator.
Hypothesis 2-4 (H2-4).
The Photos intervention will lead to using more food that should be used sooner.
Hypothesis 2-5 (H2-5).
The Photos intervention will lead to a reduction in food waste.

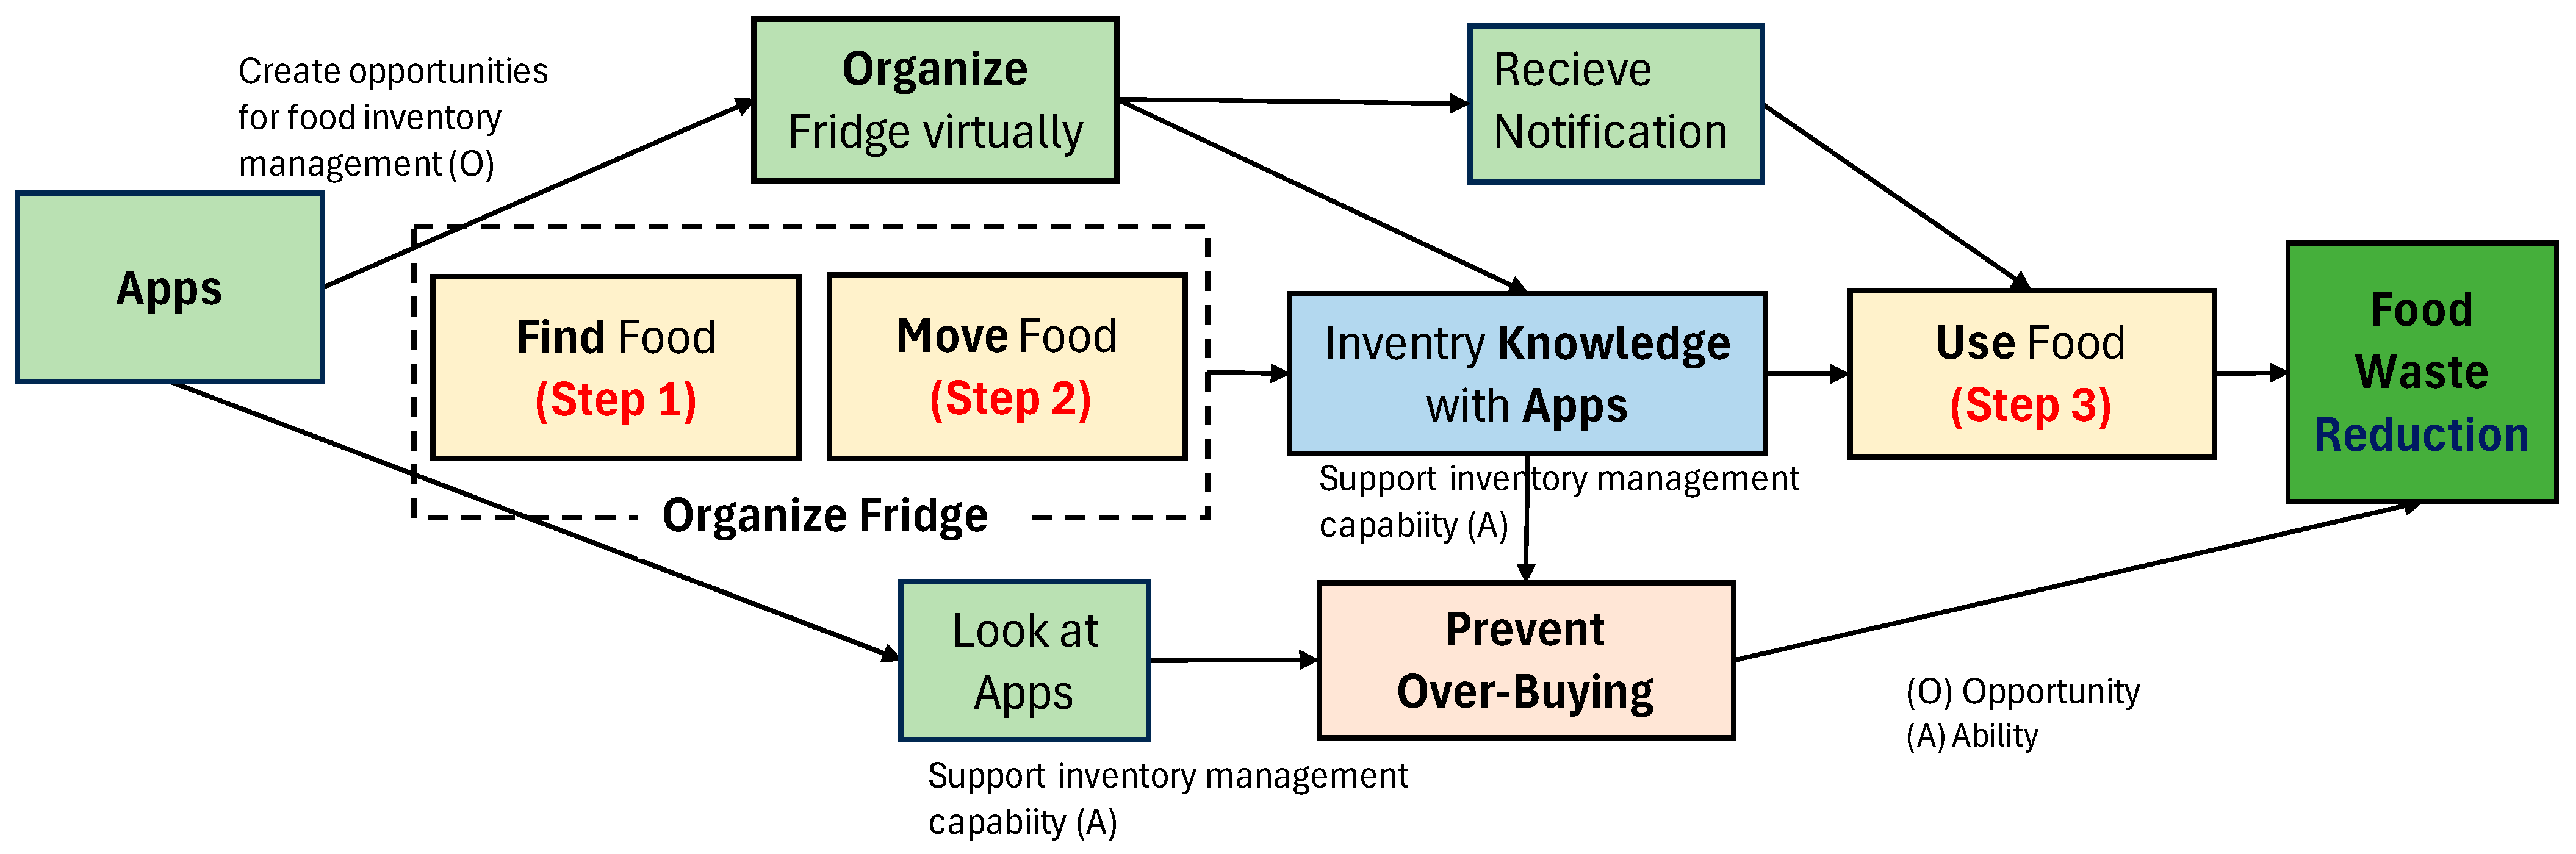
2.4.3. Food Management Apps

The third intervention was to use a food management app (hereinafter referred to as “Apps”). The apps provided comprehensive functions such as inventory management, shopping lists, and recipe search, supporting users in procurement, storage, management and consumption. Participants were asked to install either Pecco or Limiter [39,40], food management apps that were developed in Japan and compatible with both iOS and Android, on their smartphones, and to enter newly purchased foods into their chosen app. The Apps intervention did not require users to move food items in the refrigerator, but by entering them into the apps, users gained the opportunity to virtually organize their refrigerator, thereby supporting their ability to manage inventory and food expiration dates. Furthermore, when the expiration date of food items approached, the apps would send push notifications, creating opportunities to consume foods sooner and thereby reducing food waste. This intervention was expected to prevent duplicate purchases and reduce over-buying, as participants could manage their home refrigerator inventory using their smartphones, which they always carried with them, and share information with family members. The Three Steps for managing one’s refrigerator—searching for food, moving it, and using it—were performed when actually taking food in and out of the refrigerator. The hypotheses for the Apps intervention are outlined below, and the mechanism of influence of this intervention is shown in Figure 4. The common hypotheses for the three interventions are the same as for the Organizer intervention. Note that inputting food that was already in the refrigerator was optional in this intervention, but participants were informed that inputting this information would enable recipe suggestions. The use of shopping list features was also optional.
Hypothesis 3-1 (H3-1).
The Apps intervention will lead to increased knowledge of the contents of the refrigerator.
Hypothesis 3-2 (H3-2).
The Apps intervention will lead to using more foods that should be used sooner.
Hypothesis 3-3 (H3-3).
The Apps intervention will lead to a reduction in over-buying.
Hypothesis 3-4 (H3-4).
The Apps intervention will lead to a reduction in food waste.

3. Materials and Methods

3.1. Participants

To verify the effects of the three support tools compared with a control group, in this study, we conducted a two-way mixed ANOVA with three intervention groups and a control group, totaling four groups. To determine the required sample size for the analysis, we performed a pre-analysis (a priori) using G*Power 3.1 [41,42]. For the four groups, three periods (baseline, intervention, and follow-up), an effect size (f) of moderate magnitude (0.25) as defined by Cohen [43], a significance level of 5% (α = 0.05) and a power of 80% (1-β = 0.8) were used. When the effect size specification was set in SPSS Statistics 29, the required sample size was determined to be 120 participants in total, with a minimum of 30 participants per group.
Based on the required sample size, we recruited 120 participants in the age range of 20 to 60 or older, targeting households with two or more members. Participants were recruited in September 2023 through public calls by three municipalities in Kyoto Prefecture in Japan and an internet portal site specializing in recruiting public monitors called Monitto [44]. As a result, a total of 277 applications were received from across Japan, but only 242 were verified, with 85% being female. For selection, participants were screened based on their frequency of food waste disposal and cooking/shopping behaviors over the past two weeks. Among the selected participants, one-third (40 individuals) were residents of Maizuru City in Kyoto Prefecture (see Note 3 below). For age groups with a high number of applicants, random selection was used to select participants, resulting in five age groups (20–60 s) with 24 participants each. Due to a low number of applicants in the 20 s age group, ten panels were provided from a research company, and an additional five citizens aged 30–32 were assigned in place of the 20 s group. As we received the largest number of applicants in the 40 s age group, 5 additional participants were selected, resulting in 29 participants in this age group and a total of 125 participants. Three participants withdrew before the study began, 2 dropped out after the study started, and 1 was excluded due to abnormal measurement values. The final participants consisted of 40 citizens of Maizuru City recruited through a public call, 69 citizens from other municipalities, and 10 panels from a research company to supplement the shortage of applicants in their 20 s, totaling 119 participants. Participants who completed the six-week study and responded to three questionnaire surveys were given a gift card worth JPY 6000 as compensation.
Prior to the study, participants were shown three tools—Organizer, Photos, and Apps—along with their intended usage scenes and asked to rank them in order of preference. This procedure was used because, in a similar study conducted in 2021, participants were randomly assigned without being asked about their preferences, and it was reported that the tools did not match the circumstances of the households and could not be used to reduce food waste. In addition, when implementing such measures in actual municipalities, it was expected that citizens would choose the appropriate tools for their individual circumstances. Therefore, in this study, we assigned the tools by taking into consideration the preferences of each household and the overall balance. First, a control group (n = 30) was assigned evenly from each age group. The rest of the participants belonged to the intervention group and were randomly assigned to one of three interventions according to the five age groups, with equal numbers in each age group, based on their first and second preferences. Participants who had already implemented similar intervention measures at home were assigned to other tools. Participants in the intervention group were assigned to the Organizer (n = 29), Photos (n = 30), and Apps (n = 30) interventions.
This study was reviewed by the Ethics Committee of Kyoto Prefectural University and approved on 14 August 2023 (Application No. 287).
Note 3: Residents of Maizuru City, Kyoto Prefecture, participated in a pilot study, and to examine the effectiveness of interventions under specific policy and regional conditions, a large number of Maizuru City residents who actively cooperated in publicity efforts were selected.

3.2. Methods

This study was conducted from October 2023 to March 2024. The experimental period for measuring food waste was defined to avoid the end-of-year and new year holidays, ensuring that participants could maintain their usual lifestyles as much as possible. During the experimental period, a two-week baseline period and a two-week intervention period were held consecutively over four weeks. Approximately three months later, a two-week follow-up period was carried out. During the experimental period, participants were asked to separate avoidable food waste that was generated at home and dispose of it in the dedicated waste bin provided by the study. Questionnaire surveys were administered three times: before the baseline period began, after the intervention ended, and after the follow-up period concluded (see Figure 5 for details of the schedule).
During the baseline period, all participants were asked to continue their normal lifestyles and dispose of any food waste in the waste bin. One week before the start of the baseline period, an online briefing session was held for all participants to explain the definition of food waste and how to separate it. The content of the briefing was also distributed in a video format and as printed materials.
One week prior to the start of the intervention period, an online briefing session was held exclusively for participants in the intervention groups to motivate them through an informational intervention. The participants were also instructed on how to use each support tool that was provided as part of the intervention. During the two-week intervention period, participants were asked to use their assigned support tool to manage their refrigerators and reduce food waste. The content of the briefing session was also distributed as a video, and leaflets containing the same information were distributed to all households in the intervention group.
Participants in the control group were asked to continue their usual lifestyles during the intervention period. All participants were instructed to dispose of any food waste in the designated waste bin during the intervention period, just as they had done during the baseline period.
Approximately three months later, we set up a follow-up period, and participants in both groups were asked to continue their usual lifestyles prior to the follow-up period and dispose of any food waste in the designated bin. In this paper, however, the analysis is limited to data from the baseline and intervention periods. We focused on the direct effects of the intervention on behaviors relating to food waste and the relationship between behaviors and the quantities of food waste. For the analysis of the intervention effects, a two-way mixed ANOVA was used. To determine the relationship between behaviors and food waste quantities, a correlation analysis was performed between the changes in each variable. IBM SPSS Statistics 29 was used for the analysis.

3.3. Food Waste Measurement

3.3.1. Food Waste to Be Measured

In this study, food waste consisted of “unused food” and “leftovers” based on the definition by Okayama et al. [45]. When explaining the process to participants, we clarified that the target was “food parts that had been edible but were discarded,” such as leftovers, uneaten food, and expired or spoiled food. We excluded items such as vegetable or fruit peels that were discarded because they were removed intentionally. However, for measurement purposes, we requested that “liquids” not be placed in the dedicated waste bins. Regarding containers and packaging that contained the discarded food, if they were lighter than the food itself, we asked participants to place them in the trash bin as they were. If the food contents were lighter than the packaging, participants were asked to remove the package and only place the contents in the provided bin. Note that according to the Japanese government’s definition, “excessive removal (e.g., excessively thickly peeled vegetable skins, edible parts removed excessively when removing inedible parts)” is included in “food that is edible but discarded (avoidable food waste),” but such food was not included in this study.

3.3.2. A Cloud-Based Measurement System

In this study, we devised a new method for measuring food waste at home using a cloud-based measurement system and utilized a mat-type measurement device called “SmartMat”, developed by S-Mat, Inc., Tokyo, Japan. Specifically, we combined a 20 L waste bin with an automatic weighing device, SmartMat, and a Wi-Fi router to create a system that collected measurement data in a cloud server. The dedicated waste bin was designated for food waste only. The system automatically took measurements 24 times a day at one-hour intervals, with data being transmitted to the cloud management system. The measurement device had a load capacity of 5 kg, a measurement unit of 1 g, and a maximum measurement error of ±0.15% (2.5 g/1 kg). Prior to this study, a preliminary study was conducted using the same measurement system in conjunction with a food waste diary. When comparing the measurement values with the diary data, the data from the diary and those from the system were found to be compatible. However, the data obtained from the system included numerous measurements of less than 5 g at times when food waste was not expected to occur according to the diary. Therefore, a threshold of 5 g was set, and only increases in weight above this threshold level were treated as food waste. One participant’s data showed large fluctuations in value with a high frequency of measurements. After checking with the participant for their frequency of disposal, their data were deemed abnormal and excluded. Another participant who withdrew midway through the study was also excluded from the analysis. The food waste data from 119 households were used for our analysis.
Until now, with the exception of household waste composition analyses, there have been no methods other than self-measurement to directly quantify the food waste that is generated in households. On the other hand, food waste separation is considered relatively low in terms of effort for participants, as they only need to dispose of waste in the provided containers [25]. In this study, we sent dedicated bins for food waste to participants’ homes, had them installed inside their homes, and had participants separate their food waste and dispose of it in the dedicated bins, which were equipped with a cloud-based measurement system. This method eliminated the need for participants to measure the food waste themselves, reducing their burden, and since they were unaware of the measurement values, it was expected that this would minimize the influence of feedback from the measurement results. The measurement system used in this study is shown below (Figure 6).

3.4. Questionnaire Surveys

Questionnaire surveys were administered online using Google Forms. The surveys were taken three times: before the study began, after the intervention, and at the end of the follow-up period. Participants were asked to respond to questions regarding the condition and the management of their refrigerators and their shopping habits, cooking practices, food waste disposal, and awareness of food waste over the past two weeks. The surveys included multiple-choice as well as open-ended questions.

3.5. Internet Surveys Using Online Panels

To verify the effects of the new measurement method that was adopted in this study, questionnaire surveys using online panels were administered. The online panels were selected through a screening survey to ensure that they met the same conditions as the experiment participants, resulting in 94 participants. The questionnaire items were the same, except for questions that were directly related to the experimental study, and the response periods were aligned with those of the experimental participants.

4. Results

4.1. Changes in Food Waste and the Effects of the Intervention

Approximately one-third of the participants were residents of Maizuru City, so we compared the baseline food waste per person per day and the changes before and after the intervention between residents of Maizuru City and residents of other municipalities. There were no significant differences, and we therefore decided to analyze the data without distinguishing between residents of Maizuru City and other municipalities.
Figure 7 shows the average weekly food waste per household based on the tool used. Compared with the baseline period, each intervention using supporting tools resulted in the following reductions in food waste: Organizer: 176 g, 51% reduction; Photos: 177 g, 43% reduction; and Apps: 129 g, 29% reduction. A two-way mixed ANOVA was conducted with food waste as the dependent variable and the intervention type and experimental period (baseline and intervention period) as factors. The interaction (F(3, 115) = 2.194; p = 0.092) showed marginal significance (p < 0.10). Since differences in trends were also observed in the graph (Figure 7), we examined the simple main effects. The differences in mean values for each tool were 175.7 ** for the Organizer tool, 177.2 ** for the Photos tool, and 129.0 * for the Apps tool. The differences were significant at the 1% level for the Organizer and Photos interventions and at the 5% level for the Apps intervention. However, the difference in mean values for the control group was 2.5 and was not statistically significant. The symbols attached to the mean value differences indicate the significance level of the analysis results, where ** p < 0.01, * p < 0.05, + p < 0.10 (the same applies thereafter).

4.2. Effects of Interventions on Food Waste Reduction Behaviors

To examine the effects of the three support tools on food waste reduction behaviors, we used a two-way mixed ANOVA, with the degree of behavior implementation (five-point scale, post- minus pre-intervention) as the dependent variable and the type of intervention and research period (pre- and post-intervention) as factors. The 13 behaviors relating to food waste reduction, measured using a questionnaire survey pre- and post-intervention, were analyzed. Among the behaviors, significant interactions (p < 0.05) were observed for “Moved foods that should be eaten quickly” (F(3, 111) = 3.852; p = 0.012), “Frequency of organizing refrigerator” (F(3, 109) = 4.478; p = 0.005), and “Had trouble not being able to recall food inventory at home during shopping” (F(3, 115) = 2.791; p = 0.044). The results of the interaction effects, as well as the differences in means and simple main effects, are presented in Table 1.

4.3. Food Waste Reduction and Behavioral Changes

A correlation analysis was performed between the level of food waste reduction (pre- minus post-intervention) and the differences in the 13 behaviors (pre- minus post-intervention); the results are shown in Table 1. Regarding the impact of behavioral changes on food waste reduction, two behaviors—“Was careful how much I buy” (r = −0.271 **) and “Tried to finish the food I cooked” (r = −0.364 **)—had significant correlations, with p-values below 1%. Additionally, “Knew inventory in the refrigerator” (r = −0.199 *), “Kept track of expiration dates” (r = −0.186 *), “Used foods that should be eaten quickly as a priority” (r = −0.196 *), and “Used up foods in the refrigerator” (r = −0.206 *) were significant at the 5% level. In summary, the actions that had the greatest impact on food waste reduction were to be mindful of purchase quantities at the shopping stage and to finish what was served during the consumption stage. Following these were behaviors relating to inventory knowledge, such as expiration dates and the food inventory, and behaviors relating to using food.

4.4. Effects of the Measurement

As a method for measuring food waste, a cloud-based automatic weighing system was utilized. According to the questionnaire survey, 63% of the intervention group and 76% of the control group reported that food waste separation and the use of dedicated waste bins had either some or a significant impact on their food waste reduction behaviors.
The results regarding the impact of food waste measurement on the control group participating in the empirical study were, as mentioned in Section 3.5, compared with those from the questionnaire survey that was collected using internet panels. To analyze whether there were differences in the changes in food waste disposal frequency between the two groups, a two-way mixed ANOVA was conducted using the disposal frequencies pre- and post-intervention periods. The results showed no significant interaction effects for unused items (F(1, 116) = 0.109; p = 0.742) or leftovers (F(1, 120) = 0.006; p = 0.939). The mean differences in the simple main effects were 0.000 for the control group and 0.055 for the internet panel group for unused items and 0.069 for the control group and 0.054 for the internet panel group for leftovers, none of which were statistically significant. The disposal frequency of the control group in the experiment was significantly lower for unused items (t = −3.050; df = 94.144; p = 0.003) and leftovers (t = −2.896; df = 69.372; p = 0.005) than those of the internet panel group.

5. Discussion

5.1. Evaluation of Each Intervention Measure and Verification of Hypotheses

5.1.1. Refrigerator Organization Tools (Organizer)

Among the participants (n = 29) in the Organizer intervention group, the majority (93%) used both the plastic case and masking tape. Specifically, 86% used the case to store food that needed to be used quickly, and 76% used the masking tape to create designated areas. These actions indicated that the tools effectively achieved the intended goal of changing the refrigerator environment.
We hypothesized that the Organizer intervention would promote refrigerator organization and increase behaviors such as searching for, moving, and using foods that should be consumed sooner by physically changing the refrigerator environment (H1-1, 1-2, and 1-4). Note that the difference in mean values in simple main effects will be abbreviated as MD hereafter. The interaction between this intervention and H1-1, “Searching for food” (MD = 0.483 *), was not significant or supported. However, the simple main effect was significant, indicating that the behavior itself increased. The interaction between the simple main effect of this intervention and H1-2, “Moved food” (MD = 1.111 **), were significant, supporting H1-2. As refrigerator organization improved, “food that needs to be eaten quickly” became more visible and was located in easier-to-reach places. This was consistent with the significant interaction and simple main effect of the frequency of organization of the refrigerator (MD = 1.143 **). On the other hand, the interaction between this intervention and H1-4, “using more foods that should be used sooner” (MD = 0.071), was not significant, and neither was the difference in mean values pre- and post-intervention. H1-4 was therefore not supported. This behavior had already been at a high level before the study began (pre-intervention mean: 4.0; MD = 0.10), and it was possible that the intervention had little effect. However, this behavior was measured based on the proportion of actions rather than the number of times or the number of food items, meaning that even if the proportion of prioritized use did not change, an increase in the recognition rate of foods that should be used quickly—such as by moving foods—could have led to a reduction in food waste.
In support of H1-5, the more participants prioritized using food that needed to be eaten quickly, the more food waste was reduced (r = −0.196 *). Similarly, behaviors in the usage category, such as “used up the foods in the refrigerator” (MD = −0.379 **) and “tried to finish the food I cooked” (MD = 0.276 *), did not show any significant interaction effects, but the differences in mean values pre- and post-intervention were significant, indicating that both using up and finishing behaviors improved. Unlike many of the other behaviors, the simple main effect of the control group (MD = −0.333 *) was significant for “used up food,” suggesting that participation in the study or even the measurement (although they did not measure by themselves) may have influenced the results. There were significant correlations between changes in food waste amount and using up food (r = −0.206 *) and finishing food (r = −0.364 **).
H1-3 suggested that the intervention would increase inventory knowledge, and both “knew inventory in the refrigerator” (MD = 0.621 **) and “kept track of the expiration dates” (MD = 0.828 **) showed significant interaction trends, while the simple main effects were also significant. We consider this to be the effect of the improved refrigerator organization following the intervention. Similarly, in the area of inventory awareness, the interaction was significant for “had trouble not being able to recall food inventory at home” (MD = −0.586 +), and the simple main effect showed a significant trend, suggesting that Hypothesis 1–3 was partially supported.
For shopping behavior, we hypothesized that the intervention would reduce over-buying (H1-6). “Bought the same item twice (duplicate purchasing)” (MD = −0.345 **) showed a significant interaction, but “Was careful how much I buy (careful purchasing)” (MD = −0.517 **) did not. Both simple main effects were significant, and the increase in behaviors pre- and post-intervention suggests that this intervention led to adjustments in purchase quantities, making it consistent with H1-6. H1-7 stated that, “The more excessive purchases are reduced, the more food waste is reduced”. The reduction in duplicate purchasing and changes in behavior by paying attention to the amount purchased were significantly correlated with the reduction in food waste (duplicate purchasing: r = 0.174 +; careful purchasing: r = −0.271 *), suggesting that the series of behavioral changes led to a reduction in food waste. Therefore, H1-7 could also be supported.
The reduction rate of food waste pre- and post-intervention was 51%, and its interaction with H1-8 exhibited a significant trend. The difference in the mean values of the simple main effects was also significant (175.7 **). Therefore, H1-8 could be considered to be generally supported. The Organizer intervention, which aimed for participants to change the environment inside their refrigerator, was thought to have promoted the behavior of moving foods, thereby increasing the awareness of food, the amount of food to be consumed, and inventory knowledge; furthermore, this intervention was thought to promote reductions in over-buying and food waste.
In the evaluation of the three intervention measures, participants’ evaluation of the food waste reduction effect of the Organizer intervention was the highest, with all participants responding that the interventions were “very effective” or “effective.” The burden of this tool was also low, with 85% responding that they did not feel that it was troublesome.
Although our Organizer intervention was not identical to those by Boulet et al. [15] and Cooper et al. [16], overall, it combined elements of both and achieved a reduction in food waste, thereby quantitatively supporting the findings of these previous studies. Cooper et al. [16] reported that the addition of storage baskets (Collect) to a program promoting the use of all food did not have a significant effect, but they did not evaluate the effect of “Collect” alone. This study demonstrated that a program focused on the Organizer intervention—comparable to the “Collect” intervention—achieved a reduction of about 50%. In Boulet et al.’s study, their tape was used as a visual prompt, a labeling device, and a tool for planning and communication [15], and it is believed to have had a similar effect in this study. A notable feature was that our Organizer intervention had a significant impact on target behaviors such as searching and moving. Environmental changes and visual effects are easily understood by householders and, as a result, are thought to have contributed to reducing food waste. The intervention strategy of changing the refrigerator environment using organizers is advantageous as it is easy to understand, not only for meal managers, but also for family members. This type of intervention has many variations and can be easily combined with information provision programs; however, it is necessary to investigate how to utilize this approach while considering its advantages and disadvantages.
Interventions that change the choice environment to alter the choice structure are classified as “nudges.” However, in nudges, the choice architecture is typically designed by choice architects such as policymakers, rather than the individual who makes the decision [46]. Refrigerator management was an action performed within the home, making it nearly impossible to change the environment from the outside. In this study, the intervention involved asking the intervention targets to change their environment, with the expectation that this would have a nudging effect on their future behavior. When the individual who changes the environment is the same as the individual who performs the behavior, this is referred to as a self-nudge [47,48]. The intervention involving environmental changes to make foods that should be consumed more visible inside the refrigerator can be considered an example of a self-nudge. For consumers who already have a certain level of motivation to reduce food waste, self-nudges that encourage them to change the environment inside their refrigerators could lead to behavioral change. The future application of this approach is promising.

5.1.2. Photo Taking (Photos)

First, we hypothesized (H2-1) that the Photos intervention would reduce over-buying by allowing participants to view the photos that they had taken. Among the participants (n = 30) using this tool, half of them took photos inside their refrigerator before shopping, and approximately one-third (34.4%) took photos when putting food in or taking it out of the refrigerator. In addition, the majority (81.3%) checked the photos while shopping. Reviewing photos while shopping helped participants, but also taking photos before shopping may have made it memorable. While there was no significant interaction effect on over-buying, the simple main effect was significant (MD = −0.633 *). However, over-buying’s main effect compared with the control group was also significant (MD = 0.533 *), suggesting that participation in the study or the measurement itself may have influenced the results. With regard to other purchasing behaviors, duplicate purchasing showed a significant interaction trend, with the mean decreasing significantly (MD = −0.333 **). While the interaction effect of “was careful how much you buy” was not significant, the simple main effect showed a significant trend (MD = 0.367 +). Among the variables relating to purchasing, two variables did not show significant interactions, but duplicate purchasing showed a significant interaction trend and a significant main effect. This means that H2-1 can be considered to be partially supported.
Next, we hypothesized (H2-2) that taking photos would encourage participants to move food items more in their refrigerator. Most participants (75%) said that moving food items during photography helped them organize their refrigerators. Both “moved food items” (MD = 0.552 *) and “frequency of organizing the refrigerator” (MD = 0.607 *) showed significant main effects pre- and post-intervention, in addition to interaction effects that support H2-2. While this intervention was expected to primarily influence participants’ shopping behavior, it was found to also encourage refrigerator organization during photography. This is a point that differs from previous studies [21,24] examining the use of refrigerator cameras and was clarified in this study. The novelty of this study is that participants were deliberately asked to take photos themselves, rather than having photos taken automatically. With a camera installed inside the refrigerator, the interior is photographed as it is, like a landscape. However, when participants take photos themselves, they may change the arrangement to make it look better or focus on what they want to photograph, similar to portrait photography. This may make them more aware of the food inside the refrigerator, which is the subject of the photograph. It is also considered one of the factors contributing to the high reduction rate of food waste among participants using the Photos tool.
Regarding inventory knowledge, we hypothesized (H2-3) that photos would increase inventory knowledge. The knowledge of the inventory in the refrigerator only showed a significant trend for interaction, but the simple main effect was significantly increased (MD = 0.333 *); meanwhile, the experience of having trouble with recalling the food inventory at home showed a significant interaction effect, while the simple main effect was also significantly reduced (MD = −1.67 **). The simple main effect of “Kept track of the expiration dates” (MD = 0.633 **) increased significantly, and inventory awareness and understanding of expiration dates contributed to preventing over-buying, as mentioned earlier. Therefore, hypothesis 2-3 can be considered to be supported.
H2-4 suggested that this intervention would lead to participants using more foods that should be used sooner; however, this variable did not show a significant interaction, and H2-4 was not supported. However, this behavior changed between pre- and post-intervention (pre-intervention mean 3.97; MD = 0.30), and the simple main effect was also significant (MD = 0.300 *), suggesting that the intervention had some effect.
For H2-5, the reduction rate of food waste amount pre- and post-intervention was 43%, and as shown in 4.1, the interaction exhibited a significant trend; in addition, the mean difference (MD = 175.7 **) was strongly significant, so it could be said that it was generally supported. The Photos intervention, which involved moving food items during photography to organize the refrigerator, was believed to have improved inventory knowledge and the use of photos during shopping, thereby reducing duplicate purchases and over-buying at the shopping stage and significantly reducing food waste. With the refrigerator cameras that were examined in previous studies [21,24], qualitative surveys reported that photos were useful for understanding inventory and shopping, and this study verified such effects. In addition to grasping the inventory, the action that participants handled and moved food items during the photo shoot may have also contributed to enhancing their knowledge on the content of the refrigerator.
Participants’ evaluation of the effectiveness of this tool for reducing food waste (85%) was lower than that of the Organizer intervention, but it still received a good evaluation. Only half of the participants did not find taking photos burdensome, however, indicating that some participants felt that it was a hassle to consciously take photos of the refrigerator as part of their daily routine. This intervention was intended to help participants recall the contents of their refrigerator through images and reduce barriers by using photos as a substitute for notes. Further verification is required to determine whether taking photos of the refrigerator can become a habit that can be sustained in the long term.

5.1.3. Food Management Apps (Apps)

All participants (n = 30) in this intervention group reported that they used the apps. Based on the questionnaire survey, 50% reported registering newly purchased food items, and 43.3% reported registering food items that were already in their refrigerators. Since participants who did not respond to the registration question also received notifications, we assumed that most participants registered food items in the app in some form. Regarding the first hypothesis that this intervention would improve inventory knowledge (H3-1), both “Knew inventory in the refrigerator” (MD = 0.600 **) and “Kept track of the expiration dates” (MD = 0.900 **) showed significant interaction trends and simple main effects. This result was consistent with H3-1.
For H3-2, which suggested that the use of the apps encouraged food consumption through notifications, 56.7% of participants reported using the food after receiving a notification. However, H3-2 was not supported, since the interaction with priority usage of food was not significant. In terms of the promotion of food usage, we should keep in mind that some foods have longer expiration dates, and a certain period is needed before notifications are sent. Additionally, participants who only registered newly purchased foods during the intervention period may have received fewer notifications.
We hypothesized that checking the information in the app could reduce over-buying (H3-3). This hypothesis was related to inventory knowledge during shopping, and one variable (“Had trouble not being able to recall food inventory at home during shopping”) showed significant interaction and simple main effects (MD = −1.333 **). “Bought the same item twice” only showed a significant trend in interaction but exhibited a significant simple main effect (MD = −0.433 **). The simple main effects were also significant for the shopping behaviors “Was careful how much I buy” (MD = 0.500 **) and “Bought too much” (MD = −0.867 **). For the three behaviors of buying the same item twice, being aware of how much is purchased, and over-buying, the mean differences in the control group were 0.000, 0.067, and 0.533, respectively. For the last variable, “bought too much,” the simple main effect was significant in the control group, but the differences were relatively large for the other behaviors. Therefore, H3-3 could be considered somewhat supported.
As for the three target behaviors, although the frequency of organization of the refrigerator increased significantly (MD = 0.621 *), moving food (MD = 0.133) did not. In this intervention, managing the food inventory and expiration dates via the app was considered virtual organization, and we assumed that for organization purposes, participants would not actually move food inside the refrigerator very much.
Regarding the effectiveness of food waste reduction following this intervention (H3-4), as shown in Section 4.1, the food waste reduction rate pre- and post-intervention was 29%. Although its interaction only showed a significant trend, the mean difference was significant (MD = 129.0 *), and H3-4 can be considered to be generally supported. This intervention was believed to have contributed to food waste reduction by supporting improved inventory knowledge through virtual organization of the refrigerator using the food management app, thereby reducing over-buying.
In Mathisen’s study involving six participants, no significant food waste reduction effect was observed. However, participants who used the TotalCtrlHome app, which provides food management and recipe information, reported that it influenced their purchasing and consumption behavior [22]. In this study, we used a similar food management app and promoted the practice of the Three Steps. With a larger number of participants, our study showed a 29% reduction based on our weight measurements. This suggested that with an app-based intervention, appropriate measurement methods, and a sufficient number of participants, a significant effect can be achieved. Since food waste generation in households varies significantly from day to day and among households, a study with a large number of participants may be necessary to evaluate the reduction effect. The qualitative evaluation in Farr-Wharton’s study suggested effectiveness at the point of purchase [21], and similar trends in purchasing and knowledge improvement were observed in this study based on the results of our questionnaire surveys.
In the evaluation of the Apps intervention, the effectiveness of food waste reduction (70%) was the lowest among the three tools, and many participants (76%) found the input process to be cumbersome. The issue of data entry has been pointed out in previous studies [21,22,49] and may make it difficult to use the app over the long term. In this study, participants could choose between two types of food management apps: one that allows barcode scanning and another that enables easy input by tapping icons of commonly used food items. However, we found that simply introducing relatively simple input methods described above was not sufficient to resolve the issue. Some pointed out the hassle of deleting data after using food products. For fresh vegetables that are difficult to enter using barcodes, improvements such as enhancing image recognition and food identification functions in cameras that are installed in refrigerators and linked to the app are expected to reduce the input effort.

5.2. A Cloud-Based Automatic Weighing System and Its Evaluation

In this study, as a method for measuring the quantity of food waste, a cloud-based automatic weighing system was utilized. This system was considered innovative because it enabled direct measurement of food waste at a closer time to the occurrence, thereby verifying the effectiveness of food waste reduction measures. This method was expected to minimize the impact on behavior, since participants did not need to measure waste by themselves. However, 63% of the intervention group and 76% of the control group reported that food waste sorting or the use of dedicated bins had some or a significant impact on their food waste reduction behaviors. Hence, the influence of the measurement itself could not be ruled out. In fact, it could be difficult to completely eliminate the influence of equipment that is placed in households, and it is possible that participating in this study heightened participants’ awareness of the importance of reducing food waste. Participants in the control group were asked to continue their usual lifestyles, as they were in the baseline period, and there was little change in the amount of food waste pre- and post-intervention, and hardly any change in frequency. It is therefore possible to suggest that the impact of food waste measurements using this system was not significant.
To examine the impact of food waste measurement on the control group, an identical questionnaire survey was also conducted among online survey monitors who did not participate in this study (please refer to Section 3.5.). To determine whether there were differences in changes in the food waste disposal frequency, a two-way mixed ANOVA was performed using pre- and post-intervention disposal frequencies from both groups. The results showed that there was no significant interaction for unused items (F(1, 116) = 0.109; p = 0.742) or leftovers (F(1, 120) = 0.006; p = 0.939); the mean differences in the simple main effects were 0.000 for the experimental group and 0.055 for the survey group for unused items, and 0.069 for the experimental group and 0.054 for the survey group for leftovers, neither of which were statistically significant. No clear effect was observed on food waste disposal in the experimental group. However, the disposal frequency of the experimental group was significantly lower than that of the survey group, with t = −3.050, df = 94.144, and p = 0.003 for unused items and t = −2.896, df = 69.372, and p = 0.005 for leftovers. This suggested that the experimental participants had a lower disposal frequency to begin with.
The waste audit is considered an ideal measurement method for evaluating the effectiveness of interventions. However, it is difficult to implement for various reasons, as it involves sampling from specific, limited regions and cannot account for waste that is disposed of through alternative routes such as composting [26,50]. The measurement method used in this study, while incurring certain costs, allowed participants from scattered diverse regions to join, measured only food waste, and recorded the timing of disposal, providing different information than that obtained through waste audits. This method only required separating food waste during regular garbage disposal, and the burden on participants was relatively low: 80% of participants reported that they disposed of 80% or more of the food waste generated in the dedicated waste bin. Most participants found the food waste separation method (84%) and the use of the dedicated bins (88%) easy to understand. For the evaluation of interventions, it is necessary to establish a control group, because not only the intervention but also the act of separating food waste for measurement may affect participants’ food wastage behavior.
The measurement method of this study could not identify the types of food that were discarded. In the future, by leveraging emerging technologies such as image recognition, it may be possible to automatically identify the types and conditions of discarded food, thereby obtaining detailed information at the moment of disposal. This could serve as a more effective measurement method.

6. Conclusions

This study focused on refrigerator management to reduce food waste in households by encouraging the using up of stored food. To achieve this, we identified three target behaviors—search, move, and use—to manage one’s refrigerator and designed interventions based on the MOA framework. The intervention provided “motivation” through information provision, followed by “opportunity” through the use of support tools and the enhancement and supplementation of “ability”. As non-informational interventions, we selected support tools that had not been previously evaluated, i.e., refrigerator organization tools, which can alter the environment inside a refrigerator, an ICT-based food management app, and a new intervention type involving photographing by participants inside their refrigerators. To measure the amount of food waste, we adopted a new method using a cloud-based automatic weighing system, where the food waste that was generated in households was directly weighed after separation by each participant. A control group was established to evaluate the data.
The average food waste pre- and post-intervention per household per week decreased by 176 g (51%) with the Organizer intervention, 177 g (43%) with the Photos intervention, and 129 g (29%) with the Apps intervention, while the control group showed little change. An analysis using a two-way mixed ANOVA revealed limited significant interaction (p < 0.10), indicating a moderate effect. Among the behaviors that led to food waste reduction, three behaviors—“Moved foods that needed to be eaten quickly,” “Frequency of organizing the refrigerator,” and “Had trouble not being able to recall food inventory at home during shopping”—showed significant interaction effects (p < 0.05) in the mixed two-way ANOVA, indicating the effectiveness of the intervention.
The Organizer intervention promoted refrigerator organization, and moving food led to an increased awareness of foods that should be used quickly, thus encouraging consumption. Improved inventory knowledge led to the prevention of over-buying, contributing to food waste reduction. Through the Photos intervention, moving food during photography led to improved refrigerator organization, enhanced knowledge of the inventory and expiration dates, and reduced duplicate purchases and over-buying due to viewing photos during shopping, thus contributing to food waste reduction. In the Apps intervention, improved inventory knowledge through virtual organization led to reduced over-buying, contributing to food waste reduction. Our verification of the measurements using cloud-based automatic weight measurement showed that, although there was some subjective influence due to the separation of food waste, the impact of this factor on the disposal frequency was small.
This research aimed to reduce food waste in households and included an empirical study with both informational and non-informational interventions. Since refrigerators are very common devices found in most households, interventions that encourage refrigerator management may be applicable in many countries.

7. Limitations

7.1. Motivations

One of the limitations of this study was that it targeted individuals who volunteered to participate in the empirical study, meaning that many participants may have already had an interest in food waste issues and some motivation to reduce food waste. The most common reason for participating was an “interest in the survey content” (68.3%), followed by an “interest in environmental issues or food waste” (57.5%), which exceeded “receiving compensation” (51.7%). The intervention method may therefore be effective for people who already have some motivation. It is generally believed that consumers want to reduce food waste but do not necessarily translate this desire into action due to competing goals [36]. Among such consumers, those who are unable to manage food in their refrigerators due to a lack of ability or opportunity may be amenable to the results of this study. It has been pointed out that food often becomes “invisible” inside refrigerators, leading to expiration and wastage [14]. Whether the motivation provided only through information is sufficient or not for consumers with low motivation to reduce their food waste requires verification through social experiments targeting the general public rather than experiments involving volunteers. This should be considered a future challenge. In addition, in this study, the intervention strategies were designed with a focus on “opportunity” and “ability” within the MOA framework, with “motivation” being addressed through informational interventions. Exploring other motivation-based interventions beyond informational interventions should be considered as a future research topic as well.

7.2. Long-Term Effects

Another limitation of this study was that we could not examine long-term effects. This study included a follow-up period of approximately three months after the end of the intervention period. Food waste data over a two-week period and questionnaire survey data were collected. In this paper, however, we focused our analysis on the data from the four weeks pre- and post-intervention to examine the direct effects of the intervention on behaviors relating to food waste and the nature of those effects. Discussions regarding long-term effects, the sustainability of effects, and differences between individuals who sustain effects and those who do not, including data from the follow-up period, will be reported separately.

Author Contributions

Conceptualization, Y.S., H.Y., T.O., K.W. and M.N.; methodology, Y.S., H.Y., K.W., T.O. and M.N.; validation, H.Y. and Y.S.; formal analysis, Y.S.; writing—original draft preparation, Y.S.; writing—review and editing, H.Y., T.O., K.W. and M.N.; visualization, Y.S.; project administration, Y.S.; funding acquisition, H.Y. All authors have read and agreed to the published version of the manuscript.

Funding

This research was funded by the Environment Research and Technology Development Fund (JPMEERF20223M03) of the Environmental Restoration and Conservation Agency provided by the Ministry of Environment of Japan.

Institutional Review Board Statement

The study was conducted in accordance with the Code of Ethics and Conduct of the Japan Psychology Association and approved by the Ethics Committee of Kyoto Prefectural University (No. 287, 14 August 2023).

Informed Consent Statement

Informed consent was obtained from all participants involved in the study to publish this paper.

Data Availability Statement

The data presented in this study are available on request from the corresponding author due to privacy restrictions.

Acknowledgments

The authors would like to acknowledge the municipal government of Maizuru City, Kyoto City, and Nagaokakyo City, Kyoto Prefecture, Japan, for their cooperation in this study.

Conflicts of Interest

We declare no conflicts of interest. The funder had no role in the design of the study; in the collection, analyses, or interpretation of data; in the writing of the manuscript; or in the decision to publish the results.

References

  1. FAO. Food Wastage Footprint: Impacts on Natural Resources: Summary Report; FAO: Rome, Italy, 2013; ISBN 978-92-5-107752-8.
  2. United Nations General Assembly. Transforming Our World: The 2030 Agenda for Sustainable Development. Available online: https://sdgs.un.org/2030agenda (accessed on 9 May 2025).
  3. Schanes, K.; Dobernig, K.; Gözet, B. Food Waste Matters—A Systematic Review of Household Food Waste Practices and Their Policy Implications. J. Clean. Prod. 2018, 182, 978–991. [Google Scholar] [CrossRef]
  4. Yamakawa, H. Potential for Municipal Household Food Waste Reduction Policies. Toshiseiso 2022, 75, 141–145. [Google Scholar]
  5. Japanese Ministry of Agriculture, Forestry and Fisheries Food Waste and Loss in Japan. Available online: https://www.maff.go.jp/j/press/shokuhin/recycle/240621.html (accessed on 9 May 2025).
  6. Nonomura, M. Consumers and Household Food Waste: Attitudes, Behaviors, and Food Waste Reduction Interventions. Mater. Cycles Waste Manag. Res. 2020, 31, 253–261. [Google Scholar] [CrossRef]
  7. Porpino, G. Household Food Waste Behavior: Avenues for Future Research. J. Assoc. Consum. Res. 2016, 1, 41–51. [Google Scholar] [CrossRef]
  8. Waitt, G.; Phillips, C. Food Waste and Domestic Refrigeration: A Visceral and Material Approach. Soc. Cult. Geogr. 2016, 17, 359–379. [Google Scholar] [CrossRef]
  9. Hebrok, M.; Boks, C. Household Food Waste: Drivers and Potential Intervention Points for Design—An Extensive Review. J. Clean. Prod. 2017, 151, 380–392. [Google Scholar] [CrossRef]
  10. Yamakawa, H. Towards Policy Development for Preventing Household Food Waste. Mater. Cycles Waste Manag. Res. 2020, 31, 262–272. [Google Scholar] [CrossRef]
  11. Stöckli, S.; Niklaus, E.; Dorn, M. Call for Testing Interventions to Prevent Consumer Food Waste. Resour. Conserv. Recycl. 2018, 136, 445–462. [Google Scholar] [CrossRef]
  12. Simões, J.; Carvalho, A.; Gaspar De Matos, M. How to Influence Consumer Food Waste Behavior with Interventions? A Systematic Literature Review. J. Clean. Prod. 2022, 373, 133866. [Google Scholar] [CrossRef]
  13. Casonato, C.; García-Herrero, L.; Caldeira, C.; Sala, S. What a Waste! Evidence of Consumer Food Waste Prevention and Its Effectiveness. Sustain. Prod. Consum. 2023, 41, 305–319. [Google Scholar] [CrossRef]
  14. Farr-Wharton, G.; Choi, J.H.-J.; Foth, M. Technicolouring the Fridge: Reducing Food Waste through Uses of Colour-Coding and Cameras. In Proceedings of the 13th International Conference on Mobile and Ubiquitous Multimedia—MUM ’14, Melbourne, Australia, 25–28 November 2014; ACM Press: New York, NY, USA, 2014; pp. 48–57. [Google Scholar]
  15. Boulet, M.; Lauren, N. Nudging Householders to Reduce Avoidable Food Waste: The OzHarvest Use It Up Tape. Sustainability 2024, 16, 5132. [Google Scholar] [CrossRef]
  16. Cooper, A.; Lion, R.; Rodriguez-Sierra, O.E.; Jeffrey, P.; Thomson, D.; Peters, K.; Christopher, L.; Zhu, M.J.H.; Wistrand, L.; Van Der Werf, P.; et al. Use-up Day and Flexible Recipes: Reducing Household Food Waste by Helping Families Prepare Food They Already Have. Resour. Conserv. Recycl. 2023, 194, 106986. [Google Scholar] [CrossRef]
  17. Van Herpen, E.; Wijnen, T.; Quested, T.; Reynolds, C.; Sharda, N. Convenient Tools and Social Norms: Measuring the Effectiveness of an Intervention to Reduce Household Food Waste. J. Clean. Prod. 2023, 429, 139604. [Google Scholar] [CrossRef]
  18. Van Der Werf, P.; Seabrook, J.A.; Gilliland, J.A. “Reduce Food Waste, Save Money”: Testing a Novel Intervention to Reduce Household Food Waste. Environ. Behav. 2021, 53, 151–183. [Google Scholar] [CrossRef]
  19. Varotto, A.; Spagnolli, A. Psychological Strategies to Promote Household Recycling. A Systematic Review with Meta-Analysis of Validated Field Interventions. J. Environ. Psychol. 2017, 51, 168–188. [Google Scholar] [CrossRef]
  20. Vogels, J.W.P.M.; van der Haar, S.; Zeinstra, G.; Bos-Brouwers, H. ICT Tools for Food Management and Waste Prevention at the Consumer Level. 2018. Available online: https://eu-refresh.org/sites/default/files/WP1.5%20report%20FINAL.pdf (accessed on 9 May 2025).
  21. Farr-Wharton, G.; Choi, J.H.-J.; Foth, M. Food Talks Back: Exploring the Role of Mobile Applications in Reducing Domestic Food Wastage. In Proceedings of the 26th Australian Computer-Human Interaction Conference on Designing Futures: The Future of Design, Sydney, Australia, 2–5 December 2014; ACM Press: New York, NY, USA, 2014; pp. 352–361. [Google Scholar]
  22. Mathisen, T.F.; Johansen, F.R. The Impact of Smartphone Apps Designed to Reduce Food Waste on Improving Healthy Eating, Financial Expenses and Personal Food Waste: Crossover Pilot Intervention Trial Studying Students’ User Experiences. JMIR Form. Res. 2022, 6, e38520. [Google Scholar] [CrossRef] [PubMed]
  23. European Commission. Joint Research Centre. Evaluation of Consumer Food Waste Prevention Interventions; Publications Office: Luxembourg, 2023.
  24. Ganglbauer, E.; Fitzpatrick, G.; Comber, R. Negotiating Food Waste: Using a Practice Lens to Inform Design. ACM Trans. Comput.-Hum. Interact. 2013, 20, 1–25. [Google Scholar] [CrossRef]
  25. Van Herpen, E.; Van Der Lans, I.A.; Holthuysen, N.; Nijenhuis-de Vries, M.; Quested, T.E. Comparing Wasted Apples and Oranges: An Assessment of Methods to Measure Household Food Waste. Waste Manag. 2019, 88, 71–84. [Google Scholar] [CrossRef]
  26. Reynolds, C.; Goucher, L.; Quested, T.; Bromley, S.; Gillick, S.; Wells, V.K.; Evans, D.; Koh, L.; Carlsson Kanyama, A.; Katzeff, C.; et al. Review: Consumption-Stage Food Waste Reduction Interventions—What Works and How to Design Better Interventions. Food Policy 2019, 83, 7–27. [Google Scholar] [CrossRef]
  27. Hoehn, D.; Vázquez-Rowe, I.; Kahhat, R.; Margallo, M.; Laso, J.; Fernández-Ríos, A.; Ruiz-Salmón, I.; Aldaco, R. A Critical Review on Food Loss and Waste Quantification Approaches: Is There a Need to Develop Alternatives beyond the Currently Widespread Pathways? Resour. Conserv. Recycl. 2023, 188, 106671. [Google Scholar] [CrossRef]
  28. Quested, T.E.; Palmer, G.; Moreno, L.C.; McDermott, C.; Schumacher, K. Comparing Diaries and Waste Compositional Analysis for Measuring Food Waste in the Home. J. Clean. Prod. 2020, 262, 121263. [Google Scholar] [CrossRef]
  29. Withanage, S.V.; Dias, G.M.; Habib, K. Review of Household Food Waste Quantification Methods: Focus on Composition Analysis. J. Clean. Prod. 2021, 279, 123722. [Google Scholar] [CrossRef]
  30. National Academies of Sciences, E. A National Strategy to Reduce Food Waste at the Consumer Level; National Academies Press: Washington, DC, USA, 2020; ISBN 978-0-309-68073-8. [Google Scholar]
  31. Giordano, C.; Di Fiore, G.; Alboni, F.; Carloni, E.; Rivaroli, S.; Falasconi, L. Household Food Waste Awareness in Relation to Motivations. Sustainability 2023, 15, 11582. [Google Scholar] [CrossRef]
  32. European Commission. Joint Research Centre. Scoping Consumer Food Waste: An Evaluation Framework of Prevention Interventions; Publications Office: Luxembourg, 2023.
  33. Ölander, F.; Thøgersen, J. Understanding of Consumer Behaviour as a Prerequisite for Environmental Protection. J Consum. Policy 1995, 18, 345–385. [Google Scholar] [CrossRef]
  34. Soma, T.; Li, B.; Maclaren, V. An Evaluation of a Consumer Food Waste Awareness Campaign Using the Motivation Opportunity Ability Framework. Resour. Conserv. Recycl. 2021, 168, 105313. [Google Scholar] [CrossRef]
  35. von Kameke, C.; Fischer, D. Preventing Household Food Waste via Nudging: An Exploration of Consumer Perceptions. J. Clean. Prod. 2018, 184, 32–40. [Google Scholar] [CrossRef]
  36. van Geffen, L.; van Herpen, E.; Sijtsema, S.; van Trijp, H. Food Waste as the Consequence of Competing Motivations, Lack of Opportunities, and Insufficient Abilities. Resour. Conserv. Recycl. X 2020, 5, 100026. [Google Scholar] [CrossRef]
  37. Mobile Society Research Institute. Mobile Usage Trends 2022–2023 Deciphered by Data—Mobile Society White Paper—2023. Available online: https://www.moba-ken.jp/whitepaper/wp23/pdf/wp23_all.pdf (accessed on 9 May 2025).
  38. MyVoiceCom. Available online: https://myel.myvoice.jp/products/detail.php?product_id=30208 (accessed on 9 May 2025).
  39. pecco. Available online: https://pecco.app/ (accessed on 9 May 2025).
  40. Limiter. Available online: https://play.google.com/store/apps/details?id=jp.labboy.limiterflutter&hl=ja (accessed on 9 May 2025).
  41. Faul, F.; Erdfelder, E.; Lang, A.-G.; Buchner, A. G*Power 3: A Flexible Statistical Power Analysis Program for the Social, Behavioral, and Biomedical Sciences. Behav. Res. Methods 2007, 39, 175–191. [Google Scholar] [CrossRef]
  42. Faul, F.; Erdfelder, E.; Buchner, A.; Lang, A.-G. Statistical Power Analyses Using G*Power 3.1: Tests for Correlation and Regression Analyses. Behav. Res. Methods 2009, 41, 1149–1160. [Google Scholar] [CrossRef]
  43. Cohen, J. Statistical Power Analysis for the Behavioral Sciences, 2nd ed.; L. Erlbaum Associates: Hillsdale, NJ, USA, 1988; ISBN 978-0-8058-0283-2. [Google Scholar]
  44. Monitto. Available online: https://www.monitto.ne.jp/ (accessed on 9 May 2025).
  45. Okayama, T.; Watanabe, K.; Yamakawa, H. Sorting Analysis of Household Food Waste—Development of a Methodology Compatible with the Aims of SDG12.3. Sustainability 2021, 13, 8576. [Google Scholar] [CrossRef]
  46. Thaler, R.H.; Sunstein, C.R. Nudge: Improving Decisions About Health, Wealth, and Happiness; Penguin: New York, NY, USA, 2009; ISBN 0-14-311526-X. [Google Scholar]
  47. Torma, G.; Aschemann-Witzel, J.; Thøgersen, J. I Nudge Myself: Exploring ‘Self-nudging’ Strategies to Drive Sustainable Consumption Behaviour. Int. J. Consum. Stud. 2018, 42, 141–154. [Google Scholar] [CrossRef]
  48. Reijula, S.; Hertwig, R. Self-Nudging and the Citizen Choice Architect. Behav. Public Policy 2020, 6, 1–31. [Google Scholar] [CrossRef]
  49. Farr-Wharton, G.; Foth, M.; Choi, J.H.-J. Colour Coding the Fridge to Reduce Food Waste. In Proceedings of the Australian Computer-Human Interaction Conference—OzCHI ’12, Melbourne, Australia, 26–30 November 2012; ACM Press: New York, NY, USA, 2012; pp. 119–122. [Google Scholar]
  50. Flanagan, K.; Robertson, K.; Hanson, C. Reducing Food Loss and Waste: Setting the Global Action Agenda; World Research Institute: Washington, DC, USA, 2019. [Google Scholar]
Figure 1. Overview of Three Steps and food waste reduction.
Sustainability 17 06392 g001
Figure 2. Mechanisms of the Organizer intervention.
Sustainability 17 06392 g002
Figure 3. Mechanism of the Photos intervention.
Sustainability 17 06392 g003
Figure 4. Mechanism of Apps intervention.
Sustainability 17 06392 g004
Figure 5. The schedule of this experimental study.
Sustainability 17 06392 g005
Figure 6. Images of the cloud-based automatic weighing system.
Sustainability 17 06392 g006
Figure 7. Average weekly food waste per household.
Sustainability 17 06392 g007
Table 1. The result of the statistical analysis of 13 behaviors by means of two-way mixed ANOVA and correlation.
Interaction EffectSimple Main Effect (Mean Difference)Correlation
TypeBehaviorF-Valuedf1df2p ValueOrganizerPhotoAppsControlReduction and Behavioral Difference
FindTried to find foods that should be eaten quickly.0.79331150.5000.483 *0.0670.367 +−0.233−0.007
MoveMoved foods that should be eaten quickly.3.85231110.012 *1.111 **0.552 *0.1330.000−0.064
UseUsed foods that should be eaten quickly as a priority.1.18831130.3180.0710.300 *0.241 +−0.033−0.196 *
UseUsed up the food in the refrigerator.0.53131150.6620.379 **0.267+0.500 **0.333 *−0.206 *
UseMade a quantity that I could finish.1.50831150.2160.2760.567 **0.0670.267−0.129
EatTried to finish the food I cooked.1.29331150.2800.276 *0.0670.033−0.100−0.364 **
OrganizeFrequency of organizing the refrigerator.4.47831090.005 **1.143 **0.607 *0.621 *−0.107−0.134
KnowKnew inventory in the refrigerator.2.32831150.078 +0.621 **0.333 **0.600 **0.100−0.199 *
KnowKept track of the expiration dates of the food in the refrigerator.2.66431150.051 +0.828 **0.633 **0.900 **0.233−0.186 *
KnowHad trouble not being able to recall food inventory at home during shopping.2.79131150.044 *−0.586 +−1.067 **−1.333 **−0.2330.125
ShopBought too much.0.61631150.606−0.379−0.633 *−0.867 **−0.533 *0.151
ShopBought the same item twice.2.31431130.080 +−0.345 **−0.333 **−0.433 **0.0000.174 +
ShopWas careful how much I buy.2.02831150.1140.517 **0.367 +0.500 **−0.067−0.271 **
** p < 0.01, * p < 0.05, + p < 0.10.
Disclaimer/Publisher’s Note: The statements, opinions and data contained in all publications are solely those of the individual author(s) and contributor(s) and not of MDPI and/or the editor(s). MDPI and/or the editor(s) disclaim responsibility for any injury to people or property resulting from any ideas, methods, instructions or products referred to in the content.

