Article

Forecast of CO2 and Pollutant Emission Reductions from Electric Vehicles in Beijing–Tianjin–Hebei

1
College of Economics and Management, Tianjin University of Science and Technology, Tianjin 300222, China
2
School of Management, Tianjin University of Technology, Tianjin 300384, China
*
Author to whom correspondence should be addressed.
Sustainability 2025, 17(14), 6386; https://doi.org/10.3390/su17146386
Submission received: 20 May 2025 / Revised: 7 July 2025 / Accepted: 9 July 2025 / Published: 11 July 2025

Abstract

The promotion of new energy vehicles (NEVs) represents a critical strategy for mitigating carbon emissions and air pollution. To evaluate the CO2 and air pollutant reduction potential of NEVs in the Beijing–Tianjin–Hebei region, this study developed an integrated framework combining gray correlation analysis (GRA) and bidirectional long short-term memory (BiLSTM), referred to as the GRA-BiLSTM model, to forecast the adoption trend of NEVs and calculate the CO2 and air pollutant emission reduction. The GRA-BiLSTM model developed in this study shows optimal predictive performance. The results indicate that new energy vehicles (NEVs) have great potential for environmental collaborative emission reduction in the transportation sector: it is predicted that by 2035, the total number of NEVs will be nearly 11.88 million, with a cumulative reduction of 2.76 billion tons of carbon emissions and significant reductions in various key air pollutants. This study provides an important quantitative basis for formulating pollution reduction and carbon reduction policies in the transportation sector.

1. Introduction

China’s motor vehicle ownership increased rapidly over the past two decades. By 2021, the national total reached 395 million units, marking a 19-fold growth since 1990. The transportation sector’s energy consumption and carbon emission intensity now drive global warming and resource scarcity [1,2]. The rapid expansion of motor vehicle ownership has imposed substantial pressures on China’s energy security, greenhouse gas mitigation, and air quality management. Traditional fuel vehicles exhibit the most significant environmental impact [3,4]. In China, the transportation sector contributes 9% of CO2 emissions, with road transport accounting for 60% of NOx and 24% of VOCs emissions [5,6]. Dense urban areas face compounded risks from vehicle emissions, including climate change acceleration and public health deterioration [7,8].
To address global warming, energy shortages, and environmental pollution, countries worldwide are promoting new energy vehicles (NEVs) to replace conventional fuel vehicles. This initiative aims to reduce fossil fuel consumption, greenhouse gas emissions, and air pollutant emissions [9]. To reduce CO2 and air pollutant emissions, China implemented phased policies: For example, China has implemented a fuel tax policy since 2009 and heavily subsidized the NEV market since 2010 [10,11]. In addition, at the 2020 United Nations General Assembly, China announced its commitment to peak carbon emissions by 2030 and achieve carbon neutrality by 2060. To achieve this goal, some regions of China (Hainan Province, etc.) and some automobile manufacturers (BYD, etc.) have announced plans to ban the production and sale of traditional fossil fuel vehicles [12,13]. Recently, the Chinese government has launched the Opinions of the Central Committee of the Communist Party of China and the State Council on Comprehensively Promoting the Construction of a Beautiful China, which proposes promoting the large-scale application of ultra-low and near-zero emission vehicles and the clean and low-carbon application of non-road mobile machinery. A target of 45% NEV market penetration by 2027 has been set. This means that China will move to replace the more polluting fuel motor vehicles with NEVs in the future. These policies are of great significance to CO2 emission reduction and air pollution control in the transportation sector.
The Beijing–Tianjin–Hebei region remains one of China’s most severely air-polluted areas. While air quality has improved substantially under the Air Pollution Prevention and Control Action Plan and the Three-Year Blue Sky Defense Initiative, recurrent seasonal pollution episodes persist during autumn and winter, indicating ongoing atmospheric environmental pressures. The use of NEV requires a large amount of electricity. According to the National Bureau of Statistics, the share of coal-fired power generation in the Beijing–Tianjin–Hebei region will remain as high as 81.2% in 2023. Against this backdrop, the Beijing–Tianjin–Hebei region still poses a significant air quality hazard when it comes to providing power for NEV [14,15,16]. Therefore, the emission reduction effect of CO2 and air pollutants (CO, NOX, SO2, PM2.5, VOCs, etc.) from new energy vehicles will bring different effects depending on the power generation mix. Therefore, it can be concluded that the future NEV development trend and power generation mix are the two key influencing factors in the study of CO2 and air pollutant emission reduction effects in the Beijing–Tianjin–Hebei region.
This study develops a GRA-BiLSTM model to predict NEV ownership in the Beijing–Tianjin–Hebei region (2024–2035) under low, reference, and high growth scenarios. It assesses the future energy mix and quantifies CO2 and air pollutant emission reductions using an NEV emission reduction model. The research aims to forecast regional NEV adoption and measure associated environmental benefits.

2. Literature Review

2.1. New Energy Vehicle CO2 and Air Pollutant Emission Reduction

Early research in the 1990s initially examined the emission reduction potential of new energy vehicles (NEVs). Studies consistently show that replacing conventional vehicles with NEVs reduces both CO2 emissions and major air pollutants. However, research has also identified that some transportation sector CO2 reduction measures may lead to increased emissions of certain air pollutants [17]. Due to regional differences in vehicle composition and transportation patterns, the co-benefits for CO2 and air pollutant reductions vary [18]. Overall, NEV promotion contributes to reducing both CO2 and air pollutant emissions. For example, Pan et al., in their study of NEV’s impact on air quality in the Houston area of the United States, found that NEV’s activity emissions could be reduced by 95%. Later, Pan et al. projected the impact of promoting NEV in the U.S. to reduce CO2 emissions by 75% by 2050 [19]. In Iran, rapidly growing electric motorcycle use effectively decreased emissions of CO, VOCs, and NOx [20]. In China, Xu et al. projected future data on motor vehicle ownership in Hainan and calculated the emission reductions of CO2 and air pollutants under different policy scenarios [12]. Sun et al. calculated air pollutant emission reductions by predicting motor vehicle ownership in Tianjin by 2030. The results show that the promotion of NEV can effectively reduce air pollutant emissions [21].

2.2. New Energy Vehicle Prediction Model

Most previous studies used linear growth projections or set target-year NEV penetration rates to measure vehicle emissions. However, NEV ownership growth represents a long-term, nonlinear process influenced by multiple factors. Earlier studies didn’t adequately consider how various factors might affect future ownership growth. Current approaches to address this nonlinear, multi-factor challenge include gray models, econometric models, and machine learning methods. Gray models have proven particularly effective for small-sample NEV ownership prediction [22]. Liu et al. predicted the sales of new energy vehicles in China based on an optimized fractional discrete gray power model, which showed that the sales will reach 8.84 million units by 2025, accounting for 24% of the total automobile sales [23]. Gao et al. developed a system dynamics (SD) model of clean energy vehicle development in a large Chinese city to predict the market and development of fuel cell vehicles and electric vehicles driven by relevant policies [24]. Machine learning enables accurate predictions from training sample data. Bao et al. used a data-driven approach of correlation vector machines (RVM) suitable for small sample data to predict electric vehicle ownership in China [25]. However, the above methods do not eliminate the volatility of the data and do not realize the multi-indicator dimension of the prediction of new energy vehicle ownership.
Compared with traditional machine learning, deep learning techniques address the limitation of machine learning being only capable of local optimization, solve the nonlinear data processing problem, and achieve more accurate predictions [26]. Deep learning technology can extract information from data, learn patterns of data variation, and demonstrate strong self-learning and adaptive capabilities. Increasing the volume and diversity of training data enhances model robustness [27]. It can also eliminate redundant data features to enhance its generalization capability for addressing small-sample problems [28]. The method can also calculate correlations between influencing factors through gray relation analysis(GRA), eliminate low-correlation factors, and reduce experimental errors caused by irrelevant data, thereby improving model prediction performance.

3. Data and Methods

3.1. Data Sources

The scale and availability of data on factors influencing NEV ownership in the Beijing–Tianjin–Hebei region were considered. A preliminary set of 82 data sets from January 2017 through October 2023 was selected for 12 NEV retention impact indicators. Constructing the NEV retention impact indicator system. T1–T12, respectively, are fuel vehicle sales, NEV search index, NEV information index, air quality search index, charging pile ownership, power generation, gasoline price, steel production, aluminum production, copper production, GDP, and engine production. T1 is a competitive product data indicator, which can reflect the trend of NEV ownership data from boutique sales. T2–T4 are the Baidu Search Index; Baidu is the most commonly used search engine in China, which can reflect NEV data from consumer attention. T5–T12 are NEV industry-related indicators that can reflect NEV data from the core component supply. T6-T11 are macroeconomic capacity indicators. Among them, T1 data comes from the authoritative Autohome database in China(https://www.autohome.com.cn/ accessed on 12 February 2023). T2–T4 data from Baidu (https://index.baidu.com/ accessed on 10 October 2024). T5 data from China’s Electric Vehicle Charging Infrastructure Promotion Alliance (https://www.evcipa.org.cn/newsinfo/8137834.html accessed on 21 June 2024). Data for T6 and T8–T12 are from the National Bureau of Statistics of China (https://www.stats.gov.cn/ accessed on 6 January 2023). T7 data are from Eastern Wealth (http://eastmoney.com/ accessed on 28 April 2024).

3.2. GRA-BiLSTM

The GRA-BiLSTM model represents an intelligent network architecture that integrates the strengths of gray correlation analysis (GRA) and bidirectional long short-term memory (BiLSTM) neural networks, forming a multi-factor predictive intelligent network system. This approach employs correlation analysis to quantify relationships between reference sequences and multiple comparison sequences. The model then filters the high-correlation indicators into the learning framework, enhancing both deep learning efficiency and prediction accuracy. The experimental data are subsequently processed through the BiLSTM model by optimizing four key parameters: learning rate, time step, hidden layer quantity, and training duration. This implementation enables NEV retention predictions that serve as the foundation for CO2 and atmospheric pollutant calculations. The model structure is shown in Figure 1.

3.2.1. Gray Relation Analysis

Gray correlation analysis (GRA) can measure the relationship between selected research factor indicators based on the degree of similarity or difference in the trends of the factors [29]. The GRA method is computationally small and is applicable to both sample size and regularity [30]. First, the sequence of factors selected for the study is dimensionless. The correlation coefficients will be obtained according to Equation (1). Where ε is the discriminant coefficient, for 0 < ε < 1 reducing the effect of over-maximization on the distortion of the correlation coefficients. According to the current study of gray resolution coefficients, when the sequence has large fluctuations or strange values, ε takes a smaller value to reduce ξ i k on the maximum value. When the sequence is stable, ε takes a larger value to reflect the integrity of the system. The data for the factors selected for this study are time-series data, with little fluctuation in the data. The value of ε is chosen to be 0.5. Finally, the analysis was performed by gray correlation analysis with the following formula:
ξ i k = min i , k x 0 k x i k + ε max i , k | x 0 k x i k | x 0 k x i k + ε max i , k | x 0 k x i k |
where, k = 1, 2, 3, …, m; i = 1, 2, 3, …, n; and ε denotes the differentiation factor.

3.2.2. BiLSTM

In a traditional long short-term memory (LSTM) network, the input time-series data is processed serially, and it captures only the positive sequence information [31,32]. BiLSTM is composed of two independent LSTMs that are responsible for processing the input sequence from two directions (positive and negative). The model can generate information both before and after the current time step. BiLSTM is capable of handling long sequences and long-term dependencies and is suitable for time series forecasting tasks [33]. By extracting historical data information through bidirectional sequences, the model can fully take into account the pattern of change before and after NEV retention time series prediction and improve the model performance. The model is shown in Figure 1.
Calculate from time 1 to time t to obtain and save the output of each forwarding in the forwarding layer. Calculate the time from 1 from back to the next layer, and obtain and save the output of the next layer. Finally, by combining the outputs of the corresponding moments of the forward and backward layers, the final output for each moment can be obtained. The mathematical expressions are shown in (2)–(4).
h t = f ( w 1 x t + w 2 h t 1 + b )
h t = f ( w 3 x t + w 5 h t 1 + b )
y t = w 4 h t + w 6 h t + b y
where w 1 w 6 are the weight coefficients; h t , h t , x t , and y t are vector forward propagation, backward propagation, input layer, and output layer, respectively; and b , b , and b y are bias vectors, respectively.

3.2.3. Factor Trend Analysis

This study builds upon existing research to evaluate and forecast the development trajectory of the NEV industry. The analysis incorporates the distinctive developmental characteristics observed across various stages of China’s medium-to-long-term socioeconomic evolution while accounting for carefully selected influencing factors. Three scenarios of high growth, reference, and low growth are proposed. The average year-on-year growth rate of the monthly data represents the change in each of the input indicators in the scenario setup. High and low growth scenarios are identified based on the growth rate setting of the reference scenario [34].
NEV has grown rapidly in recent years as a competitive alternative to fuel vehicles. According to the “2023 Auto Market Annual Summary and 2024 Forecast” published by the Auto Home Research Institute, fuel vehicle sales will decline by 6%. Combined with the last five years of data on fuel vehicle sales in the Beijing–Tianjin–Hebei region, the reference scenario growth rate for fuel vehicle sales is set at −6%. Considering the 1:1 vehicle-to-pile ratio target outlined in the Guiding Opinions on Accelerating the Construction of Electric Vehicle Charging Infrastructure. The reference scenario for charging pile ownership in the Beijing–Tianjin–Hebei region is set at 3%. Electricity consumption of the whole society will continue to rise rapidly, and power generation will continue to grow in most provinces [35]. Considering again the last five years of generation data in the Beijing–Tianjin–Hebei region, the reference scenario generation growth rate is set at 4%. China’s gasoline prices are sensitive to fluctuations in international crude oil prices, taking into account the impact of the global pandemic and New Crown epidemic on the volatility of the crude oil market [36]. The reference scenario growth rate for gasoline prices in Beijing and Tianjin is set at 3%. Steel production will peak when a country is fully industrialized. Steel production peaks at 90.1 million tons in 2020 and continues for at least 9 years [37]. Therefore, the reference scenario growth rate for steel production is set at 0.5%. The NEV Search Index and NEV Consultation Index growth rates for the reference scenario are set at −1% and −3% based on the last five years of historical data.

3.3. Model Parameter Tuning Process

The BiLSTM neural network contains five parameters that affect the prediction accuracy, including the batch_size, the learning rate, the time step, the Hidden_layer, and the training epoch. In this study, the parameters were adjusted sequentially within the specified parameter ranges, and the adjusted parameters were used to train the model. The specific parameter adjustments are shown in Table 1 with the prediction accuracy results.

3.4. K-Fold Cross Validation

The model data is divided into a training set and a test set, where the training set is the data samples used for model fitting, and the test set is completely unrelated to the training and is only used to evaluate the generalization ability of the final model, which may have overfitting problems. At this point, any modification of the model parameters based on the test set data will affect the correctness of the final evaluation results. Therefore, a portion of the data from the training data is usually taken as the validation set but not involved in the training so that the degree of matching between the model and other data can be evaluated more objectively.
K-fold cross validation divides the data into K groups, and each time K-1 groups of data are selected from these groups as a training set, and the rest of the groups are used as a validation set for model training and evaluation. This process is repeated until K experiments are completed, as shown in Figure 2. In this experiment, the value of k is set to 5, and the input data are equally divided into 5 groups, and each time a group is selected as the validation set and the rest as the training set. The ratio of validation set to training set for each experiment is 1:4, and the average MAPE of the 5 experiments is calculated to evaluate the applicability of the input data to the model.

3.5. Estimation of Emission Reductions from New Energy Vehicles

3.5.1. Estimation of Fuel Vehicle Emissions

The number of vehicles (VP), vehicle kilometers traveled (VKT), and emission factor (EF) are the basic determinants of total vehicle emissions. In addition, the Beijing–Tianjin–Hebei region is still dominated by coal-fired thermal power generation, supplemented by wind and photovoltaic power generation. The percentage of clean energy generation determines how clean a new energy vehicle is in use. Based on the power consumption of pure electric vehicles, the proportion of each power generation method and its corresponding emission factor, an estimation model of electric vehicle emission reduction was constructed. Modeling for estimating electrical greenhouse gas and pollutant emission reductions from motor vehicles in the Beijing–Tianjin–Hebei region. The model equations are (5)–(7).
E = E E
E n = i j k V P i , j , k × V K T i , j × E F i , j , k , n × 10 6
E n = j V P j × V K T j × q j 100 × λ c × ( 1 λ l ) × g A g × E F g , n
where E is the annual emission reduction of NEV(t); E is the annual emission of fuel oil (t); E is the annual emission of electricity generation measurement (t); i is the vehicle fuel type, which consists mainly of gasoline, diesel, and hydrogen; and j is the type of vehicle. In this study, vehicles were categorized into light-duty passenger vehicle (LDV), medium-duty passenger vehicle (MDV), heavy-duty passenger vehicle (HDV), light-duty truck (LDT), medium-duty truck (MDT), heavy-duty truck (HDT), bus, and taxi based on the Technical Guidelines for the Preparation of the Road Vehicle Emission Inventory of Air Pollutants. k is the vehicle emission standard (National I to National VI). VP is the number of vehicles. EF is the emission factor (g/km). Since the emission standards of China and the EU are very similar. The EU motor vehicle emission model COPERT is also widely used to study motor vehicle emissions in Chinese cities and regions [38]. Therefore, the motor vehicle emission factors in this study refer to the “Technical Guidelines for the Preparation of Emission Inventories for On-Road Motor Vehicles” and the EU motor vehicle emission standards (refer to Schedule 1 for the complete dataset). VKT is the number of kilometers the vehicle has traveled. In this case, the VKT for LDV was taken from the Northern Longitudinal Survey data (http://www.bfzh.com.cn/ accessed on 28 April 2024) for field surveys in various regions of China. Other models refer to the settings of Jiang et al. [39]. n is the type of emission, including the greenhouse gas CO2 and atmospheric pollutants (CO, NOX, SO2, PM2.5, and VOCS). q is the average 100 km power consumption of NEV in the Beijing–Tianjin–Hebei region (refer to Exhibit 2 for the complete dataset). The LDV is 15.076 kwh/100 km, and the HDV is 58.46 kWh/100 km. The former is gradually reduced to 12 kWh/100 km by 2025, as required by the NEV Industry Development Plan (2021–2035). λ c is the charging efficiency of EV. According to “Electric Vehicle Charging System Technical Specification Part 3: Non-vehicle Chargers”, the charging efficiency is not less than 90%. λ l is the line loss rate per unit, which averaged 5.6% for China’s electricity transmission line loss rate in 2020 (China Electricity Council). g denotes the form of electricity generation, including coal-fired and clean energy generation. A g is the share of electricity generated by different forms of generation. E F g is the emission factor for the power generation side (g/kWh). Beijing–Tianjin–Hebei implementation of ultra-low emission retrofits for thermal power plants in 2019. The emission factors for coal-fired power generation for the four pollutants are shown in Table 2 [40]. For hybrid electric vehicles (HEV), this study follows the setting of Song et al. HEV is driven by a gasoline internal combustion engine at speeds above 20 km/h and by electricity at speeds below 20 km/h [41].

3.5.2. Vehicle Age Distribution

Different vehicle models and different emission standards affect the calculation of vehicle emissions. This study measures vehicle emissions based on the temporal implementation of emission standards and the age distribution of vehicles. The age distribution is the proportion of vehicles of a given model year in a fixed number of years. This is because of the lack of data on the number of cars scrapped and the age of cars in the Beijing–Tianjin–Hebei region. Therefore, this study refers to the method of Duan et al. to derive the age distribution of cars from the relationship between the age distribution curve of cars, car ownership, and the number of newly registered vehicles [40]. In addition, this study assumes that all new vehicles after 2023 comply with the latest national emission standards and end-of-life policies. In calculating the automobile age distribution, this study chooses the Weibull distribution, which is more suitable for complex situations than the uniform or truncated normal distribution. The formula is as follows:
V P β , i , j = S j , i β × α β , j ( i )
V P i , j = β V P β , i , j
α β , j = e β λ j k j
where β is the age of the vehicle; i is the year; j is the vehicle type; S is the number of newly registered vehicles; α β , j ( i ) denotes the distribution by the two-parameter ( k j , λ j ) Weibull distribution; λ is the scale parameter; and k is the shape parameter [42].

4. Results and Discussion

4.1. Predicted New Energy Vehicle Ownership

In this study, the degree of association between T1–T12 and NEV retention was calculated using gray correlation analysis. The results are shown in Table 3. The correlation literature usually considers correlations greater than 0.6 to be significant [43]. In order to further improve the accuracy of the prediction results, the influencing factors with gray correlation coefficients greater than 0.7 were selected as input indicators for the model.
To verify the validity and accuracy of the proposed NEV retention prediction model. Mean Absolute Percentage Error (MAPE), Root Mean Square Error (RMSE), and Mean Absolute Error (MAE) are selected in this study to evaluate the accuracy of the model prediction. As shown in Equations (11)–(13).
M A P E = 100 % n i = 1 n y ^ i y i y i
R M S E = 1 n i = 1 n y ^ i y i 2
M A E = 1 n i = 1 n y ^ i y i
y ^ = y ^ 1 , y ^ 2 , , y ^ n is the predicted value; y = y 1 , y 2 , , y n is the truth value; and n is the number of indicator variables.
In contrast to RMSE and MAE, MAPE is independent of the order of magnitude and has been widely used to assess the accuracy of predictive models. The smaller the value of MAPE, the better the predictive power of the forecasting model [44] (refer to Table 4 for the evaluation criteria).
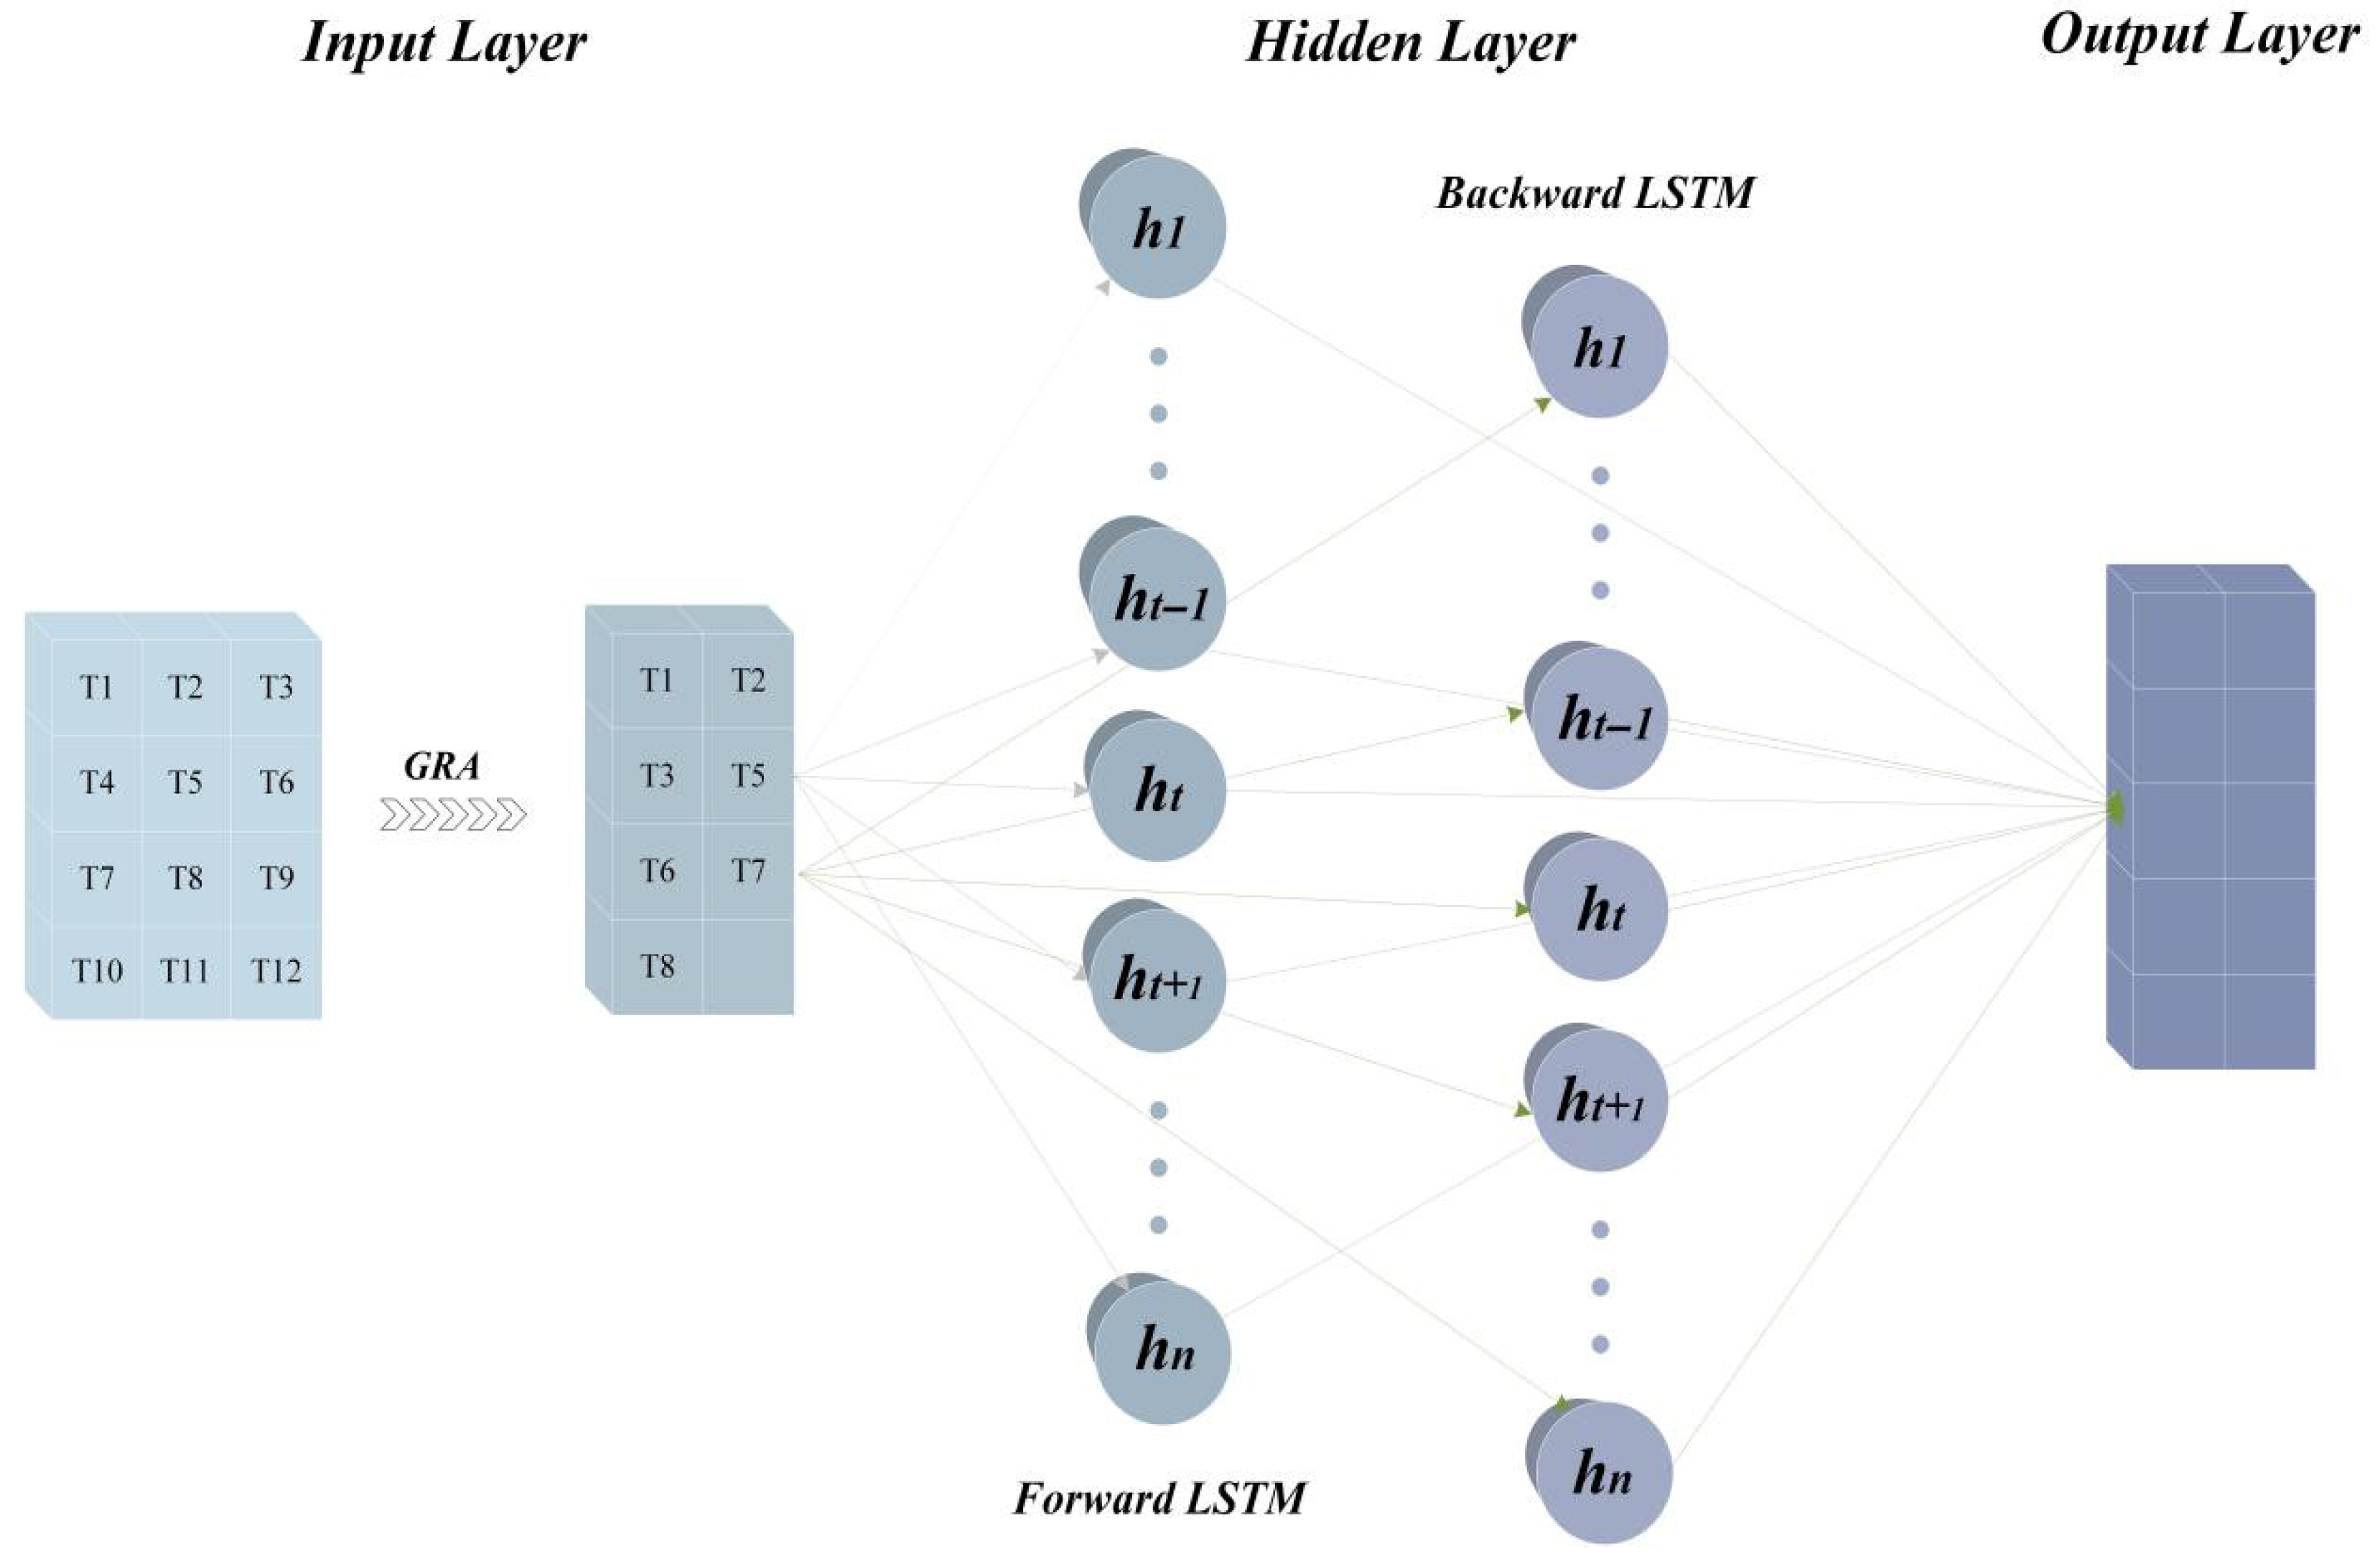
To more accurately predict NEV ownership in the Beijing–Tianjin–Hebei region. In this study, four models, Support Vector Regression (SVR), Gated Recurrent Unit (GRU), Long Short-Term Memory (LSTM), and Bidirectional Long Short-Term Memory (BiLSTM), and their respective combinations with Gray Correlation Analysis were used for training. The optimal model is then selected from the four models. The ratio of training set to test set during training is 8:2.
It can be seen from Table 5. All the models achieve reasonable predictions. The GRA-BiLSTM model has lower MAE, MAPE, and RMSE than the other models and has good applicability in NEV sales prediction. The combined models are generally more accurate than the base Magic Heart machine learning and deep learning forecasting models can learn correlations between input and output variables, just like a human network. Among other things, deep learning models have a more comprehensive understanding of time-series data trends and are more accurate in predicting NEV retention.
The BiLSTM neural network contains five parameters that affect the prediction accuracy of the model, including time-step, learning rate (Ir), amount of data per training (batch-size), number of hidden layers (dim_Hidden_layer), and number of training times (nb-epoch). At the beginning of the experiment, the default hyperparameter settings were used to observe the changes in loss and determine the range of each hyperparameter. The parameters were then adjusted to find more accurate parameters. The hyperparameters used in this study are shown in Table 6.
NEV ownership in the Beijing–Tianjin–Hebei region from 2024 to 2035 was obtained by the GRA-BiLSTM model prediction. 
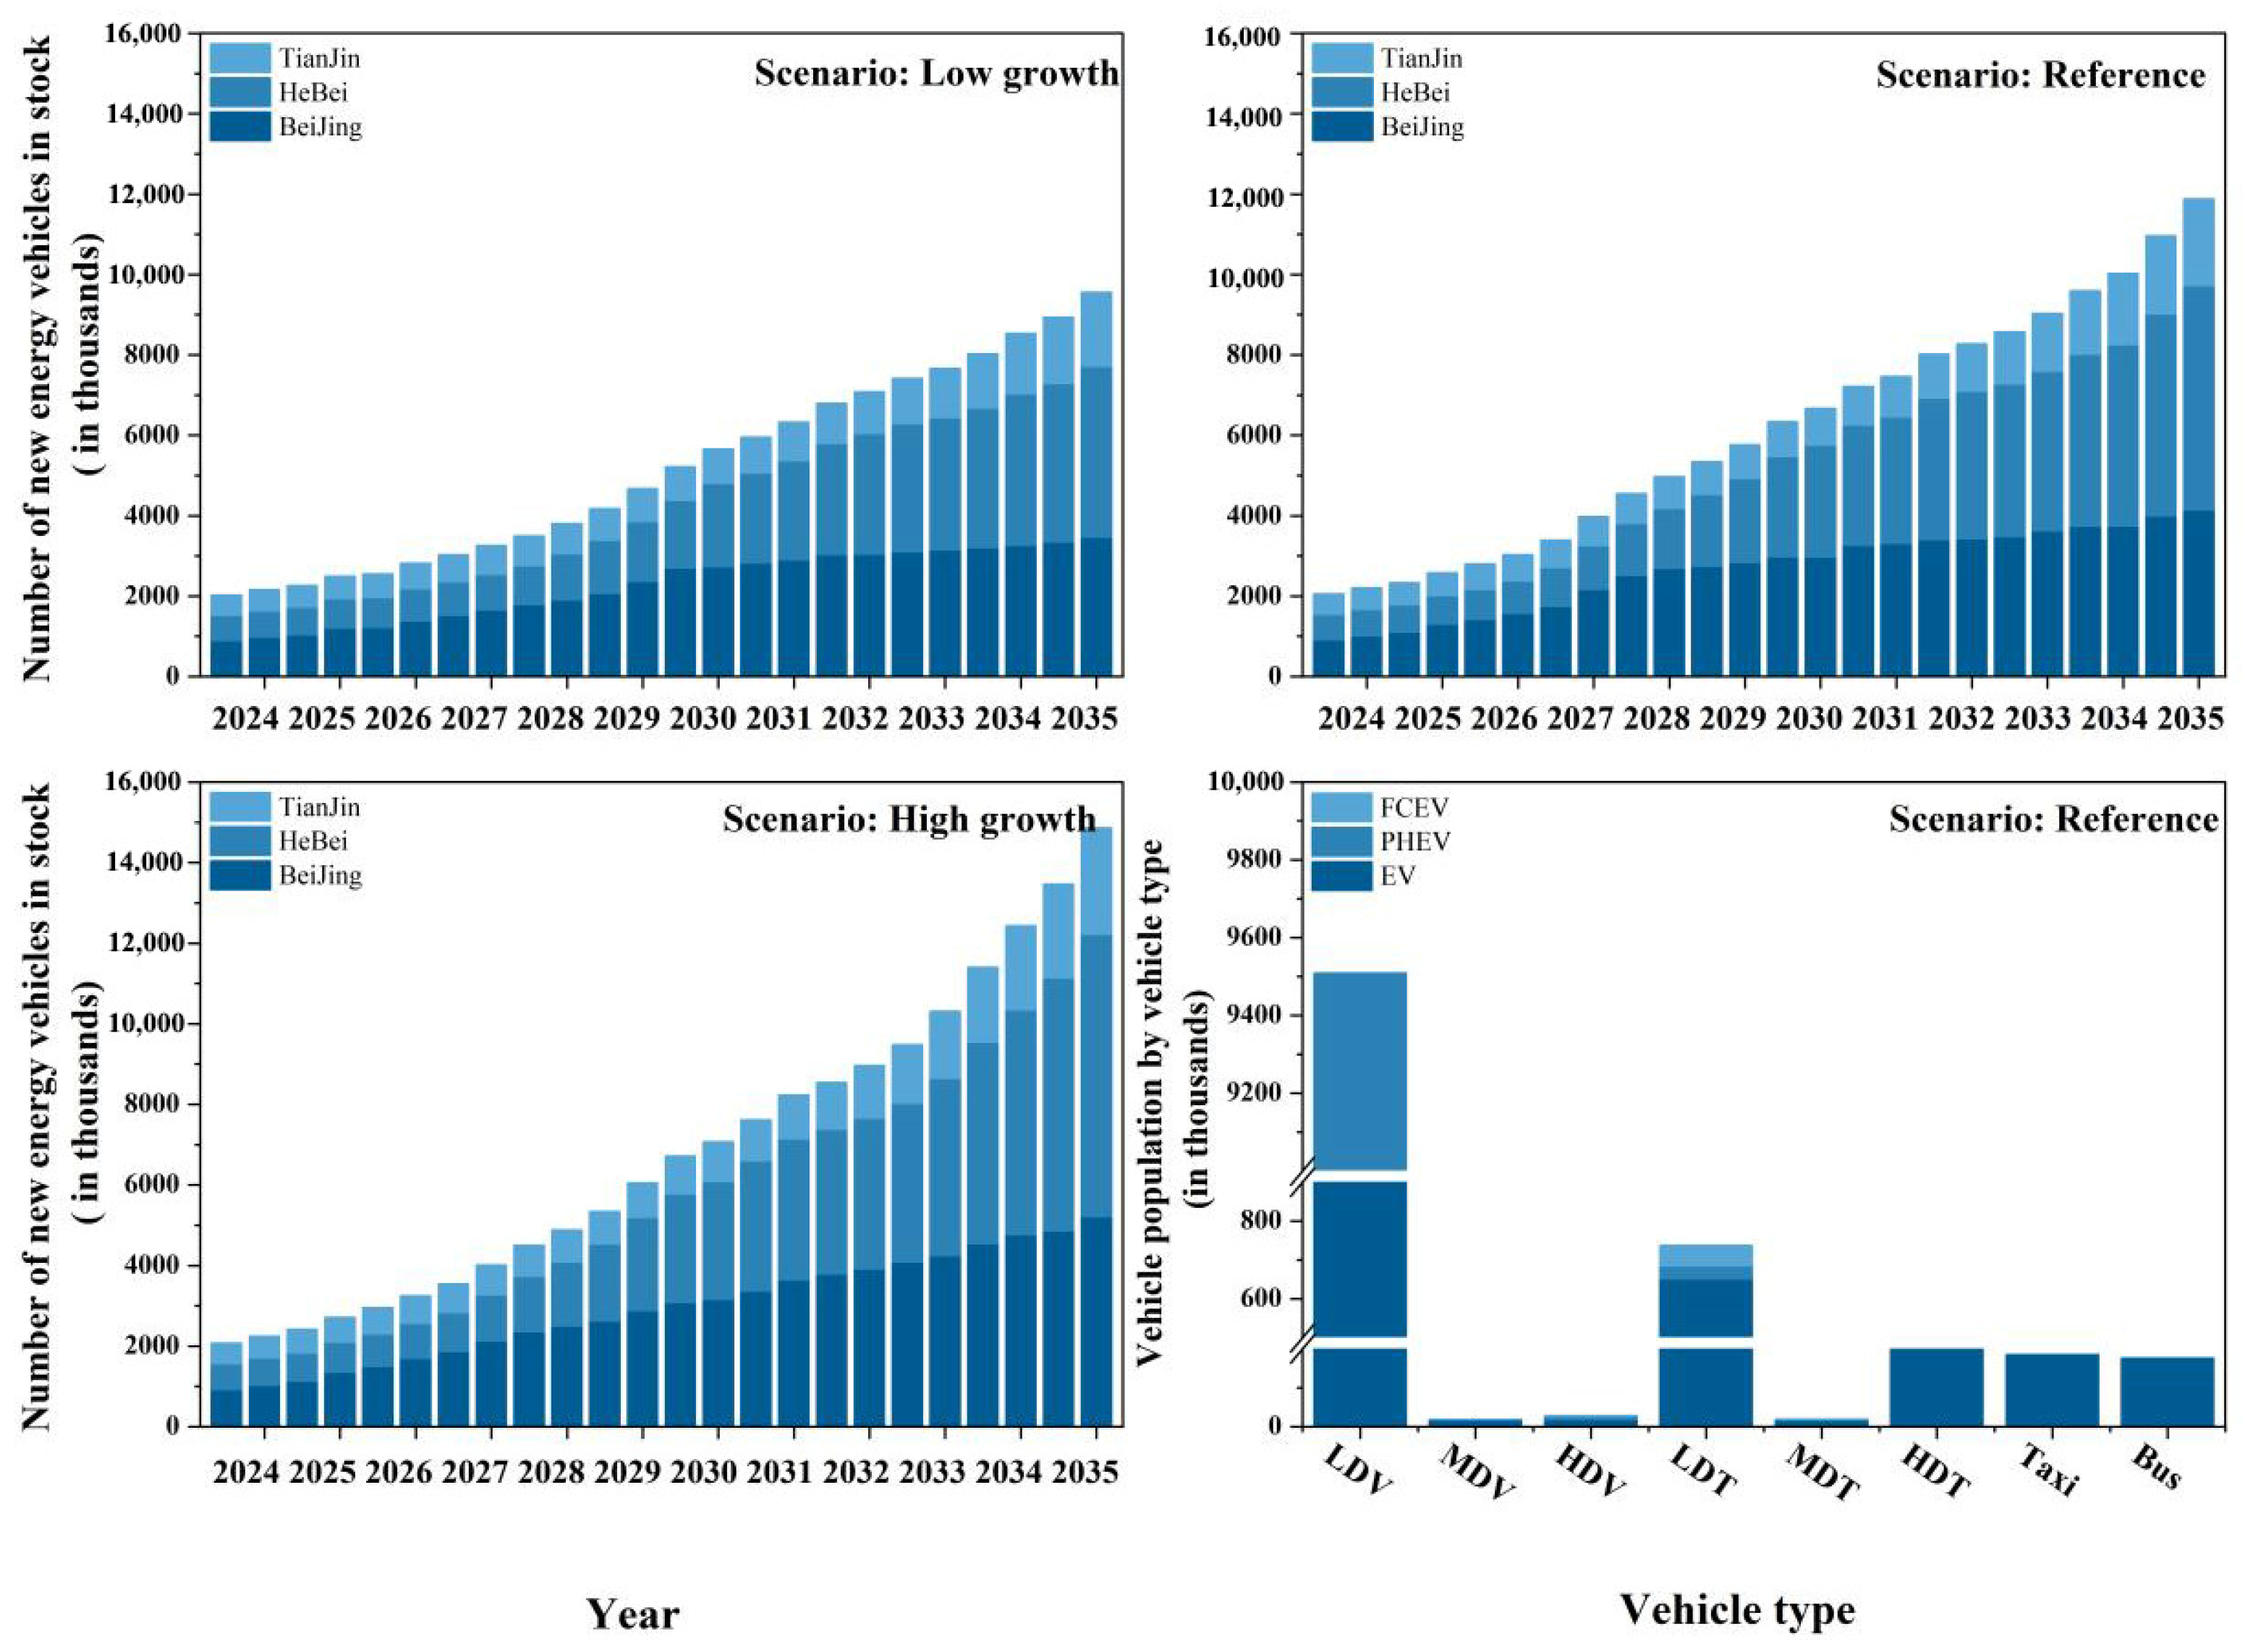
Figure 3 shows the trend of NEV ownership in the Beijing–Tianjin–Hebei region in the future. NEV holdings are continuously rising under the three scenarios. Among them, Tianjin has the lowest growth rate, and Hebei has the highest growth rate. We believe the likely reason for this is that in the early years of the popularization of new energy vehicles, Hebei has the lowest economic level among the three provinces, resulting in the lowest acceptance of new energy vehicles. As the popularity of new energy vehicles increases, Hebei shows a higher level of growth due to its lower saturation of new energy vehicles. By 2035, NEV holdings will fluctuate between 9,560,100 and 14,867,000 units. The low scenario has a NEV ownership of 9,560,100 units. The high scenario has the fastest growth rate, with NEV holdings being 14.867 million units, which is 155.51% of the low-growth scenario. The results show that the experimentally selected indicator accelerates the growth rate of NEV holdings when high growth rates are carried out. NEV ownership for the reference scenario is 11,880,300 units, which is between the low and high scenarios. The experimental indicator growth rate setting of this scenario is most in line with the current development status of the Beijing–Tianjin–Hebei region. Therefore, this scenario serves as the reference scenario for this study. Based on the above results, it can be found that the future demand for NEV in the Beijing–Tianjin–Hebei region is large, and the NEV industry will continue to maintain a high rate of development.
From the motor vehicle data of the Zhiyun Research Institute (https://zhiyun.souche.com accessed on 28 April 2024), it can be seen that in 2023, the proportion of LDV, MDV, HDV, LDT, MDT, HDT, bus, and taxi in the NEV of the Beijing–Tianjin–Hebei region are 84.30%, 0.18%, 0.47%, 1.58%, 0.06%, 1.00%, 5.73%, and 6.68%, respectively. This study assumes that by 2035, NEV’s share of each model will grow linearly to reach the current values of the share of each model of motor vehicle. The shares of LDV, MDV, HDV, LDT, MDT, HDT, bus, and taxi are 86.66%, 0.16%, 0.26%, 6.72%, 0.18%, 2.74%, 1.60%, and 1.68%, respectively. Among them, LDV, LDT, MDT, and HDT increased by 2.36%, 5.14%, 0.12%, and 1.74%, respectively. While the share of other models decreased. This is because the electrification rate of trucks is low due to their heavy loads, long mileage, and high requirements for battery life and charging speed. The urban public transport system, however, is affected by energy-saving and carbon reduction policies and low transportation costs, leading to the current high electrification rate of bus and taxi. However, as NEV gradually replaces fuel cars and the development of all types of new energy vehicles gradually equalizes, the proportion of bus and taxi will decrease. In addition, in the future LDVs will remain the main vehicle owned in the Beijing–Tianjin–Hebei region and will be the key vehicle for the development of new electric vehicles.

4.2. Sensitivity Analysis

In order to assess the applicability of the GRA-BiLSTM model for various datasets, a sensitivity analysis is required. Sensitivity analysis is an effective method for assessing the impact of parameter variations on system results [45]. The sensitivity of the variables to the test parameters can be calculated as follows:
S t = Y t Y t / Y t X t X t / X t
where S t is the sensitivity of variables to test parameters at time t, setting January 2017 as t = 1; Y t and Y t are the values of output variables before and after change at time t; and X t and X t are the values of input variables before and after change at time t. The maximum sensitivity of NEV ownership forecast during 2017 to 2023 is:
S = max ( S t ) , 1 t 82
The sensitivity of the NEV predictor variables to the twelve main input variables in the proposed GRA-BiLSTM model is investigated and analyzed by changing the corresponding input variables by −10%, −5%, −3%, −1%, 3%, 5%, and 10%. Table 7 shows the maximum sensitivity of NEV ownership forecasts to changes in the twelve input variables for the period 2017–2023.
The results show that the maximum sensitivity of the optimal model for NEV ownership prediction for all 12 input variables for the years 2017–2023 is less than 1, indicating that the maximum sensitivity of the GRA-BiLSTM model for NEV ownership prediction is low. Therefore, the model in this study is stable and can be applied to the same time range data with fluctuations up to 10% without abnormal fluctuations in the output variable data due to changes in the input variables.

4.3. Results of K-Fold Cross Validation

To further verify the validity and accuracy of the model, we chose to cross-validate the k-value of 5 with other sample data. Through k-fold cross-validation, the performance of the model can be effectively assessed to avoid overfitting and underfitting of the model. The results of the experiments are shown in Table 8. Because of the high variability of the selected samples, the results of each experiment are different, but the overall performance is improved. Among them, Experiment 3 has the best performance; the MAPE value is 4.47%, while Experiment 4 has the worst performance, with a MAPE value of 13.17%. The average MAPE value of the five experiments is 8.49%, which is less than 10%, and the model accuracy is good and within the acceptable range.

4.4. Calculation of Greenhouse Gas Emissions

New energy vehicles (NEVs) depend on electricity during operation, resulting in emissions that mainly derive from power generation activities. Therefore, the clean energy percentage within the Beijing–Tianjin–Hebei region’s electricity composition directly determines NEV emission intensities. As outlined in China’s Energy and Power Development Planning Study 2030 and Outlook 2060, China aims to achieve a 52.5% clean energy share in power generation by 2030 and over 70% by 2060. Consequently, this study operates under the assumption that the Beijing–Tianjin–Hebei region’s generation-side energy composition will synchronize with China’s national power objectives moving forward. According to 2023 data from the National Bureau of Statistics, clean energy accounted for 18.8% of the region’s power generation. Using these targets to establish growth rates, we projected the future energy structure of the region’s power generation. The data are presented in Table 9.
Within the context of China’s “carbon neutrality” and “peak carbon” initiatives, reducing transportation sector emissions has become a major focus area. To accomplish these dual carbon objectives, new energy vehicles (NEVs) are being actively promoted across China through multiple approaches. In this study, NEV ownership is predicted by the GRA-BiLSTM model. Then the CO2 emission reduction of new energy vehicles in the Beijing–Tianjin–Hebei region under three scenarios from 2024 to 2035 was calculated by the new energy vehicle emission reduction model. The results are shown in Figure 4.
Figure 4 shows the trend of CO2 emission reduction and the trend of CO2 emission reduction contribution share of each vehicle model under the three growth scenarios. CO2 reductions from new energy vehicles steadily increase for all three scenarios from 2024 to 2035. From the results, it can be found that the faster the growth rate of NEV ownership, the faster the growth rate of CO2 emission reduction.
Figure 4a shows that from 2024 to 2035, the CO2 emission reduction of new energy vehicles in the Beijing Tianjin Hebei region increased from 7568.24 kt to 36,299.71 kt, an increase of 479.64%. Hebei has the highest proportion in the region due to its low base and large growth potential; Although Beijing and Tianjin started relatively high, their growth rates were relatively slow, and their cumulative emission reductions were lower than those in Hebei.
From Figure 4b, it can be seen that from 2024 to 2035, the share of CO2 emission reduction in Beijing, Hebei, and Tianjin changes from 36.76%, 41.61%, and 21.62% to 33.05%, 50.39%, and 16.55%, respectively, in the reference scenario. Hebei is the fastest growing of the three provinces. Due to Hebei Province having a larger geographical area, population base, and motor vehicle ownership, it will have the greatest demand for NEV in the future. Beijing and Tianjin have a high rate of motor vehicle electrification due to factors such as their developed economies, dense populations, and relatively well-developed infrastructures (e.g., NEV charging piles). At the same time, due to the size of the region and the size of the population, the prospects for the development of new energy vehicles are worse than in Hebei Province. Therefore, the potential for CO2 reduction in the future is also lower than that of Hebei Province.
In Figure 4c, the annual emission reduction of CO2 increased from 7616.16 kt in 2024 to 49,315.74 kt in 2035, with a growth rate of 649.06%. In the high scenario, the growth rate of various regions is faster than that in the low scenario, among which Hebei has the fastest expansion of new energy vehicle ownership and a significant increase in the proportion of emission reduction contribution, becoming the core driving force for emission reduction growth in the high scenario.
As shown in Figure 4d, it can be found that the biggest contribution to CO2 reduction in the Beijing–Tianjin–Hebei region is LDV. Because LDV will always be the mainstream of the development of new energy vehicles. Next is HDT, but its contribution to emission reductions is small until 2028 but grows rapidly in the years afterward and will exceed the emission reduction contribution of Bus. The reason is that heavy trucks transport heavy cargo; long transportation distances and long transportation times lead to a high standard of their energy supply. However, the current battery capacity, range time, and charging speed are not enough to meet the truck’s working demand. Therefore, the electrification rate of trucks is low, and the contribution of CO2 emission reduction is low. However, China is laying out the new energy vehicle power exchange industry, developing solid-state batteries with greater capacity density, and in the future, new energy heavy-duty trucks will develop rapidly. Therefore, the CO2 emission reduction contribution will become larger rapidly in the future. In addition, the trend of carbon reduction in LDT and its causes are similar to HDT. The carbon reduction contribution of bus and taxi has remained relatively flat. This is due to the high electrification rate of public transport in cities as a result of China’s promotion of new energy vehicles and low-carbon travel. By the end of 2022, the proportion of new energy buses in Beijing reached 94.27%. The low share of HDV, MDT, and MDV ownership leads to a small contribution to carbon reduction.
In this study, emission reductions were calculated by predicting NEV retention and taking an equal amount of ICEV emissions minus NEV emissions. Carbon reduction efficiency can also be obtained by calculating the ratio of emission reductions to equivalent ICEV emissions. This indicator can clearly quantify the emission reduction effect of new energy vehicles. Refer to Equation (14) for the mathematical formulation.
R a t e = E E · 100 %
Under the reference scenario, the calculation results of carbon emission reduction efficiency in the Beijing–Tianjin–Hebei region are shown in Exhibit 3. The calculations show that the efficiency of emission reduction increases overall from 2024 to 2035. Carbon reduction efficiency increased from 44.32% to 62.40%. The reason for this is that the share of clean energy on the generation side is gradually becoming larger. The emission reductions of new energy vehicles become lower during the use phase. This also indicates that the increase in the share of clean energy at the power generation end can directly affect the carbon emission reduction effect of new energy vehicles. Therefore, in the future study of the carbon emission reduction effect of new energy vehicles, it is a key factor to study the energy structure of the power generation side. In addition, the rapid development of the national economy has led to changes in people’s consumption ability and awareness. Consumers are willing to try new energy vehicles when choosing transportation, and with the government’s strong promotion of new energy vehicle supporting infrastructure construction, consumers’ concerns about the range of new energy vehicles have also been alleviated. All these factors have increased the development of NEV retention. The subsequent increase in carbon emissions reduction directly affects the development of the national economy.

4.5. Calculation of Emission Reduction Potential for Five Air Pollutants

Since new energy vehicles consume electrical energy during operation, air pollutant emissions are similar to carbon emissions and fall under the category of NEV emissions. This study calculates the relative air pollutant emissions of new energy vehicles compared to equivalent fuel vehicles.
As shown in 
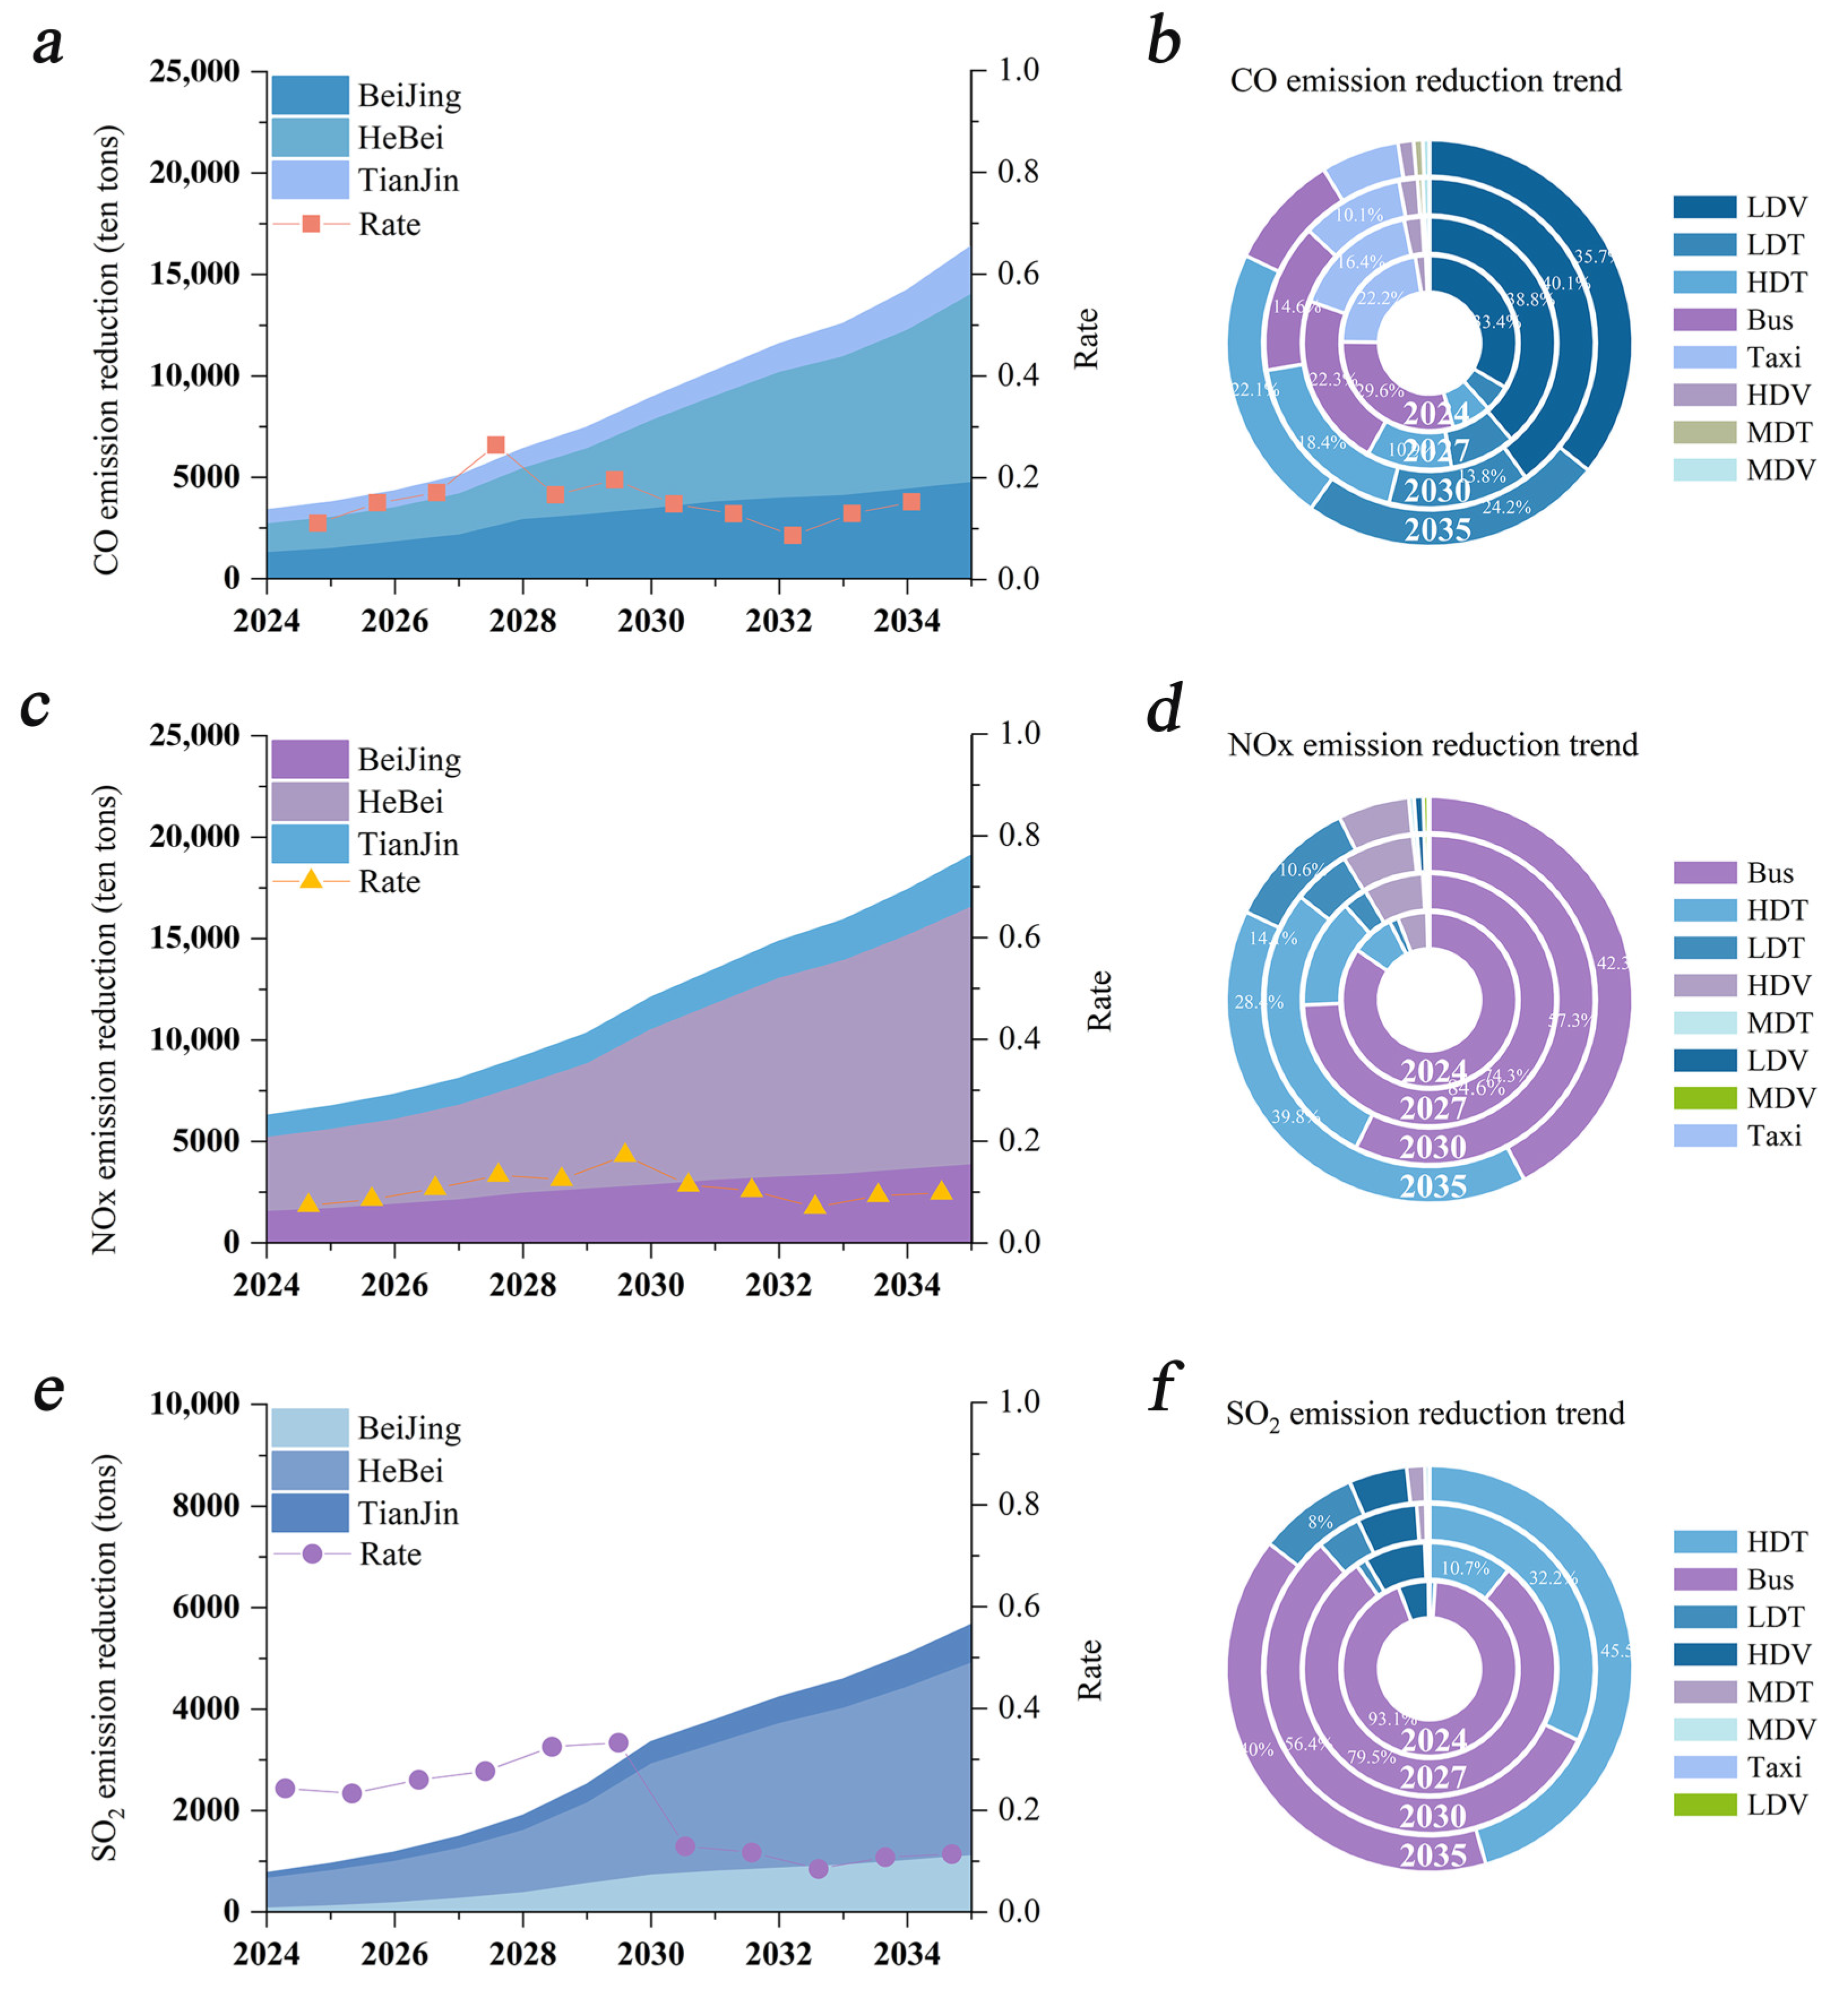
Figure 5, the annual emission reductions of CO, NOX, and SO2 from NEV in the Beijing–Tianjin–Hebei region under the reference scenario will grow from 33,682.5 t, 62,755.76 t, and 769.89 t to 163,108.18 t, 191,087.87 t, and 5668.85 t, respectively, from 2024 to 2035, and the cumulative emission reductions are even higher at 1038.63 kt, 1408.38 kt and 35.53 kt. The results indicated that the promotion of NEV in the Beijing–Tianjin–Hebei region can effectively reduce CO, NOX, and SO2 emissions. In addition, the ratio of CO, NOX, and SO2 emission reduction shares is similar to the ratio of carbon emission reduction shares in the three provinces. Because Hebei Province has the largest space for new energy vehicle development, it has the largest share of CO, NOX, and SO2 emission reductions, followed by Beijing and Tianjin.
Different models have different emission factors, so the contribution of CO, NOX, and SO2 reduction varies from model to model. From the calculations, it is clear that LDV has been the largest contributor to CO reduction. LDT and HDT are next in line, and with the growth of NEV ownership, the share of CO emission reduction contribution will reach 24.2% and 22.1%, respectively, by 2035. As shown in Figure 5d,f, buses and HDT have been the main contributors to NOX and SO2 emission reductions. However, the share of NOX and SO2 emission reductions for buses has been decreasing, while the share of NOX and SO2 emission reductions for HDT has been increasing. This is due to the high degree of electrification of buses in the Beijing–Tianjin–Hebei region and the relatively stable number of electric buses. However, with the development of new energy vehicles, the share of bus emission reduction will gradually decrease. HDT, on the contrary, electric trucks are not yet able to meet the demand for work and have a low electrification rate. However, in the future, with the development of battery technology and the improvement of power exchange services, the number of new energy trucks will grow, and the contribution of emission reduction will also increase. However, not all new energy vehicle models can achieve emission reduction. For example, between 2024 and 2026, LDV and taxis will increase NOX emissions due to the relatively low share of clean energy generation. In addition, increased levels of electrification of LDV and taxis will increase SO2 emissions until fossil power generation disappears completely. However, on the whole, the promotion of new energy vehicles is able to achieve the effect of pollutant emission reduction.
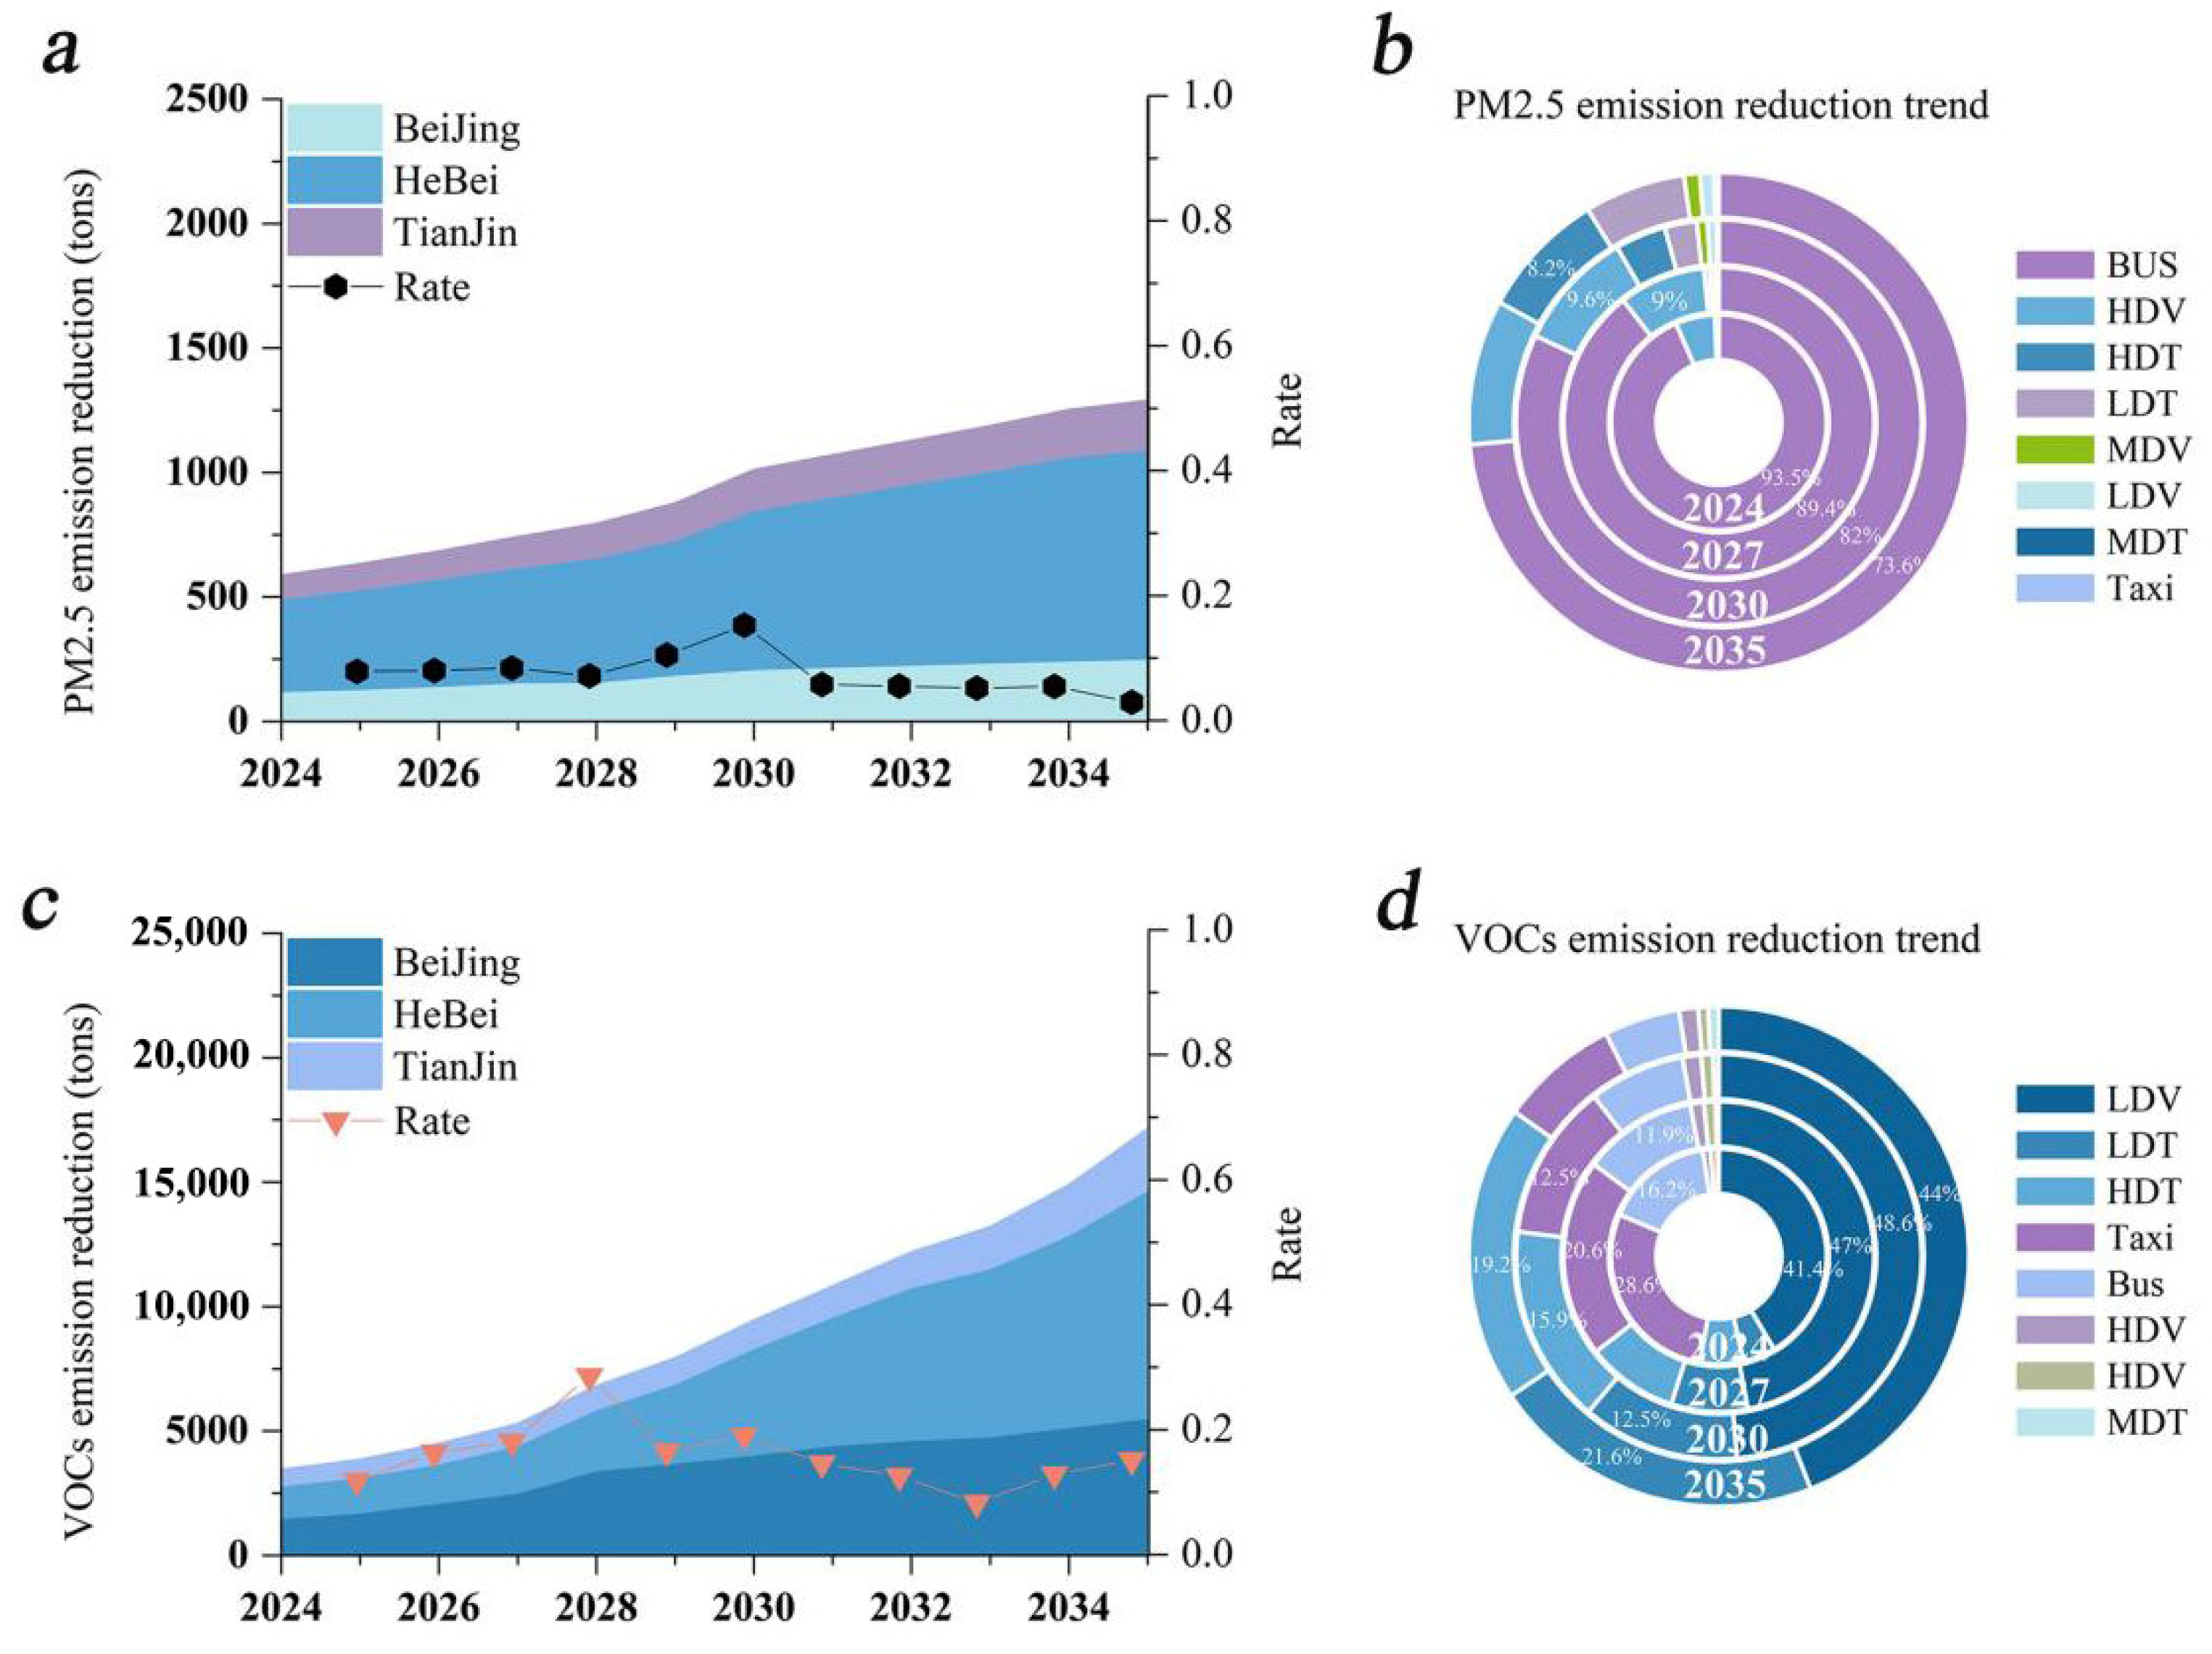
Volatile organic compounds (VOCS) are important precursors for the formation of pollutants such as fine particulate matter (PM2.5). By controlling VOCS, the synergistic control of PM2.5 can be strengthened, which is important for realizing the synergistic effect of pollution reduction and carbon reduction and promoting the continuous improvement of ecological environment quality. In the Beijing–Tianjin–Hebei region, from 2024 to 2035, the annual emission reductions of PM2.5 and VOCS from new energy vehicles increase from 586.88 t and 3452.03 t to 1289.38 t and 17,144.43 t, respectively. The cumulative emission reductions amounted to 11,255.85 t and 109,550.68 t, respectively. This result shows that the promotion of new energy vehicles can effectively reduce PM2.5 and VOCS emissions.
The emission reduction effects of different vehicle models are analyzed. As shown in Figure 6b, BUS has been the main contributor to PM2.5, and the contribution decreases from 93.5% to 73.6% from 2024 to 2035. The emission reduction effects of different vehicle models are analyzed. As shown in Figure 6b, bus has been the main contributor to PM2.5, and the contribution decreases from 93.5% to 73.6% from 2024 to 2035. The reason remains the current high level of Bus electrification. As the electrification rate of HDV, HDT, and LDT models increases each year, the contribution of PM2.5 emission reduction grows. However, the share of PM2.5 emission reductions from these models remains small. As shown in Figure 6d, LDV, LDT, HDT, taxi, and bus are the main contributors to VOCS emission reductions. The contribution of LDV has been above 40%, LDT and HDT have been growing the fastest, and the contribution of taxi and bus emissions reductions has declined slightly.
From the above analysis, it can be learned that new energy vehicles in the Beijing–Tianjin–Hebei region can effectively reduce the consumption of fossil fuels in the transportation industry and reduce the emission of air pollutants in the transportation sector. However, new energy vehicles are not yet able to rapidly replace traditional fuel vehicles, and the development of new energy vehicles is still subject to some obstacles. It mainly includes three aspects: (1) Range: at present, the range of new energy vehicles sold in China is mainly between 400 and 550 km. In the Beijing–Tianjin–Hebei region, the temperature varies greatly throughout the year, and lithium-ion batteries are easily affected by the environment, resulting in a significant reduction in range. Secondly, the coverage of charging facilities in some areas of the Beijing–Tianjin–Hebei region is not perfect. Therefore, people are more willing to choose traditional fuel vehicles when buying a car. (2) Battery raw material supply: the production of power batteries requires a large amount of lithium, nickel, cobalt, and other metal materials. In China, the supply of these metal materials is insufficient and relies heavily on imports [46,47]. At the same time, the high price of these raw materials leads to a higher price of new energy vehicles compared to fuel vehicles. This will also affect the development of new energy vehicles. (3) Safety: Because of the lithium-ion battery, electric vehicles are more prone to spontaneous combustion than fuel vehicles. Safety has been questioned by consumers. All three of these are major factors that are currently holding back the development of new energy vehicles. These problems need to be gradually solved in the future to achieve the rapid development of new energy vehicles, and the carbon emissions and air pollutant emissions from the transportation sector will be minimized.
Figure 6a shows that PM2.5 emission reduction continues to rise, as the number of new energy vehicles increases and the scale of alternative fuel vehicles expands; The decrease in the contribution of buses to PM2.5 emission reduction in Figure 6b is due to their high electrification rate, while the promotion of electrification in heavy-duty vehicles has increased their proportion; The increase in VOCs emission reduction in Figure 6c is due to the expansion of the range of new energy vehicles replacing fuel vehicles; In Figure 6d, light passenger vehicles have made outstanding contributions to VOCs emissions reduction, as they are mainstream models. The rapid growth of light and heavy trucks is attributed to technological progress, while the proportion of taxis and buses has slightly decreased due to the maturity of electrification.
This study predicted the number of new energy vehicles and their emission reduction potential in the Beijing–Tianjin–Hebei region using the GRA BiLSTM model, but there are still several limitations that need to be reflected upon. At the data level, it mainly relies on macro statistical data and lacks micro driving behavior data (such as actual charging frequency and seasonal travel patterns), which may lead to estimation bias; meanwhile, the particularity of the Beijing–Tianjin–Hebei region as a highly polluted area may limit the generalizability of the conclusions to other regions. Secondly, there is a risk of timeliness in technological assumptions, such as predicting the proportion of clean energy generation without considering the interference of extreme weather or technological breakthroughs. More importantly, research only focuses on emissions during the usage phase and does not cover the full lifecycle carbon footprint of battery production and recycling. The sensitivity analysis of policies is also insufficient, as scenarios such as subsidy refunds or delayed sales bans have not been simulated, and the issue of charging facility coverage has not been quantified in terms of its actual constraints on ownership.

5. Conclusions

As one of China’s most heavily air-polluted regions, the Beijing–Tianjin–Hebei area requires urgent transportation decarbonization measures, with New Energy Vehicle (NEV) adoption representing a crucial strategic approach. Accurate projections of future NEV ownership patterns in this region provide policymakers with essential data for formulating effective, targeted promotion strategies. Therefore, 12 experimental data factors were collected in this study, and the correlation between predicted data and experimental data factors was calculated using gray correlation analysis. Experimental factors with correlation coefficients greater than 0.7 were selected as input data for BiLSTM to predict NEV ownership in the Beijing–Tianjin–Hebei region. Then, the carbon emission reduction and air pollutant emission reduction were calculated by the constructed new energy vehicle emission reduction model. The following conclusions were drawn from the experiments.
In this study, gray correlation analysis was used to calculate the correlation between fuel vehicle sales, the new energy vehicle search index, the new energy vehicle information index, the air quality search index, charging pile ownership, power generation, gasoline price, steel production, aluminum production, copper production, GDP, engine production, and new energy vehicle ownership. The results show that the influencing factors with a correlation greater than 0.7 are charging pile ownership, fuel vehicle sales, steel production, power generation, gasoline price, NEV search index, and NEV information index, with a total of seven influencing factors. Using the data of the above seven influencing factors as the input indexes of the BiLSTM model can effectively improve the predictive performance of the prediction model and predict the future ownership of new energy vehicles in the Beijing–Tianjin–Hebei region.
A total of four combined models were used in this study to predict NEV ownership in the Beijing–Tianjin–Hebei region. The experimental results show that the MAE, MAPE, and RMSE of the GRA-BiLSTM combination prediction model are 2.9235, 5.9232, and 4.1379, respectively, which are lower than the other three combination models. It is shown that the combined GRA-BiLSTM prediction model can more accurately predict NEV ownership in the Beijing–Tianjin–Hebei region.
This study forecasts NEV ownership in the Beijing–Tianjin–Hebei region under three growth scenarios from 2024 to 2035. The results show that NEV ownership in the Beijing–Tianjin–Hebei region will reach 9,560,100, 11,880,300, and 14,867,000 vehicles by 2035 under the low-growth scenario, the reference scenario, and the high-growth scenario, respectively. Based on the results of NEV retention projections, carbon emission reductions and air pollutant emission reduction data for the three scenarios were calculated in conjunction with the development goals of the future power energy mix. The results show that the cumulative carbon emission reductions of the three scenarios in the Beijing–Tianjin–Hebei region will reach 247,126.03 kt, 276,420.53 kt, and 295,140.65 kt, respectively, by 2035. The above results prove that the Beijing–Tianjin–Hebei region has a huge potential for carbon emission reduction from new energy vehicles in the future. Carbon emissions can be reduced by promoting new energy vehicles, helping China to achieve its “dual-carbon goal”. In the reference scenario, the cumulative emission reductions of CO, NOx, SO2, PM2.5, and VOCs from new energy vehicles in the Beijing–Tianjin–Hebei region will reach 1038.63 kt, 1408.38 kt, 35.53 kt, 11.26 kt, and 109.55 kt by 2035. The results show that new energy vehicles play a very good role in reducing air pollutants in the transportation sector. The experimental results of this study can provide some reference value in the future management of air pollution in the Beijing–Tianjin–Hebei region.
To promote the promotion of NEV, the following suggestions are proposed. (1) Cities with high levels of economic development and sufficient charging infrastructure should pay attention to permit quota policies. The cities that restrict new energy vehicle licenses include Beijing, Shanghai, and Tianjin. Suggest increasing the license index for new energy vehicles to meet the travel needs of consumers. For cities without license plate restrictions, it is recommended to adopt license plate quota policies in key cities based on the actual situation of the local news market and accelerate the promotion and expansion of the penetration rate of new energy vehicles in cities. (2) For second-tier cities with low penetration rates of new energy vehicles and lagging construction of charging infrastructure, it is recommended to prioritize the rapid layout and construction of charging facilities, standardization of charging station operators, and certain financial subsidies as the focus of new energy vehicle promotion policies. Insufficient charging stations and limited coverage have become one of the core reasons why it is difficult to promote new energy vehicles in such cities. Meanwhile, NEVs occupy charging space for a long time, resulting in wastage of charging resources and reducing the revenue of charging station operators. (3) For cities with lagging economic development, low penetration rate of new energy vehicles, and lagging construction of charging infrastructure, it is recommended to delay the decline in subsidy prices for new energy vehicles and quickly deploy charging facilities in key cities to meet consumers’ basic charging needs.
The new future work plan of this manuscript is as follows: (1) For the modeling aspect, the future research will combine CNN to make up for the local feature extraction capability on the original basis in order to improve the prediction model performance. (2) For environmental benefits, the future will fully consider the emission reduction effect of the whole life cycle of new energy vehicles in order to accurately evaluate the real emission reduction potential of new energy vehicles.

Author Contributions

L.L.: conceptualization, methodology, and editing; H.L.: data curation and writing—original draft preparation; B.L.: writing—reviewing. All authors have read and agreed to the published version of the manuscript.

Funding

The authors declare that no funds, grants, or other support were received during the preparation of this manuscript.

Institutional Review Board Statement

Not applicable.

Informed Consent Statement

Not applicable.

Data Availability Statement

The data that support the findings of this study are available from the corresponding author upon reasonable request.

Conflicts of Interest

The authors declare that they have no known competing financial interests or personal relationships that could have appeared to influence the work reported in this paper.

Nomenclature

NEVnew energy vehicle
GRAgray relation analysis
BiLSTMbi-directional long short-term memory
GRA-BiLSTMgray relation analysis–bi-directional long short-term memory
LSTMlong short-term memory
SVRsupport vector regression
GRUgate recurrent unit
LDVlight-duty passenger vehicle
MDVmedium-duty passenger vehicle
HDVheavy-duty passenger vehicle
LDTlight-duty truck
MDTmedium-duty truck
HDTheavy-duty truck
EFemission factors
VKTvehicle kilometers traveled
HEVhybrid electric vehicle

References

  1. Gong, X.; Fu, C.; Huang, Q.; Lin, M. International political uncertainty and climate risk in the stock market. J. Int. Financ. Mark. Inst. Money 2022, 81, 101683. [Google Scholar] [CrossRef]
  2. Atabani, A.E.; Badruddin, I.A.; Mekhilef, S.; Silitonga, A.S. A review on global fuel economy standards, labels and technologies in the transportation sector. Renew. Sustain. Energy Rev. 2011, 15, 4586–4610. [Google Scholar] [CrossRef]
  3. Hoekstra, A. The Underestimated Potential of Battery Electric Vehicles to Reduce Emissions. Joule 2019, 3, 1412–1414. [Google Scholar] [CrossRef]
  4. Shi, X.; Yang, W.; Xue, W.; Zhang, Z.; Wen, J.; Liu, X.; Yi, H.; Yan, G.; Cai, B.; Wang, J. Passenger cars’ zero emission require clean power supply: Provincial evidence from NEVs’ indirect emission through 2035. J. Clean. Prod. 2025, 507, 145516. [Google Scholar] [CrossRef]
  5. Sun, C.; Xu, S.; Yang, M.; Gong, X. Urban traffic regulation and air pollution: A case study of urban motor vehicle restriction policy. Energy Policy 2022, 163, 112819. [Google Scholar] [CrossRef]
  6. Arenas, J.P. On the impact of electric vehicle transition on urban noise pollution. Curr. Opin. Environ. Sci. Health 2025, 45, 100623. [Google Scholar] [CrossRef]
  7. Qiu, L.; Wong, X.; Zhang, T.; Song, Y. How Do Climate Risks Intersect with the Rise of New Energy Vehicles in China? Econ. Anal. Policy 2025, 87, 675–688. [Google Scholar] [CrossRef]
  8. Noorbhai, H. Public transport users have better physical and health profiles than drivers of motor vehicles. J. Transp. Health 2022, 25, 101358. [Google Scholar] [CrossRef]
  9. Chen, Q.; Lai, X.; Gu, H.; Tang, X.; Gao, F.; Han, X.; Zheng, Y. Investigating carbon footprint and carbon reduction potential using a cradle-to-cradle LCA approach on lithium-ion batteries for electric vehicles in China. J. Clean. Prod. 2022, 369, 133342. [Google Scholar] [CrossRef]
  10. Yao, X.; Ma, S.; Bai, Y.; Jia, N. When are new energy vehicle incentives effective? Empirical evidence from 88 pilot cities in China. Transp. Res. Part A Policy Pract. 2022, 165, 207–224. [Google Scholar] [CrossRef]
  11. Zheng, X.; Menezes, F.; Zheng, X.; Wu, C. An empirical assessment of the impact of subsidies on EV adoption in China: A difference-in-differences approach. Transp. Res. Part A Policy Pract. 2022, 162, 121–136. [Google Scholar] [CrossRef]
  12. Xu, M.; Qin, Z. How does vehicle emission control policy affect air pollution emissions? Evidence from Hainan Province, China. Sci. Total Environ. 2023, 866, 161244. [Google Scholar] [CrossRef]
  13. Li, K.; Dong, F. Government strategy for banning gasoline vehicles: Evidence from tripartite evolutionary game. Energy 2022, 254, 124158. [Google Scholar] [CrossRef]
  14. Yin, T.; Chen, S.; Wang, G.; Tan, Y.; Teng, F.; Zhang, Q. Can subsidy policies achieve fuel cell logistics vehicle (FCLV) promotion targets? Evidence from the beijing-tianjin-hebei fuel cell vehicle demonstration city cluster in China. Energy 2024, 311, 133270. [Google Scholar] [CrossRef]
  15. Song, Y.; Zhang, Y.; Liu, J.; Zhang, C.; Liu, C.; Liu, P.; Mu, Y. Rural vehicle emission as an important driver for the variations of summertime tropospheric ozone in the Beijing-Tianjin-Hebei region during 2014–2019. J. Environ. Sci. 2022, 114, 126–135. [Google Scholar] [CrossRef]
  16. Cheng, S.; Zhang, B.; Zhao, Y.; Peng, P.; Lu, F. Multiscale spatiotemporal variations of NOx emissions from heavy duty diesel trucks in the Beijing-Tianjin-Hebei region. Sci. Total Environ. 2023, 854, 158753. [Google Scholar] [CrossRef]
  17. Vandyck, T.; Keramidas, K.; Tchung-Ming, S.; Weitzel, M.; Van Dingenen, R. Quantifying air quality co-benefits of climate policy across sectors and regions. Clim. Change 2020, 163, 1501–1517. [Google Scholar] [CrossRef]
  18. Liu, Y.-H.; Liao, W.-Y.; Li, L.; Huang, Y.-T.; Xu, W.-J.; Zeng, X.-L. Reduction measures for air pollutants and greenhouse gas in the transportation sector: A cost-benefit analysis. J. Clean. Prod. 2019, 207, 1023–1032. [Google Scholar] [CrossRef]
  19. Pan, S.; Fulton, L.M.; Roy, A.; Jung, J.; Choi, Y.; Gao, H.O. Shared use of electric autonomous vehicles: Air quality and health impacts of future mobility in the United States. Renew. Sustain. Energy Rev. 2021, 149, 111380. [Google Scholar] [CrossRef]
  20. Mohammadiha, A.; Malakooti, H.; Esfahanian, V. Development of reduction scenarios for criteria air pollutants emission in Tehran Traffic Sector, Iran. Sci. Total Environ. 2018, 622–623, 17–28. [Google Scholar] [CrossRef]
  21. Sun, S.; Zhao, G.; Wang, T.; Jin, J.; Wang, P.; Lin, Y.; Li, H.; Ying, Q.; Mao, H. Past and future trends of vehicle emissions in Tianjin, China, from 2000 to 2030. Atmos. Environ. 2019, 209, 182–191. [Google Scholar] [CrossRef]
  22. Ding, S.; Li, R. Forecasting the sales and stock of electric vehicles using a novel self-adaptive optimized grey model. Eng. Appl. Artif. Intell. 2021, 100, 104148. [Google Scholar] [CrossRef]
  23. Liu, L.; Liu, S.; Wu, L.; Zhu, J.; Shang, G. Forecasting the development trend of new energy vehicles in China by an optimized fractional discrete grey power model. J. Clean. Prod. 2022, 372, 133708. [Google Scholar] [CrossRef]
  24. Gao, J.; Xu, X.; Zhang, T. Forecasting the development of Clean energy vehicles in large Cities: A system dynamics perspective. Transp. Res. Part A Policy Pract. 2024, 181, 103969. [Google Scholar] [CrossRef]
  25. Bao, H.; Guo, X.; Liang, J.; Lan, F.; Li, J.; Chen, G.; Mo, J. Relevance vector machine with optimal hybrid kernel function for electric vehicles ownership forecasting: The case of China. Energy Rep. 2022, 8, 988–997. [Google Scholar] [CrossRef]
  26. Qiao, W.; Liu, W.; Liu, E. A combination model based on wavelet transform for predicting the difference between monthly natural gas production and consumption of U.S. Energy 2021, 235, 121216. [Google Scholar] [CrossRef]
  27. Hong, H.P.; Cui, X.Z.; Qiao, D. Simulating nonstationary non-Gaussian vector process based on continuous wavelet transform. Mech. Syst. Signal Process. 2022, 165, 108340. [Google Scholar] [CrossRef]
  28. Liu, M.; Lu, Y.; Long, S.; Bai, J.; Lian, W. An attention-based CNN-BiLSTM hybrid neural network enhanced with features of discrete wavelet transformation for fetal acidosis classification. Expert Syst. Appl. 2021, 186, 115714. [Google Scholar] [CrossRef]
  29. Wei, G.-W. GRA method for multiple attribute decision making with incomplete weight information in intuitionistic fuzzy setting. Knowl.-Based Syst. 2010, 23, 243–247. [Google Scholar] [CrossRef]
  30. Feng, Q.; Sun, X.; Hao, J.; Li, J. Predictability dynamics of multifactor-influenced installed capacity: A perspective of country clustering. Energy 2021, 214, 118831. [Google Scholar] [CrossRef]
  31. Wang, K.; Ma, C.; Qiao, Y.; Lu, X.; Hao, W.; Dong, S. A hybrid deep learning model with 1DCNN-LSTM-Attention networks for short-term traffic flow prediction. Phys. A Stat. Mech. Its Appl. 2021, 583, 126293. [Google Scholar] [CrossRef]
  32. Wang, R.; Zhao, X.; Wang, W.; Jiang, L. What factors affect the public acceptance of new energy vehicles in underdeveloped regions? A case study of Gansu Province, China. J. Clean. Prod. 2021, 318, 128432. [Google Scholar] [CrossRef]
  33. Peng, T.; Zhang, C.; Zhou, J.; Nazir, M.S. An integrated framework of Bi-directional long-short term memory (BiLSTM) based on sine cosine algorithm for hourly solar radiation forecasting. Energy 2021, 221, 119887. [Google Scholar] [CrossRef]
  34. Bobba, S.; Mathieux, F.; Blengini, G.A. How will second-use of batteries affect stocks and flows in the EU? A model for traction Li-ion batteries. Resour. Conserv. Recycl. 2019, 145, 279–291. [Google Scholar] [CrossRef]
  35. Huang, L.; Liao, Q.; Zhang, H.; Jiang, M.; Yan, J.; Liang, Y. Forecasting power consumption with an activation function combined grey model: A case study of China. Int. J. Electr. Power Energy Syst. 2021, 130, 106977. [Google Scholar] [CrossRef]
  36. Niu, Z.; Liu, Y.; Gao, W.; Zhang, H. The role of coronavirus news in the volatility forecasting of crude oil futures markets: Evidence from China. Resour. Policy 2021, 73, 102173. [Google Scholar] [CrossRef]
  37. Xuan, Y.; Yue, Q. Forecast of steel demand and the availability of depreciated steel scrap in China. Resour. Conserv. Recycl. 2016, 109, 1–12. [Google Scholar] [CrossRef]
  38. Li, F.; Zhuang, J.; Cheng, X.; Li, M.; Wang, J.; Yan, Z. Investigation and Prediction of Heavy-Duty Diesel Passenger Bus Emissions in Hainan Using a COPERT Model. Atmosphere 2019, 10, 106. [Google Scholar] [CrossRef]
  39. Jiang, Y.; Liang, X.; Zhang, S.; Hu, Z.; Hove, A.; Wu, Y. The future air quality impact of electric vehicle promotion and coordinated charging in the Beijing-Tianjin-Hebei region. Environ. Pollut. 2023, 332, 121928. [Google Scholar] [CrossRef]
  40. Duan, S.; Qiu, Z.; Liu, Z.; Liu, L. Impact assessment of vehicle electrification pathways on emissions of CO2 and air pollution in Xi’an, China. Sci. Total Environ. 2023, 893, 164856. [Google Scholar] [CrossRef]
  41. Song, H.; Deng, S.-X.; Lu, Z.-Z.; Li, J.-H.; Ba, L.-M.; Wang, J.-F.; Sun, Z.-G.; Li, G.-H.; Jiang, C.; Hao, Y.-Z. Scenario analysis of vehicular emission abatement procedures in Xi’an, China. Environ. Pollut. 2021, 269, 116187. [Google Scholar] [CrossRef]
  42. Ai, N.; Zheng, J.; Chen, W.-Q. U.S. end-of-life electric vehicle batteries: Dynamic inventory modeling and spatial analysis for regional solutions. Resour. Conserv. Recycl. 2019, 145, 208–219. [Google Scholar] [CrossRef]
  43. Lu, I.J.; Lin, S.J.; Lewis, C. Grey relation analysis of motor vehicular energy consumption in Taiwan. Energy Policy 2008, 36, 2556–2561. [Google Scholar] [CrossRef]
  44. Zeng, Y.-R.; Zeng, Y.; Choi, B.; Wang, L. Multifactor-influenced energy consumption forecasting using enhanced back-propagation neural network. Energy 2017, 127, 381–396. [Google Scholar] [CrossRef]
  45. Yang, W.; Yu, C.; Yuan, W.; Wu, X.; Zhang, W.; Wang, X. High-resolution vehicle emission inventory and emission control policy scenario analysis, a case in the Beijing-Tianjin-Hebei (BTH) region, China. J. Clean. Prod. 2018, 203, 530–539. [Google Scholar] [CrossRef]
  46. Yao, P.; Zhang, X.; Wang, Z.; Long, L.; Han, Y.; Sun, Z.; Wang, J. The role of nickel recycling from nickel-bearing batteries on alleviating demand-supply gap in China’s industry of new energy vehicles. Resour. Conserv. Recycl. 2021, 170, 105612. [Google Scholar] [CrossRef]
  47. Chen, L.; Li, X.; Luo, Y.; Tan, W.; Ma, Q.; Wang, M.; Yang, J. Impact of cobalt recycling on China’s electrification process: Assessing the potential reduction in cobalt demand from battery recycling. J. Clean. Prod. 2024, 434, 139917. [Google Scholar] [CrossRef]
Figure 1. Gray relation analysis–bi-directional long short-term memory (GRA-BiLSTM) model structure.
Sustainability 17 06386 g001
Figure 2. Structure of K-fold cross validation.
Sustainability 17 06386 g002
Figure 3. The number of new energy vehicles in the Beijing–Tianjin–Hebei region under three different scenarios.
Sustainability 17 06386 g003
Figure 4. CO2 emission reduction potential of new energy vehicles in Beijing–Tianjin–Hebei region.
Sustainability 17 06386 g004
Figure 5. (a,b) CO, (c,d) NOX, and (e,f) SO2 emission reduction potential of new energy vehicles in Beijing–Tianjin–Hebei region.
Sustainability 17 06386 g005
Figure 6. (a,b) PM2.5 and (c,d) VOCS emission reduction potential of new energy vehicles in Beijing–Tianjin–Hebei region.
Sustainability 17 06386 g006
Table 1. Parameter setting of the model.
AlgorithmsTime StepHidden LayerBatch SizeEpochLearn RateMAPE (%)
BiLSTM216220000.00110.4121
232220000.0018.6542
332250000.0018.1443
364350000.00016.7789
416380000.00016.0235
432380000.0015.9232
Table 2. Summary of the six scenarios defined for this study.
Coal-Fired Power Generation EmissionsCO2NOXSO2PM2.5
EF (g/kwh)838.600.1950.1870.030
Table 3. Gray correlation analysis data.
Serial
Number
Influencing FactorBeijingHebeiTianjinAverage Value
T1fuel vehicle sales0.698 0.765 0.685 0.716
T2NEV search index0.654 0.806 0.658 0.706
T3NEV information index0.665 0.768 0.674 0.702
T4air quality search index0.557 0.753 0.603 0.638
T5charging pile ownership0.872 0.948 0.835 0.885
T6(generated) electrical energy0.733 0.723 0.684 0.713
T7petrol price0.648 0.832 0.656 0.712
T8steel production0.662 0.823 0.658 0.714
T9aluminum production0.599 0.621 0.700 0.640
T10copper production0.674 0.750 0.608 0.677
T11GDP0.635 0.596 0.690 0.640
T12engine production output0.619 0.730 0.693 0.681
Table 4. Typical MAPE values for accuracy evaluation.
MAPE (%)Prediction Classes
≤10%High-accuracy
10% < MAPE < 20%Good
20% < MAPE < 50%Reasonable
>50%Inaccurate
Table 5. Average performance of different models in Beijing–Tianjin–Hebei.
AlgorithmsMAEMAPE (%)RMSE
GRA-BiLSTM2.92355.92324.1379
GRA-LSTM7.19029.5658.7392
GRA-SVR10.002713.540612.6724
GRA-MLR11.340914.248416.357
BiLSTM8.544511.14599.2378
LSTM11.247115.326114.8142
SVR16.586222.459220.5367
MLR22.318628.112426.7791
Table 6. Parameter setting of BiLSTM neural network.
Time-StepIrBatch-SizeDim_Hidden_LayerNb-EpochMAPE (%)
Beijing20.00426450005.4004
Hebei20.00146450007.987
Tianjin20.00121650004.3815
Table 7. The maximum sensitivity of variables.
Input VariableChange Rate
−10%−5%−3%−1%1%3%5%10%
T10.414%0.316%0.189%0.063%0.063%0.189%0.316%0.414%
T20.032%0.027%0.010%0.003%0.003%0.010%0.027%0.032%
T30.225%0.097%0.056%0.851%0.851%0.056%0.097%0.225%
T40.714%1.016%0.413%0.044%0.044%0.409%1.016%0.718%
T50.012%1.005%0.003%0.002%0.001%0.003%0.006%0.012%
T60.826%0.260%0.568%0.855%0.855%0.567%1.326%1.521%
T70.761%0.613%0.819%0.036%0.036%0.819%0.613%0.761%
T80.006%0.994%0.643%0.013%0.013%0.643%0.994%0.006%
T90.522%0.297%0.007%0.001%0.001%0.007%0.297%0.522%
T100.174%1.202%0.621%0.132%0.132%0.621%1.202%0.178%
T110.336%0.265%0.157%0.071%0.071%0.0157%0.265%0.336%
T120.626%0.206%0.468%0.353%0.353%0.467%0.206%0.626%
Table 8. Cross-validation model performance index with K value of 5.
Trial 1Trial 2Trial 3Trial 4Trial 5
MAE52.2172.5840.4381.3343.62
MAPE (%)7.96%10.34%4.47%13.17%6.51%
RSME57.4768.6343.2686.5448.35
Table 9. Energy share in 2023–2035 (%).
Energy Type2023202420252026202720282029203020312032203320342035
clean energy18.8 21.8 25.2 29.2 33.8 39.1 45.3 52.5 53.1 53.6 54.2 54.8 55.4
Fossil energy81.2 78.2 74.8 70.8 66.2 60.9 54.7 47.5 46.9 46.4 45.8 45.2 44.6
Disclaimer/Publisher’s Note: The statements, opinions and data contained in all publications are solely those of the individual author(s) and contributor(s) and not of MDPI and/or the editor(s). MDPI and/or the editor(s) disclaim responsibility for any injury to people or property resulting from any ideas, methods, instructions or products referred to in the content.

