Article

LiDAR-Based Detection of Field Hamster (Cricetus cricetus) Burrows in Agricultural Fields

1
Institute for Geo-Information and Land Surveying, Anhalt University of Applied Sciences, Seminarplatz 2a, 06846 Dessau, Germany
2
Umwelt-und Geodatenmanagement GbR, 06108 Halle (Saale), Germany
3
Geographic Information Science and Data Handling, Institute of Geosciences and Geography, Martin Luther University Halle-Wittenberg, Von-Seckendorff-Platz 4, 06120 Halle (Saale), Germany
*
Author to whom correspondence should be addressed.
Sustainability 2025, 17(14), 6366; https://doi.org/10.3390/su17146366
Submission received: 10 June 2025 / Revised: 6 July 2025 / Accepted: 8 July 2025 / Published: 11 July 2025
(This article belongs to the Special Issue Ecology, Biodiversity and Sustainable Conservation)

Abstract

Farmers face increasing pressure to maintain vital populations of the critically endangered field hamster (Cricetus cricetus) while managing crop damage caused by field mice. This challenge is linked to the UN Sustainable Development Goals (SDGs) 2 and 15, addressing food security and biodiversity. Consequently, the reliable detection of hamster activity in agricultural fields is essential. While remote sensing offers potential for wildlife monitoring, commonly used RGB imagery has limitations in detecting small burrow entrances in vegetated areas. This study investigates the potential of drone-based Light Detection and Ranging (LiDAR) data for identifying field hamster burrow entrances in agricultural landscapes. A geostatistical method was developed to detect local elevation minima as indicators of burrow openings. The analysis used four datasets captured at varying flight altitudes and spatial resolutions. The method successfully detected up to 20 out of 23 known burrow entrances and achieved an F1-score of 0.83 for the best-performing dataset. Detection was most accurate at flight altitudes of 30 m or lower, with performance decreasing at higher altitudes due to reduced point density. These findings demonstrate the potential of UAV-based LiDAR to support non-invasive species monitoring and habitat management in agricultural systems, contributing to sustainable conservation practices in line with the SDGs.

1. Introduction

The European hamster (Cricetus cricetus) is a fossorial rodent species native to Central and Eastern Europe that has experienced a dramatic decline in population over recent decades. Once widespread across agricultural landscapes, it is now classified as critically endangered throughout its entire range [1]. The species’ decline is closely linked to the intensification of agricultural practices—particularly the expansion of monocultures, increased mechanization, and extensive use of agrochemicals—which have resulted in widespread habitat degradation and the loss of fallow land or edge structures critical for burrowing and foraging [2].
A major ecological and political challenge arises from the overlap of European hamster habitats with those of the common vole (Microtus arvalis), a species known to cause significant crop damage. In regions where both species co-occur, rodent control strategies—especially the application of second-generation anticoagulant rodenticides—pose a severe threat to non-target organisms [3]. Also, the European hamster may potentially be affected by rodenticides [4]. This situation exemplifies the broader conflict between food production goals and biodiversity conservation, and directly relates to the United Nations Sustainable Development Goals (SDGs): Goal 2 (“Zero Hunger”) and Goal 15 (“Life on Land”).
To resolve this conflict, the reliable and scalable monitoring of European hamster populations is urgently needed. However, traditional survey methods such as expert-based field mapping are labor-intensive and time-consuming [5]. In large-scale agricultural landscapes, a manual survey is often economically unfeasible, making long-term monitoring efforts challenging to sustain. As a result, the integration of non-invasive remote sensing technologies into conservation practices is gaining momentum.
Remote sensing approaches are a cost-efficient and increasingly successful method for wildlife surveys and monitoring [6]. In the context of hamster monitoring, UAV data can be considered most suitable, as satellite data do not reach the required resolution and camera traps are not able to display the spatial distribution. UAVs can be equipped with a variety of sensors, amongst which RGB (red, green, blue), thermal infrared, multi—or hyperspectral as well as LiDAR [7]. With the goal of object detection, studies commonly employ either statistical methods, such as Random Forest, or machine learning approaches including Convolutional Neural Networks [8].
Among the various remote sensing technologies available, RGB imagery is the most widely used for detecting specific types of animal burrows. Several studies successfully used RGB imagery from UAVs to directly detect burrow entrances of ghost crabs (Ocypode spp.) [8], Texas kangaroo rats (Dipodomys elator) [9], European sousliks (Spermophilus citellus) [10], black-tailed prairie dogs (Cynomys ludovicianus) [11], and intertidal macroinvertebrates [12]. In addition to detection, high-resolution RGB imagery has also been used to measure burrow opening dimensions [12]. However, a key limitation of RGB-based methods is their reduced effectiveness in areas with dense or tall vegetation, which can obscure ground visibility and hide burrow entrances. For instance, one study found that when grass height exceeded 18 cm, burrow openings became significantly less visible [10].
Thermal sensors have also been successfully used to identify nest burrows of the short-tailed shearwater (Ardenna tenuirostris) by detecting the heat signatures of chicks inside [13]. However, thermal imaging is less suitable for detecting burrow openings due to the lack of strong thermal contrast at the surface. In addition, vegetation cover and the typically coarse resolution of thermal sensors further limit the visibility of small ground features such as burrow entrances.
Multispectral data have supported burrow-related studies through vegetation indices and habitat structure assessment [9,11], while hyperspectral imaging was used in one study to detect and classify rodent holes [5]. However, both multi- and hyperspectral data perform well only when burrow entrances are visible and not covered by vegetation [9].
In contrast, Light Detection and Ranging (LiDAR) has proven particularly promising due to its ability to penetrate vegetation and to provide detailed, high-resolution 3D data on terrain structure and vegetation cover. Therefore, LiDAR offers significant potential for habitat mapping and species monitoring [14]. Previous studies have successfully used LiDAR to delineate nesting habitats for birds, quantify vegetation complexity for arboreal mammals such as squirrels, or model habitat suitability for various taxa including insects and amphibians [14,15]. One study combined aerial LiDAR and multispectral imagery to identify favorable burrow habitats for the desert tortoise (Gopherus agassizii) using topographic and vegetation characteristics [16]. Another study used topography and local elevations to identify areas with high potential for the burrowing of Kangaroo rats while also relying on statistical approaches [9]. However, these studies focused on the predictive modeling of burrow suitability and not on direct detection.
For interpreting remote sensing data in burrow studies, both statistical methods (such as Random Forest classification, GIS-based overlays, pixel-based clustering, Principal Component Analysis, and reflectance analysis) and machine learning approaches (primarily Convolutional Neural Networks) have been employed [5,8,9,10,11,12,13,16]. While machine learning models can offer superior performance in some cases [8,11], statistical methods present notable advantages: they are simpler to use and effective for small sample sizes and high-dimensional data and are less computationally demanding and easier to replicate [10]. Moreover, statistical methods can achieve comparable performance to CNNs when training samples are limited [8] and offer greater interpretability [10].
The overall aim of this study is to evaluate the feasibility of using remote sensing technology for monitoring hamster populations by directly detecting their burrow entrances. Unlike image-based methods, LiDAR offers strong potential for detecting burrows even in vegetated environments, as it can detect burrow entrances, even if covered by vegetation. Studies specifically using LiDAR for burrow detections were not found, but the above-mentioned studies highlight the potential of remote sensing in burrow ecology, though they also underscore a crucial gap in the current literature: the absence of a method capable of directly detecting burrow entrances based solely on 3D topographic data.
Therefore, this research develops and validates a geostatistical method that leverages UAV-based LiDAR data to identify hamster burrows. By doing so, this study bridges the gap between ecological monitoring needs and advances in remote sensing. The investigation is guided by two key questions: can high-resolution airborne LiDAR effectively detect hamster burrow entrances, and what data quality parameters are essential for accurate detection? To address these questions, the proposed detection algorithm was applied to UAV-derived LiDAR datasets collected at different flight altitudes, with the results validated against reference data obtained from differential GPS field surveys and image-based classification.
Given the limited availability of validated methods for direct burrow detection and the high conservation urgency for the European hamster, this study contributes both methodologically and practically to the fields of conservation technology and precision agriculture.

2. Materials and Methods
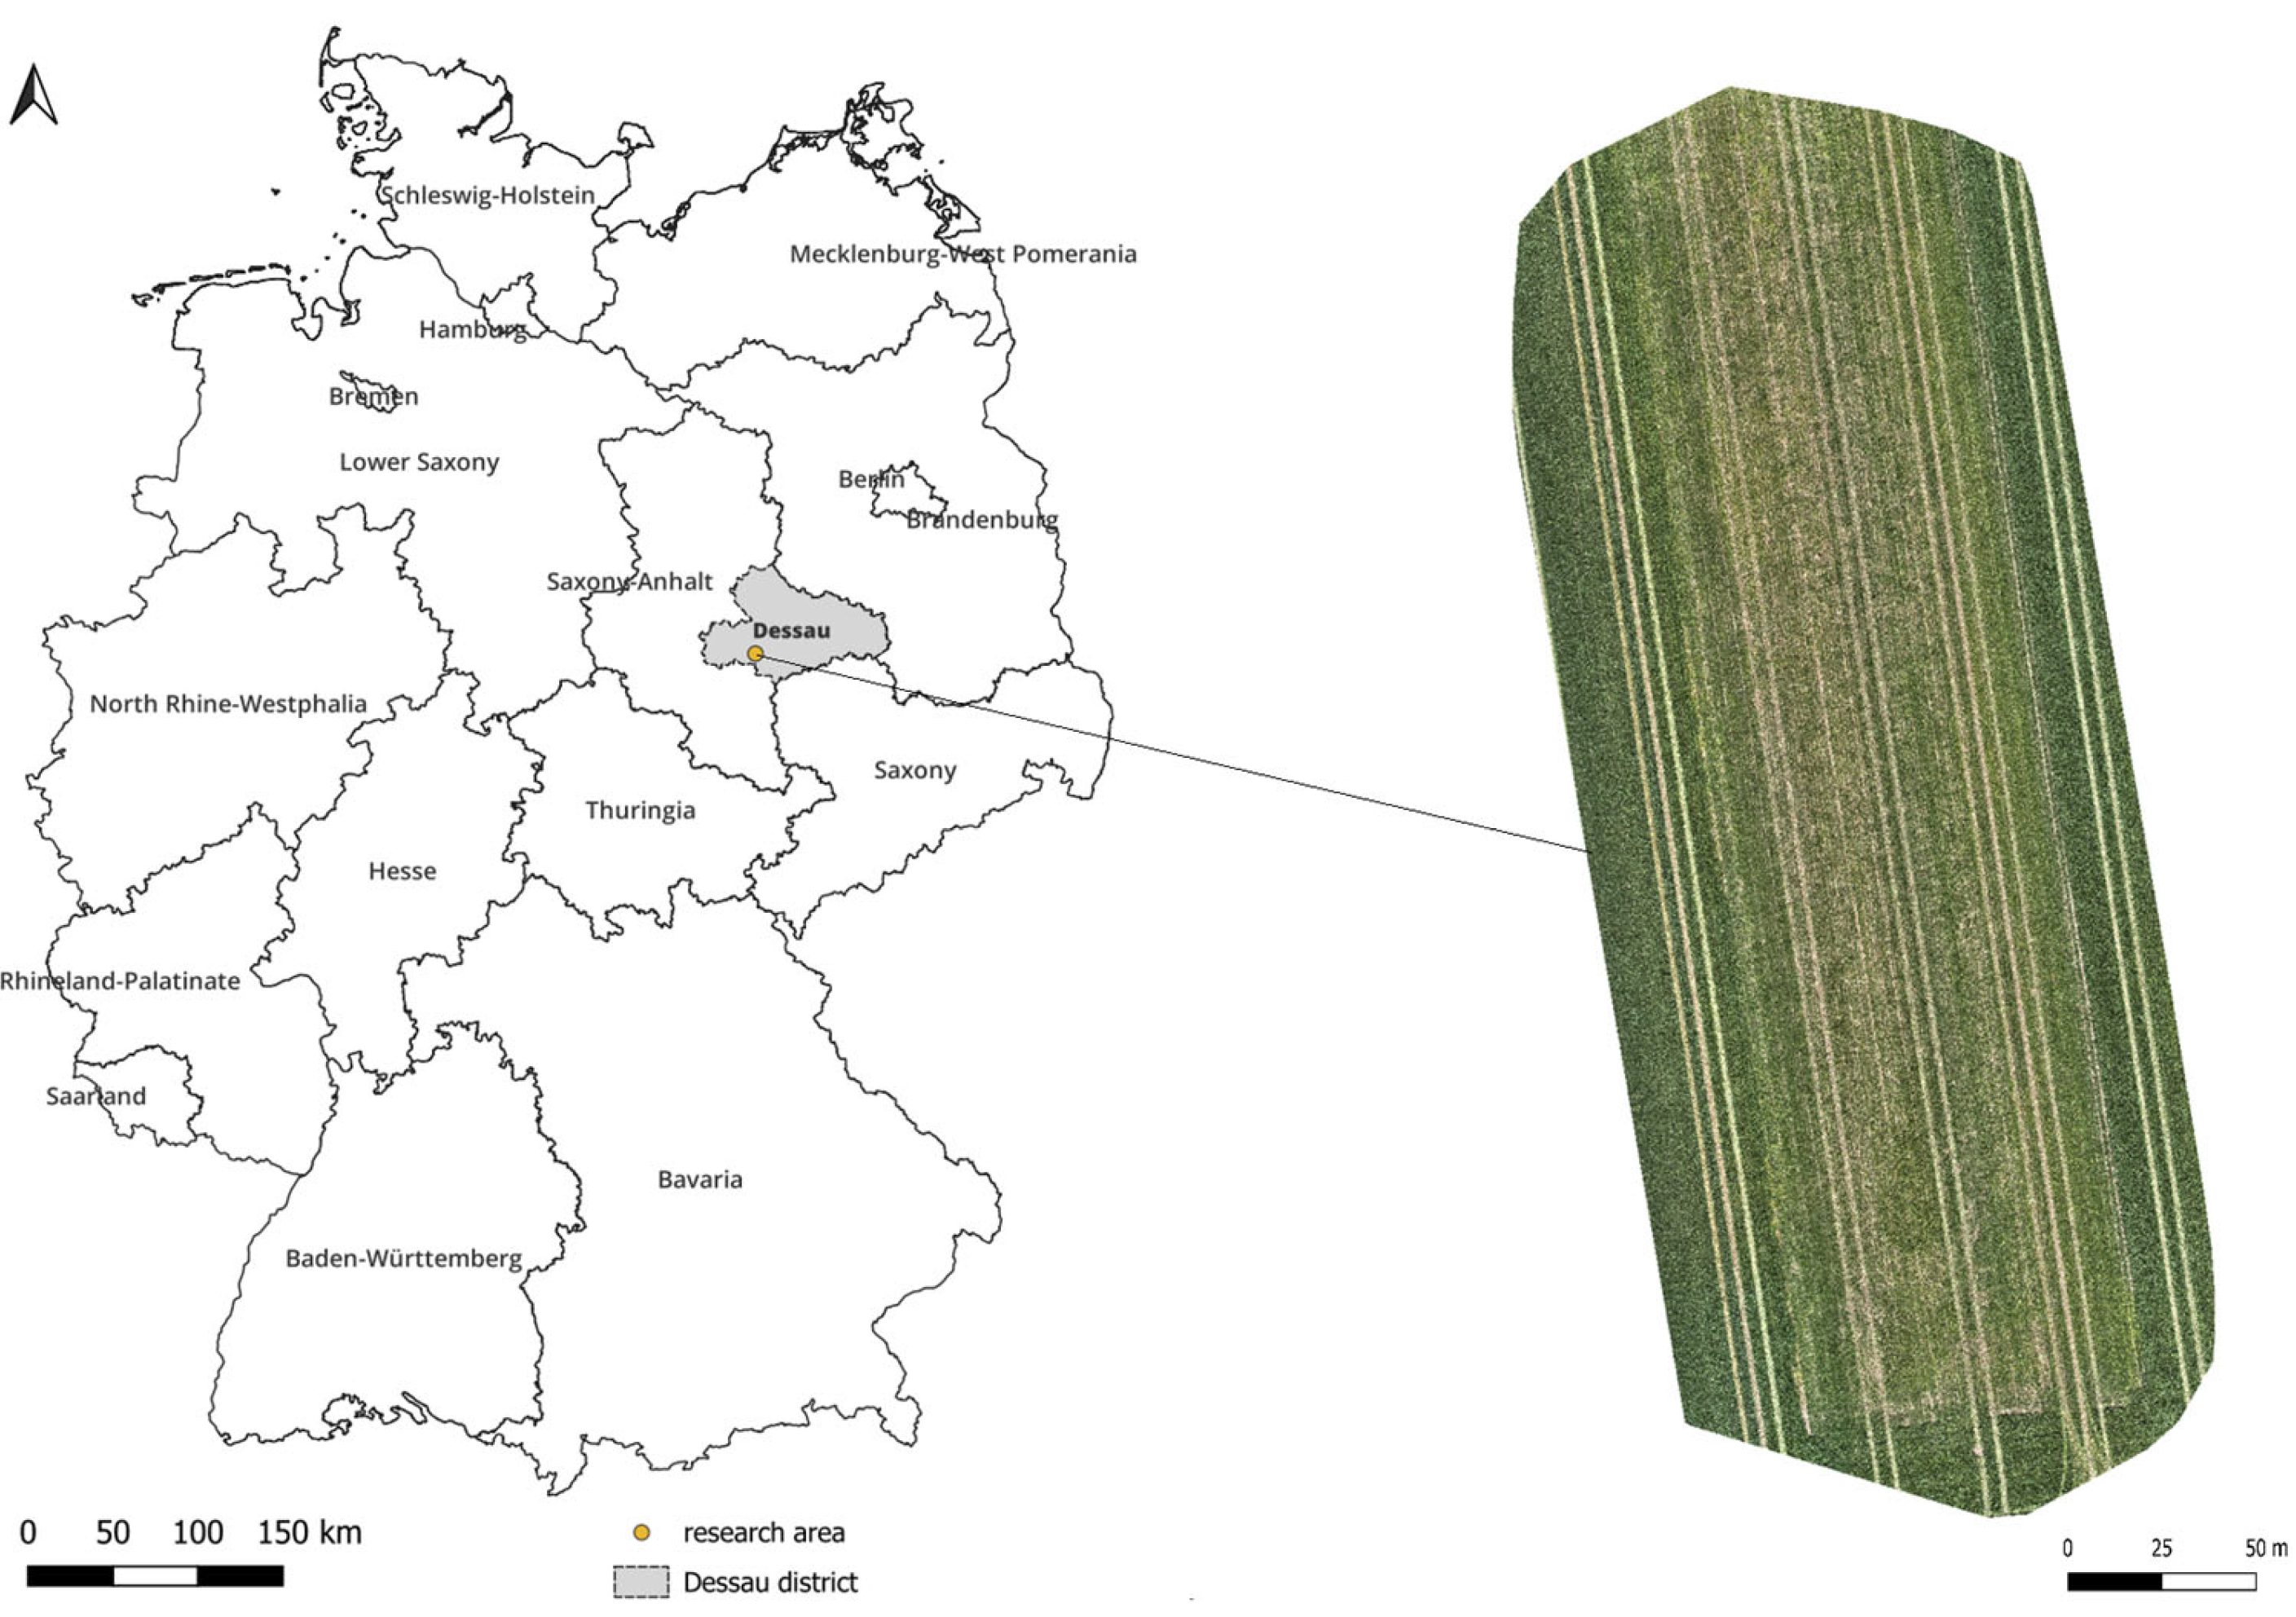
2.1. Study Area

For this study, four UAV-based LiDAR datasets were collected over a 0.6-hectare test site near Prosigk, Saxony-Anhalt, Germany (Figure 1). The study site was selected based on recent records of active European hamster burrows and its overall suitability as a hamster habitat. Factors include a combination of favorable abiotic conditions, such as deep, heavy soils suitable for burrowing, and key habitat features, such as the presence of croplands that provide a consistent availability of plant-based food sources [1].
The selected field was cultivated with winter wheat (Triticum aestivum) and was managed using no-till or direct seeding techniques, resulting in minimal soil disturbance and favorable surface visibility. The local soil was classified as Chernozem on loess substrate, a fertile, humus-rich black earth known for its high agricultural productivity and high water retention capacity.

2.2. Collection of Reference Data

For the validation of the LiDAR-based detection algorithm, the manual field mapping of hamster burrows took place on 24 April 2023, shortly before the second round of data collection by drone. Field conditions were dry and soil visibility was high. The fine-scale ground survey was carried out by trained staff. A differential GNSS system (Trimble R10, Trimble Inc., Westminster, CO, USA) was used to record the precise geolocation and the depth of the burrow entrances, while the diameter was measured with a digital caliper. Further, the width of the feeding circle was measured using a folding ruler, and the burrow type—classified as either vertical (drop hole) or slanting (slip hole) [17]—was recorded.
In addition to the manual field survey, RGB images taken by the drone were visually inspected by experts for hamster burrows that had been overlooked in the field.

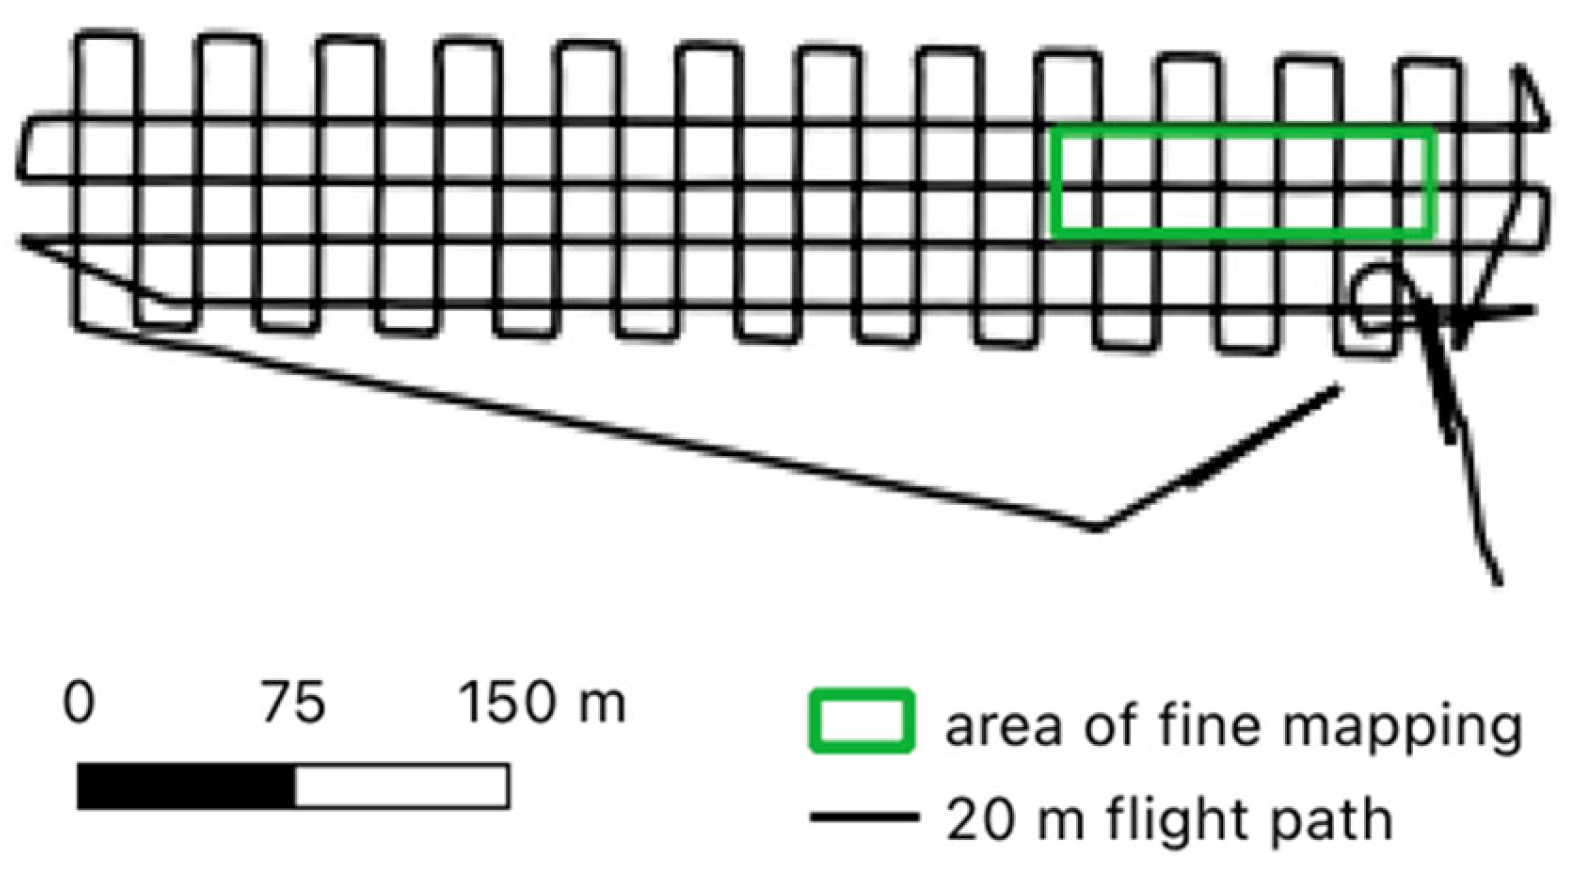
2.3. Collection of LiDAR Data

The data acquisition was carried out using two different sensor–platform combinations under similar environmental conditions in August 2022 and May 2023. Criteria were stable atmospheric conditions (dry, cloudless weather, and early morning hours) to minimize the effects of wind, temperature gradients, and solar radiation on sensor stability, and low vegetation cover to maximize the ground surface detectability.
The Mapper+ dataset used a YellowScan Mapper+ sensor mounted on a DJI Matrice 600 (M600) UAV platform (SZ DJI Technology Co. Ltd., Shenzhen, China), while the Voyager datasets were equipped with the YellowScan Voyager sensor (YellowScan, Saint-Clement-de-Reviere, France), mounted on an Acecore NOA UAV platform (Acecore Technologies, Uden, The Netherlands ). Photos of both UAV-LiDAR setups used during data acquisition are shown in Figure 2, illustrating the sensor–platform combinations deployed under real field conditions.
Table 1 provides a summary of the key acquisition parameters, sensor characteristics, and resulting point cloud metrics for each dataset included in the study. Since the two sensors differ in precision, accuracy, maximum echo capacity, and resulting point densities, using both allowed us to assess how these sensor characteristics and flight parameters influence detection performance. Furthermore, the Voyager sensor, while offering higher precision and more echoes per pulse, represents a higher-cost system, whereas the Mapper+ is a more affordable and accessible option for practical monitoring applications. Using both sensors under similar environmental conditions therefore helps establish the trade-offs between data quality, cost, and detection feasibility in real-world monitoring scenarios.
Each flight followed a cross-flight (lawnmower) pattern with parallel flight lines and systematic turns at the end of each pass to ensure comprehensive and evenly distributed coverage. This configuration minimized scan shadows and ensured a high point density across the field. The flight speed was kept consistent at 4 m/s across all altitudes. The overall survey setup, including start and end points, the orientation of flight lines, and extent of the study area, is illustrated in Figure 3. All point clouds were recorded in LAS 1.4 format and georeferenced using post-processed kinematic (PPK) corrections from a Trimble R10 base station, operating in the ETRS89/UTM Zone 32N coordinate system. No initial ground filtering or classification was applied to preserve all surface features relevant for burrow entrance detection.

2.4. Burrow Entrance Detection Algorithm
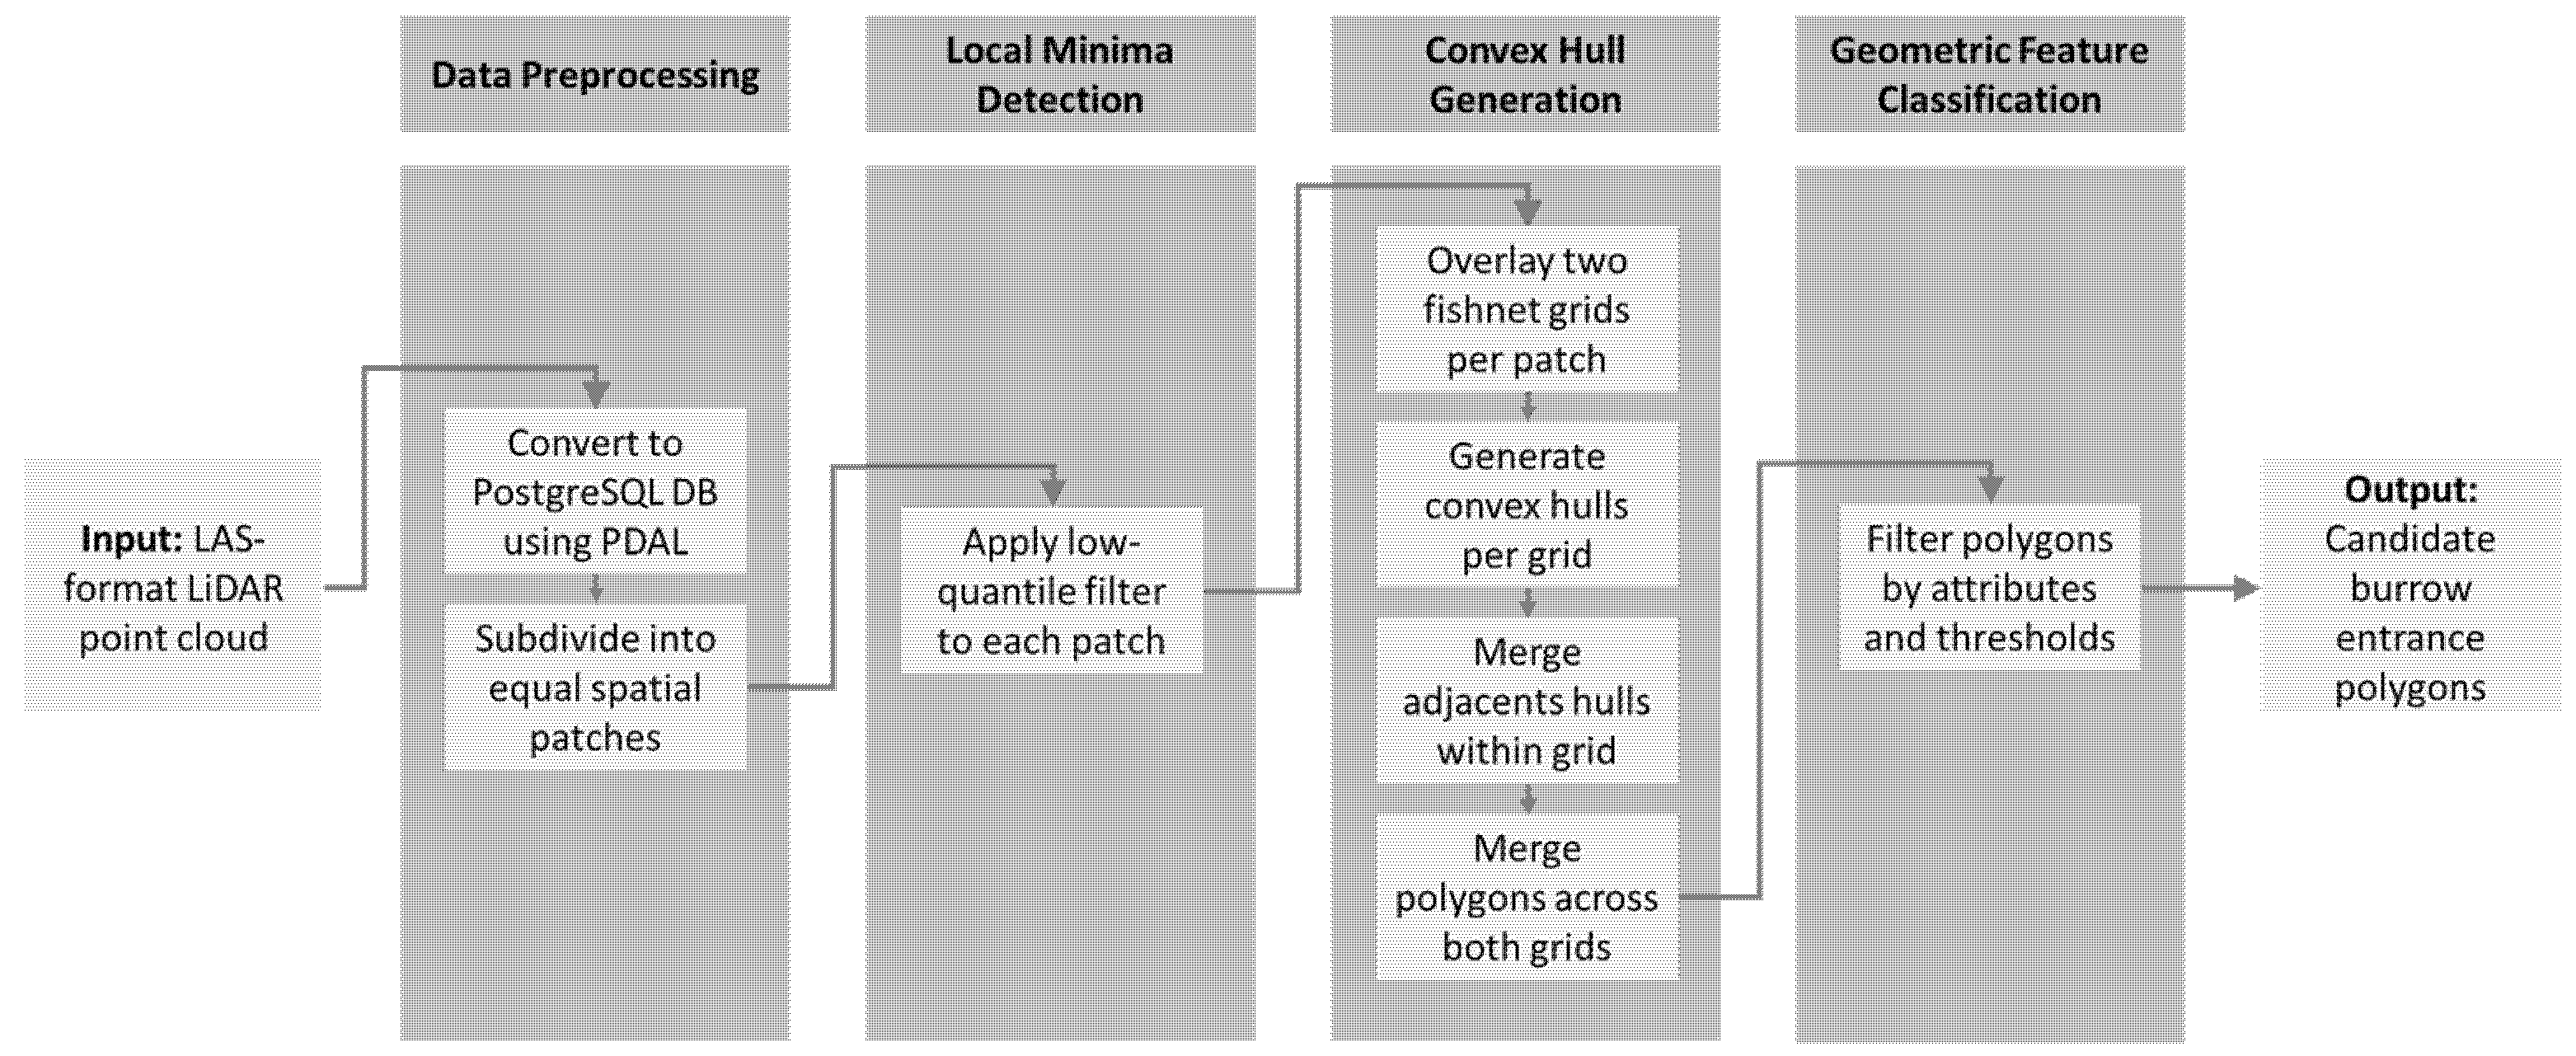
2.4.1. Concept

The detection method developed in this study aims to automatically identify hamster burrow entrances in agricultural landscapes using high-resolution UAV-based LiDAR data. It combines localized depth analysis and geometric filtering techniques to derive candidate burrow entrance features directly from the 3D point cloud, avoiding the loss of precision typically introduced by raster-based surface models.
The primary objective of the developed method was the automatic identification of burrow entrances of the European hamster based on elevation anomalies in high-resolution LiDAR point clouds. Hamster burrow entrances typically manifest as small, round surface depressions with distinctive geometric characteristics that are otherwise difficult to capture using conventional raster-based methods. To illustrate the overall logic of the detection method, a flowchart is provided in Figure 4. It outlines the sequential steps, from data import and quantile filtering to convex hull construction, polygon merging, attribute calculation, and final classification.

2.4.2. Data Preprocessing

To preserve the full vertical and spatial fidelity of the terrain structure, the analysis was conducted directly on the 3D point cloud, rather than through derived raster products such as digital terrain models.
To manage the extremely large volume of raw LiDAR data—often exceeding several billion points per dataset—the LAS files were converted into a PostgreSQL (v14.8) spatial database using the open-source Point Data Abstraction Library (PDAL v2.5.0) [18]. This database structure enabled query-based access and scalable integration with R-based preprocessing.
Each dataset was then subdivided into regular, non-overlapping 1 × 1 m tiles (hereafter referred to as “patches”) using the filters.splitter function. This tiling enabled a localized analysis of elevation patterns and allowed consistent referencing across datasets collected at different flight altitudes and point densities. The patch size was selected to balance resolution and processing efficiency, as smaller patches might fragment burrow entrance structures and larger patches might dilute terrain signals due to slope variation.

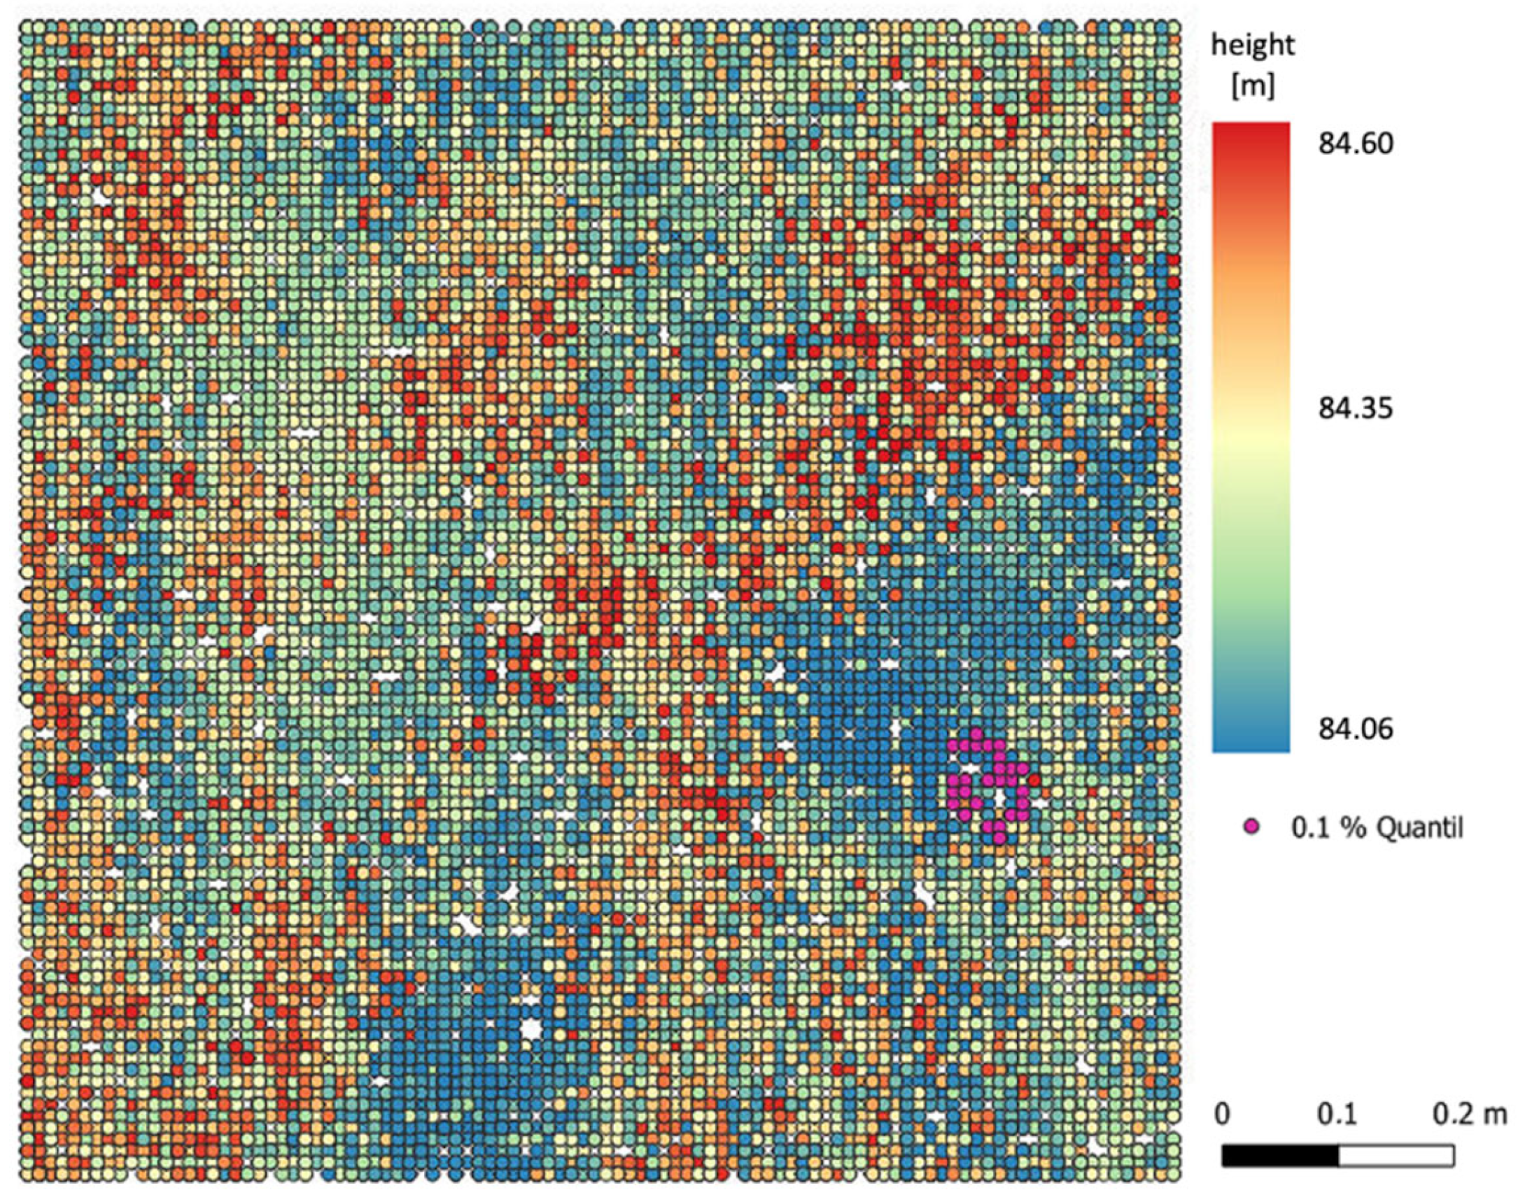
2.4.3. Detection of Local Depth Minima

In order to detect local depth minima, statistically significant surface depressions within the point cloud were identified by applying a quantile-based threshold to the elevation values of each spatial unit. The approach is conceptually adapted from methods for identifying local maxima in canopy height models, particularly those used to delineate individual tree crowns [19], but is here inverted to detect negative relief features such as burrow entrances.
Within each patch, the vertical distribution of all elevation points was statistically analyzed, and only the lowest subset of points was extracted. Specifically, a low quantile threshold was defined for each dataset to isolate micro-depressions in the terrain surface by removing higher-elevation noise, thereby enhancing the contrast of fine-scale topographic anomalies. The selection of the quantile value was iteratively optimized to reflect the point cloud density of each flight altitude. Higher point densities increase the likelihood of a laser pulse to penetrate directly into burrow depressions, allowing a more reliable capture of low-elevation signals. Conversely, lower-resolution datasets require less selective thresholds to avoid missing relevant features. Accordingly, the following quantile thresholds were applied for the respective flight altitudes of the Voyager sensor: 0.1% quantile (20 m flight altitude), 0.2% quantile (30 m flight altitude) and 1.0% quantile (120 m flight altitude). These thresholds reflect a trade-off between minimizing false positives and maintaining sensitivity to shallow surface features across varying data qualities. The principle of this filtering process is illustrated in Figure 5, which visualizes a representative 1 × 1 m patch with its lowest 0.1% of elevation points highlighted. These selected points serve as the foundation for subsequent convex hull construction and geometric classification steps.

2.4.4. Convex Hull Generation

After isolating candidate low-elevation points through quantile filtering, the next step involves the spatial delineation of potential burrow structures based on their local clustering and geometric cohesion. This is accomplished through the construction of convex hulls. To ensure the robust coverage of the surface and reduce the risk of missing depressions located at tile boundaries, a dual-grid (fishnet) approach was applied to each 1 × 1 m patch. The primary grid divided each patch into uniform square search windows. The secondary grid was offset by 50% of the search window size in both horizontal and vertical directions to capture features that straddle the edges of the primary grid cells.
Within each search window of both grids, a convex hull was generated around the quantile-filtered points—if a minimum number of points (empirically set to 10) was present to form a valid polygon. Convex hulls generated within the same grid were examined for spatial proximity. Polygons separated by less than a defined neighborhood distance (typically 15 cm) were merged to form continuous objects. This step addressed the fragmentation of a single burrow depression into multiple sub-polygons. Further, the resulting hulls from both grids were then merged by overlay comparison. If two polygons overlapped, the one with the higher roundness was retained, assuming it better represented a cohesive, circular burrow entrance. Non-overlapping polygons from either grid were retained in full.

2.4.5. Geometric Feature Classification and Filtering

Once candidate depressions were isolated, they were evaluated using a set of vector-based shape descriptors including roundness, surface area, vertical range, and local contrast to the surrounding terrain. This classification of the geometric features draws upon techniques from digital geomorphometry, such as those employed in the automated detection and morphological analysis of sinkholes and dolines [20].
In the final stage of the detection process, the geometric descriptors were used to filter the candidate polygons and identify those that most likely represent hamster burrow entrances. The filtering process applied empirically derived threshold values (Table 2), which were optimized through an exploratory analysis of both true-positive and false-positive detections and subsequently validated against the reference dataset. The selected geometric features reflect distinct morphological and topographic characteristics of burrow entrances—such as compact shape, limited surface area, and sufficient vertical contrast to the surrounding terrain—allowing for effective discrimination between true burrows and incidental ground depressions.
Polygons that did not fulfill all of these criteria were excluded from further analysis. This conservative approach maximized precision by favoring clear, morphologically consistent features over ambiguous signals. The final set of filtered polygons—comprising all geometries satisfying the above criteria—constitutes the output of the detection algorithm. These potential burrow entrance locations are further assessed through spatial validation against the compiled reference dataset.

3. Results

3.1. Confirmed Hamster Burrows

A total of 16 distinct burrow entrances were identified and recorded during the ground survey in April 2023. In addition to the hamster burrows detected during manual mapping, seven further burrow entrances were visually confirmed to be actual hamster burrows by experts based on RGB images. The spatial distribution can be obtained from Figure 6 and the burrow characteristics from Table 3.

3.2. LiDAR Dataset Quality

A representative example of a retained polygon that satisfies all threshold criteria is shown in Figure 7. The figure illustrates both the geometric footprint and the vertical profile of the detected depression, thereby demonstrating the typical morphology of a hamster burrow entrance.
In general, the data from lower flight altitudes were able to depict the burrow entrances more accurately than from 120 m altitude. The difference in detail between the 120 m altitude dataset with a spatial distribution of around 3000 pts/m2 and the 21,000 pts/m2 obtained from the 20 m dataset can be seen in Figure 8. While in the point clouds from 20 and 30 m the burrow entrance is clearly visible and extends as a vertical hole to a certain depth, the 120 m dataset shows only a slight depression that cannot be clearly identified as a hole.
Looking at a larger section of the LiDAR point cloud, the 20 m dataset enabled the direct visual identification of hamster burrow entrances. These features appeared as compact depressions that were distinguishable from natural terrain undulations and validated against ground-truth GNSS locations. A representative subset of the 20 m data, showing five confirmed burrow structures, is presented in Figure 9.

3.3. Burrow Entrance Detection Accuracy

The detection algorithm’s performance varied significantly across the tested Li-DAR datasets (Voyager 20 m, 30 m, and 120 m), largely reflecting differences in spatial resolution and temporal alignment with reference data. Figure 10 summarizes the number of mapped reference locations, and the number of true- and false-positive detections. Across all datasets, the 30 m Voyager flight produced the best results, detecting 20 out of 23 reference burrow entrances with 5 unmatched detections. The 20 m dataset yielded identical detection accuracy but produced six false positives. In contrast, the 120 m dataset demonstrated substantially reduced performance, detecting 14 of 23 burrow entrances and yielding 9 false positives. In the Mapper+ dataset (collected in 2022), a total of seven detected depressions were found, of which five were identified as likely burrow entrances through visual inspection, while two were categorized as false positives.
The 30 m Voyager and 20 m datasets achieved the highest F1-scores, reflecting a strong balance between detection accuracy and false-positive rate. In contrast, the 120 m dataset showed a lower recall due to a higher number of missed detections. The Mapper+ dataset exhibited lower precision due to a greater proportion of false positives. A detailed summary of recall, precision, and F1-scores for all datasets is provided in Table 4.

3.4. An Evaluation of the Burrow Entrance Detection Algorithm

Among the five filter criteria, the nPoints attribute—representing the number of quantile-selected points inside each candidate—proved particularly valuable for distinguishing true burrow entrances from noise. As shown in Figure 11, almost all reference-confirmed burrows are associated with polygons exceeding 10 points, while polygons with lower values rarely matched known locations. This justified the adoption of a minimum nPoints threshold of 10 in the final filter logic.

4. Discussion

This study applies a statistical method based solely on UAV-LiDAR data to detect individual burrow entrances—an approach not commonly found in previous work. The method differs from conventional black-box models by integrating interpretable spatial and geometric features directly derived from LiDAR point clouds. The approach enables the rule-based identification of burrow-like depressions based on local terrain variability and morphological parameters, offering a transparent and scalable solution. At sufficiently high point densities, the method delivers reliable results and is particularly well suited for ecological monitoring in agricultural landscapes.

4.1. Limitations and Uncertainty of Results

Despite the overall successful detection of burrow entrances, several limitations must be acknowledged when interpreting detection performance. The manual field mapping and the LiDAR data collection were conducted approximately ten days apart. During this period, new burrows may have been created or existing ones may have collapsed or been obscured by soil or rainfall effects. In addition, even under ideal field conditions, it is unlikely that all burrows were detected in the manual survey or through inspection of RGB images. Burrow entrances located at the edge of visibility, hidden beneath crop residue, or exhibiting a degraded appearance could have been overlooked. Thus, a minor risk of misclassification remains. Nonetheless, a considerable number of burrow entrances were correctly identified by the detection approach.
Another limitation of the remote sensing approach is that the reference dataset indicates the presence of burrow entrances but does not confirm whether a hamster actively used it at the time of LiDAR acquisition. In addition, the field was managed using minimal intervention agriculture, so that some burrows may originate from the previous season, without being actively used in the current season. In contrast, on traditionally cultivated fields with higher soil disturbance, it is unlikely that unused burrow entrances would persist for long periods. Therefore, in such intensively managed areas, the presence of visible burrows would be a stronger indication of active use by hamsters.
Lastly, it must be acknowledged that burrow entrances may sometimes be confused with those of other digging species, particularly in agricultural landscapes where several small mammals may coexist. One potential approach to reduce this uncertainty could involve analyzing burrow entrance characteristics such as size and shape, which are usually related to the body dimensions of the animal and can support species-level differentiation.

4.2. Differentiation Between Hamster and Vole Burrows

Particularly during vole outbreaks in agricultural areas during rodenticide applications, or in the context of building permission procedures, it is essential to reliably demonstrate the absence of hamsters. This helps prevent unintended harm to the species and avoid potential legal consequences. Therefore, surveys based on remote-sensing approaches must ensure that no hamster burrows are overlooked. At the same time, it is equally important to avoid misclassifying burrows of other species as hamster burrows, as this could unnecessarily hinder crop production or building projects.
As the diameter of circular burrow entrances correlates with an animal’s body size [12], one potential approach for distinguishing between hamster and vole burrows could be based on the entrance diameter. Adult hamsters are much larger than voles, typically weighing between 150 and 650 g and having a body length between 17 and 30 cm [22]. In contrast, adult voles typically weigh only 28 g, but their weight can range up to over 60 g [23]. Although the size difference between adult hamsters and voles is considerable, juvenile hamsters that have recently left their natal burrow are much smaller, typically weighing only between 80 and 100 g [24]. Thus, distinguishing a vole burrow from that of a juvenile hamster based solely on the hole diameter may be challenging. Vole burrow entrances are reported to have a diameter ranging between 2.5 and 7.5 cm [25], while hamster burrow openings typically range from 6 to 10 cm for adults [26,27] but can be as small as 4 cm for young hamsters [28]. Therefore, a detection algorithm for entrances of hamster burrows should not only identify the location of the entrances but also measure the diameter.
Assessing the diameter of burrow entrances has been successfully performed using high-resolution RGB images [12]: The method involved using RGB-DN histograms to differentiate burrow openings from sediment based on reflectance values and the diameter was measured by identifying the two furthest points on the perimeter and drawing a circle around them. This method turned out to be very accurate, with a correlation coefficient of 0.94 between the calculated and actually measured diameters for a flight altitude of 6 m and a ground sampling distance of <0.8 mm. Similarly, LiDAR has been successfully applied to measure the diameters of objects, particularly trees, either in combination with RGB image analysis [29] or as a standalone method [30,31,32]. While geometric characteristics such as diameter offer a useful first filter, integrating additional sensor data—such as RGB imagery or spectral indices—could further improve species-level differentiation. The most promising approach may involve using high-resolution RGB data in combination with machine learning to identify feeding traces commonly found around active hamster burrows. Nevertheless, definitive differentiation between vole burrows and juvenile hamster burrows, whose diameter ranges overlap, may only be possible through on-site inspection or supplementary field methods.

4.3. Performance in the Context of Related Studies

Several studies have applied statistical and rule-based approaches for burrow detection using remote sensing data. F1-scores between 0.91 and 0.96 were reported in a study that used random forest classification based on spectral and topographic features derived from UAV imagery to detect European souslik burrows [10]. Similarly, an overall accuracy of 97% and a Kappa coefficient of 0.90 were achieved in a study using hyperspectral imaging and principal component analysis to detect ratholes in desert steppe [5]. While not directly comparable to F1-scores, these results indicate strong performance within a different methodological framework. In contrast, machine learning models have also shown high effectiveness. A CNN classifier achieved an F1-score of 0.84 for ghost crab burrow detection using RGB orthomosaics at 4 cm resolution [8]. In another study on black-tailed prairie dog burrows, CNNs using RGB and topographic position index inputs reached F1-scores between 0.84 and 0.87, with the best performance from a TPI-only model at 2 cm resolution [11]. A YOLOv3-based model that combined RGB orthophotos and terrain ruggedness to detect vole burrows reported an F1-score of 0.93 [25]. In comparison, the present study achieved an F1-score of 0.83 using only LiDAR-derived geometric features from a 30 m flight altitude, without requiring model training or annotated data. These results demonstrate that a statistical, rule-based approach can compete with more complex machine learning methods while offering greater transparency and lower data requirements.

4.4. Technological Innovations and Future Potential

While the geostatistical detection method demonstrated high sensitivity and specificity when applied to high-resolution datasets such as from 20 m and 30 m flight altitudes, it is highly recommended to include the burrow entrance diameter into the assessment. As lower spatial resolution caused a decrease in the algorithm performance, a low point density of <3000 pts/m2 as used in the Voyager 120 m dataset is not considered suitable for the reliable detection of hamster burrow entrances. The fact that the Mapper+ dataset identified only five burrow entrances correctly may have also been related to the relatively low point density, though it is not known how many burrows were actually present on the field during the data collection.
At the same time, the results show that a very high point density can lead to an increased number of false-positive detections, as small depressions within the topography may mistakenly be interpreted as burrow entrances. Therefore, a medium-dense point cloud at flight altitudes at which hamster burrows would be visible also on RGB images may provide the best balance. At this medium-high level of detail, it should also be possible to estimate burrow entrance diameter, which is important for distinguishing between species.
As the algorithm was designed to rely solely on geometric features derived from LiDAR point clouds, it should be adaptable to different landscapes and survey conditions, if the resolution is sufficient to resolve surface depressions at a comparable spatial scale. However, its applicability to environments with substantially different soil structures, vegetation cover, or burrow morphologies remains to be tested, and may require an adjustment of specific thresholds—particularly those related to vertical depth and surface area.
Other technologies used in burrow detection, particularly where a thick layer of vegetation covers the burrow entrance, include ground-penetrating radar (GPR). GPR has been used in levee assessments to identify subsurface animal burrows, which can compromise the structural integrity of the levee during floods [33]. Though drones can be equipped with GPR sensors, the detection of animal burrows may require the sensor to be in close proximity to the ground. For screening a large area such as agricultural fields, a very low flight altitude would sharply increases dataset size and processing time, potentially reducing efficiency.
An alternative approach includes the combination of traditional sensors such as RGB or LiDAR, with machine learning algorithms, which makes processing large datasets more efficient [34,35]. In a methodologically related study, it was shown that analyzing RGB images through machine learning algorithms is generally suitable for the detection of hamster burrows [36]. This method could be especially powerful when incorporating additional indicators, such as feeding traces commonly found around active burrows [37], allowing for a more comprehensive and precise analysis based on the full range of collected data, while LiDAR would be effective in areas with lower ground visibility.
However, before fully automating hamster surveys, a visual inspection of the output is always advisable. Particularly when the diameters of the burrow entrances fall in the overlapping dimension between hamster and vole burrows, a visual check of RGB images for indicators such as feeding circles or even manual visits in the field may be needed.
Overall, LiDAR data can be highly effective as an initial screening tool, helping to select areas for more detailed assessments and reducing the need for large-scale ground surveys. The integration of various remote sensing technologies particularly has high potential to improve species monitoring and a wide range of ecological applications. A drone-based multi-sensor approach offers a non-intrusive, cost-effective, and accurate method of collecting comprehensive ecological data, thereby supporting targeted conservation efforts and sustainable ecosystem management.

5. Conclusions

This study demonstrated that UAV-based LiDAR data combined with a geostatistical detection algorithm could reliably identify hamster burrow entrances in agricultural landscapes. High detection performances with F1-scores above 0.8 were achieved at low flight altitudes (20 m and 30 m), using a minimum of 10 quantile-selected points per object, a roundness threshold of 0.54 or higher, a maximum area of 0.05 m2, a vertical range of at least 0.07 m, and a local depth contrast of at least 0.15 m based on the surrounding 10 cm neighborhood. This confirms the critical role of point cloud density for successful detection. The results showed that variations in flight altitude and spatial resolution significantly affect detection accuracy, underlining the need for carefully adapted acquisition parameters and algorithm settings. The method offers a promising and efficient tool for species monitoring and conservation management, supporting efforts to protect the critically endangered European hamster.

Author Contributions

Conceptualization, F.T.; methodology, F.T.; software, F.T. and J.R.; validation, F.T. and M.M.; formal analysis, F.T.; investigation, F.T.; resources, F.T.; data curation, F.T. and P.A.; writing—original draft preparation, F.T. and M.M.; writing—review and editing, F.T. and M.M.; visualization, F.T., M.M. and J.R.; supervision, F.T. and J.R.; project administration, F.T.; funding acquisition, F.T. All authors have read and agreed to the published version of the manuscript.

Funding

This research was funded by the European Agricultural Fund for Rural Development (EAFRD) within the framework of the European Innovation Partnership for Agricultural Productivity and Sustainability (EIP-AGRI), supported by the Ministry for the Environment, Agriculture and Energy of Saxony-Anhalt and the European Commission, under funding code EIP-Agri-2022-SA-LGMBVPN.

Institutional Review Board Statement

Not applicable.

Informed Consent Statement

Not applicable.

Data Availability Statement

The raw data supporting the conclusions of this article will be made available by the authors on request.

Conflicts of Interest

Milena Mohri and Jonas Ramstetter were employed by the Umwelt-und Geodatenmanagement GbR. The remaining authors declare that the research was conducted in the absence of any commercial or financial relationships that could be construed as a potential conflict of interest.

References

  1. Banaszek, A.; Bogomolov, P.; Feoktistova, N.; La Haye, M.; Monecke, S.; Reiners, T.E.; Rusin, M.; Surov, A.; Weinhold, U.; Ziomek, J. Cricetus cricetus . In The IUCN Red List of Threatened Species 2020; IUCN: Gran, Switzerland, 2020; p. e.T5529A111875852. [Google Scholar] [CrossRef]
  2. Meinig, H.; Boye, P.; Dähne, M.; Hutterer, R.; Lang, J. Rote Liste und Gesamtartenliste derSäugetiere (Mammalia) Deutschlands. Bundesamt für Naturschutz; Landwirtschaftsverlag GmbH: Münster, Germany, 2020; ISBN 978-3-7843-3772-2. [Google Scholar]
  3. Brakes, C.R.; Smith, R.H. Exposure of Non-target Small Mammals to Rodenticides: Short-term Effects, Recovery and Implications for Secondary Poisoning. J. Appl. Ecol. 2005, 42, 118–128. [Google Scholar] [CrossRef]
  4. Surov, A.; Banaszek, A.; Bogomolov, P.; Feoktistova, N.; Monecke, S. Dramatic Global Decrease in the Range and Reproduction Rate of the European Hamster Cricetus cricetus. Endanger. Species Res. 2016, 31, 119–145. [Google Scholar] [CrossRef]
  5. Gao, X.; Bi, Y.; Du, J. Identification of Ratholes in Desert Steppe Based on UAV Hyperspectral Remote Sensing. Appl. Sci. 2023, 13, 7057. [Google Scholar] [CrossRef]
  6. Chanev, M.; Dolapchiev, N.; Kamenova, I.; Filchev, L. Application of Remote Sensing Methods for Monitoring Wild Life Populations: A Review. In Proceedings of the Ninth International Conference on Remote Sensing and Geoinformation of the Environment (RSCy2023), Ayia Napa, Cyprus, 3–5 April 2023; Themistocleous, K., Michaelides, S., Hadjimitsis, D.G., Papadavid, G., Eds.; SPIE: Ayia Napa, Cyprus, 2023; p. 36. [Google Scholar]
  7. Zhang, Z.; Zhu, L. A Review on Unmanned Aerial Vehicle Remote Sensing: Platforms, Sensors, Data Processing Methods, and Applications. Drones 2023, 7, 398. [Google Scholar] [CrossRef]
  8. Bycroft, R.; Leon, J.X.; Schoeman, D. Comparing Random Forests and Convoluted Neural Networks for Mapping Ghost Crab Burrows Using Imagery from an Unmanned Aerial Vehicle. Estuar. Coast. Shelf Sci. 2019, 224, 84–93. [Google Scholar] [CrossRef]
  9. Stuhler, J.D.; Portillo-Quintero, C.; Goetze, J.R.; Stevens, R.D. Efficacy of Remote Sensing Technologies for Burrow Count Estimates of a Rare Kangaroo Rat. Wildl. Soc. Bull. 2024, 48, e1510. [Google Scholar] [CrossRef]
  10. Gedeon, C.I.; Árvai, M.; Szatmári, G.; Brevik, E.C.; Takáts, T.; Kovács, Z.A.; Mészáros, J. Identification and Counting of European Souslik Burrows from UAV Images by Pixel-Based Image Analysis and Random Forest Classification: A Simple, Semi-Automated, yet Accurate Method for Estimating Population Size. Remote Sens. 2022, 14, 2025. [Google Scholar] [CrossRef]
  11. Kearney, S.P.; Porensky, L.M.; Augustine, D.J.; Pellatz, D.W. Toward Broad-Scale Mapping and Characterization of Prairie Dog Colonies from Airborne Imagery Using Deep Learning. Ecol. Indic. 2023, 154, 110684. [Google Scholar] [CrossRef]
  12. Ha, S.-B.; Jang, Y.; Seo, J.; Kim, K.; Koo, B.J.; Ryu, J.-H.; Lee, S.-K. Burrow Opening Measurements of Intertidal Macroinvertebrates from Optical Drone Images. Remote Sens. 2024, 16, 1941. [Google Scholar] [CrossRef]
  13. Virtue, J.; Turner, D.; Williams, G.; Zeliadt, S.; Walshaw, H.; Lucieer, A. Burrow-Nesting Seabird Survey Using UAV-Mounted Thermal Sensor and Count Automation. Drones 2023, 7, 674. [Google Scholar] [CrossRef]
  14. Davies, A.B.; Asner, G.P. Advances in Animal Ecology from 3D-LiDAR Ecosystem Mapping. Trends Ecol. Evol. 2014, 29, 681–691. [Google Scholar] [CrossRef] [PubMed]
  15. De Vries, J.P.R.; Koma, Z.; WallisDeVries, M.F.; Kissling, W.D. Identifying Fine-scale Habitat Preferences of Threatened Butterflies Using Airborne Laser Scanning. Divers. Distrib. 2021, 27, 1251–1264. [Google Scholar] [CrossRef]
  16. Young, M.; Andrews, J.; Caldwell, T.; Saylam, K. Airborne LiDAR and Aerial Imagery to Assess Potential Burrow Locations for the Desert Tortoise (Gopherus agassizii). Remote Sens. 2017, 9, 458. [Google Scholar] [CrossRef]
  17. Nechay, G. Status of Hamsters, Cricetus cricetus, Cricetus migratorius, Mesocricetus newtoni and Other Hamster Species in Europe, Nature and Environment; Council of Europe Publ.: Strasbourg, France, 2000; ISBN 978-92-871-4330-3. [Google Scholar]
  18. PDAL Contributors PDAL Point Data Abstraction Library 2023. Available online: https://pdal.io/en/latest/ (accessed on 5 May 2025).
  19. Tiede, D.; Hochleitner, G.; Blaschke, T. A Full GIS-Based Workflow for Tree Identification and Tree Crown Delineation Using Laser Scanning. In Proceedings of the ISPRS Workshop CMRT, Vienna, Austria, 29–30 August 2005; ISPRS: Baton Rouge, LA, USA, 2005; Volume 5, p. 2005. [Google Scholar]
  20. Kim, Y.J.; Nam, B.H.; Youn, H. Sinkhole Detection and Characterization Using LiDAR-Derived DEM with Logistic Regression. Remote Sens. 2019, 11, 1592. [Google Scholar] [CrossRef]
  21. Montero, R.S.; Bribiesca, E. State of the Art of Compactness and Circularity Measures. Int. Math. Forum 2009, 4, 1305–1335. Available online: https://www.m-hikari.com/imf-password2009/25-28-2009/bribiescaIMF25-28-2009.pdf (accessed on 15 June 2025).
  22. Petrová, I.; Petriláková, M.; Losík, J.; Gouveia, A.; Damugi, I.E.D.; Tkadlec, E. Density-Related Pattern of Variation in Body Growth, Body Size and Annual Productivity in the Common Hamster. Mamm. Biol. 2018, 91, 34–40. [Google Scholar] [CrossRef]
  23. Olea, P.P.; De Diego, N.; García, J.T.; Viñuela, J. Habitat Type Modulates Sharp Body Mass Oscillations in Cyclic Common Vole Populations. Sci. Rep. 2024, 14, 12013. [Google Scholar] [CrossRef]
  24. Kirn, N. Ontogenese Des Europäischen Feldhamsters (Cricetus cricetus) Unter Dem Einfluss Verschiedener Prä-Und Postnataler Photoperioden. Ph.D. Thesis, Tierärztliche Hochschule Hannover, Hannover, Germany, 2004. [Google Scholar]
  25. Ezzy, H.; Charter, M.; Bonfante, A.; Brook, A. How the Small Object Detection via Machine Learning and UAS-Based Remote-Sensing Imagery Can Support the Achievement of SDG2: A Case Study of Vole Burrows. Remote Sens. 2021, 13, 3191. [Google Scholar] [CrossRef]
  26. Katzman, E.A.; Zaytseva, E.A.; Feoktistova, N.Y.; Tovpinetz, N.N.; Bogomolov, P.L.; Potashnikova, E.V.; Surov, A.V. Seasonal Changes in Burrowing of the Common Hamster (Cricetus cricetus L., 1758) (Rodentia: Cricetidae) in the City. PJE 2018, 17, 251–258. [Google Scholar] [CrossRef]
  27. Kryštufek, B.; Hoffmann, I.E.; Nedyalkov, N.; Pozdnyakov, A.; Vohralík, V. Cricetus cricetus (Rodentia: Cricetidae). Mamm. Species 2020, 52, 10–26. [Google Scholar] [CrossRef]
  28. Karaseva, E.; Shilayeva, L. The Structure of Hamster Burrows in Relation to Its Age and the Season. Byulletin’Moskovskogo Obs. Ispyt. Prirody Otd. Biol. 1965, 70, 30–39. [Google Scholar]
  29. Popescu, S.C.; Wynne, R.H.; Nelson, R.F. Measuring Individual Tree Crown Diameter with Lidar and Assessing Its Influence on Estimating Forest Volume and Biomass. Can. J. Remote Sens. 2003, 29, 564–577. [Google Scholar] [CrossRef]
  30. Rudge, M.L.M.; Levick, S.R.; Bartolo, R.E.; Erskine, P.D. Modelling the Diameter Distribution of Savanna Trees with Drone-Based LiDAR. Remote Sens. 2021, 13, 1266. [Google Scholar] [CrossRef]
  31. Unger, D.R.; Hung, I.-K.; Brooks, R.; Williams, H. Estimating Number of Trees, Tree Height and Crown Width Using Lidar Data. GIScience Remote Sens. 2014, 51, 227–238. [Google Scholar] [CrossRef]
  32. Falkowski, M.J.; Smith, A.M.S.; Hudak, A.T.; Gessler, P.E.; Vierling, L.A.; Crookston, N.L. Automated Estimation of Individual Conifer Tree Height and Crown Diameter via Two-Dimensional Spatial Wavelet Analysis of Lidar Data. Can. J. Remote Sens. 2006, 32, 153–161. [Google Scholar] [CrossRef]
  33. Chlaib, H.K.; Mahdi, H.; Al-Shukri, H.; Su, M.M.; Catakli, A.; Abd, N. Using Ground Penetrating Radar in Levee Assessment to Detect Small Scale Animal Burrows. J. Appl. Geophys. 2014, 103, 121–131. [Google Scholar] [CrossRef]
  34. Talha, S.A.; Manasreh, D.; Nazzal, M.D. The Use of Lidar and Artificial Intelligence Algorithms for Detection and Size Estimation of Potholes. Buildings 2024, 14, 1078. [Google Scholar] [CrossRef]
  35. Rodrigues, W.G.; Vieira, G.S.; Cabacinha, C.D.; Bulcão-Neto, R.F.; Soares, F. Applications of Artificial Intelligence and LiDAR in Forest Inventories: A Systematic Literature Review. Comput. Electr. Eng. 2024, 120, 109793. [Google Scholar] [CrossRef]
  36. Thürkow, F.; Lorenz, C.; Ramstetter, J.; Hoppe, I.; Haase, M. KI-basierte Detektion von Feldhamsterbauen auf landwirtschaftlichen Nutzflächen mittels multi-sensoraler UAS-Daten. In Proceedings of the Ökologische Nachhaltigkeit—Kolloquium Landwirtschaft der Zukunft—Ist KI ein Wesentlicher Schlüssel zur Nachhaltigeren Landwirtschaft? Berlin, Germany, 28 September 2023; Available online: https://www.researchgate.net/publication/378041194_KI-basierte_Detektion_von_Feldhamsterbauen_auf_landwirtschaftlichen_Nutzflachen_mittels_multi-sensoraler_UAS-Daten (accessed on 5 June 2025).
  37. Mammen, U.; Kayser, A.; Mammen, K.; Raddatz, D.; Weinhold, U. Die Berücksichtigung Des Feldhamsters (Cricetus cricetus) Im Rahmen von Eingriffsvorhaben. Nat. Landsch. 2014, 89, 0028–0615. [Google Scholar] [CrossRef]
Figure 1. The location of the study area, Prosigk, Saxony-Anhalt, Germany.
Sustainability 17 06366 g001
Figure 2. UAV-mounted LiDAR acquisition systems used in this study. (a) Acecore NOA drone with YellowScan Voyager sensor, (b) DJI Matrice 600 with YellowScan Mapper+ sensor.
Sustainability 17 06366 g002
Figure 3. Flight pattern, start point, end point and area of fine mapping.
Sustainability 17 06366 g003
Figure 4. A workflow of the burrow entrance detection algorithm, showing all core processing steps from LAS import to polygon classification.
Sustainability 17 06366 g004
Figure 5. The visualization of a 1 × 1 m patch with LiDAR point cloud classified by height. Points in the 0.1% quantile (lowest elevation) are highlighted in magenta, representing candidate local depressions.
Sustainability 17 06366 g005
Figure 6. Confirmed hamster burrow entrances from manual field mapping (white) and additionally identified burrows on RGB images (black) within the fine mapping area (red outline).
Sustainability 17 06366 g006
Figure 7. Example of a filtered candidate burrow polygon showing (a) a convex hull within a 1 × 1 m patch, (b) the attribute summary of a hamster burrow, (c) the vertical profile along the x-axis, and (d) the vertical profile along the y-axis.
Sustainability 17 06366 g007
Figure 8. Laser scan of a specific hamster burrow entrances displayed as a point clouds from three different datasets, (a) Voyager 20 m, (b) Voyager 30 m, and (c) Voyager 120 m.
Sustainability 17 06366 g008aSustainability 17 06366 g008b
Figure 9. A view of the 20 m LAS File with outlined hamster burrow entrances in red.
Sustainability 17 06366 g009
Figure 10. Detection outcomes across all LiDAR datasets.
Sustainability 17 06366 g010
Figure 11. A scatterplot of the nPoints attribute for all candidate polygons in the 20 m dataset. Red points indicate points within confirmed burrow entrances, while black points represent all polygons detected by the algorithm. The lower density of confirmed detections below 10 points supports the selected threshold.
Sustainability 17 06366 g011
Table 1. An overview of LiDAR datasets used in the study, including sensor specifications, platform types, flight altitudes, acquisition dates, and resulting point cloud densities.
Dataset NameMapper+Voyager 20 mVoyager 30 mVoyager 120 m
SensorYellowScan Mapper+YellowScan VoyagerYellowScan VoyagerYellowScan Voyager
Drone systemDJI M600Acecore NOAAcecore NOAAcecore NOA
Flight date31 August 20225 May 20235 May 20235 May 2023
Altitude [m]302030120
Precision [cm]2.50.50.50.5
Accuracy [cm]3111
Maximum echoes3151515
Point density [points/m2]636022,58314,5872972
Used in accuracy evaluationNo *YesYesYes
* Due to the significant temporal gap between the Mapper+ dataset and the 2023 reference mapping, it was excluded from the main detection accuracy analysis.
Table 2. Overview of geometric features and thresholds applied to filter potential burrow entrances.
AttributeDescription or CalculationFilter ThresholdJustification
RoundnessCalculated using the common circularity index
R = 4 × π × A r e a P e r i m e t e r 2 , where values close to 1 indicate a near-perfect circle and values near 0 indicate elongation or irregularity [21].
≥0.54Excludes elongated or fragmented shapes not consistent with burrow entrance morphology.
AreaThe surface area enclosed by the convex hull.≤0.05 m2Based on maximum observed burrow footprint in field measurements.
Depth 1The vertical range within the convex hull, i.e., the difference between its highest and lowest point.≥0.07 mEnsures sufficient vertical depression within the polygon.
Depth 2The difference between the average elevation in a 10 cm radius surrounding the polygon and its lowest point, providing a measure of its contrast to the immediate neighborhood.≥0.15 mCaptures the relative depression compared to the local terrain.
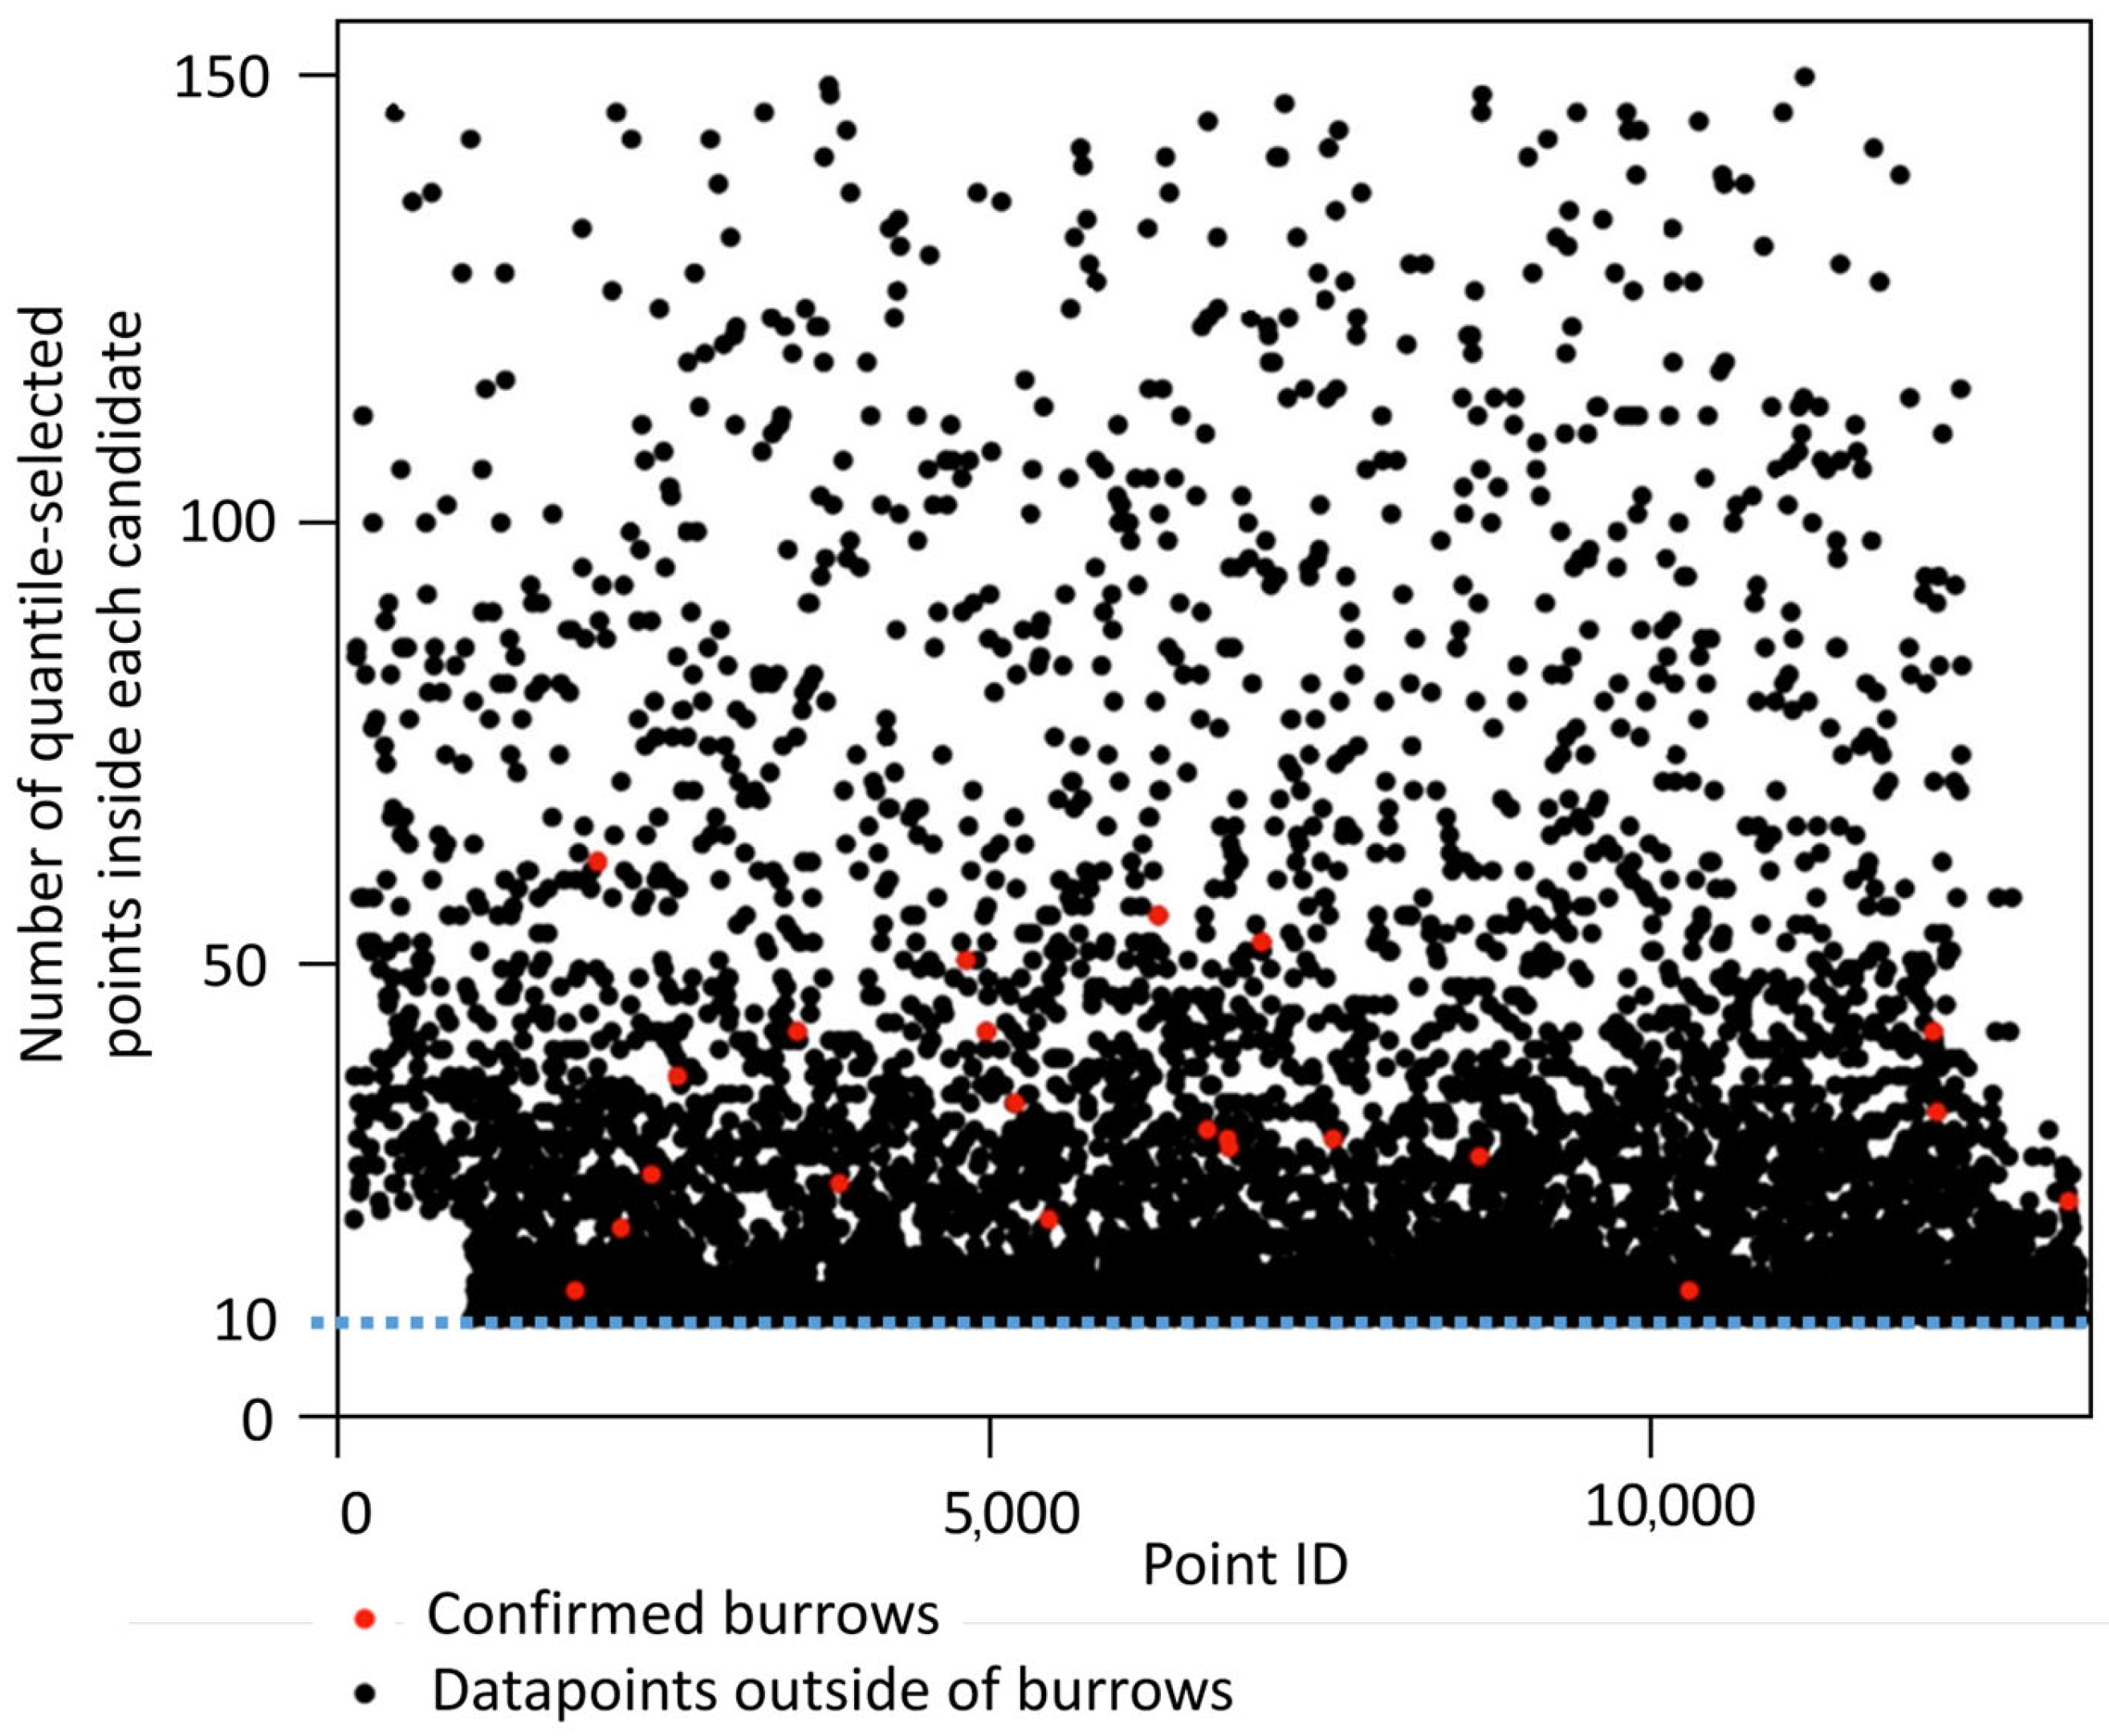
nPointsThe number of quantile-selected points forming the polygon.≥10Guarantees a minimal structural density and prevents noise-driven detections.
Table 3. Morphometric properties of manually mapped European hamster burrow entrances from the field survey.
Type of HoleNumberBurrow Depth [cm]Burrow Entrance Diameter [cm]Feeding Circle Diameter [cm]
MinimumMaximumMeanMinimumMaximumMeanMinimumMaximumMean
Drop hole1423.0119.061.74.58.56.720.040.028.6
Slip hole228.050.039.06.07.06.540.060.050.0
Table 4. Detection performance metrics for the four datasets.
MetricMapper+Voyager 20 mVoyager 30 mVoyager 120 m
Precision0.710.770.800.61
Recall-0.870.870.61
F1-score-0.820.830.61
Disclaimer/Publisher’s Note: The statements, opinions and data contained in all publications are solely those of the individual author(s) and contributor(s) and not of MDPI and/or the editor(s). MDPI and/or the editor(s) disclaim responsibility for any injury to people or property resulting from any ideas, methods, instructions or products referred to in the content.

