Article

Study on Fish Diversity and Drivers Based on Environmental DNA in Chishui River, China

1
State Key Laboratory of Environmental Criteria and Risk Assessment, Chinese Research Academy of Environmental Sciences, Beijing 100012, China
2
Command Center for Comprehensive Survey of Natural Resources, China Geological Survey Bureau, Beijing 100037, China
*
Author to whom correspondence should be addressed.
Sustainability 2025, 17(11), 4922; https://doi.org/10.3390/su17114922
Submission received: 2 April 2025 / Revised: 19 May 2025 / Accepted: 21 May 2025 / Published: 27 May 2025
(This article belongs to the Special Issue Ecology, Biodiversity and Sustainable Conservation)

Abstract

Freshwater fish is facing a great crisis due to the looming threat of biodiversity loss. Certain important target areas are difficult to survey owing to their accessibility, making them susceptible to data deficiencies. In this study, we surveyed 52 sites using environmental DNA techniques to investigate fish biodiversity in the Chishui River Basin of the Yangtze River, China. A total of 96,031 valid fish sequences were read, resulting in the identification of 77 species belonging to six orders, 62 genera, and 18 families. The dominant orders were Cypriniformes, Siluriformes, and Perciformes. Among the identified fishes, 71 were native and six were exotic, with the native fishes including 16 endemic fishes from the upper reaches of the Yangtze River. The Shannon–Wiener and richness indices of the tributaries in the upstream section were significantly higher than those of the tributaries in the downstream section. The Datong River is the most diverse secondary tributary of the Chishui River. Among the environmental factors in the Chishui River Basin, altitude and electrical conductivity had the greatest influence on fish diversity (p < 0.01). Our findings highlight the application of environmental DNA technology to modern biodiversity surveys and illustrate that the Chishui River Basin is primarily affected by environmental factors at this stage. However, continuing efforts are needed to protect freshwater biodiversity, and additional research is required to better understand the complex interplay between human activity and environmental factors.

1. Introduction

Despite extensive conservation measures, biodiversity loss is unavoidable, and freshwater biodiversity is currently in crisis [1,2]. The loss of freshwater biodiversity far exceeds that in terrestrial and marine environments [3]. Furthermore, freshwater fishes have gone extinct globally at a faster rate than other vertebrates, with freshwater species declining by 83% since 1970 [4,5].
Fish diversity has received increasing attention as a result of the global biodiversity crisis. Fish are important consumers in the aquatic food chain [6] and play a significant role in aquatic ecosystems [7]. Changes in the structural composition and distribution of fish communities can reflect the stability and health of aquatic ecosystems [8]. Unfortunately, fish populations in the Yangtze, China’s longest river, have declined dramatically in recent decades, with over 90 fish species now endangered or seriously threatened, such as Psephurus gladius and Tenualosa reevesii, which are now considered functionally extinct [9].
The Chishui River (436.5 km long, drainage area 21,010 km2), as the last near-natural river without hydraulic facilities in the upper Yangtze, sustains 143 native fish species including 36 Yangtze-endemic and 14 exotic species [10]. While existing studies have addressed fish resource assessment, diversity patterns, and spatial distribution [11], the driving mechanisms behind its fish community succession over the past decade remain unclear. Implementation of fishing bans has constrained data acquisition, compounded by historically limited sampling designs, hindering comprehensive analysis of basin-wide fish distribution patterns and their determining factors.
There is no consensus on the factors influencing fish diversity and composition. Natural factors such as climate and geography are frequently thought to influence large-scale fish distribution patterns [12,13]. However, as human societies have developed, human drivers such as overfishing, exotic species introduction, and urbanization have played an increasing role in shaping fish diversity [14,15,16]. Land use and human Footprint (FTP) is commonly used to indicate the intensity of human interference. However, it is important to mention that the percentage of impervious area, which is commonly used as an indicator of urbanization, had some effect on fish species richness. Given the pressures associated with China’s rapid socioeconomic growth and the changes in ecosystem environments on a spatial scale, determining the contributions of human and natural factors to fish diversity and community composition is crucial. This study addresses two critical gaps: (1) Traditional monitoring constraints during fishing moratoriums (2020-present) limit temporal-spatial resolution, and (2) fragmented sampling designs inadequately capture basin-wide ecological gradients. We pioneer an environmental DNA (eDNA) metabarcoding framework across 52 strategic locations. By integrating environmental predictors with operational taxonomic units (OTUs)-based α/β diversity analyses, our approach uniquely:
Resolves real-time community structure under fishing bans through non-invasive biomonitoring.

2. Materials and Methods

2.1. Sampling

The Chishui River Basin in China is located on the border between the Yunnan and Guizhou Plateau and the Sichuan Basin. Within its distinct geographical context, this area has diverse topography, soil types, various vegetation types, and rich biodiversity, The upper reaches are from the source of the river to Maotai Town, with a length of 225 km and a natural drop of 1275 m. The middle reaches are from Maotai Town to Chishui City, with a length of 158 km and a natural drop of 183 m. The lower reaches are from Chishui City to the river mouth of Hejiang County, with a length of 54 km and a natural drop of 16 m [17]. The sampling sites ranged from 179 to 1433 m above sea level. Based on previous surveys, the goals of accessibility, and maximal coverage of different habitats, a total of 52 sampling points were selected based on the geographical characteristics of the Chishui River Basin. The sampling points were distributed throughout the mainstream and five main tributaries along the Erdao, Tongzi, Guling, Datong, and Xishui rivers. The sampling points were divided across three reaches: 14 points in the upstream reach (nos. 1–14), 20 in the middle (nos. 15–34), and 18 in the downstream (nos. 35–52) (Figure 1).
At each sampling point, surface water samples of 1 L were collected in a sterile, sealable brown plastic bottle, stored at 4 °C for transporting to the laboratory. Three duplicate samples from one site were collected for eDNA analysis. Then, they were filtered using a vacuum pump with a polyethylene filter membrane with a pore size of 0.22 μm. The glass funnel and filter head were thoroughly disinfected with 10% sodium hypochlorite before use. The filter membranes were immediately placed into sterile 2 mL centrifugal tubes and stored at −20 °C for the experiments.

2.2. Environmental Variable Acquisition

To obtain accurate data, GPS was utilized to determine altitude. A handheld velocity radio (HZBP, Beijing, China) was used to measure flow velocity. An infrared rangefinder (Trueyard SP1500H, NV, USA) was used to measure river width. A portable chlorophyll sensor (YSI6920V2-2, Yellow Springs, OH, USA) was used to record the chlorophyll concentration in the water, and a multiparameter water quality analyzer (YSI6920V2-2, Yellow Springs, OH, USA) was used to measure dissolved oxygen (DO), pH, electrical conductivity (EC), and water temperature. The Chishui River Basin survey encompassed a wide range of altitudes and sampling points, providing valuable data on the diverse topography, soil types, vegetation types, and biodiversity within the area.
Human Footprint (FPT) data of Chishui River were obtained from the human footprint map of the area (https://datadryad.org/stash/dataset/doi:10.5061/dryad.052q5 (accessed on 5 January 2023)) [18]. Additionally, land-cover data from high-resolution (10 m) land-cover maps were obtained from Tsinghua University (https://data-starcloud.pcl.ac.cn/iearthdata/map?id=1 (accessed on 20 May 2025)). Based on the land use types used in a previous fish study [19] and considering the characteristics of this study area, three land types—farmland, forest, and impervious surface data—were acquired using ArcGIS 10.6. Values were extracted from an area of 1 km radius around each sampling location, and each value was calculated as the proportion of the relevant land cover type to the total terrestrial area excluding water areas. The land cover values at each sampling site were averaged over three locations.
In subsequent analyses, generalized additive models (GAMs) was used to analyze the relationships between land use types and fish diversity metrics. We calculated the Akaike information criterion (AIC) values of the models using the function AIC in the R package stats. The best GAM model was selected based on the AIC value (AIC < 2 compared to the lowest value) and the percentage of explained deviance.

2.3. DNA Analysis

A DNeasy Blood & Tissue Kit (Qiagen, Düsseldorf, Germany) was used to extract DNA. Given the low content and concentration of fish DNA in the water, the number of elution cycles was increased from two to four to enhance the concentration of the extracted DNA according to the manufacturer’s instructions. To determine the amount of DNA to be added to the PCR, a Qubit 3.0 DNA detection kit (Invitrogen, Carlsbad, CA, USA) was used to accurately quantify genomic DNA. The MiFish PCR primers were as follows. Forward is 5′-GTCGGTAAAACTCGTGCCAGC-3′ and reverse is 5′-CATAGTGGGGTATCTAATCCCAGTTTG-3′. Each PCR reaction consisted of 15 mL 2× Hieff® Robust PCR Master Mix (Yeasen, Shanghai, China), 1 μL forward Bar-PCR primer, 1 μL reverse Primer, 10–20 ng PCR product, Illumina bridge PCR-compatible primers, and 9–12 μL H2O, for a total volume of 30 μL. The PCR reaction conditions were as follows: 94 °C for 3 min; five cycles at 94 °C for 30 s, 45 °C for 20 s, and 65 °C for 30 s; 27 cycles at 94 °C for 20 s, 55 °C for 20 s, and 72 °C for 30 s; 72 °C for 5 min; and then maintained at 10 °C. A PCR negative control was prepared using ddH2O as the template to assess for potential contamination. Three replicates were performed for each sample during PCR amplification, and the PCR products were mixed. PCR products were detected by 2% agarose gel electrophoresis. Shenggong Bioengineering Co., Ltd. (Shanghai, China) spliced the PCR products, and high-throughput sequencing was conducted using the Illumina NovaSeq 6000 (Illumina, San Diego, CA, USA) sequencing platform.

2.4. Bioinformatics

After obtaining valid sequences from all samples, the quality of the sequence fragments was evaluated, and fragments < 100 bp in length were discarded. Based on their overlapping relationships, paired fragments were spliced into sequences. Finally, high-quality sequences for each sample were obtained by splitting them based on the barcode and primer sequences, with the sequence direction corrected according to the positive and negative barcodes and primer orientations.
Operational taxonomic unit (OTU) clustering was performed using MitoFish (http://mitofish.aori.u-tokyo.ac.jp/) and NCBI (https://www.ncbi.nlm.nih.gov/) databases as data sources. To create a custom database, all fish data from the Yangzi River were retrieved and downloaded. To ensure data integrity, the scope of the searches was expanded for comparison with the entire NCBI database. After comparison and annotation, the corresponding OTU and species abundance tables were obtained.

2.5. Statistical Analyses

Statistical analyses were performed based on the results of the OTU clustering and species composition analyses. Sequences with an OTU threshold < 10 were discarded. OTUs with an identity value of ≥99% and an E-value of ≥10−5 were screened, and the OTUs from the same species were combined. If an OTU could not be compared at the species level, statistics were created at the next level, such as genus or family. Microsoft Excel was used to determine the proportion of valid sequences for each fish sample.
The Shannon–Wiener diversity index (H’), Pielou uniformity index (J), richness index, and Simpson Dominance Index (D) were used to assess community diversity. To explore the differences or similarities in community composition between different groups of samples, the number of OTUs was used to calculate the Bray–Curtis distance measure matrix for nonmetric multidimensional scaling (NMDS), permutational multivariate analysis of variance (PerMANOVA). The PERMANOVA was conducted using the ADONIS function in vegan with 999 permutations. and analysis of similarities (ANOSIM). Additionally, the relationship between environmental factors and community composition was investigated using canonical correspondence analysis (CCA). Pearson correlation analyses were used to investigate the influence of environmental and human factors on the species richness index.
All analyses were conducted using R v2.5.6, with the vegan package used for NMDS, PerMANOVA, ANOSIM, and diversity index calculations. The Pacman package was used for the Pearson correlation analysis of environmental factors, whereas diversity index boxplots were generated using the Amplicon package. ANOVA was performed using Perim (v9.1.0) software.

3. Results

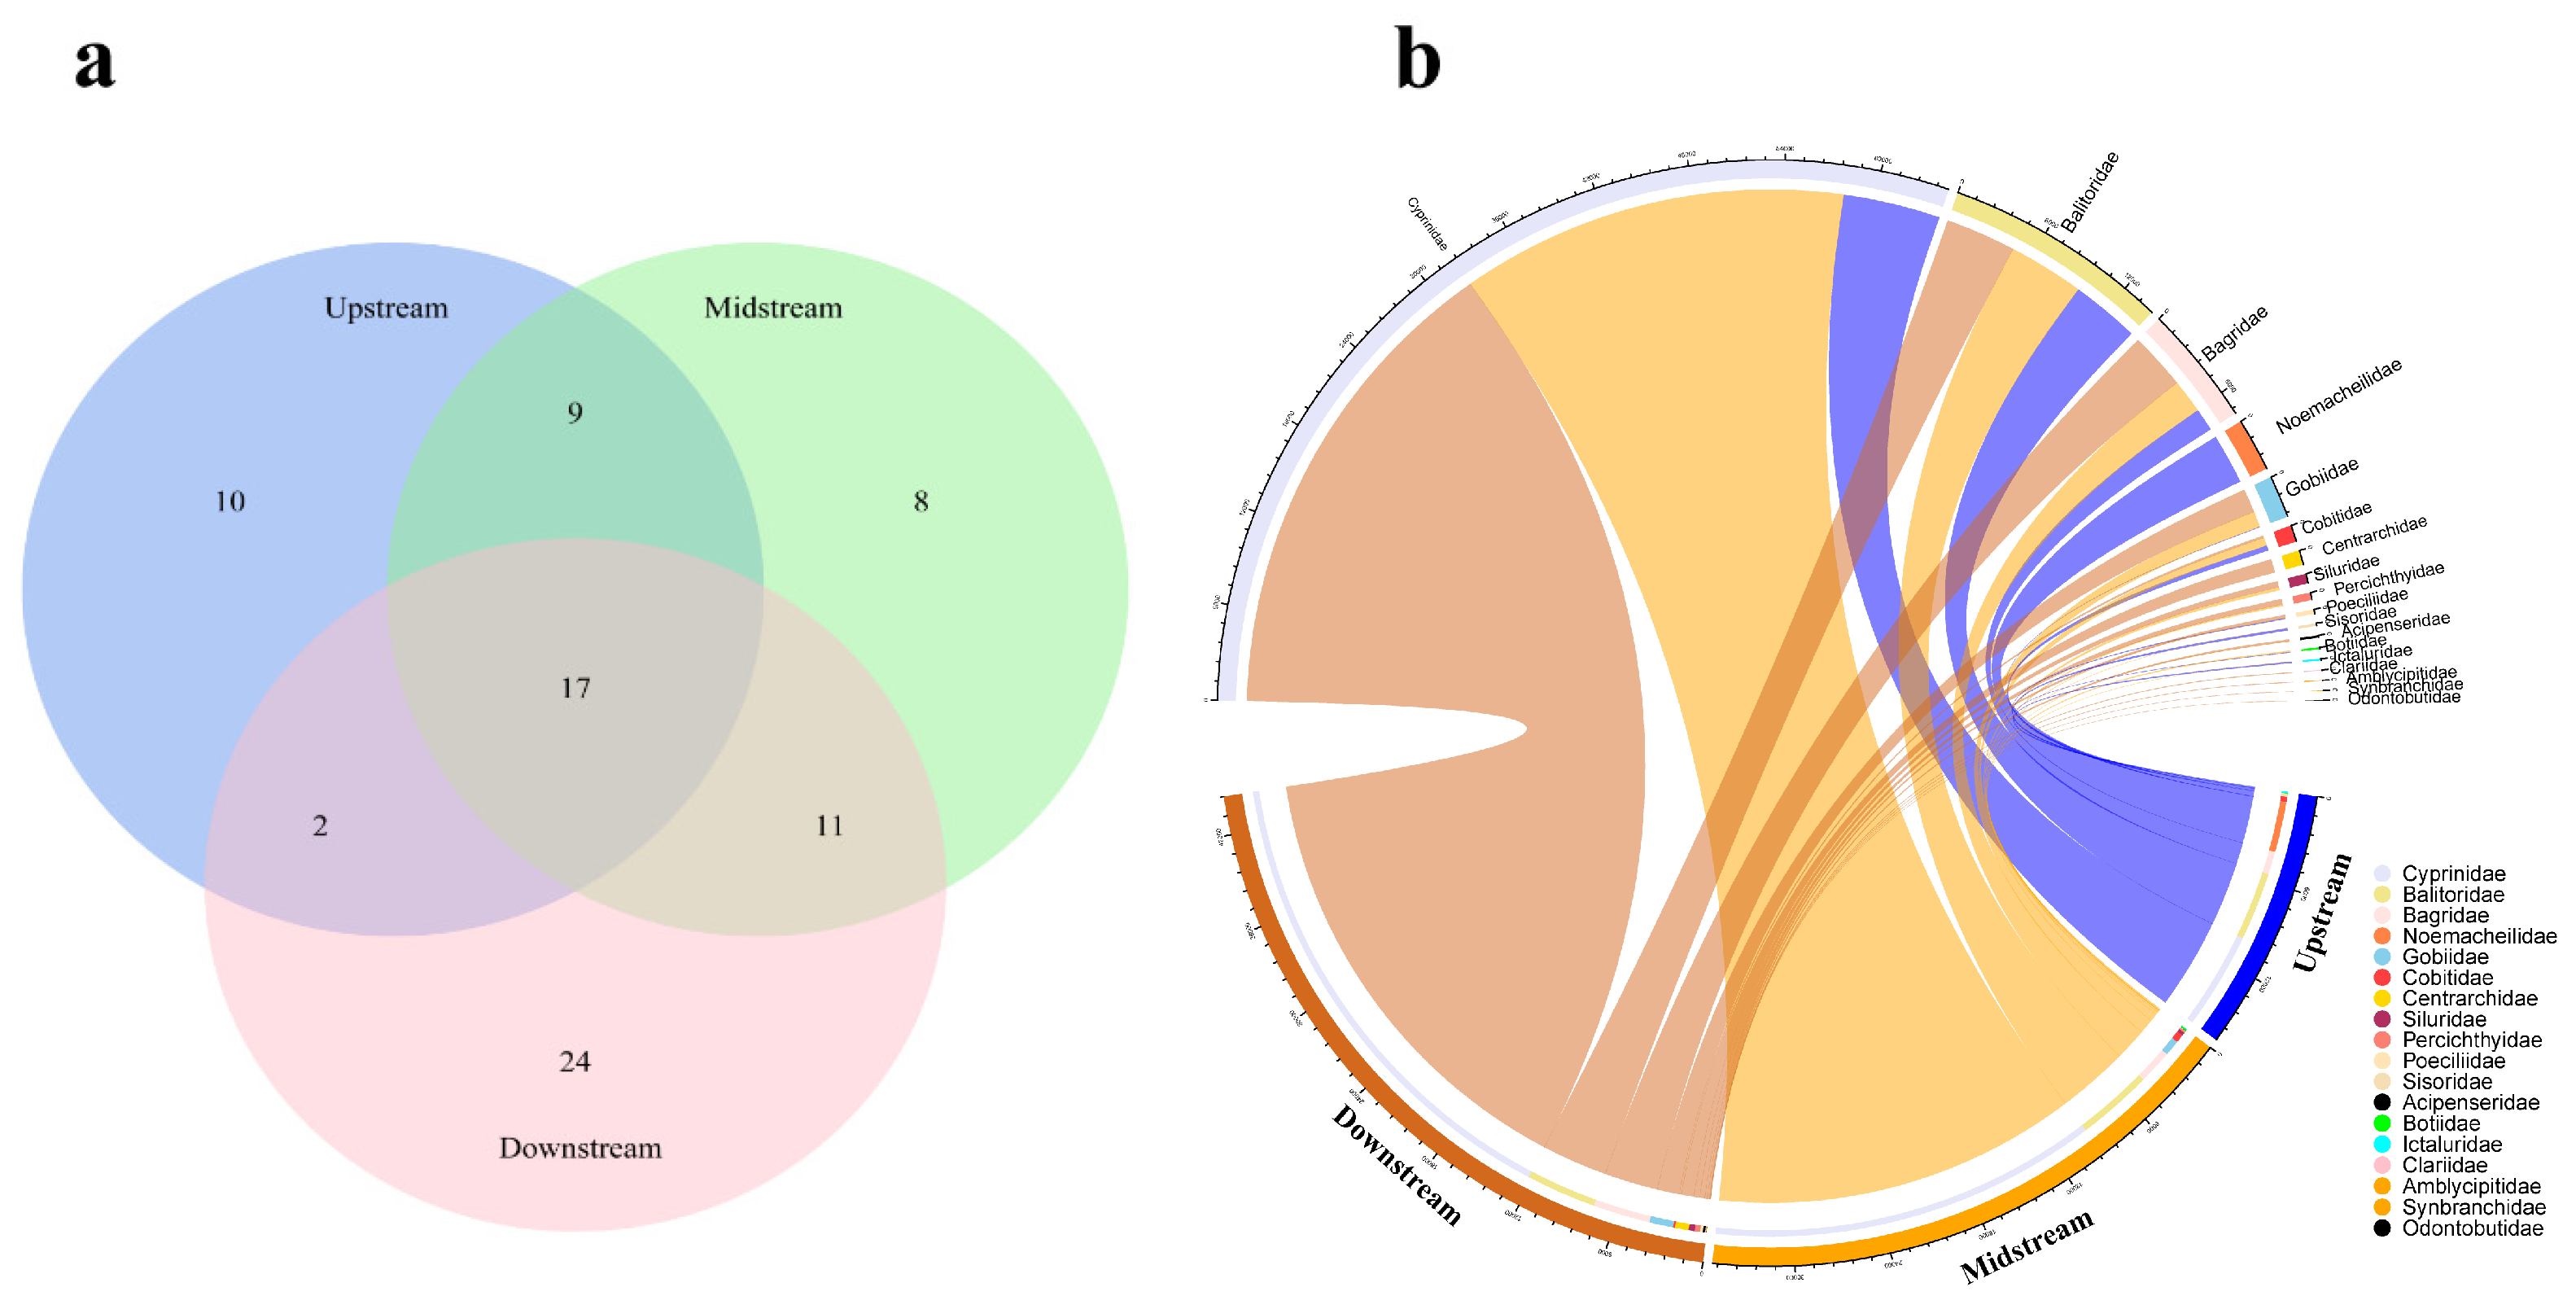
3.1. Fish Composition in the Chishui River

A total of 96,031 valid fish sequences were read, resulting in the identification of 77 species from six orders, 62 genera, and 18 families (Table 1, Figure 2a). The dominant orders were Cypriniformes, Siluriformes, and Perciformes, accounting for 87.87%, 8.23%, and 3.44% of the total sequence abundance, respectively. Cyprinidae and Botiidae were the dominant families, representing 71% and 13.52% of the total sequence abundance, respectively, while Bagridae accounted for 7.34% of the total sequence abundance.
The upstream fish consisted of 38 species belonging to 33 genera in 14 families from two orders. Mesomigratory fish included 45 species from 36 genera in 10 families from five orders. Downstream fish consisted of 54 species from 45 genera in 15 families from seven orders (Figure 2a,b). An increasing gradient was observed from upstream to downstream. Notably, 17 species were found in the upper, middle, and lower reaches: Pseudorasbora parva, Xenocypris davidi, Schizothorax prenanti, Zacco platypus, Sinogastromyzon sichangensis, Misgurnus anguillicaudatus, Carassius auratus, Ctenopharyngodon idella, Homatula potanini, Rhinogobius giurinus, Platysmacheilus exiguous, Pseudobagrus ussuriensis, Rhodeus ocellatus, Rhodeus sinensis, Gambusia affinis, Acrossocheilus monticola, and Hemiculterella sauvagei.

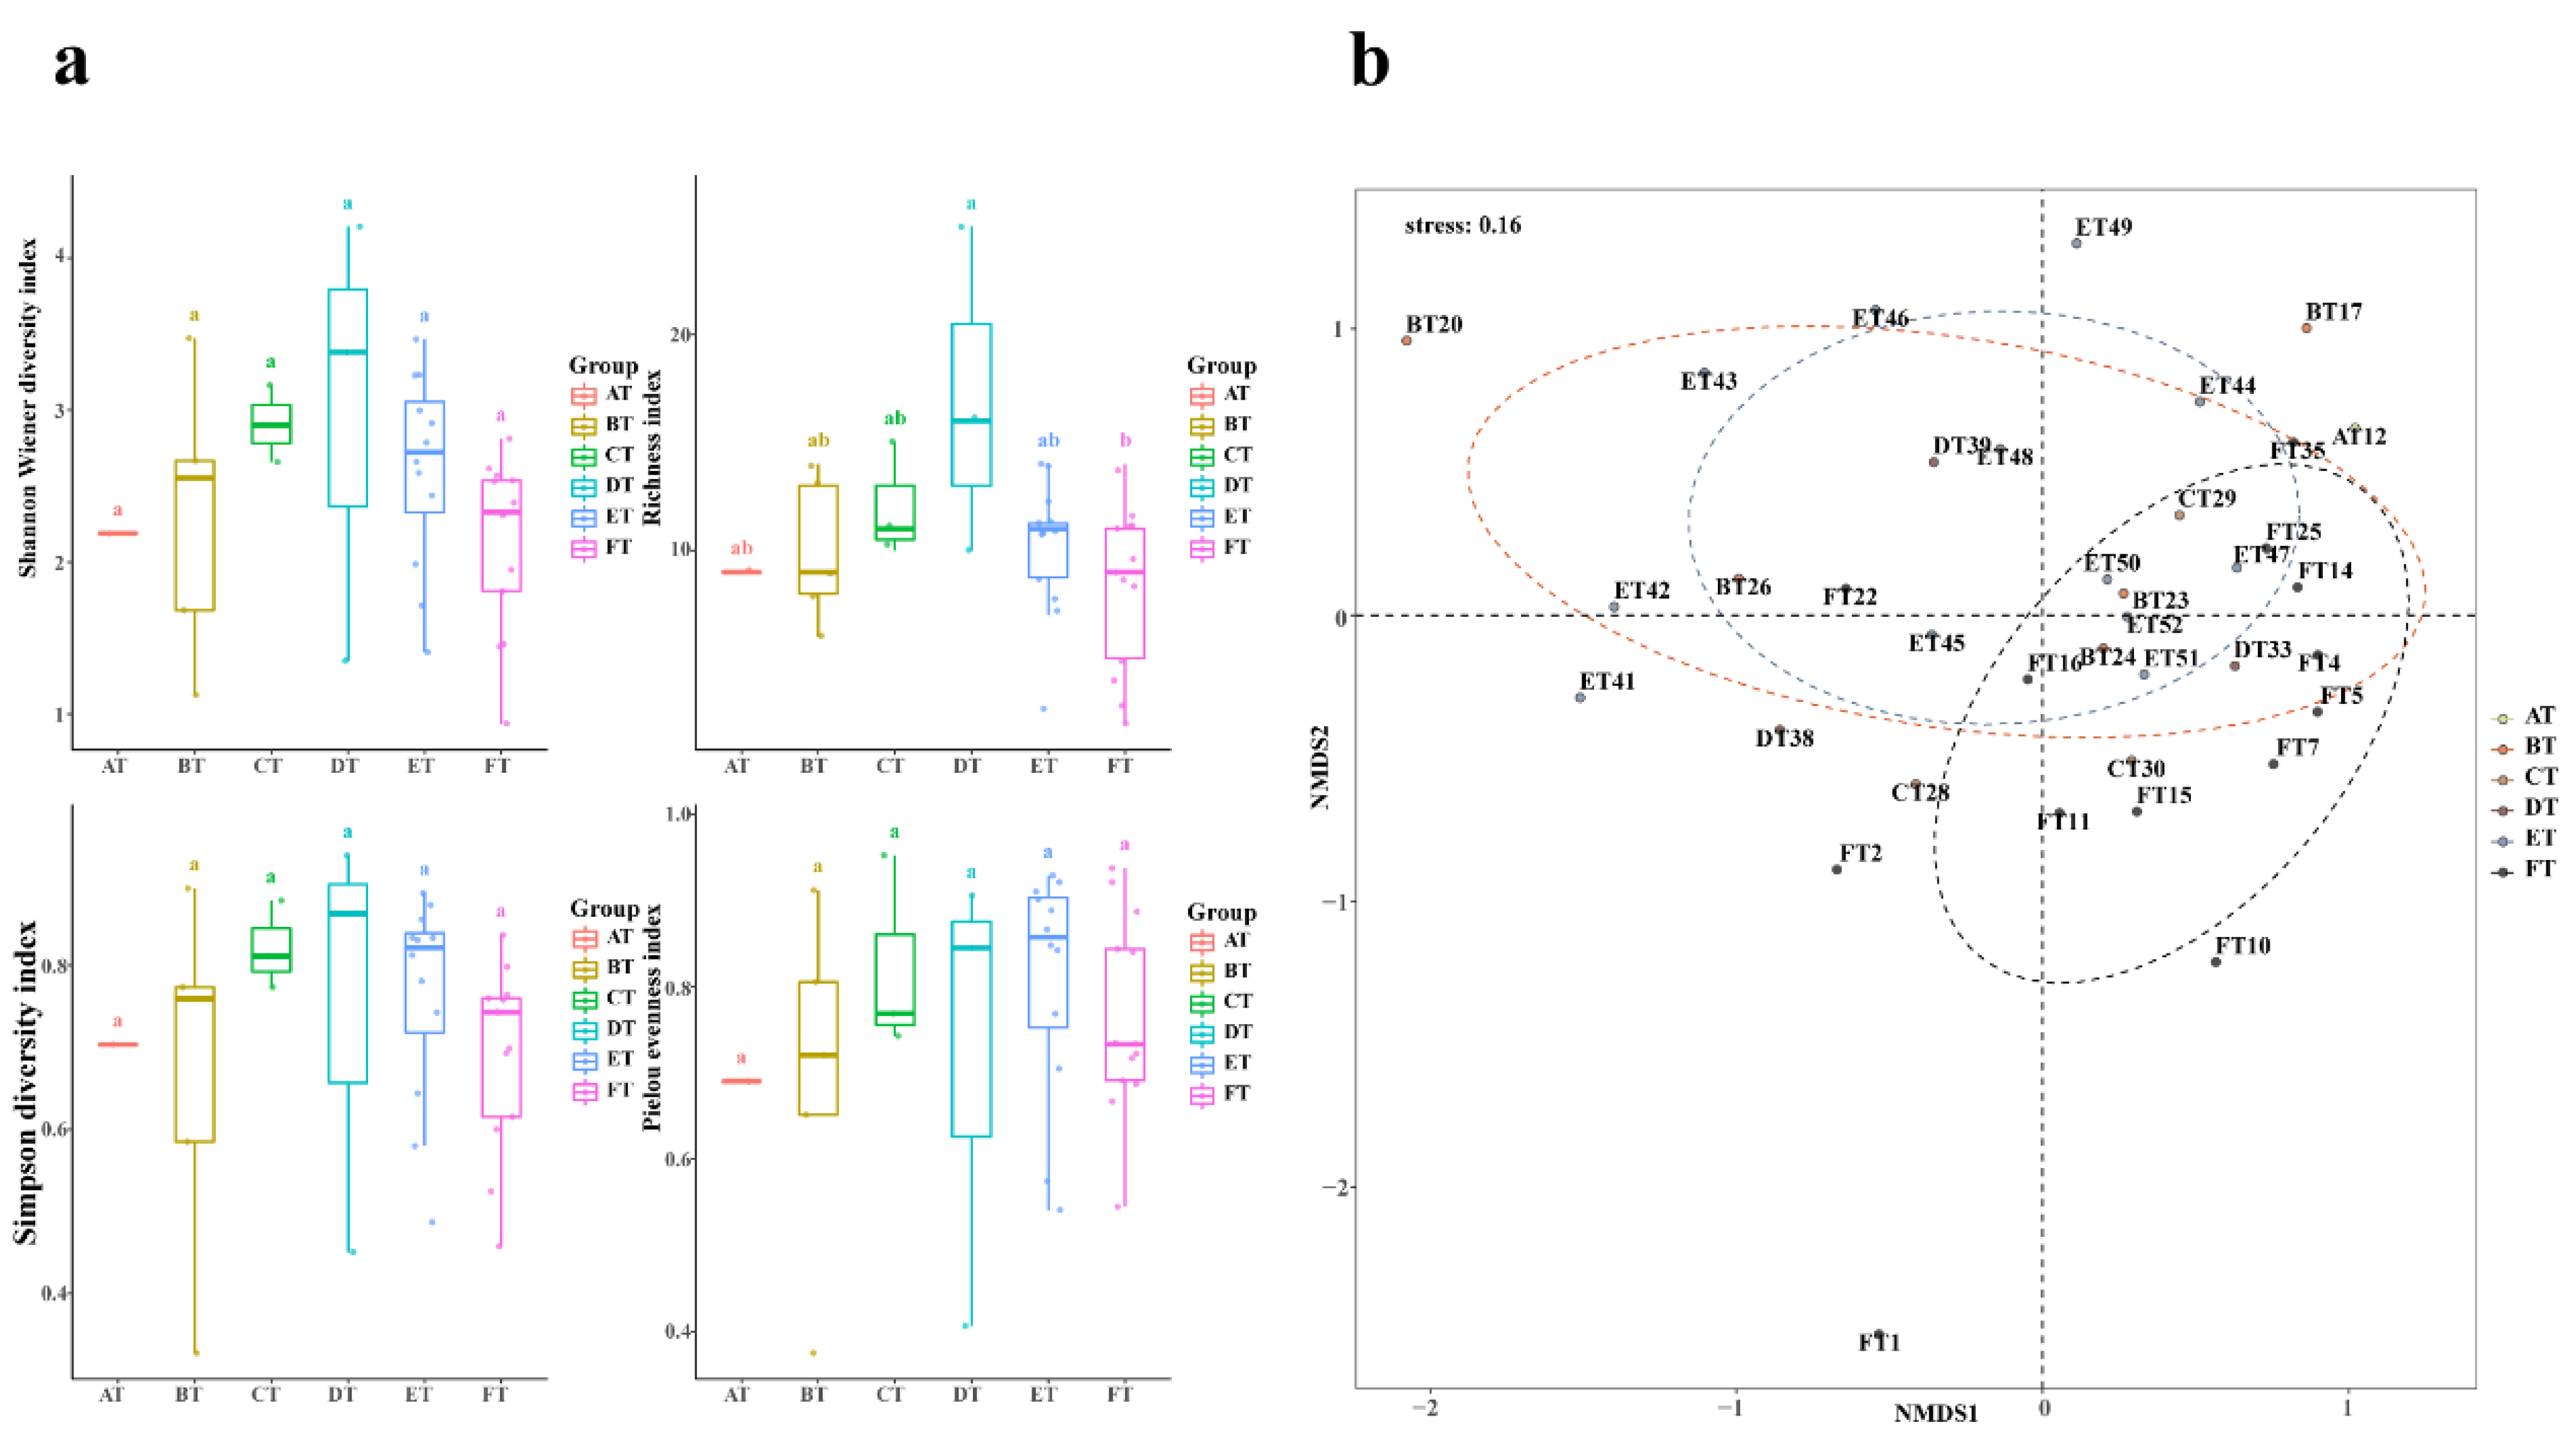
3.2. Spatiotemporal Patterns of Fish Alpha Diversity

The Shannon–Wiener index of the Chishui River differed significantly between upstream and downstream regions (Figure 3a), with the downstream index being higher than the upstream index (p < 0.05). However, there was no statistically significant difference in the richness index. Community composition also varied between the upstream and downstream regions (PerMANOVA = 0.86, p < 0.05; Figure 3b), but the difference between the middle and adjacent reaches was not significant.
A variance analysis of the diversity index and community analyses of the mainstreams and tributaries was also conducted. There were no significant differences between the groups. We further analyzed the differences in diversity in the upper, middle, and downstream tributaries. The Shannon–Wiener and richness indices of the upstream tributaries were significantly higher than those of the downstream tributaries (p < 0.05; Figure 4a). We also observed significant differences in the community composition between the upstream and downstream tributaries (PerMANOVA = 0.72, p < 0.05; Figure 4b). The midstream tributaries show partial similarities to both the upstream and downstream tributaries.
We also explored the specific diversity and community differences among the identified tributaries by conducting a grouping ANOVA and community analysis. The results showed that the richness index of the Datong River was significantly higher than that of the other tributaries (p < 0.05; indicating that it had the highest level of species diversity among all tributaries. Fish community analysis showed no significant differences between the secondary and fifth tributaries (Figure 5b).

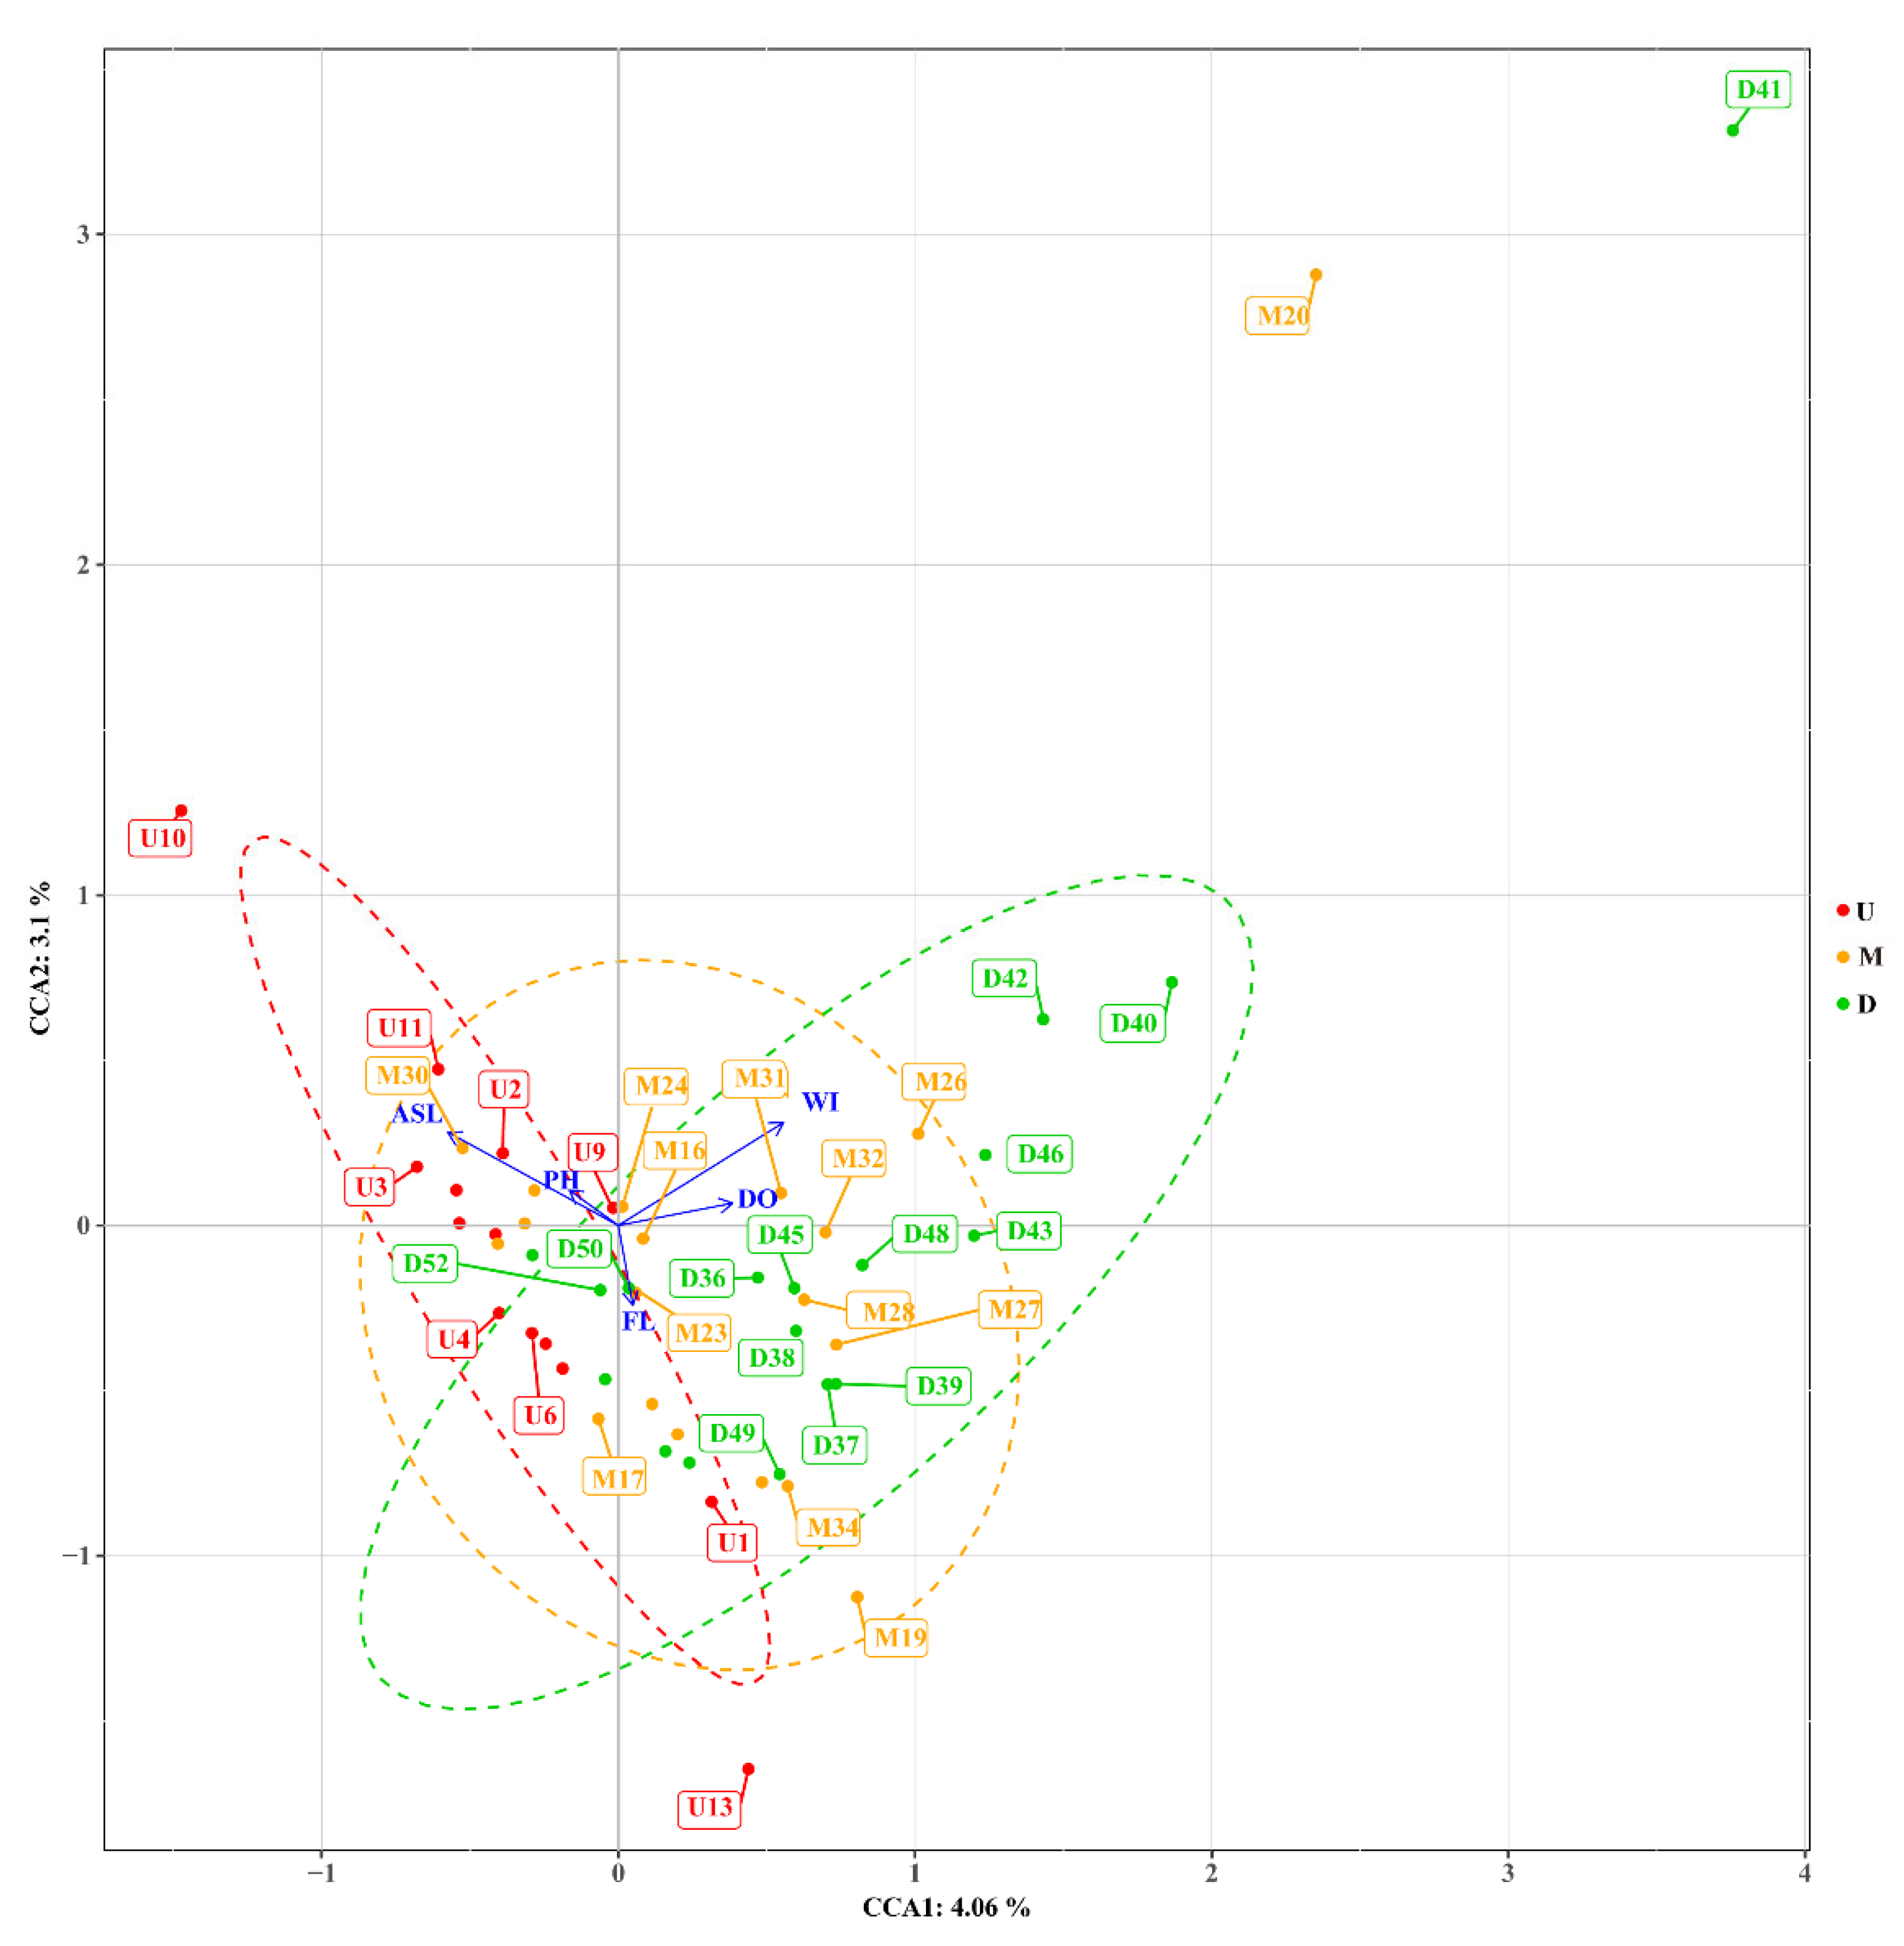
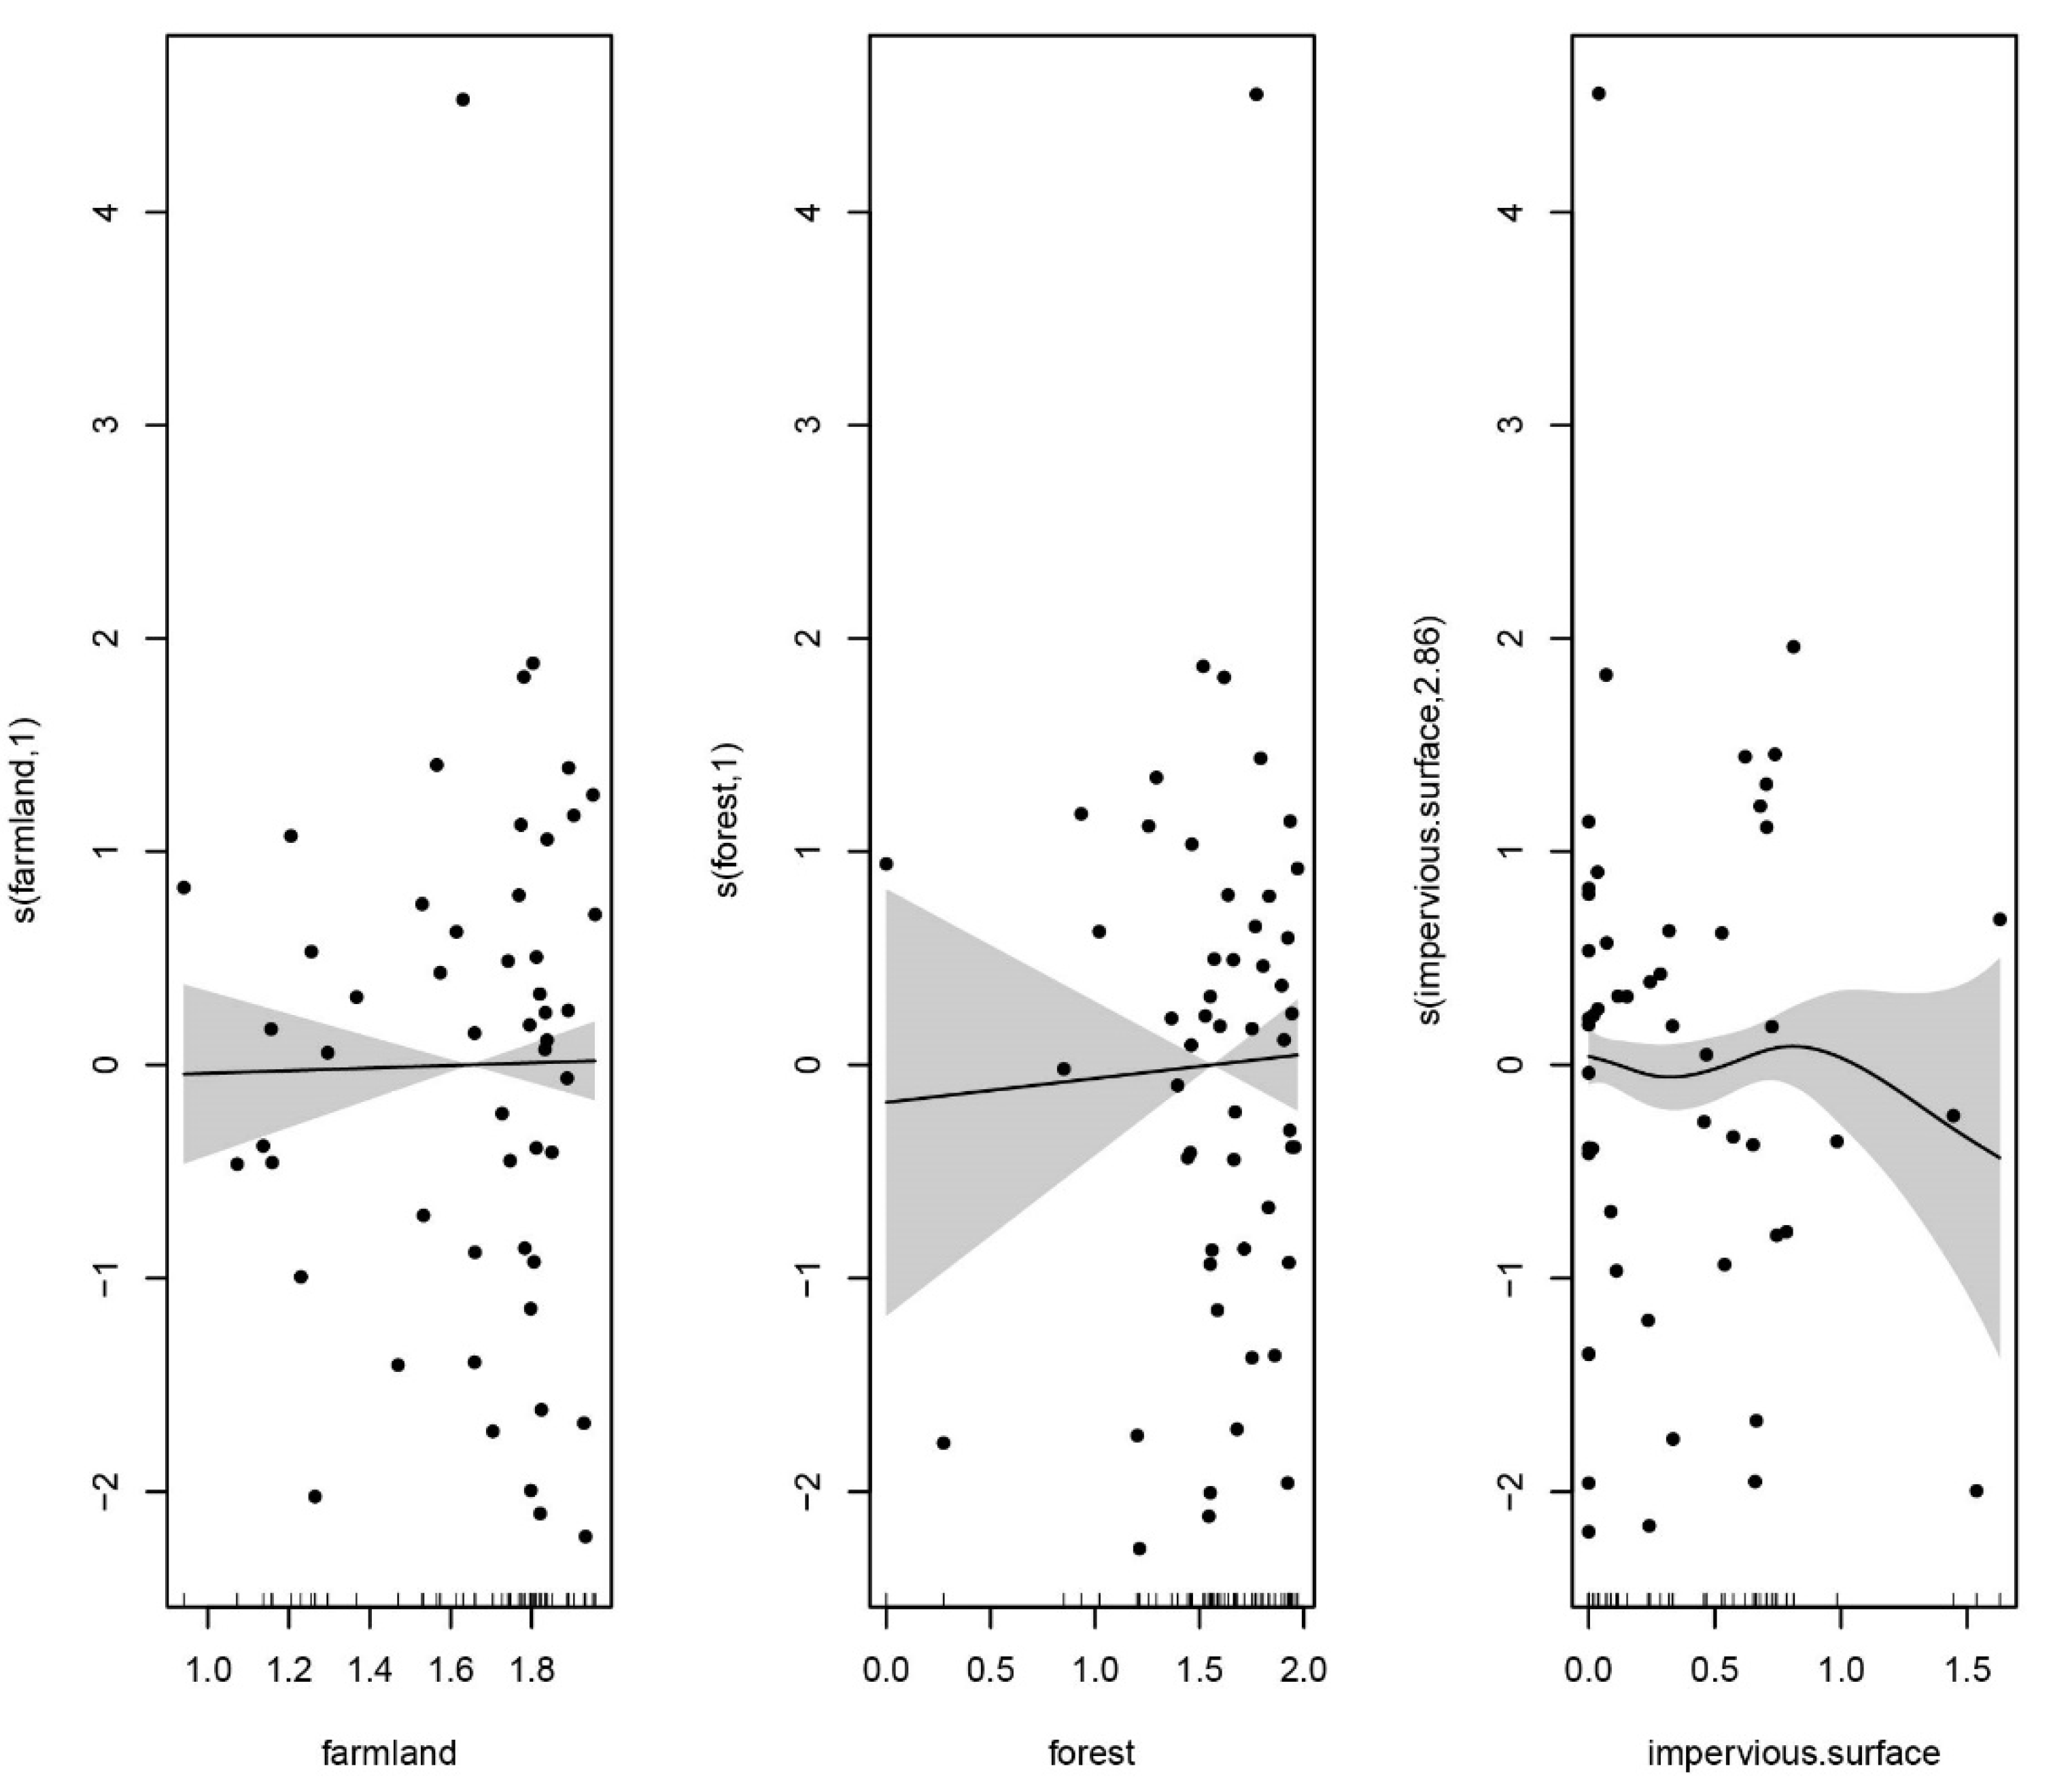
3.3. Fish Diversity Responds to Environmental Variables and Anthropogenic Activities

The CCA results showed that the explanatory variance was 4.06% (p = 0.001) for the first axis and 3.1% (p = 0.004) for the second axis. These results indicate that the first axis significantly separated the environmental variables from different groups based on fish communities (Figure 6).
Pearson correlation of the environmental variables and species richness index was analyzed. The results showed a significant positive correlation between water temperature (TE) and fish richness (p = 0.027; Figure 7). However, there was a significant negative correlation between altitude (ASL), electrical conductivity (EC), and fish species richness (p = 0.0018 and p = 0.0081, respectively). Specifically, GAM results showed that fish species richness was higher at lower impervious area percentages, but the increase was not significant (Figure 8).

4. Discussion

Nondestructive technical monitoring and investigations are gaining increasing attention [8]. This is especially important in watersheds with a high concentration of rare fish species [16], where disturbance and damage to fish communities must be considered [7], and high costs may be incurred [19]. The Chishui River Basin has implemented a 10-year fishing ban that has been in place for 4 years [20]. Although fish diversity monitoring studies in the basin have continued by Liu et al. [21], traditional survey methods have been used by Liu et al. [10], and the impact of human activities on fish after the ban has not been assessed by Yu et al. [20]. Because fish diversity data are only available through a single method, fish conservation efforts in the Chishui River Basin may be limited. We found that the fish diversity by eDNA were consistent with traditional survey methods, and we demonstrated that human activities in the basin have a lower impact on fish. This study highlights the potential benefits of using nondestructive monitoring methods for fish conservation and biodiversity surveys, particularly in areas with rare fish species.

4.1. Compared with Previous Studies

4.1.1. Comparison with Traditional Survey Records

In this study, a total of 77 species of fish belonging to six orders, 18 families, 62 genera, and 12 species were detected. Compared with the 143 species of fish in the Chishui River recorded in the literature by Liu et al. [10], 46% of the fish were not detected. Analysis shows that the main reasons for the above situation are as follows. First, the sampling intensity differs significantly from previous research. Compared with the fish survey sampling of Liu et al. [10] conducted once every 2 years in spring and autumn during 2007–2019, this study detected 54% of its species with a sampling frequency of 10%, and the detection efficiency is acceptable. We also realize that in subsequent surveys in this area, the sampling frequency of environmental DNA should be increased the probability of fish detection. Second, the database problem of eDNA comparison annotation. The data comparison in this study comes from the public databases of MitoFish and NCBI. Due to policy reasons, we failed to catch specimens synchronously for local species database construction, which may lead to some missing data. We believe that in future fish surveys, traditional methods should be combined to verify the results. Specimens can be collected to establish a local library and gradually improve the future eDNA library. Third, eDNA technology itself has limitations. The generation and degradation rate of eDNA are easily affected by many environmental factors such as water temperature, pH, flow rate, ultraviolet light, and bottom sediment of the water [22]. In this survey, three samples showed poor results after amplification and only met the sequencing requirements after magnetic bead optimization. We believe that this difference may be closely related to the environment of the sampling point [23,24].

4.1.2. Consistency with Traditional Surveys

Our results showed that Cypriniformes, Siluriformes, and Perciformes were the dominant orders, which is consistent with previous studies [11]. In addition, our results showed that Cyprinidae, Carpidae, and Mugilidae were the dominant families in the Chishui River, which is consistent with earlier studies by Liu et al. [10].

4.1.3. New Record Species Detected by eDNA Method

For a research method different from traditional surveys, the newly recorded species usually need to be paid attention to and discussed in detail. The five new species detected in this study include Acipenser sinensis, Schizothorax prenanti, Euchiloglanis davidi, Rhynchocypris lagowskii, and Cirrhinus molitorella. Acipenser sinensis is a migratory fish [25] that was once commonly found in the Yangtze River Basin. In the present study, we detected 142 OTUs of A. sinensis near a river estuary. Although Chinese sturgeons are known to be released and bred in the upper reaches of the Yangtze River, the presence of Acipenser sinensis in the Chishui River is likely due to human influence rather than a wild population [26]. Schizothorax prenanti, another new fish species found in the Chishui River, is typically distributed in the upper reaches of the Yangtze, Guizhou, and Sichuan Rivers. We believe that its presence in the Chishui River is due to its occurrence in the surrounding areas. Euchiloglanis davidi, Rhynchocypris lagowskii, and Cirrhinus molitorella were also identified. These fish species were confirmed through interviews with local fish experts as individual catches were reported in the area.

4.1.4. Alien Species

Seven alien species were identified: Ictalurus punctatus, Clarias gariepinus, Gambusia affinis, Rhynchocypris oxycephalus, Barbatula nuda, Cirrhinus molitorella, and Micropterus salmoides. Among them, Ictalurus punctatus, Clarias gariepinus, and Gambusia affinis are recorded in Liu et al. [10]. Rhynchocypris oxycephalus is recorded in Tang et al. [27], and Cirrhinus molitorella is recorded in the research of Du et al. [28]. A review of historical documents revealed that Barbatula nuda and Micropterus salmoides are previously unrecorded alien species.
In the study by Tang et al., in addition to the Rhynchocypris oxycephalus being artificially introduced from the north, records of Barbatula toni were also found in the Chishui River Basin. Strangely, we only detected Barbatula nuda in the samples from the Chishui River, but did not find the sequence of Barbatula toni. In this regard, we conducted in-depth discussions and believed that there was a possibility of false positives for this species, but because the number of sequences of Barbatula nuda in DNA analysis was as high as 1557, this proved that the possibility of false positives was very low. We are more inclined to believe that this species was accidentally brought into the Chishui River Basin during the introduction of the Rhynchocypris oxycephalus, similar to the situation of Barbatula toni.
The Micropterus salmoides is a carnivorous fish with a wide diet and rapid growth. It mainly feeds on aquatic insects and small fish. Under certain conditions, it may pose a greater threat to rare young fish or other fish. However, we believe that based on the sequence reading level of this species, the Micropterus salmoides may not have formed a stable population in the Chishui River. It is likely that it is a small number of individuals that have escaped from nearby artificial breeding. Because the Micropterus salmoides is an economically edible fish, there is artificial breeding in the Chishui River basin. Since the Chishui River basin is rich in rare fish, we believe that the intensity of monitoring should be strengthened for this carnivorous fish to avoid it from causing damage to local fish that exceeds the carrying capacity.

4.2. Thoughts on the Spatial Distribution Pattern and Driving Factors of Fish Species in the Chishui River

4.2.1. Comparison of Different Spatial Fish Communities

Noticeable differences were observed in the fish species composition between the upper and lower reaches of the Chishui River Basin, as shown in Figure 2b. However, no significant differences were observed between upstream and downstream reach. Nonetheless, there were significant differences between the upstream and downstream tributaries, indicating that disparities between the upstream and downstream tributaries could be attributed to the fish communities in the tributaries. Studies have revealed that fish diversity is associated with river area [29] and habitat heterogeneity [30]. Therefore, habitat heterogeneity may be a more influential factor for community differences. Furthermore, in the comparison of transverse gradients, it was discovered that the DaTong River exhibited the highest level of α diversity among all tributaries. This finding differs from the results of traditional survey studies conducted at the same position on the Xishui River by Liu et al. [11]. We believe that the topography and hydrological conditions of the DaTong River tend to impede traditional surveys, leading to an underestimation of tributary diversity. Conversely, the gentle flow speed and easy accessibility of the Xishui River facilitated a tributary survey which was more comprehensive. Therefore, the status of the DaTong River should be elevated to the same level as that of the Xishui River.
It is worth noting that the Shannon–Wiener diversity index may be inaccurate when used alone in highly diverse communities. It will be affected by the number of rare species and produce large deviations [31]. Some studies have suggested that communities with too high a number of species should not use the Shannon–Wiener diversity index, and the effective number of species can be introduced for calculation [32]. In current fish studies, most of the differences in fish communities are analyzed through multi-dimensional comparisons. This study used α-diversity index and β-diversity analysis such as Bray–Curtis distance to jointly analyze the differences in fish communities in the Chishui River. The number of fish species in each section of the Chishui River was 38, 45, and 54, and the diversity level was not highly diverse.

4.2.2. Fish Diversity Responds to Environmental Variables and Anthropogenic Activities

In this study, we found that changes in distribution and diversity in the Chishui River Basin were predominantly influenced by environmental factors. The results of our CCA showed that altitude had a significant impact on upstream fish richness, resulting in a significant decrease in fish species richness with increasing altitude. Similarly, conductivity significantly affected downstream fish richness [16]. Our findings demonstrated a significant decrease in fish species richness with increasing conductivity. Previous studies have highlighted the importance of these two factors in affecting fish species richness. The altitude difference between the upper and lower reaches of the Chishui River can reach 1180 m, leading to changes in water temperature and flow rate. These changes resulted in noticeable differences in upstream, middle, and downstream fish habitats, leading to variations in fish species composition. The species composition of fish showed some differences. For example, fish species that adapt to the rapid cold-water environment, such as the Sinocrosssocheilus labiatus, were almost only found in the upper reaches of the basin in this study. The water flow velocity in the upper reaches of the Chishui River is the fastest in the basin, and due to the altitude, the water temperature in the upper reaches is at a medium-low level in the basin, so Sinocrosssocheilus labiatus almost only exists in the upper reaches.
Human activity in the downstream basin is more intensive than in the upstream reaches. As a result, most fish are intolerant of this environment [33], leading to a decrease in fish species. However, tolerant fish species, such as Zacco platypus, have shown an increase in population numbers [34,35]. In summary, our research showed that environmental factors such as altitude and conductivity play a significant role in the distribution and diversity of fish species in the Chishui River Basin.
This study found that the impact of anthropogenic activities, specifically the use of land, on the study area was not significant. Based on our analysis, we believe that this result can only be considered valid under the assumption that the intensity of anthropogenic activity in the Chishui River Basin has not yet reached the threshold affecting fish diversity. Additionally, human influencing factors, such as fishing intensity, disappeared after the implementation of the fishing ban. This policy has led to fish in the Chishui River Basin being primarily affected by environmental factors, which is similar to the natural succession stage and conducive to the community reconstruction process [11]. In summary, the results of this study suggest that the current environmental conditions in the Chishui River Basin are favorable for community reconstruction.

4.3. Limitations and Prospects

Fish Survey Limitations Based on eDNA Methods

Although the eDNA method has had a significant impact on the field of ecology, it faces some limitations as a developing science [36]. One area of contention is whether the number of sequences obtained through eDNA analysis can be used as a proxy for the number of species identified in traditional surveys [22,37]. This is a crucial consideration because the accuracy of the eDNA data relies on this assumption. Another challenge is the reliability and accuracy of the species comparison databases used in eDNA studies. The credibility of the new records generated using this method is directly related to the quality of the database. While eDNA metabarcoding enables efficient species detection, its inherent limitations warrant attention: (1) inability to discriminate between living organisms and relic DNA; (2) potential detection biases due to reference database completeness, DNA degradation rates, and PCR primer specificity. Another study on fish diversity conducted in the Chongqing section of the Yangtze River using eDNA also found some species missing compared to traditional methods [38]. However, the eDNA method alone cannot verify the accuracy of this database, which can affect the scientific rigor and reliability of the results. Finally, there is the issue of whether eDNA results accurately reflect the fish species present at the sample site. DNA can originate from organisms located several kilometers away, which can lead to erroneous results [37]. This raises concerns about the representativeness of the eDNA data and underscores the importance of careful sampling.
In future research, considering the essential differences between eDNA and traditional methods, the two methods should be combined in the current fish research. eDNA technology is in a stage of rapid development and application, and the operation and indicators of the technology are still being improved, such as the selection of filter membranes in different water environments, the selection of sampling time, and the conditions for sample processing and amplification. Different scholars are using different specifications for research, which may result in different results in the same research area.

5. Conclusions

Aquatic biodiversity surveys are increasingly adopting fast and nondestructive eDNA methods. This study aimed to demonstrate the diversity and endemicity of fish in the Chishui River by identifying 77 fish species at 52 sites. Fish assemblages in the river displayed significant variation along its longitudinal gradient, with notable differences between the upstream and downstream areas. The driving factors behind this phenomenon were analyzed, indicating that the flow rate and altitude were the most significant environmental factors. In contrast, no significant negative anthropogenic signals were detected at current spatiotemporal scales, though long-term monitoring is required to validate this trend’s universality. Overall, this study highlights the feasibility of using eDNA methods to investigate the Chishui River Basin and provides reference practices for the environmental management and protection of fish resources in the upper reaches of the Yangtze River. Management departments can carry out non-destructive fish monitoring and obtain monitoring data according to the methods of this study in routine monitoring work. At the same time, we propose a new fish focus area, namely Datong River, which should be given more attention.

Author Contributions

Conceptualization, N.X.; Data curation, M.S.; Formal analysis, X.S.; Funding acquisition, N.X. and J.L.; Investigation, J.W.; Methodology, X.G. and J.L.; Project administration, N.X.; Software, J.W.; Supervision, N.X.; Validation, X.S.; Writing—original draft, N.G. All authors have read and agreed to the published version of the manuscript.

Funding

This study was financially supported by the Biodiversity Survey and Assessment Project of the Ministry of Ecology and Environment, China (Grant Number 2019HJ2096001006).

Institutional Review Board Statement

Not applicable.

Informed Consent Statement

Not applicable.

Data Availability Statement

Raw sequence data and information on nucleotide tagging have been deposited the NCBI repository, Accession number is PRJNA999606.

Conflicts of Interest

The authors declare no competing interests.

References

  1. Reid, A.J.; Carlson, A.P.; Creed, I.F.; Eliason, E.J.; Gell, P.; Johnson, P.T.J.; Kidd, K.A.; MacCormack, T.J.; Olden, J.D.; Ormerod, S.J.; et al. Emerging threats and persistent conservation challenges for freshwater biodiversity. Biol. Rev. 2018, 94, 849–873. [Google Scholar] [CrossRef] [PubMed]
  2. Cooke, S.J.; Twardek, W.M.; Lynch, A.J.; Cowx, I.G.; Olden, J.D.; Funge-smith, S.; Lorenzen, K.; Arlinghaus, R.; Chen, Y.; Weyl, O.L.F.; et al. A global perspective on the influence of the COVID-19 pandemic on freshwater fish biodiversity. Biol. Conserv. 2021, 253, 108932. [Google Scholar] [CrossRef]
  3. Tickner, D.; Opperman, J.J.; Abell, R.; Acreman, M.; Arthington, A.; Bunn, S.E.; Cooke, S.J.; Dalton, J.T.; Darwall, W.; Edwards, G.L.; et al. Bending the curve of global freshwater biodiversity loss: An emergency recovery plan. BioScience 2020, 70, 330–342. [Google Scholar] [CrossRef] [PubMed]
  4. Dias, M.S.; Tedesco, P.A.; Hugueny, B.; Jézéquel, C.; Beauchard, O.; Brosse, S.; Oberdorff, T. Anthropogenic stressors and riverine fish extinctions. Ecol. Indic. 2017, 79, 37–46. [Google Scholar] [CrossRef]
  5. Harrison, I.; Abell, R.; Darwall, W.; Thieme, M.; Tickner, D.; Timboe, I.A. The freshwater biodiversity crisis. Science 2018, 362, 1369. [Google Scholar] [CrossRef]
  6. Villéger, S.; Brosse, S.; Mouchet, M.; Mouillot, D.; Vanni, M.J. Functional ecology of fish: Current approaches and future challenges. Aquat. Sci. 2017, 79, 783–801. [Google Scholar] [CrossRef]
  7. Su, G.; Logez, M.; Xu, J.; He, S.; Villéger, S.; Brosse, S. Human impacts on global freshwater fish biodiversity. Science 2021, 371, 835–838. [Google Scholar] [CrossRef] [PubMed]
  8. Weigand, H.; Beermann, A.J.; Čiampor, F.; Costa, F.O.; Csabai, Z.; Duarte, S.; Geiger, M.F.; Grabowski, M.; Rimet, F.; Rulik, B.; et al. DNA barcode reference libraries for the monitoring of aquatic biota in Europe: Gap-analysis and recommendations for future work. Sci. Total Environ. 2019, 678, 499–524. [Google Scholar] [CrossRef] [PubMed]
  9. Zhang, H.; Jarić, I.; Roberts, D.L.; He, Y.; Du, H.; Wu, J.; Wang, C.; Wei, Q. Extinction of one of the world’s largest freshwater fishes: Lessons for conserving the endangered Yangtze fauna. Sci. Total Environ. 2020, 710, 136–242. [Google Scholar] [CrossRef]
  10. Liu, F.; Yu, F.; Xia, Z.; Qiang, Q.; Xu, C.; Wang, J.; Liu, H. Changes in fish assemblages following the implementation of a complete fishing closure in the Chishui River. Fish. Res. 2021, 243, 106099. [Google Scholar] [CrossRef]
  11. Liu, F.; Wang, J.; Zhang, F.; Liu, H.; Wang, J. Spatial organisation of fish assemblages in the Chishui River, the last free-flowing tributary of the upper Yangtze River, China. Ecol. Freshw. Fish 2020, 30, 48–60. [Google Scholar] [CrossRef]
  12. Collen, B.; Whitton, F.; Dyer, E.E.; Baillie, J.E.; Cumberlidge, N.; Darwall, W.R.; Pollock, C.; Richman, N.I.; Soulsby, A.M.; Böhm, M. Global patterns of freshwater species diversity, threat and endemism. Glob. Ecol. Biogeogr. J. Macroecol. 2014, 23, 40–51. [Google Scholar] [CrossRef]
  13. Henriques, S.; Guilhaumon, F.; Villéger, S.; Amoroso, S.; França, S.; Pasquaud, S.; Cabral, H.N.; Vasconcelos, R.P. Biogeographical region and environmental conditions drive functional traits of estuarine fish assemblages worldwide. Fish Fish. 2017, 18, 752–771. [Google Scholar] [CrossRef]
  14. Xiong, W.C.; Sui, X.; Liang, S.; Chen, Y. Non-native freshwater fish species in China. Rev. Fish Biol. Fish. 2015, 25, 651–687. [Google Scholar] [CrossRef]
  15. Geist, J.; Hawkins, S.J. Habitat recovery and restoration in aquatic ecosystems: Current progress and future challenges. Aquat. Conserv.-Mar. Freshw. Ecosyst. 2016, 26, 942–962. [Google Scholar] [CrossRef]
  16. Chen, Y.; Qu, X.; Xiong, F.; Lu, Y.; Wang, L.; Hughes, R.M. Challenges to saving China’s freshwater biodiversity: Fishery exploitation and landscape pressures. Ambio 2020, 49, 926–938. [Google Scholar] [CrossRef] [PubMed]
  17. Wu, J.M.; Zhao, H.T.; Miao, Z.G.; Chen, Y.X.; Zhang, F.T.; Wang, J.W. Status and conservation of fish resources in the Chishui River. Biodivers. Sci. 2010, 18, 162–172. (In Chinese) [Google Scholar] [CrossRef]
  18. Venter, O.; Sanderson, E.W.; Magrach, A.; Allan, J.; Beher, J.; Jones, K.R.; Possingham, H.P.; Laurance, W.F.; Wood, P.R.; Fekete, B.M.; et al. Global terrestrial Human Footprint maps for 1993 and 2009. Sci. Data 2016, 3, 1–10. [Google Scholar] [CrossRef]
  19. Zhang, Q.; Hou, J.; Yang, J.; Liao, W.J.; Lu, J.C.; He, X.G. Captive density on growth performance and health status of Largemouth Bass (Micropterus Salmoides). Acta Hydrobiol. Sin. 2022, 46, 671–678. (In Chinese) [Google Scholar] [CrossRef]
  20. Yu, F.; Liu, F.; Xia, Z.; Xu, C.; Wang, J.; Tang, R.; Ai, Z.; Zhang, Y.; Hou, M.; Zou, X. Integration of ABC curve, three dimensions of alpha diversity indices, and spatial patterns of fish assemblages into the health assessment of the Chishui River basin, China. Environ. Sci. Pollut. Res. 2022, 29, 75057–75071. [Google Scholar] [CrossRef]
  21. Liu, F.; Lin, P.-C.; Li, M.-Z.; Gao, X.; Wang, C.-L.; Liu, H.-Z. Situations and conservation strategies of fish resources in the Yangtze River basin. Acta Hydrobiol. Sin. 2019, 43, 144–156. [Google Scholar] [CrossRef]
  22. Strickler, K.M.; Fremier, A.K.; Goldberg, C.S. Quantifying effects of UV-B, temperature, and pH on eDNA degradation in aquatic microcosms. Biol. Conserv. 2015, 183, 85–92. [Google Scholar] [CrossRef]
  23. Barnes, M.A.; Turner, C.R.; Jerde, C.L.; Renshaw, M.A.; Chadderton, W.L.; Lodge, D.M. Environmental Conditions Influence eDNA Persistence in Aquatic Systems. Environ. Sci. Technol. 2014, 48, 819–1827. [Google Scholar] [CrossRef] [PubMed]
  24. Pilliod, D.S.; Goldberg, C.S.; Arkle, R.S.; Waits, L.P. Factors influencing detection of eDNA from a stream-dwelling amphibian. Mol. Ecol. Resour. 2014, 14, 109–116. [Google Scholar] [CrossRef]
  25. Boscari, E.; Wu, J.; Jiang, T.; Zhang, S.; Cattelan, S.; Wang, C.; Du, H.; Li, C.; Li, J.; Ruan, R.; et al. The last giants of the Yangtze River: A multidisciplinary picture of what remains of the endemic Chinese sturgeon. Sci. Total Environ. 2022, 843, 157011. [Google Scholar] [CrossRef]
  26. Yang, H.L.; Shen, L.; He, Y.F.; Tian, H.W.; Gao, L.; Wu, J.M.; Wei, Q.W. Status of aquatic organisms resources and their environments in the Yangtze River system (2017–2021). Aquaculture and Fisheries 2023, 47, 3–30. (In Chinese) [Google Scholar] [CrossRef]
  27. Tang, R.; Dai, Y.X.; Liu, H.Z.; Ai, Z.-J.; Ouyang, D.D.; Peng, Y.; Tang, Y.; Yu, D. Analysis of introduction source and ecological adaptability of exotic fishes Rhynchocypris oxycephalus and Barbatula toni in Chishui River. Chin. J. Zool. 2021, 56, 214–228. (In Chinese) [Google Scholar] [CrossRef]
  28. Du, H.J.; Jiang, W.; Tang, X.L. Discussion on the possibility of mud carp (Cirrhinus molitorella) invasion to the Yangtze river. Resour. Environ. Yangtze Basin 2012, 21, 30–34. (In Chinese) [Google Scholar]
  29. Oberdorff, T.; Dias, M.S.; Jézéquel, C.; Albert, J.S.; Arantes, C.C.; Bigorne, R.; Carvajal-Vallejos, F.M.; De Wever, A.; Frederico, R.G.; Hidalgo, M.; et al. Unexpected fish diversity gradients in the Amazon basin. Sci. Adv. 2019, 5, eaav8681. [Google Scholar] [CrossRef]
  30. Hugueny, B.; Movellan, A.; Belliard, J. Habitat fragmentation and extinction rates within freshwater fish communities: A faunal relaxation approach. Glob. Ecol. Biogeogr. 2010, 20, 449–463. [Google Scholar] [CrossRef]
  31. Jost, L. Entropy and diversity. Oikos 2006, 113, 363–375. [Google Scholar] [CrossRef]
  32. Morris, E.K.; Caruso, T.; Buscot, F.; Fischer, M.; Hancock, C.; Maier, T.S.; Rillig, M.C. Choosing and using diversity indices: Insights for ecological applications from the German Biodiversity Exploratories. Ecol. Evol. 2014, 4, 3514–3524. [Google Scholar] [CrossRef] [PubMed]
  33. Bertora, A.; Grosman, F.; Sanzano, P.; Rosso, J.J. Fish assemblage structure in a Neotropical urbanized prairie stream exposed to multiple natural and anthropic factors. Ecol. Freshw. Fish 2022, 31, 224–242. [Google Scholar] [CrossRef]
  34. Yeom, D.; Lee, S.W.; Kang, G.; Seo, J.; Lee, S. Stressor identification and health assessment of fish exposed to wastewater effluents in Miho Stream, South Korea. Chemosphere 2007, 67, 2282–2292. [Google Scholar] [CrossRef] [PubMed]
  35. Morosawa, T. Hypoxia tolerance of three native and three alien species of bitterling inhabiting Lake Kasumigaura, Japan. Environ. Biol. Fishes 2011, 91, 145–153. [Google Scholar] [CrossRef]
  36. Goldberg, C.S.; Turner, C.J.; Deiner, K.; Klymus, K.E.; Thomsen, P.F.; Murphy, M.J.; Spear, S.E.; McKee, A.M.; Oyler-McCance, S.J.; Cornman, R.S.; et al. Critical considerations for the application of environmental DNA methods to detect aquatic species. Methods Ecol. Evol. 2016, 7, 1299–1307. [Google Scholar] [CrossRef]
  37. Deiner, K.; Fronhofer, E.A.; Mächler, E.; Walser, J.C.; Altermatt, F. Environmental DNA reveals that rivers are conveyer belts of biodiversity information. Nat. Commun. 2016, 7, 12544. [Google Scholar] [CrossRef]
  38. Wang, M.; Yang, X.; Wang, W.; Duan, C.; Liu, Z.H.; Chen, Q.L.; Shen, Y.J. Fish diversity in Chongqing section of the national nature reserve for rare and endemic fish in the upper Yangtze river based on eDNA technology. Acta Hydrobiol. Sin. 2022, 46, 2–16. (In Chinese) [Google Scholar] [CrossRef]
Figure 1. Fish sampling locations in the Chishui River Basin.
Sustainability 17 04922 g001
Figure 2. Fish composition in the upper, middle, and downstream reaches of the Chishui River Basin. (a) The number of fish species in different river segments. (b) The composition of fish families in different river segments.
Sustainability 17 04922 g002
Figure 3. Differences in fish communities and comparison of biodiversity in different reaches of the Chishui River. (a) Biodiversity indices of the upper (U), middle (M), and downstream (D) regions. (b) Differences in fish communities in the Chishui River Basin.
Sustainability 17 04922 g003
Figure 4. Differences in fish communities and biodiversity comparison among tributaries of different sections in the Chishui River Basin. (a) Tributary biodiversity index. (b) Difference in fish communities in the tributaries of the Chishui River Basin. UT: Upstream tributaries, MT: Midstream tributaries, DT: Downstream tributaries.
Sustainability 17 04922 g004
Figure 5. Differences in fish communities and biodiversity among the major and small. (a) The biodiversity indices between groups. (b) Fish community differences between tributaries (AT-FT are denoted: Erdao River, Tongzi River, Gulin River, Datong River, Xishui River, small tributaries).
Sustainability 17 04922 g005
Figure 6. CCA exploring the relationship between species and measured environmental variables.
Sustainability 17 04922 g006
Figure 7. Correlation between fish richness and environmental factors in the Chishui River Basin.
Sustainability 17 04922 g007
Figure 8. GAMs showing the relationship between the proportion of different land use types (farmland, forest, and impervious surface) and fish abundance in the Chishui River Basin.
Sustainability 17 04922 g008
Table 1. The List fish species, distribution, and ecological types of Chishui River.
SpeciesFeeding
Habits
Habit CharacteristicsUpstreamMidstreamDownstreamSequence Number
Acipenseriformes
Acipenseridae
1. Acipenser sinensiscarnivorousbottom ++142
Cypriniformes
Cyprinidae
2. Opsariichthys bidenscarnivorousmiddle and upper class + 495
3. Zacco platypusomnivorousmiddle and lower class+++23,874
4. Ctenopharyngodon idellaherbivorousmiddle and lower class+++1689
5. Rhynchocypris lagowskiiherbivorousmiddle and upper class+ 209
6. Rhynchocypris oxycephaluscarnivorousupper class++ 6295
7. Chanodichthys dabryi dabryicarnivorousmiddle and upper class + 26
8. Culter alburnuscarnivorousmiddle and upper class +18
9. Hemiculter tchangiomnivorousmiddle and lower class +361
10. Hemiculterella sauvageiomnivorousmiddle and upper class+++452
11. Megalobrama pellegriniomnivorousmiddle and lower class +1248
12. Megalobrama skolkoviiomnivorousmiddle and lower class + 201
13. Pseudobrama simoniherbivorousmiddle and lower class +21
14. Xenocypris davidiomnivorousmiddle and lower class+++1016
15. Xenocypris microlepisherbivorousmiddle and lower class ++613
16. Aristichthys nobilisplanktonicmiddle and upper class+ +164
17. Hypophthalmichthys molitrixplanktonicupper class +317
18. Rhodeus ocellatusherbivorousmiddle and upper class+++266
19. Rhodeus sinensisherbivorousmiddle and upper class +248
20. Abbottina rivularisomnivorousbottom+ +631
21. Coreius heterodonomnivorousbottom +13
22. Hemibarbus labeobenthicmiddle and lower class++ 52
23. Hemibarbus maculatesbenthicmiddle and lower class +847
24. Platysmacheilus exiguusomnivorousbottom+++1445
25. Platysmacheilus nudiventriscarnivorousmiddle and lower class+ 62
26. Pseudorasbora parvaomnivorousupper class+++8140
27. Rhinogobio typusomnivorousbottom +133
28. Rhinogobio cylindricusomnivorousbottom +36
29. Saurogobio dabryi dabryiomnivorousbottom ++136
30. Squalidus argentatusomnivorousbottom ++614
31. Carassius auratusomnivorousmiddle class+++1941
32. Cyprinus carpioomnivorousbottom +77
33. Procypris rabaudiomnivorousbottom +90
34. Acrossocheilus monticolaomnivorousupper class+++221
35. Acrossocheilus yunnanensisomnivorousbottom +5246
36. Percocypris pingicarnivorousmiddle and upper class+ 56
37. Spinibarbus sinensisomnivorousmiddle and upper class ++2370
38. Bangana rendahliherbivorousbottom +50
39. Cirrhinus molitorellaherbivorousmiddle and upper class +21
40. Garra imberbaomnivorousbottom++ 686
41. Pseudogyrinocheilus procheilusherbivorousbottom++ 1211
42. Sinocrosssocheilus labiatusherbivorousbottom++ 926
43. Schizothorax kozloviomnivorousbottom + 39
44. Schizothorax prenantiomnivorousbottom+++1799
Nemacheilidae
45. Barbatula nudaomnivorousbottom+ 1557
46. Homatula potaninicarnivorousbottom+ 1761
47. Homatula variegatuscarnivorousbottom+ 17
Cobitidae
48. Misgurnus anguillicaudatusomnivorousbottom+++878
49. Paramisgurnus dabryanusomnivorousbottom++ 153
Botiidae
50. Botia superciliariscarnivorousbottom++ 118
Balitoridae
51. Lepturichthys fimbriataomnivorousbottom ++255
52. Metahomaloptera omeiensis omeiensisomnivorousbottom+ 42
53. Sinogastromyzon sichangensisherbivorousbottom+++13,868
54. Sinogastromyzon szechuanensisherbivorousbottom + 61
Siluriformes
Amblycipitidae
55. Liobagrus marginatuscarnivorousbottom +32
Sisoridae
56. Euchiloglanis davidiomnivorousbottom+ 48
57. Glyptothorax sinensiscarnivorousbottom++ 115
Siluridae
58. Silurus meridionaliscarnivorousbottom ++236
59. Silurus asotuscarnivorousbottom ++364
Clariidae
60. Clarias gariepinusomnivorousbottom +45
Bagridae
61. Hemibagrus macropterusomnivorousbottom ++606
62. Leiocassis crassilabriscarnivorousbottom ++101
63. Leiocassis longirostriscarnivorousbottom +13
64. Pelteobagrus eupogonomnivorousbottom ++292
65. Pelteobagrus fulvidracoomnivorousbottom++ 294
66. Pelteobagrus vachelliicarnivorousbottom +26
67. Pseudobagrus brevicaudatuscarnivorousbottom +125
68. Pseudobagrus truncatusomnivorousbottom +40
69. Pelteobagrus ussuriensiscarnivorousbottom+++6062
Ictaluridae
70. Ictalurus punctatuscarnivorousbottom++ 99
Synbranchiformes
Synbranchidae
71. Monopterus albuscarnivorousbottom +16
Perciformes
Percichthyidae
72. Siniperca chuatsicarnivorousbottom ++468
Odontobutidae
73. Odontobutis potamophilacarnivorousupper class +12
Gobiidae
74. Rhinogobius cliffordpopeicarnivorousbottom ++312
75. Rhinogobius similiscarnivorousbottom+++2348
Centrarchidae
76. Micropterus salmoidescarnivorousmiddle and lower class +899
Cyprinodontiformes
Poeciliidae
77. Gambusia affinisomnivorousupper class+++271
﹡ for exotic species and ★ for fish endemic to the upper reaches of the Yangtze River.
Disclaimer/Publisher’s Note: The statements, opinions and data contained in all publications are solely those of the individual author(s) and contributor(s) and not of MDPI and/or the editor(s). MDPI and/or the editor(s) disclaim responsibility for any injury to people or property resulting from any ideas, methods, instructions or products referred to in the content.

