Article

Balancing Industrialization with Pollution: Evidence from the Marine Ecological Civilization Demonstration Zone Program in China

School of Business, Macau University of Science and Technology, Macao, China
*
Author to whom correspondence should be addressed.
Sustainability 2025, 17(14), 6352; https://doi.org/10.3390/su17146352
Submission received: 20 June 2025 / Revised: 7 July 2025 / Accepted: 9 July 2025 / Published: 11 July 2025

Abstract

This study provides empirical evidence on how the Marine Ecological Civilization Demonstration Zone program, a policy integrating industrial upgrading with ecological protection, achieves dual objectives in a developing economy context. Theoretically, we uncover three key mechanisms, including green technology innovation, productivity gains, and government intervention, that explain the program’s impacts, offering a framework for reconciling industrialization with environmental sustainability. Our novel findings demonstrate that the program significantly boosts industrial structure upgrading and coastal water quality, with pronounced effects in the Pearl River Delta. We highlight the need for regionally tailored measures, expanded green R&D support, and strategic zone expansion insights critical for China and other developing nations navigating similar trade-offs. By bridging the gap between environmental regulation and industrial transformation, this work contributes to the debates on sustainable development in coastal regions.

1. Introduction

The blue economy is a sustainable marine economy that emerges when economic activity balances with the long-term capacity of marine ecosystems to support such activity while maintaining resilience and health [1]. It is growingly acknowledged as a critical driver for national economic development, especially in boosting the high-quality development of marine industries and building an ecological civilization [2,3]. China has a territorial sea width of 12 nautical miles and an exclusive economic zone of 320,000 square kilometers, and it has enacted multiple blue economy strategies targeting eco-innovation-driven marine sustainability and ecological conservation. In 2012, the State Oceanic Administration (SOA) released the “Opinions on Carrying out the Development of Marine Ecological Civilization Demonstration Zones” (MECDZ, hereafter), aiming to achieve two goals: promoting industrial structure upgrading (ISU, hereafter) and reducing pollution. Specifically, marine ecological civilization is a sustainable development paradigm that harmonizes ocean utilization with ecological conservation through institutional, technological, and cultural innovation, and as an integral part of national strategy, it promotes economic growth and fosters harmonious human-sea relations [4].
Our work thus studies the influences of implementation of a large program, MECDZ, on the ISU of coastal cities in China. In 2013, the National Oceanic Administration approved 12 cities as the first batch of demonstration cities, followed by another 11 cities in 2015 (for details, see Section 2). The existing literature presents a mixed consensus on whether environmental regulations promote industrial upgrades. On one side, some studies indicate that enforcing environmental regulations can sometimes contradict the optimization of industrial structures. This contradiction arises because complying with new standards and requirements necessitates substantial investments and pollution control costs [5,6]. On the other side, environmental policies facilitate the upgrading of industrial structures. Ref. [7] holds that environmental protection policies can boost regional economic growth by refining industrial structures, fostering specialized industrial clusters, and promoting industrial transfer. As industries adapt to these regulations, they not only comply with environmental standards but also unlock new opportunities for growth and development, ultimately contributing to a more sustainable future [8].
Given these confounding effects of environmental regulation, we characterize the effectiveness of MECDZ by adopting staggered difference-in-differences (SDID). Our SDID estimates show that, relative to unregulated cities, regulated cities promote their ISU after the implementation of this program. Regulated cities achieved these upgrades by increasing green innovation, green total factor productivity (GTFP, hereafter) and local government support. Our main results still remain unchanged after carrying out a set of robustness checks. Heterogeneous analyses indicate that the MECDZ drives significant ISU in the Pearl River Delta demonstration cities, and its effects prove statistically insignificant in both the Bohai Rim and Yangtze River Delta regions. It is also significant in the cities identified as focus cities for environmental protection in the “China’s 11th Five-Year Environmental Plan” released by the State Council in 2007. Finally, we provide evidence of industrial upgrading spillovers by showing the effects on ocean pollutions, i.e., water quality, active phosphate concentration, and inorganic nitrogen concentration. These results corroborate the notion that the MECDZ policy has a positive impact on improving coastal water quality via green technological innovation.
This paper yields valuable contributions to our understanding of whether the MECDZ program aimed at improving industrial structure and protecting coastal cities’ ecological environment is effective in the largest developing country. First, unlike previous work that has primarily assessed the influences of environmental supervision on industrial structure [9,10,11], our research shows nuanced knowledge of how the MECDZ program influences these aspects. By enriching the discourse on environmental policy that balances ISU with pollution reduction [4,12,13], our findings provide actionable policy implications for emerging economies confronting analogous marine sustainability challenges.
Second, this paper investigates the underlying economic channels that may influence the effectiveness of the MECDZ policy by analyzing green innovation, GTFP, and local government support. Notably, we utilize the super efficiency slack-based measurement to assess urban GTFP, thereby addressing the radial and angular issues inherent in methods [14]. This deepens the evaluation of the environmental governance effects of the MECDZ policy compared to the existing literature on environmental policies. Our study provides critical evidence for the expansion of pilot areas and policy optimization in China, facilitating a more sustainable industrial transformation while concurrently addressing pollution concerns.

2. Conceptual Framework and Literature Review

2.1. Marine Ecological Civilization Demonstration Zone Policy

The SOA issued the “Opinions on Promoting the Construction of Marine Ecological Civilization Demonstration Zone” and its revised draft, which serve as critical guidelines for the establishment of the first and second batches of MECDZ in 2013 and 2015, respectively [15,16]. The list of coastal cities is shown in Figure 1. These documents emphasize the importance of pollutant emission reduction as a key component in evaluating ecological protection and construction efforts. These objectives are regarded as the most significant goals within the MECDZ framework [17].
The MECDZ program mandates the establishment of a rich and professional target system and assessment methods. The first objective focuses on ISU, which entails a scientific selection of marine development methods and activities. This represents a paradigm shift from prioritizing economic expansion at the expense of environmental conservation to a balanced development model that concurrently emphasizes environmental conservation and economic advancement. This policy calls for accelerated industrial restructuring, a gradual elimination of outdated production capacities, and the phasing out of enterprises that are heavily polluting.
The second objective aims at reducing pollutant emissions in coastal areas. It advocates for a coordinated approach between land and sea. This involves strengthening marine protection and restoration efforts while intensifying comprehensive pollution control measures. The integration of these objectives is essential for achieving sustainable development within marine environments, ensuring that ecological integrity is maintained while fostering economic growth.
Central to the ocean ecological civilization is the recognition of the ocean’s intrinsic value, not only as a resource for economic exploitation but also as a vital component of the Earth’s biosphere. The initiative encourages the adoption of sustainable practices in fishing, tourism, and maritime industries, aiming to minimize ecological footprints while maximizing socio-economic benefits. This involves implementing policies that regulate resource extraction, enhance marine conservation efforts, and promote the marine habitat rehabilitation.
The construction of ocean ecological civilization represents a comprehensive approach to managing marine resources and ecosystems in a sustainable manner. By integrating economic development with ecological protection, this concept seeks to create a future where humans and the ocean can thrive together. As the challenges facing our oceans continue to grow, the commitment to building an ocean ecological civilization becomes increasingly urgent, requiring concerted efforts at local, national, and international levels.

2.2. The MECDZ Policy and Upgrading of Industrial Structure

The effect of environmental policies on ISU is a subject of ongoing scholarly debate, revealing complex mechanisms influenced by regulatory design and context. While some scholars argue that environmental policies hinder ISU due to the short-term compliance cost effect, which refers to the static burden imposed on firms for adhering to regulations [18], the prevailing empirical evidence supports what is known as the promotion theory. In the long run, stringent environmental regulations exert what ref. [19] termed a survival-of-the-fittest effect. Small- and medium-sized enterprises unable to internalize rising pollution control costs are forced to exit the market. Surviving firms adapt by restructuring operations and reallocating resources towards cleaner production methods. Larger polluting firms generally find it easier to absorb these costs through means such as investment in equipment compared to small- and medium-sized enterprises, for whom compliance costs can threaten their viability. This selective pressure inherently promotes ISU.
Furthermore, ref. [20] described green barriers, increasing marginal and sunk costs for potential new entrants into polluting sectors. These barriers curb the expansion of polluting industries and reduce new firm entry [21], thereby positively influencing overall industrial structure. Governments also leverage environmental regulations, often combined with economic instruments like taxes and subsidies, to boost the competitive edge of cleaner sectors and drive the adoption of eco-friendly production methods across the economy, fostering higher-level industrial structures. Ref. [22], employing a tri-dimensional indicator system encompassing industrial development, ecology, and green potential, found that marine environmental regulations significantly promote marine industrial green transformation, with market-incentive instruments proving more effective than command-and-control types. Studies on coastal manufacturing, such as that by ref. [9], have demonstrated that increasing marine environmental regulation stringency first promotes the transfer of polluting industries away from coastal areas, subsequently facilitating local ISU. Ref. [22] corroborated this sequential effect of transfer followed by upgrading in Hainan.
The MECDZ policy, as a stringent legislative and administrative policy, establishes distinct green barriers through specific instruments. These barriers prevent new high-pollution firms from entering marine sectors, phase out obsolete enterprises, and compel existing resource-intensive firms to upgrade their structures. Drawing upon the evidence, the hypothesis is proposed:
Hypothesis 1.
The MECDZ policy significantly promotes ISU.

2.3. Environmental Regulation and Green Technology Innovation

Recent studies have highlighted a significant role that environmental regulations play in influencing industry structure upgrades through green technology innovation (GTI). The theoretical foundation for this relationship is strongly supported by the Porter Hypothesis (PH) [23], which argues that properly formulated environmental policies can boost innovation. Such innovation may counteract compliance costs, thereby enabling firms to boost competitiveness. Prior studies have found that environmental policies influence technological innovation [24,25,26,27]. Similarly, Ref. [28] evaluated urban environmental regulations using a comprehensive scoring system, revealing that the technological barriers established by these regulations promote innovation, leading to structural optimization in industries. Ref. [19] identified that GTI acts as a positive mediator between the stringency of environmental policies and ISU. However, the overall outcome depends on how the short-term cost burden interacts with long-term efficiency improvements that eventually outweigh initial expenses [29,30]. Excessively stringent environmental regulations can exceed the capacity of enterprises, stifling their technological innovation.
The MECDZ policy emphasizes controlling pollutant emissions, compelling enterprises within demonstration zones to focus more on developing environmentally friendly technologies to meet regulatory requirements [31]. Stringent environmental rules require enterprises to meet stricter environmental criteria, which calls for spending on green tech R&D, such as upgrading production facilities or adopting clean energy sources [32,33]. Well-designed regulations can trigger the “Strong Porter Hypothesis,” driving innovations beyond mere compliance that reduce costs and create competitive advantage [34]. These innovations not only aim to meet environmental standards but also facilitate internal advancements in industrial structures [35]. Firms that fail to comply with these standards face the pressure of obsolescence and relocation. Grounded in the theoretical expectations of the PH, this work underscores the potential for environmental policies to serve as catalysts for industrial transformation and sustainability in coastal blue economies [36]. Based on the above analysis, hypothesis 2 is proposed:
Hypothesis 2.
GTI is the underlying economic channel through which the MECDZ policy affects the industrial upgrading of coastal cities.

2.4. Environmental Regulation and Green Total Factor Productivity

GTFP is a comprehensive production efficiency indicator that incorporates environmental factors, allowing for a more holistic assessment of the sustainability and environmental friendliness of economic development. Theoretically, GTFP extends traditional productivity measurement by internalizing environmental externalities through the inclusion of undesired outputs such as pollutants, thereby aligning economic performance with ecological constraints [37]. By taking into account input consumption and output pollution, GTFP delivers a more precise representation of resource usage and development efficiency [38]. A substantial body of empirical evidence indicates that environmental regulations can foster the growth of GTFP [39,40]. Ref. [41] identified a positive linear correlation between environmental regulations and GTFP in economically advanced urban agglomerations, while other urban clusters exhibited a U-shaped nonlinear relationship. Ref. [40] focused on China’s manufacturing sector, demonstrating that environmental regulations in moderately and lightly polluting industries follow a U-shaped curve concerning GTFP.
Environmental regulations influence the shift in China’s industrial growth pattern through their influence on GTFP, although there exists a threshold effect regarding the intensity of these regulations [42]. Ref. [43] also found significant impacts of industrial structure upgrades and environmental regulations on GTFP, exhibiting regional characteristics. Ref. [44] studied low-carbon pilot policies, revealing that such policies significantly affect the GTFP of pilot cities and can also promote GTFP through industrial structure adjustments.
Under strengthened environmental regulations, enterprises are compelled to innovate green technologies, optimize production processes, and improve resource allocation, leading to reduced waste, lower emissions, and improved GTFP [39,45]. This shift not only drives ISU towards high technology and low pollution [46] but also forces companies to boost spending on research and development investments in energy-saving and emission-control technologies in response to stringent policies like emission standards and carbon taxes [23]. Simultaneously, such regulation encourages the exit of high-pollution, low-efficiency enterprises from the market, facilitating the transfer of resources to high-tech and high-value-added industries [47], further reinforcing GTFP growth. MECDZ establishes stringent green barriers for the development of marine industries through rigorous standards, prohibitions, and evaluation systems, such as marine dumping permits and the marine ecological redline policy. These measures prevent highly polluting enterprises from entering the market and gradually phase out outdated firms, thereby compelling resource-intensive enterprises to reduce waste, cut emissions, and ultimately enhance GTFP. Based on the above analysis, hypothesis 3 is proposed:
Hypothesis 3.
GTFP is the underlying economic channel through which the MECDZ policy affects the industrial upgrading of coastal cities.

2.5. Environmental Regulation and Local Government Support

The core of environmental regulation promoting industrial structural upgrading through local government support lies in the government’s ability to internalize environmental externality costs via policy tools. This process drives enterprises to revise their production patterns and improve resource distribution, in turn steering the market towards green, high-efficiency industries and eventually realizing a qualitative change in industrial structure [48]. Governments can strategically intervene to coordinate the pace of industrial transformation, preventing premature deindustrialization and enhancing the upgrading of industrial structures [49].
Crucially, environmental regulation intrinsically empowers and incentivizes local government intervention (GI, hereafter). Stringent environmental standards and performance-based accountability systems, such as central environmental inspections and the integration of green GDP metrics into cadre evaluations, fundamentally realign local governments’ incentives. By elevating environmental goals to parity with economic growth in political tournaments, environmental regulation transforms local governments from passive regulators into active enforcers seeking legitimacy and competitive advantage through green governance [50,51].
Existing research has revealed the mechanisms through which environmental regulation, facilitated by government intervention, drives industrial structural upgrading from multiple dimensions. By utilizing fiscal expenditure tools, local government can expand the scale of capital accumulation within industries and enhance labor productivity, forming a sustained driving force for industrial structural upgrading [52]. However, the efficacy of such policies is restricted by dynamically adjusted local fiscal capacities. When local governments face lower fiscal pressure and have ample disposable financial resources, the industrial upgrading effects of environmental regulation become more pronounced [53].
Furthermore, the effects of intervention exhibit significant heterogeneity. In regions with a strong foundation in marine economies, government intervention can enhance industrial upgrading effects through resource integration and policy orientation. Conversely, in areas with a weak marine economic base, excessive intervention may stifle market vitality and hinder structural transformation [54]. Hence, the following hypothesis is drawn as follows:
Hypothesis 4.
Local government support is the underlying economic channel through which the MECDZ policy affects the industrial upgrading.
Overall, this paper’s research framework is depicted in Figure 2.

3. Data and Model Specification

3.1. Data

This works used 53 coastal Chinese cities spanning 2007 to 2019 as its research sample. The starting time was dictated by the fact that statistics on indicators for coastal prefecture-level cities have been included from 2007, such as those on industrial wastewater directly released into the ocean. It designated 22 cities from the two batches of MECDZ policy in 2013 and 2015 as the treatment group, while other 31 coastal cities served as the control group. The list of cities is presented in Table 1.
The core independent variable is policy dummy variables (MEC), equal to one when a city has become a demonstration city in a time according to the MECDZ policy, otherwise zero. Specifically, 12 cities, including Weihai, Rizhao, Yantai, Ningbo, Taizhou, Wenzhou, Xiamen, Quanzhou, Zhangzhou, Zhuhai, Shantou, and Zhanjiang in 2013, and 10 cities, including Panjin, Dalian, Qingdao, Nantong, Yancheng, Zhoushan, Huizhou, Shenzhen, Beihai, and Sanya in 2015, were treated groups. The remaining 31 coastal prefecture-level cities were control groups.
The dependent variable was a measure of ISU. Following ref. [55,56,57,58], control variables included Lnperincome, Lnedu, Lnenterprises, Lnpop, and Lnfdi (all the variables are defined in Appendix A). The above data were sourced from the China City Statistical Yearbook and processed as follows: (1) we standardized measurement units across all variables; (2) we addressed isolated missing values through time-trend interpolation to maintain panel balance.
As to potential channels, the data for green technology innovation capability (GTI) were sourced from the China National Intellectual Property Administration and measured by the natural logarithm of the number of green patent applications. Data on green total factor productivity (GTFP) incorporating environmental factors were obtained from the CEINET Statistics Database and China City Statistical Yearbook, with detailed calculation procedures provided in Appendix C. The degree of government intervention (GI) originated from the China City Statistical Yearbook and was quantified as the proportion of fiscal expenditure of prefecture-level cities relative to provincial fiscal expenditure, with missing values in certain cities or years being supplemented through interpolation methods.
The data processing methods enhance the reliability and comparability of the results by minimizing measurement inconsistencies and preserving panel balance. Standardization ensures uniform scaling across variables, reducing bias from unit disparities, while interpolation mitigates the risk of sample attrition bias caused by missing data. Logarithmic transformations help normalize skewed distributions (e.g., income, patent counts) and improve model interpretability by approximating linear relationships. Such processing is common in empirical studies and strengthens cross-city comparability, further validating the findings.
The definition of variables is defined in Appendix A. The descriptive statistics results are presented in Table 2.

3.2. Model Specification

The MECDZ policy, formulated by legislative and administrative authorities, establishes green barriers for marine industries through rigorous standards, prohibitions, and evaluation systems [21]. These mechanisms prevent high-pollution enterprises from market entry while progressively phasing out obsolete operations, simultaneously compelling resource-intensive firms to drive ISU [19]. To test these, we study the causal between MECDZ and the ISU of coastal cities to estimate staggered difference-in-differences specification of the form
Y i , t = α + β M E C i , t + γ C o n t r o l s i , t + u i + v t + ε i , t
where Y is the proportion of the tertiary industry in GDP (ISU); MEC is a dummy variable as a measure of environmental regulation effect proposed in the MECDZ program. Our interest is the estimate β .   C o n t r o l s account for economic level (Lnperincome), education expenses (Lnedu), industrialization (Lnenterprises), city size (Lnpop), and open economy (Lnfdi). We include city-level ( u i ) and time-level ( v t ) fixed effects. i is the city, and t is the annual period. ε i , t is an error term.

4. Empirical Results

4.1. Baseline Regression Results

We examined the influences of MECDZ policy on the industrial upgrading by adopting SDID. The results are shown in Table 3. Column 1 shows the estimate without controls, while Column 2 shows the coefficients with controls using city and year fixed effects. The results show that the MECDZ program significantly promoted ISU with 1.62%.
As to control variables, more large-size firms hindered the upgrading (−7.50%) since the increase in the number of large-scale industrial enterprises expanded the added value of the secondary industry [56], while openness had a significant positive impact on the ISU (0.70%). Foreign direct investment brought financial support and advanced management systems to the host country, thereby enhancing the optimization and upgrading of the ISU in the host country [59].
We also provide parallel trend tests as shown in Figure 3. The estimate coefficients in pre-periods were insignificant, whereas those coefficients turned positive and significant starting from the second post-period. This identifies that our estimations are following the parallel trend.
We conduct placebo tests by randomly selecting from the sample to form a pseudo-treatment group. The baseline regression was then repeatedly estimated, and the bootstrap was employed to conduct 500 times. Figure 4 illustrates the results. The horizontal axis denotes the estimated coefficients of the MECDZ policy for randomly selected groups, with the left vertical axis (Y1) indicating p-values and the right vertical axis (Y2) presenting kernel probability density. The curve stands for the kernel density distribution. The original coefficient is marked by a vertical red line, positioned in the tail of the placebo test distribution. Most p-values exceeded 0.1 and were far from the baseline regression coefficient. This verifies that our findings are not attributable to randomness.

4.2. Robustness Check

4.2.1. Propensity Score Matching-Difference-in-Differences

The cities designated as demonstration areas for the MECDZ policy were not selected randomly; they were approved through a comprehensive evaluation by the government. This may lead to endogeneity arising from selection bias. We thus adopted the propensity score matching (PSM) method to address this concern. Then, we proceeded the staggered DID model. Table 4 shows the results of the balance test of PSM. After matching, the absolute values of standardized bias for each control variable across the treatment and control groups were below 20%.
Table 5 shows the results using PSM-DID. Columns 1 and 2 also show positive and significant coefficients of MEC, consistent with the main results.

4.2.2. Alternative Measure of Industrial Upgrading

To provide stable results, we replaced ISU using advanced industrial structure (STRAD) as a new measure of industrial upgrading in Equation (1). STRAD refers to the process by which industries evolve from lower-level to higher-level stages, in which the industrial structure rises progressively in the order of primary, secondary, and tertiary industries. Drawing on refs. [28,60,61], we split the GDP into three components: primary, secondary, and tertiary sectors, and we show a collection of three-dimensional vectors:
x 0 = x 1,0 , x 2,0 , x 3,0
Next, we calculated the angles θ 1 , θ 2 , and θ 3 , of x 0 , and the industrial vectors x 1 , x 2 , and x 3 , which are shown as follows:
x 1 = x 1,1 , x 2,1 , x 3,1 = 1,0 , 0
where x 1 is the primary sector.
x 2 = x 1,2 , x 2,2 , x 3,2 = 0,1 , 0
where x 2 is the secondary sector.
x 3 = x 1,3 , x 2,3 , x 3,3 = 0,0 , 1
where x 3 is the tertiary sector.
We calculated θ j as follows:
θ j = arccos i = 1 3 ( x i , j × x i , 0 ) i = 1 3 ( x i . j 2 ) 1 / 2 × i = 1 3 ( x i . 0 2 ) 1 / 2 , j = 1,2 , 3
where θ j is the angle of x 0 and the industrial vector x j j = 1,2 , 3 . x i . j denotes an element of the industrial-sector vector x j .
Finally, we obtain STRAD from the equation below:
S T R A D = k = 1 3 j = 1 k θ j = 3 θ 1 + 2 θ 2 + θ 3
The larger the STRAD is, the higher the level of ISU is.
The results of STRAD are presented in Columns 3–4, Table 5. The parallel trend tests are shown in Appendix B. We still found positive and significant coefficients of MEC on the advanced industrial upgrading, which is in line with the baseline regressions.

4.3. Underlying Economic Channel

The previous literature suggests that green innovation, green total factor, and local government support can be potential underlying economic channels through which the MECDZ policy affects the industrial upgrading of coastal cities (e.g., refs. [27,39,62]). As to potential channels, variables include GTI, GTFP, and GI. GTFP is measured using the Super-SBM method (for details, see Appendix C). This proxy includes inputs, outputs, labor, capital, and energy, which are selected as input indicators [63]. The ratio of municipal fiscal expenditure to provincial fiscal expenditure serves as a proxy for government intervention intensity (GI). Findings are presented in Table 6. Green innovation, green total factor, and local government support are the underlying economic channels behind the main result.

4.4. Environmental Target

The MECDZ policy aims to reduce pollutant emissions, emphasizing the protection of marine ecological environments. The MECDZ policy necessitates the implementation of performance assessments and accountability mechanisms [16]. Additionally, the policy underscores the importance of promoting marine ecological civilization through education and public awareness campaigns, thereby enhancing environmental protection consciousness among both enterprises and residents [15]. This increased awareness is expected to drive efforts towards marine ecological protection and contribute to reducing pollutant releases.
To test the environmental regulation effectiveness, we explored the regulatory effects of GTI, GTFP, and GI. Following ref. [64], this study employed coastal water quality (WQ), the active phosphate concentration taking natural logarithm (LnAP), and the dissolved inorganic nitrogen concentration taking natural logarithm (LnDIN) as indicators of coastal water pollution (Coastal water quality was categorized into five levels: Class I (highest quality), Class II, Class III, Class IV, and Class V (lowest quality). A higher WQ classification indicates more severe pollution and poorer water quality.)
Table 7 presents the results. The interaction variables in Columns 1 and 3 indicate that GTI and GI had a positive impact on improving coastal water quality. However, the effects of GTI, GTFP, and GI were not significantly pronounced. This is primarily due to the fact that fertilizers and agricultural runoff are the major sources of active phosphate and inorganic nitrogen pollution, particularly in agriculturally dominated regions [65]. Phosphates in fertilizers are highly soluble in water, and during rainfall or irrigation, they can easily runoff into rivers and coastal waters [66].

5. Geographic Location and Environmental Scrutiny

China’s coastal economic circles each possess unique characteristics that contribute to the nation’s economic diversity and growth. To gauge the specific characteristics of each economic area, the entire area was categorized depending on geographical location into the Bohai Economic Circle, the Yangtze River Delta Economic Circle, the Pearl River Delta Economic Circle, and other economic circles (where the coastal cities located in Guangxi Province were classified into the Beibu Gulf Economic Circle, and the coastal cities in Hainan Province were classified into the West Taiwan Strait Economic Circle, collectively referred to as other economic circles).
We re-estimated Equation (1). Results are reported in Columns 1–4, Table 7. The MECDZ policy significantly facilitated industrial structural upgrading in the Pearl River Delta Economic Circle; however, its influence on industrial upgrading in the Bohai Economic Circle and the Yangtze River Delta Economic Circle proved insignificant. This is due to the differences in the modernization of the industrial structures among the three economic circles. The Pearl River Delta Economic Circle is a frontier region in China [67]. In contrast to traditional industries, high-tech sectors and modern service industries attach more importance to clean production and react more vigorously to the MECDZ policy [12,68].
We also took into account that the stringency of environmental policies influences the industrial structure. Thus, this research categorized the samples into key environmental protection cities and non-key counterparts. Findings are presented in Columns 5–6 of Table 8, revealing that the policy has markedly advanced industrial structural upgrading in the demonstration zones aligning with our projections.

6. Conclusions, Discussion, and Policy Implication

6.1. Conclusions

This works adopted a SDID model to estimate the impact of the MECDZ program on industrial structure upgrading. First, the MECDZ has achieved positive results in promoting industrial structure upgrading increased by 1.62%. Secondly, these findings demonstrated robustness when validated through PSM-DID methodology and alternative explained variables. Moreover, green technology innovation, green total factor productivity, and government intervention were underlying channels. Thirdly, substantial heterogeneity emerged across marine economic zones; while the policy drove significant industrial upgrading in the Pearl River Delta demonstration cities, its effects proved statistically insignificant in both the Bohai Rim and Yangtze River Delta regions. Fourthly, environmentally focused cities exhibited more pronounced policy responsiveness than non-priority counterparts. Finally, we confirmed complementary ecological benefits; as such, MECDZ implementation improved coastal water quality, with green technology innovation and government support serving as key mechanisms for this outcome.

6.2. Discussion

As to the methodologies in our work, the combined use of panel data with fixed effects, PSM-DID, heterogeneity tests, and mechanism analysis offers several strengths. First, fixed-effects models control for unobserved time-invariant confounders, improving causal inference. PSM-DID further reduces selection bias by matching treated and control groups on observable characteristics before assessing policy impacts, enhancing robustness. The heterogeneity test reveals how effects vary across regions (e.g., Pearl River Delta vs. Bohai Rim), providing nuanced policy insights. Finally, mechanism tests (e.g., green innovation, government intervention) clarify why the policy works, strengthening theoretical and practical relevance. Together, these methods provide a rigorous, multi-dimensional evaluation of MECDZ’s impact.
The MECDZ policy is a specific branch of the ecological civilization policy targeting China’s coastal cities. Implementing the MECDZ policy nationwide in a top-down manner, progressing from specific points to broader areas, holds significant potential for effectively achieving Sustainable Development Goals (SDGs) in coastal regions [69]. For instance, the successful implementation in China’s eastern regions has driven a unified advancement in China’s ecological civilization development. Moreover, China’s ecological civilization standard is the top-down policy instrument, generally considered dynamic and thus deemed more effective. These indicators come into being via ongoing adjustment and refinement in light of shifts in national strategic demands and practical goals.
The MECDZ framework offers emerging countries a sustainable growth pathway, avoiding the “pollute first, clean up later” trap while creating jobs in eco-tourism, marine biotech, and renewable energy. By leveraging global climate finance, South–South partnerships, and digital monitoring tools, nations can enhance climate resilience (e.g., mangrove restoration in Vietnam), attract ESG investment, and align with UN SDGs. However, the implementation of such policy faces challenges. This may weak enforcement capacity, high upfront costs for infrastructure like wastewater treatment, and resistance from traditional sectors like small-scale fisheries. Corruption, reliance on foreign technology, and conflicts between industrial growth and conservation goals further hinder adoption.
The positive results of the MECDZ, particularly its success in industrial upgrading, green innovation-driven productivity gains, and improved coastal water quality, strongly justify maintaining and expanding the policy. However, the heterogeneous effects across regions suggest that modifications are needed to enhance effectiveness. Authorities should tailor implementation in underperforming regions (Bohai Rim, Yangtze Delta) by adjusting industry-specific incentives (e.g., targeted subsidies for marine tech) and strengthening local enforcement to match the Pearl River Delta’s success. A place-based approach, combined with reinforced green innovation and governance, would maximize its economic and environmental impact.
Our work also suffers limitations. First, while the methodologies we adopt can address the main research question, PSM-DID may not hold if unobserved shocks differentially affect treatment and control groups. Moreover, linear mediation may oversimplify complex pathways, which offers future research directions to analyze the potential channels behind this causal relationship. Second, the mechanisms identified are broadly defined, leaving room for further exploration of specific policy instruments (e.g., subsidies, R&D incentives) that drive industrial upgrading. The study also does not quantify the long-term sustainability of these effects; short-term gains in industrial restructuring may not necessarily translate into persistent pollution reduction or economic resilience. Addressing these limitations could enhance the generalizability and policy relevance of future evaluations.

6.3. Policy Implication

Our work has some policy implications. Firstly, the MECDZ program represents a crucial initiative in promoting ecological civilization and sustainable development, particularly in coastal regions. To boost the efficacy of this policy, the policymakers should gradually expand the range of demonstration zones, with priority given to enhancing sustainable development capacity and optimizing industrial composition. This involves reducing reliance on traditional high-pollution industries and fostering the upgrading of industrial structures.
Second, the government should encourage and support GTI to provide the necessary technical guarantees and impetus for industrial upgrading. This encompasses stepping up investment in green tech projects and their development, building a sound green tech innovation system, and driving the extensive adoption of green technologies in production processes.
Finally, the government should tailor MECDZ policy initiatives in line with the distinct features and developmental requirements of varied cities, guaranteeing the policy’s effectiveness and enforcement in diverse coastal regions. By focusing on environmentally friendly high-tech industries and fostering an attractive investment climate, coastal regions can effectively leverage international resources and markets.

Author Contributions

Conceptualization, Y.J.; Methodology, J.L. and Y.J.; Software, J.L.; Validation, J.L.; Formal analysis, J.L.; Investigation, Y.J.; Data curation, J.L.; Writing—original draft, J.L. and Y.J.; Writing—review & editing, Y.J.; Supervision, Y.J. All authors have read and agreed to the published version of the manuscript.

Funding

This research received no external funding.

Institutional Review Board Statement

Not applicable.

Informed Consent Statement

Not applicable.

Data Availability Statement

The data presented in this study are available on request from the corresponding author.

Conflicts of Interest

The authors declare no conflict of interest.

Appendix A. Definition

Table A1. Definition of variables.
VariableDefinitionSources
MECDummy variable, which equals 1 when a city has become a demonstration city in a time according to the MECDZ policy, otherwise 0National Oceanic Administration
ISUThe proportion of the tertiary industry in GDPChina City Statistical Yearbook,
authors’ own calculation
LnperincomePer capita income taking natural logarithm
LneduEducation expenses taking natural logarithm
LnenterprisesThe number of industrial firms with operating income over 20 million RMB taking natural logarithm
LnpopPopulation density taking natural logarithm
Lnfdithe amount of foreign direct investment taking natural logarithm
STRADProcess of industries developing from lower to higher stages
GTIThe number of green patent applications taking natural logarithmChina National Intellectual Property Administration.
GTFPProduction efficiency indicator that incorporates environmental factorsCEINET Statistical Database; China City Statistical Yearbook
GIThe proportion of fiscal expenditure of prefecture-level cities to provincial fiscal expenditureChina City Statistical Yearbook
WQThe categorical ordinal variable is classified into five levels Class I, Class II, Class III, Class IV, and Class VBulletin on Environmental Quality of China’s Coastal Seas
LnAPThe concentration of active phosphate taking natural logarithm
LnDINThe concentration of dissolved inorganic nitrogen taking natural logarithm

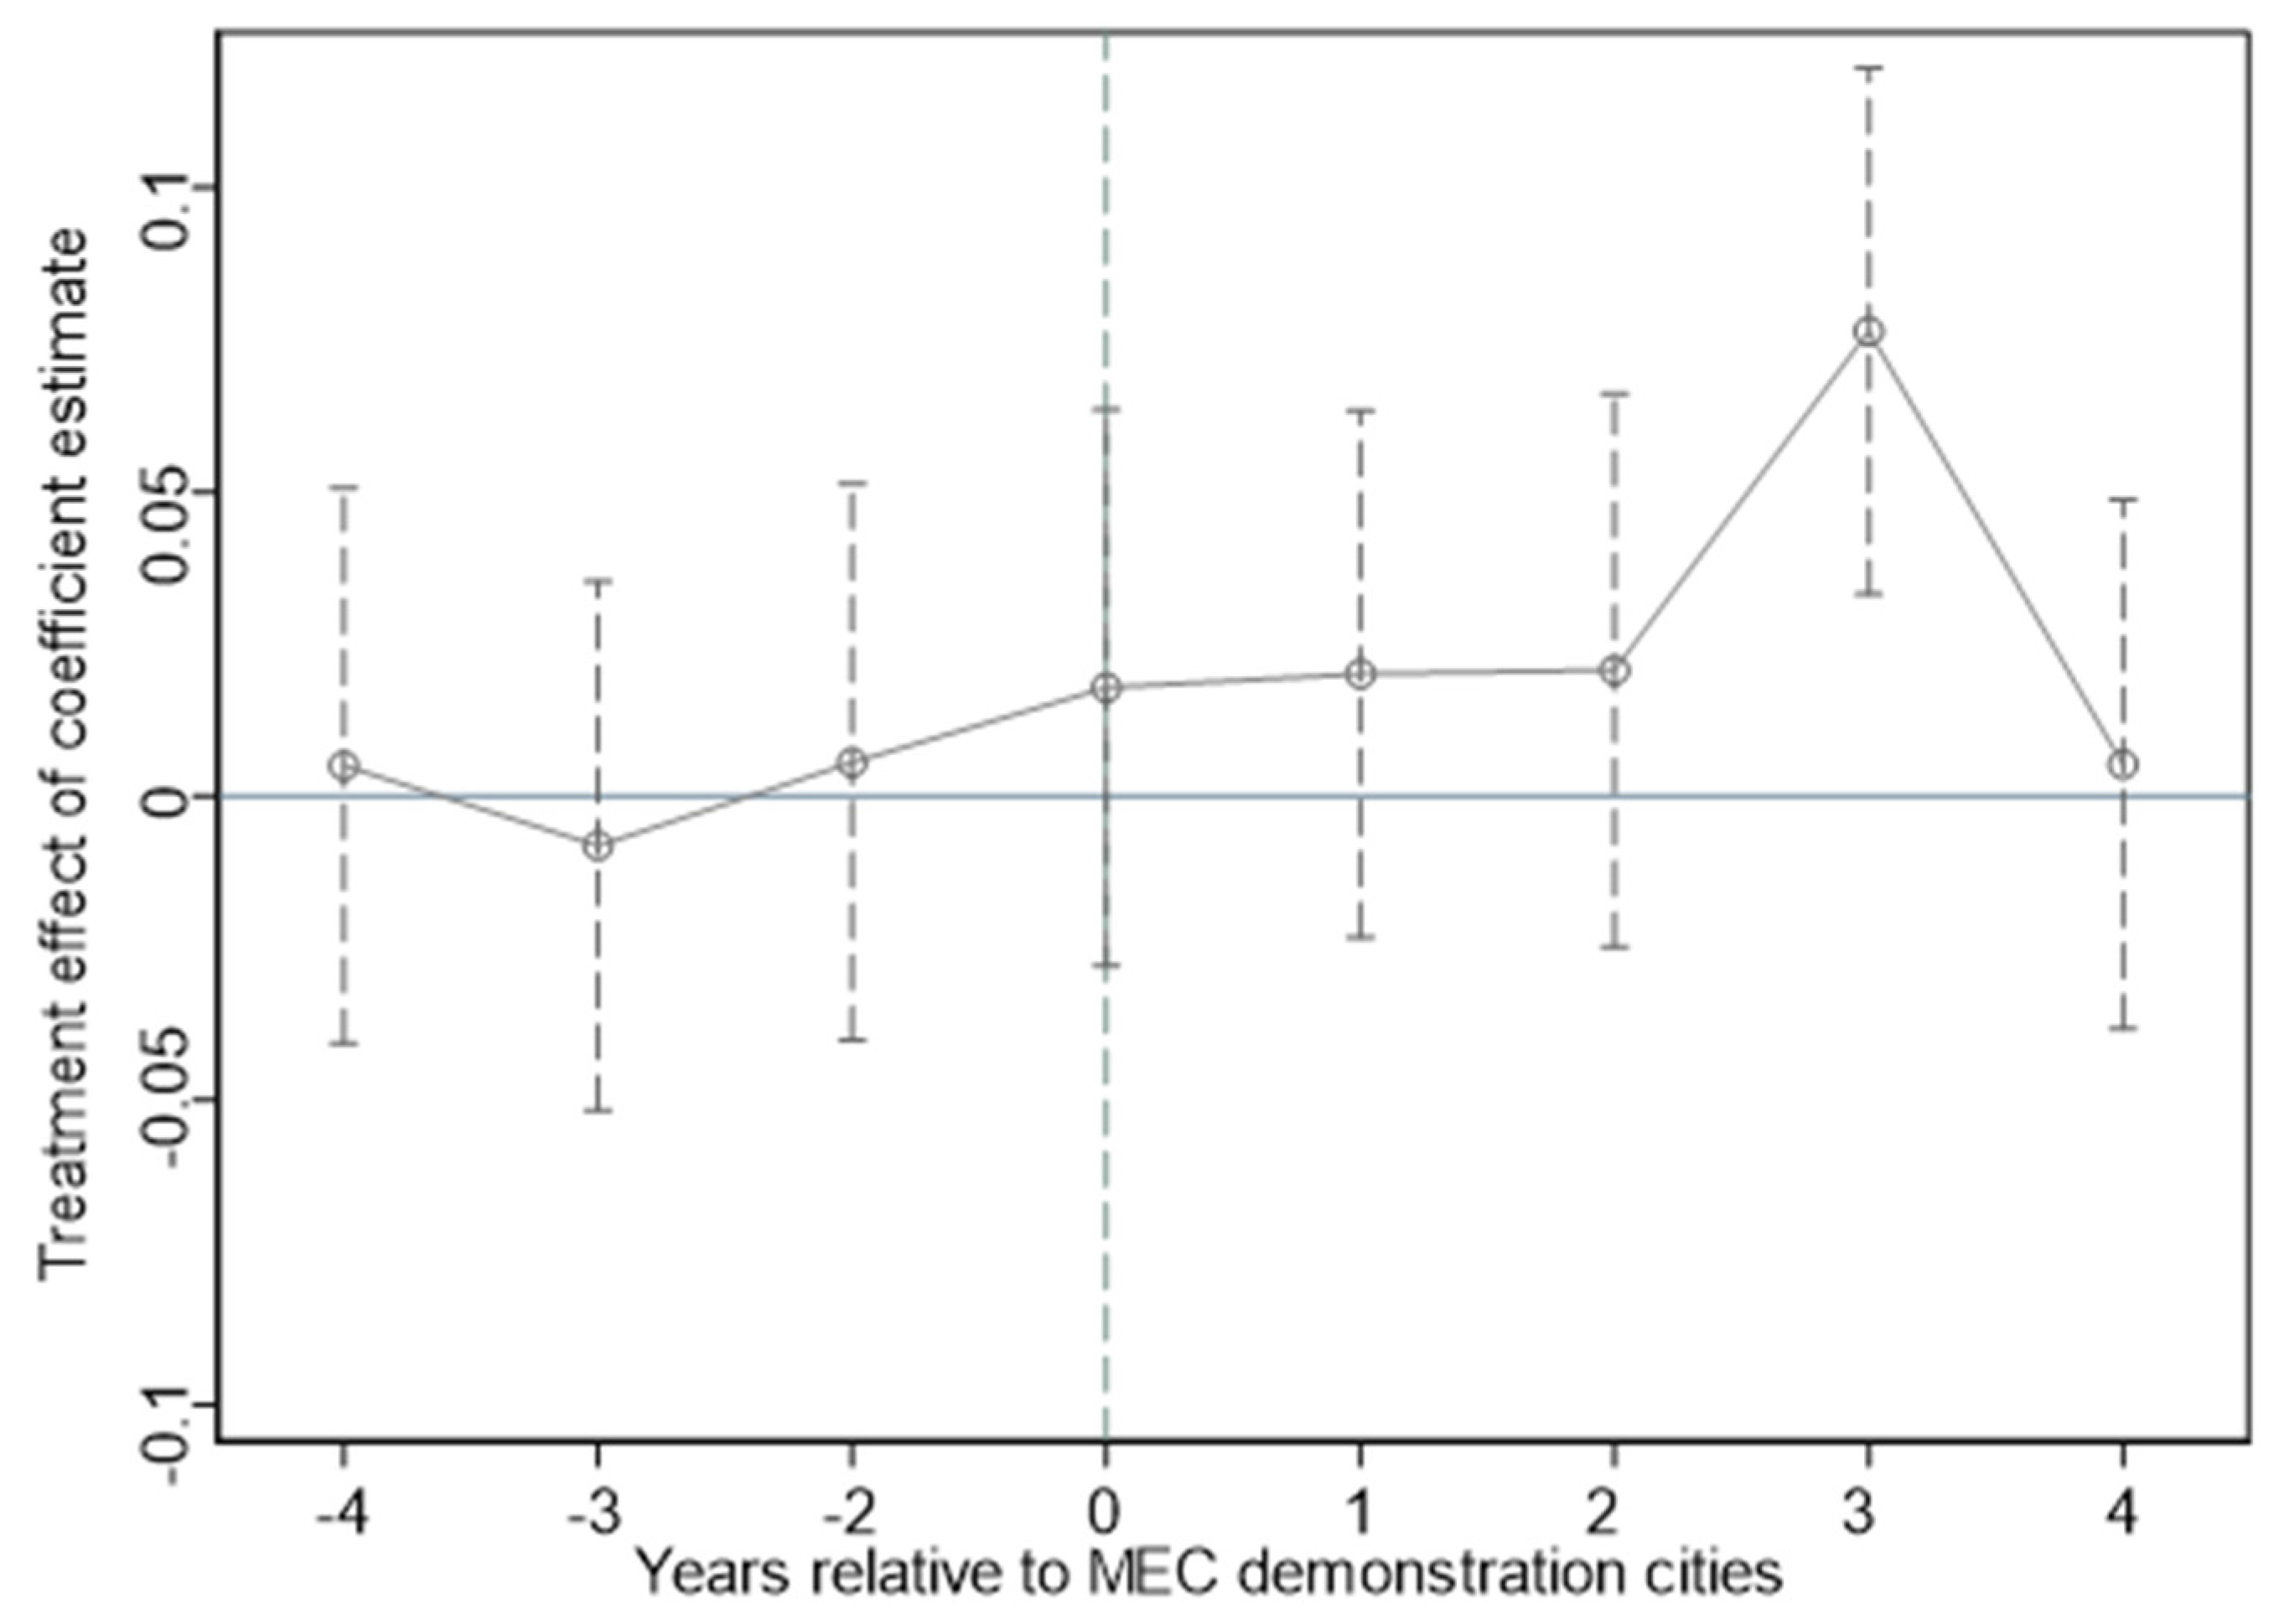
Appendix B. Parallel Trend Tests for STRAD

Figure A1. Parallel trend. Notes: the horizontal line represents time; the vertical line is the estimate coefficients of MEC. Using the year prior to the implementation of the policy as the baseline period, the first year was excluded from estimations. From −4 to −2 present the pre-periods of the policy, and from 1 to 4 indicate post-periods of the policy.
Sustainability 17 06352 g0a1

Appendix C. The Construction of GTFP

The methods used to evaluate efficiency are parametric and non-parametric estimation. Ref. [70] further proposed a model (Super-SBM) based on the super slack metric that considers the non-expected outputs. The Super-SBM model can evaluate results >1, which enhances the validity of ranking evaluation results. Moreover, it includes the slack variable directly in the objective function [70]. Therefore, in this study, the Super-SBM model based on non-expected output was chosen to calculate the GTFP. The model allows for the inclusion of multiple non-desired output indicators in the GTFP evaluation indicator system. Furthermore, the model takes into account the issue of input or output slackness and further investigates decision-making units with efficiency values greater than or equal to 1, which enables the distinction between weakly and strongly efficient and allows for the comparison of efficiency values between units that have reached the efficiency frontier. The construction is shown as follows:
First, we determined the indicator system. Output variables included the desirable output and the undesirable output. The desirable output is denoted by gross domestic product (GDP) converted based on the constant price in the year 2007, while the desirable output is expressed by industrial sewage volume (i.e., in 10,000 tons), industrial sulfur dioxide emissions (tons), and industrial dust emissions (i.e., in tons) following ref. [71]. Data come from the National Bureau of Statistics of China and the statistical yearbooks of China’s cities.
Second, we adopt the Super-SBM model and constraints. The expression is as follows:
ρ = m i n 1 + 1 z i = 1 z s i x / x i k 1 1 m + n r = 1 m s r y / y r k + h = 1 n s h b / b h k
s . t . x i k j = 1 , j k N x i j λ j + s i x y r k j = 1 , j k N y r j λ j s r y b h k j = 1 , j k N b h j λ j s h b 1 1 m + n r = 1 m s r y y r k + h = 1 n s h b b h k > 0 λ 0 , s i x 0 , s r y 0 , s h b 0 i = 1,2 , , z ; r = 1,2 , , m ; h = 1,2 , , n j = 1,2 , , K ; k = 1,2 , , K )
where ρ is the GTFP value (ρ ≥ 0); the higher the value of ρ is, the higher the GTFP of the region is. s i x , s r y , and s h w are the slack variables for inputs, desired outputs, and non-desired outputs, respectively. λ denotes the weights.

References

  1. Smith-Godfrey, S. Defining the blue economy. Marit. Aff. 2016, 12, 58–64. [Google Scholar] [CrossRef]
  2. Bari, A. Our oceans and the blue economy: Opportunities and challenges. Procedia Eng. 2017, 194, 5–11. [Google Scholar] [CrossRef]
  3. Lee, K.H.; Noh, J.; Khim, J.S. The Blue Economy and the United Nations’ sustainable development goals: Challenges and opportunities. Environ. Int. 2020, 137, 105528. [Google Scholar] [CrossRef] [PubMed]
  4. Jiang, Q.; Feng, C.; Ding, J.; Bartley, E.; Lin, Y.; Fei, J.; Christakos, G. The decade long achievements of China’s marine ecological civilization construction (2006–2016). J. Environ. Manag. 2020, 272, 111077. [Google Scholar] [CrossRef]
  5. Liu, Y.; Li, Z.; Yin, X. Environmental regulation, technological innovation and energy consumption—A cross-region analysis in China. J. Clean. Prod. 2018, 203, 885–897. [Google Scholar] [CrossRef]
  6. Li, J.; Shi, X.; Wu, H.; Liu, L. Trade-off between economic development and environmental governance in China: An analysis based on the effect of river chief system. China Econ. Rev. 2020, 60, 101403. [Google Scholar] [CrossRef]
  7. Liu, Y.; Pei, Z.; Wang, Y. Study on the issue of supplyside reform path in China’s marine ecological civilization construction. Sociology 2019, 9, 20–28. [Google Scholar]
  8. Qu, Q.; Xu, C. Exploration on marine management under the view of marine eco-civilization. Meteorol. Environ. Res. 2013, 4, 31. [Google Scholar]
  9. Chen, X.; Qian, W. Effect of marine environmental regulation on the industrial structure adjustment of manufacturing industry: An empirical analysis of China’s eleven coastal provinces. Mar. Policy 2020, 113, 103797. [Google Scholar] [CrossRef]
  10. Liu, X.; Chen, S. Has environmental regulation facilitated the green transformation of the marine industry? Mar. Policy 2022, 144, 105238. [Google Scholar] [CrossRef]
  11. Wang, Q.; Zhang, C.; Li, R. Does environmental regulation improve marine carbon efficiency? The role of marine industrial structure. Mar. Pollut. Bull. 2023, 188, 114669. [Google Scholar] [CrossRef] [PubMed]
  12. Chen, X.; Liang, C.; Di, Q. Coordination mechanism and empirical research on marine science technology innovation and marine eco-civilization: A case study of coastal areas of China. Chin. Geogr. Sci. 2024, 34, 468–486. [Google Scholar] [CrossRef]
  13. Ren, W.; Xu, Y.; Xiao, H. Research on the impact of marine ecological civilization demonstration zone policies on the green development level of China’s marine economy: A quasi natural experiment based on coastal cities. Mar. Policy 2024, 161, 106048. [Google Scholar] [CrossRef]
  14. Li, H.; Shi, J.F. Energy efficiency analysis on Chinese industrial sectors: An improved Super-SBM model with undesirable outputs. J. Clean. Prod. 2014, 65, 97–107. [Google Scholar] [CrossRef]
  15. State Oceanic Administration. Opinions on Building a Marine Ecological Civilization Demonstration Zone. 2013. Available online: https://www.gov.cn/gzdt/2012-02/10/content_2063308.htm (accessed on 6 July 2025).
  16. State Oceanic Administration. Implementation Plan for the Construction of Marine ecological Civilization. 2015. Available online: https://www.gov.cn/xinwen/2015-07/16/content_2898332.htm (accessed on 6 July 2025).
  17. Cao, Y. Analysis and Policy Recommendations of Marine Ecological Civilization Demonstration Construction. Ecol. Econ. 2016, 32, 207–211. [Google Scholar] [CrossRef]
  18. Cohen, M.A.; Tubb, A. The impact of environmental regulation on firm and country competitiveness: A meta-analysis of the porter hypothesis. J. Assoc. Environ. Resour. Econ. 2018, 5, 371–399. [Google Scholar] [CrossRef]
  19. Yin, K.; Miao, Y.; Huang, C. Environmental regulation, technological innovation, and industrial structure upgrading. Energy Environ. 2022, 35, 207–227. [Google Scholar] [CrossRef]
  20. Ryan, S.P. The costs of environmental regulation in a concentrated industry. Econometrica 2012, 80, 1019–1061. [Google Scholar]
  21. Cui, J.; Ji, Y. The Environment, Trade and Innovation with Heterogeneous Firms: A numerical Analysis. In Proceedings of the Agricultural and Applied Economics Association 2011 Annual Meeting, Pittsburgh, PA, USA, 24–26 July 2011; Available online: https://ageconsearch.umn.edu/record/103478/?ln=en&v=pdf (accessed on 19 June 2025).
  22. Wang, L. Study on the Influence of Marine Environment Control on Industrial Structure Adjustment of Manufacturing Industry in Hainan Province. IOP Conf. Ser. Earth Environ. Sci. 2020, 560, 012058. [Google Scholar] [CrossRef]
  23. Porter, M.E.; Linde, C.V.D. Toward a new conception of the environment-competitiveness relationship. J. Econ. Perspect. 1995, 9, 97–118. [Google Scholar] [CrossRef]
  24. Lanoie, P.; Patry, M.; Lajeunesse, R. Environmental regulation and productivity: Testing the porter hypothesis. J. Product. Anal. 2008, 30, 121–128. [Google Scholar] [CrossRef]
  25. Johnstone, N.; Hascic, I.; Popp, D. Renewable energy policies and technological innovation: Evidence based on patent counts. Environ. Resour. Econ. 2010, 45, 133–155. [Google Scholar] [CrossRef]
  26. Calel, R.; Dechezleprêtre, A. Environmental policy and directed technological change: Evidence from the European carbon market. Rev. Econ. Stat. 2016, 98, 173–191. [Google Scholar] [CrossRef]
  27. Zhang, Z.; Li, R.; Song, Y.; Sahut, J.M. The impact of environmental regulation on the optimization of industrial structure in energy-based cities. Res. Int. Bus. Finance 2024, 68, 102154. [Google Scholar] [CrossRef]
  28. Lin, B.; Xie, J. Does environmental regulation promote industrial structure optimization in China? A perspective of technical and capital barriers. Environ. Impact Assess. Rev. 2023, 98, 106971. [Google Scholar] [CrossRef]
  29. Ma, H.; Li, L. Could environmental regulation promote the technological innovation of China’s emerging marine enterprises? Based on the moderating effect of government grants. Environ. Res. 2021, 202, 111682. [Google Scholar] [CrossRef]
  30. Gollop, F.M.; Roberts, M.J. Environmental regulations and productivity growth: The case of fossil-fueled electric power generation. J. Polit. Econ. 1983, 91, 654–674. [Google Scholar] [CrossRef]
  31. Xu, S.; Sun, P.; Yin, K. Innovation driving effect of marine economic structure transformation. J. Coast. Res. 2020, 115, 184–186. [Google Scholar] [CrossRef]
  32. Porter, M.E. Towards a dynamic theory of strategy. Strateg. Manag. J. 1991, 12, 95–117. [Google Scholar] [CrossRef]
  33. Wang, E.Z.; Lee, C.C. The impact of clean energy consumption on economic growth in China: Is environmental regulation a curse or a blessing? Int. Rev. Econ. Finance 2022, 77, 39–58. [Google Scholar] [CrossRef]
  34. Zhong, C.; Hamzah, H.Z.; Yin, J.; Wu, D.; Cao, J.; Mao, X.; Li, H. Impact of environmental regulations on the industrial eco-efficiency in China—Based on the strong porter hypothesis and the weak porter hypothesis. Environ. Sci. Pollut. Res. 2023, 30, 44490–44504. [Google Scholar] [CrossRef] [PubMed]
  35. Du, K.; Cheng, Y.; Yao, X. Environmental regulation, green technology innovation, and industrial structure upgrading: The road to the green transformation of Chinese cities. Energy Econ. 2021, 98, 105247. [Google Scholar] [CrossRef]
  36. Li, J.L.; Shen, M.H.; Ma, R.F.; Yang, H.S.; Chen, Y.N.; Sun, C.Z.; Liu, M.; Han, X.Q.; Hu, Z.D.; Ma, X.G.; et al. Marine resource economy and strategy under the background of marine ecological civilization construction. J. Nat. Resour. 2022, 37, 829–849. [Google Scholar] [CrossRef]
  37. Li, T.; Ma, J.; Mo, B. Does environmental policy affect green total factor productivity? Quasi-natural experiment based on China’s air pollution control and prevention action plan. Int. J. Environ. Res. Public Health 2021, 18, 8216. [Google Scholar] [CrossRef]
  38. Lee, C.C.; Lee, C.C. How does green finance affect green total factor productivity? Evidence from China. Energy Econ. 2022, 107, 105863. [Google Scholar] [CrossRef]
  39. Cheng, Z.; Kong, S. The effect of environmental regulation on green total-factor productivity in China’s industry. Environ. Impact Assess. Rev. 2022, 94, 106757. [Google Scholar] [CrossRef]
  40. Li, Y.; Li, S. The influence study on environmental regulation and green total factor productivity of China’s manufacturing industry. Discret. Dyn. Nat. Soc. 2021, 2021, 5580414. [Google Scholar] [CrossRef]
  41. Zhao, M.; Liu, F.; Sun, W.; Tao, X. The relationship between environmental regulation and green total factor productivity in China: An empirical study based on the panel data of 177 cities. Int. J. Environ. Res. Public Health 2020, 17, 5287. [Google Scholar] [CrossRef]
  42. Li, B.; Peng, X.; Ouyang, M.K. Environmental regulation, green total factor productivity and the transformation of China’s industrial development mode: Analysis based on data of China’s 36 industries. China Ind. Econ. 2013, 56–68. [Google Scholar] [CrossRef]
  43. Sun, J.; Tang, D.; Kong, H.; Boamah, V. Impact of industrial structure upgrading on green total factor productivity in the Yangtze river economic belt. Int. J. Environ. Res. Public Health 2022, 19, 3718. [Google Scholar] [CrossRef]
  44. Guo, S.; Tang, X.; Meng, T.; Chu, J.; Tang, H. Industrial Structure, R&D Staff, and Green Total Factor Productivity of China: Evidence from the Low-Carbon Pilot Cities. Complexity 2021, 2021, 6690152. [Google Scholar]
  45. Fan, M.; Yang, P.; Li, Q. Impact of environmental regulation on green total factor productivity: A new perspective of green technological innovation. Environ. Sci. Pollut. Res. 2022, 29, 53785–53800. [Google Scholar] [CrossRef] [PubMed]
  46. Yuan, J.; Zhang, D. Research on the impact of environmental regulations on industrial green total factor productivity: Perspectives on the changes in the allocation ratio of factors among different industries. Sustainability 2021, 13, 12947. [Google Scholar] [CrossRef]
  47. Li, L.; Tao, F. Selection of optimal environmental regulation intensity for Chinese manufacturing industry: Based on the green TFP perspective. China Ind. Econ. 2012, 5, 70–82. [Google Scholar] [CrossRef]
  48. Wang, L.; Wang, Z.; Ma, Y. Heterogeneous environmental regulation and industrial structure upgrading: Evidence from China. Environ. Sci. Pollut. Res. 2022, 29, 13369–13385. [Google Scholar] [CrossRef]
  49. Lin, J.Y.; Wang, Y. Structural change, industrial upgrading, and middle-income trap. J. Ind. Compet. Trade 2020, 20, 359–394. [Google Scholar] [CrossRef]
  50. Yin, L.; Wu, C. Promotion incentives and air pollution: From the political promotion tournament to the environment tournament. J. Environ. Manag. 2022, 317, 115491. [Google Scholar] [CrossRef]
  51. Wang, M. Environmental governance as a new runway of promotion tournaments: Campaign-style governance and policy implementation in China’s environmental laws. Environ. Sci. Pollut. Res. 2021, 28, 34924–34936. [Google Scholar] [CrossRef]
  52. Shao, W.; Yin, Y.; Bai, X.; Taghizadeh-Hesary, F. Analysis of the upgrading effect of the industrial structure of environmental regulation: Evidence from 113 cities in China. Front. Environ. Sci. 2021, 9, 692478. [Google Scholar] [CrossRef]
  53. Mao, J.; Guan, C. Environmental Regulation, Government Behavior and Industrial Structure Upgrading. J. Beijing Inst. Technol. (Soc. Sci. Ed.) 2019, 3, 1–10. [Google Scholar]
  54. Yang, Y.; Wei, X.; Wei, J.; Gao, X. Industrial structure upgrading, green total factor productivity and carbon emissions. Sustainability 2022, 14, 1009. [Google Scholar] [CrossRef]
  55. Yang, Q.; Gao, D.; Song, D.; Li, Y. Environmental regulation, pollution reduction and green innovation: The case of the Chinese Water Ecological Civilization City Pilot policy. Econ. Syst. 2021, 45, 100911. [Google Scholar] [CrossRef]
  56. Shi, T.; Zhang, W.; Zhou, Q.; Wang, K. Industrial structure, urban governance and haze pollution: Spatiotemporal evidence from China. Sci. Total Environ. 2020, 742, 139228. [Google Scholar] [CrossRef]
  57. Rahman, M.M.; Nepal, R.; Alam, K. Impacts of human capital, exports, economic growth and energy consumption on CO2 emissions of a cross-sectionally dependent panel: Evidence from the newly industrialized countries (NICs). Environ. Sci. Policy 2021, 121, 24–36. [Google Scholar] [CrossRef]
  58. Abid, M.; Sekrafi, H. Pollution haven or halo effect? A comparative analysis of developing and developed countries. Energy Rep. 2021, 7, 4862–4871. [Google Scholar]
  59. Hoang, D.T.; Do, A.D.; Trinh, M.V. Spillover effects of FDI on technology innovation of vietnamese enterprises. J. Asian Financ. Econ. Bus. 2021, 8, 655–663. [Google Scholar]
  60. Shevchenko, D.; Zhao, W.; Guo, Q. Financial opening, financial development and industrial restructuring: A mediating effect analysis. Int. J. Dev. Issues 2023, 22, 141–166. [Google Scholar] [CrossRef]
  61. Lyu, Y.; Wang, W.; Wu, Y.; Zhang, J. How does digital economy affect green total factor productivity? Evidence from China. Sci. Total Environ. 2023, 857, 159428. [Google Scholar] [CrossRef]
  62. Lin, B.; Zhou, Y. How does vertical fiscal imbalance affect the upgrading of industrial structure? Empirical evidence from China. Technol. Forecast. Soc. Chang. 2021, 170, 120886. [Google Scholar] [CrossRef]
  63. Xia, F.; Xu, J. Green total factor productivity: A re-examination of quality of growth for provinces in China. China Econ. Rev. 2020, 62, 101454. [Google Scholar] [CrossRef]
  64. Ma, J.; Hu, Q.; Wei, X. Impact of environmental regulation on coastal marine pollution—A case of coastal prefecture-level cities in China. Front. Mar. Sci. 2022, 9, 882010. [Google Scholar] [CrossRef]
  65. Khan, M.N.; Mobin, M.; Abbas, Z.K.; Alamri, S.A. Fertilizers and their contaminants in soils, surface and groundwater. Encycl. Anthr. 2018, 5, 225–240. [Google Scholar]
  66. Mainstone, C.P.; Parr, W. Phosphorus in rivers—Ecology and management. Sci. Total Environ. 2002, 282, 25–47. [Google Scholar] [CrossRef]
  67. Wu, K.; Wang, Y.; Ye, Y.; Zhang, H.; Huang, G. Relationship between the built environment and the location choice of high-tech firms: Evidence from the Pearl River Delta. Sustainability 2019, 11, 3689. [Google Scholar] [CrossRef]
  68. de Mello Santos, V.H.; Campos, T.L.R.; Espuny, M.; de Oliveira, O.J. Towards a green industry through cleaner production development. Environ. Sci. Pollut. Res. 2022, 29, 349–370. [Google Scholar] [CrossRef] [PubMed]
  69. Xie, H.; Wen, J.; Choi, Y. How the SDGs are implemented in China—A comparative study based on the perspective of policy instruments. J. Clean. Prod. 2021, 291, 125937. [Google Scholar] [CrossRef]
  70. Tone, K. A slacks-based measure of efficiency in data envelopment analysis. Eur. J. Oper. Res. 2001, 130, 498–509. [Google Scholar] [CrossRef]
  71. Gao, Q.; Zhang, R.P.; Gao, L.H. Can environmental policies improve marine ecological efficiency? Examining China’s Ecological Civilization Pilot Zones. Mar. Pollut. Bull. 2024, 203, 116479. [Google Scholar] [CrossRef]
Figure 1. MECDZ location.
Sustainability 17 06352 g001
Figure 2. Research framework.
Sustainability 17 06352 g002
Figure 3. Parallel trend tests. Notes: the horizontal line represents time; the vertical line is the estimate coefficients of MEC. Using the year prior to the implementation of the policy as the baseline period, the first year was excluded from estimations. From −4 to −2 present the pre-periods of the policy, and from 1 to 5 indicate post-periods of the policy.
Sustainability 17 06352 g003
Figure 4. Placebo test. Notes: the horizontal axis represents the estimated coefficients of the MEC policy for the randomly selected, while the left vertical axis (Y1) shows the p-values, and the right vertical axis (Y2) displays the kernel probability density. The curve represents the kernel density distribution of the estimated coefficients. The original estimated coefficient is indicated by the vertical red line, which is located in the tail of the placebo test.
Sustainability 17 06352 g004
Table 1. List of demonstration cities.
Policy Issued TimeMarine Ecological Civilization Demonstration Cities
2013Shandong Province: Weihai City, Rizhao City, Yantai City; Zhejiang Province: Ningbo City, Taizhou City, Wenzhou City; Fujian Province: Xiamen City, Quanzhou City, Zhangzhou City; Guangdong Province: Zhuhai City, Shantou City, Zhanjiang City
2015Liaoning Province: Panjin City, Dalian City; Shandong Province: Qingdao City; Jiangsu Province: Nantong City, Yancheng City; Zhejiang Province: Zhoushan City; Guangdong Province: Huizhou City, Shenzhen City; Guangxi Zhuang Autonomous Region: Beihai City; Hainan Province: Sanya City
Table 2. Statistics.
VariableObsMinp50MaxMeanStd. Dev
MEC6890010.1940.396
ISU6890.1560.4590.7920.4650.105
Lnperincome6896.7788.63110.2718.5300.558
Lnedu6893.5405.4486.2945.4400.314
Lnenterprises6892.9967.4409.8417.2911.237
Lnpop6894.9046.3117.9236.3230.564
Lnfdi6890.0693.3985.2703.2441.052
STRAD6895.9566.6387.8366.6520.330
GTI68903.1357.8573.2961.888
GTFP6890.8350.9981.1830.9990.020
GI6890.0090.0450.5020.0810.095
WQ6891252.8141.567
LnAP51700.8012.0610.8370.347
LnDIN51703.0605.4413.1650.683
Table 3. Baseline regression.
(1)(2)
ISUISU
MEC0.0187 ***0.0162 ***
(0.00635)(0.00607)
Lnperincome −0.0134
(0.0184)
Lnedu 0.0050
(0.0129)
Lnenterprises −0.0750 ***
(0.0109)
Lnpop −0.0043
(0.0314)
Lnfdi 0.0070 **
(0.0029)
Constant0.420 ***1.0440 ***
(0.00582)(0.2120)
Observations689689
R-squared0.39970.4700
Time-fixed effectYesYes
City-fixed effectYesYes
Notes: this table shows estimates of Equation (1). All the variables are defined in Appendix A. The corresponding standard errors are reported in parentheses. *** and ** represent statistical significance at the 1% and 5% level, respectively.
Table 4. Balance test of PSM.
VariableUnmatched/MatchedMean Bias
(%)
Reduct
Bias (%)
t-Test
TreatedControlt
LnperincomeU8.5358.5271.500 0.190
M8.5358.4937.600−417.6000.910
LneduU5.3955.471−24.80 −3.170
M5.3955.421−8.40066.200−1.090
LnenterprisesU7.4077.21015.80 2.070
M7.4077.3365.70064.0000.680
LnpopU6.4106.26226.90 3.430
M6.4106.451−7.40072.500−1.000
LnfdiU3.4173.12128.70 3.670
M3.4173.3972.00093.2000.260
Notes: this table shows balance tests using PSM to address endogeneity arising from selection bias. All the variables are defined in Appendix A.
Table 5. Robustness checks.
Variable(1)(2)(3)(4)
ISUISUSTRADSTRAD
MEC0.0168 ***0.0138 **0.0240 **0.0243 **
(0.0062)(0.0059)(0.0117)(0.0117)
Lnperincome −0.0029 0.0370
(0.0188) (0.0355)
Lnedu −0.0002 −0.0285
(0.0148) (0.0250)
Lnenterprises −0.0696 *** −0.0616 ***
(0.0110) (0.0211)
Lnpop −0.0071 −0.1510 **
(0.0305) (0.0606)
Lnfdi 0.0071 ** −0.0031
(0.0030) (0.0056)
Constant0.4210 ***0.9720 ***6.4940 ***7.7600 ***
(0.0056)(0.2130)(0.0107)(0.4100)
R-squared0.42900.48500.67900.6910
Observations659659689689
Time-fixed effectYesYesYesYes
City-fixed effectYesYesYesYes
Notes: this table shows estimates of robustness tests. All the variables are defined in Appendix A. The corresponding standard errors are reported in parentheses. *** and ** represent statistical significance at the 1% and 5% level, respectively.
Table 6. Mechanism analysis.
Variables(1)(2)(3)
GTIGTFPGI
MEC0.3330 ***0.0058 *0.0017 *
(0.0727)(0.0030)(0.0009)
Lnperincome0.3430−0.0291 ***−0.0030
(0.2200)(0.0092)(0.0027)
Lnedu−0.2360−0.0164 **−0.0004
(0.1550)(0.0064)(0.0019)
Lnenterprises0.10000.00680.0029 *
(0.1310)(0.0054)(0.0016)
Lnpop−0.3450−0.00010.0132 ***
(0.3770)(0.0156)(0.0046)
Lnfdi0.1040 ***0.0012−0.0001
(0.0351)(0.0015)(0.0004)
Constant1.35801.2590 ***0.0016
(2.546)(0.1060)(0.0311)
Observations689689689
R-squared0.79000.09600.0730
Time-fixed effectYesYesYes
City-fixed effectYesYesYes
Notes: this table shows estimates of Equation (1). All the variables are defined in Appendix A. The corresponding standard errors are reported in parentheses. ***, **, and * represent statistical significance at the 1%, 5%, and 10% level, respectively.
Table 7. Coastal water pollution.
Variable(1)(2)(3)(4)(5)(6)(7)(8)(9)
WQWQWQLnAPLnAPLnAPLnDINLnDINLnDIN
MEC0.24905.07300.1500−0.2660 ***0.0090−0.2550 ***−0.07751.4610−0.0463
(0.3510)(3.7900)(0.2280)(0.0760)(1.4810)(0.0497)(0.1240)(2.4150)(0.0812)
MEC×GTI−0.1480 ** 0.0168 0.0157
(0.0737) (0.0166) (0.0271)
MEC×GTFP −5.4550 −0.2060 −1.4730
(3.7760) (1.4810) (2.4140)
MEC×GI −6.9830 *** 0.7650 0.4450
(2.2810) (0.4970) (0.8120)
Constant−3.6280−2.1690−7.13305.8800 ***5.6830 ***6.3130 ***5.9310 ***5.7340 ***6.1150 ***
(5.0290)(4.9850)(5.2140)(1.3370)(1.3250)(1.3830)(2.1820)(2.1590)(2.2600)
Observations689689689517517517517517517
R-squared0.06700.06500.07500.20900.20700.21100.02200.02200.0220
Control VariableYesYesYesYesYesYesYesYesYes
Time-fixed effectYesYesYesYesYesYesYesYesYes
City-fixed effectYesYesYesYesYesYesYesYesYes
Notes: this table shows estimates of moderating effects on coastal water pollution. All the variables are defined in Appendix A. The corresponding standard errors are reported in parentheses. *** and ** represent statistical significance at the 1% and 5% level, respectively.
Table 8. Heterogeneity.
Variable(1)(2)(3)(4)(5)(6)
ISU
Bohai Rim Economic ZoneYangtze River Delta Economic ZonePearl River Delta Economic ZoneOtherEP Priority CitiesNon-Priority Cities
MEC0.01530.00060.0417 ***0.01080.0333 **0.0041
(0.0101)(0.0080)(0.0141)(0.0144)(0.0138)(0.0060)
Constant0.53201.1050 **0.3870−2.3870 ***2.7730 ***0.1620
(0.8520)(0.4450)(0.3150)(0.8090)(0.6280)(0.2070)
Control VariableYesYesYesYesYesYes
Time-fixed effectYesYesYesYesYesYes
City-fixed effectYesYesYesYesYesYes
R-squared0.69500.74900.41700.36100.44100.6080
Observations221143182143286403
Notes: this table shows estimates of Equation (1). All the variables are defined in Appendix A. The corresponding standard errors are reported in parentheses. *** and ** represent statistical significance at the 1%and 5% level, respectively.
Disclaimer/Publisher’s Note: The statements, opinions and data contained in all publications are solely those of the individual author(s) and contributor(s) and not of MDPI and/or the editor(s). MDPI and/or the editor(s) disclaim responsibility for any injury to people or property resulting from any ideas, methods, instructions or products referred to in the content.

