

Residents’ Perception of Flood Prediction Products: The Study of NASA’s Satellite Enhanced Snowmelt Flood Prediction


Abstract
1. Introduction
1.1. Theoretical and Applied Frameworks
1.2. Risk Assessment (Risk-Related Variables)
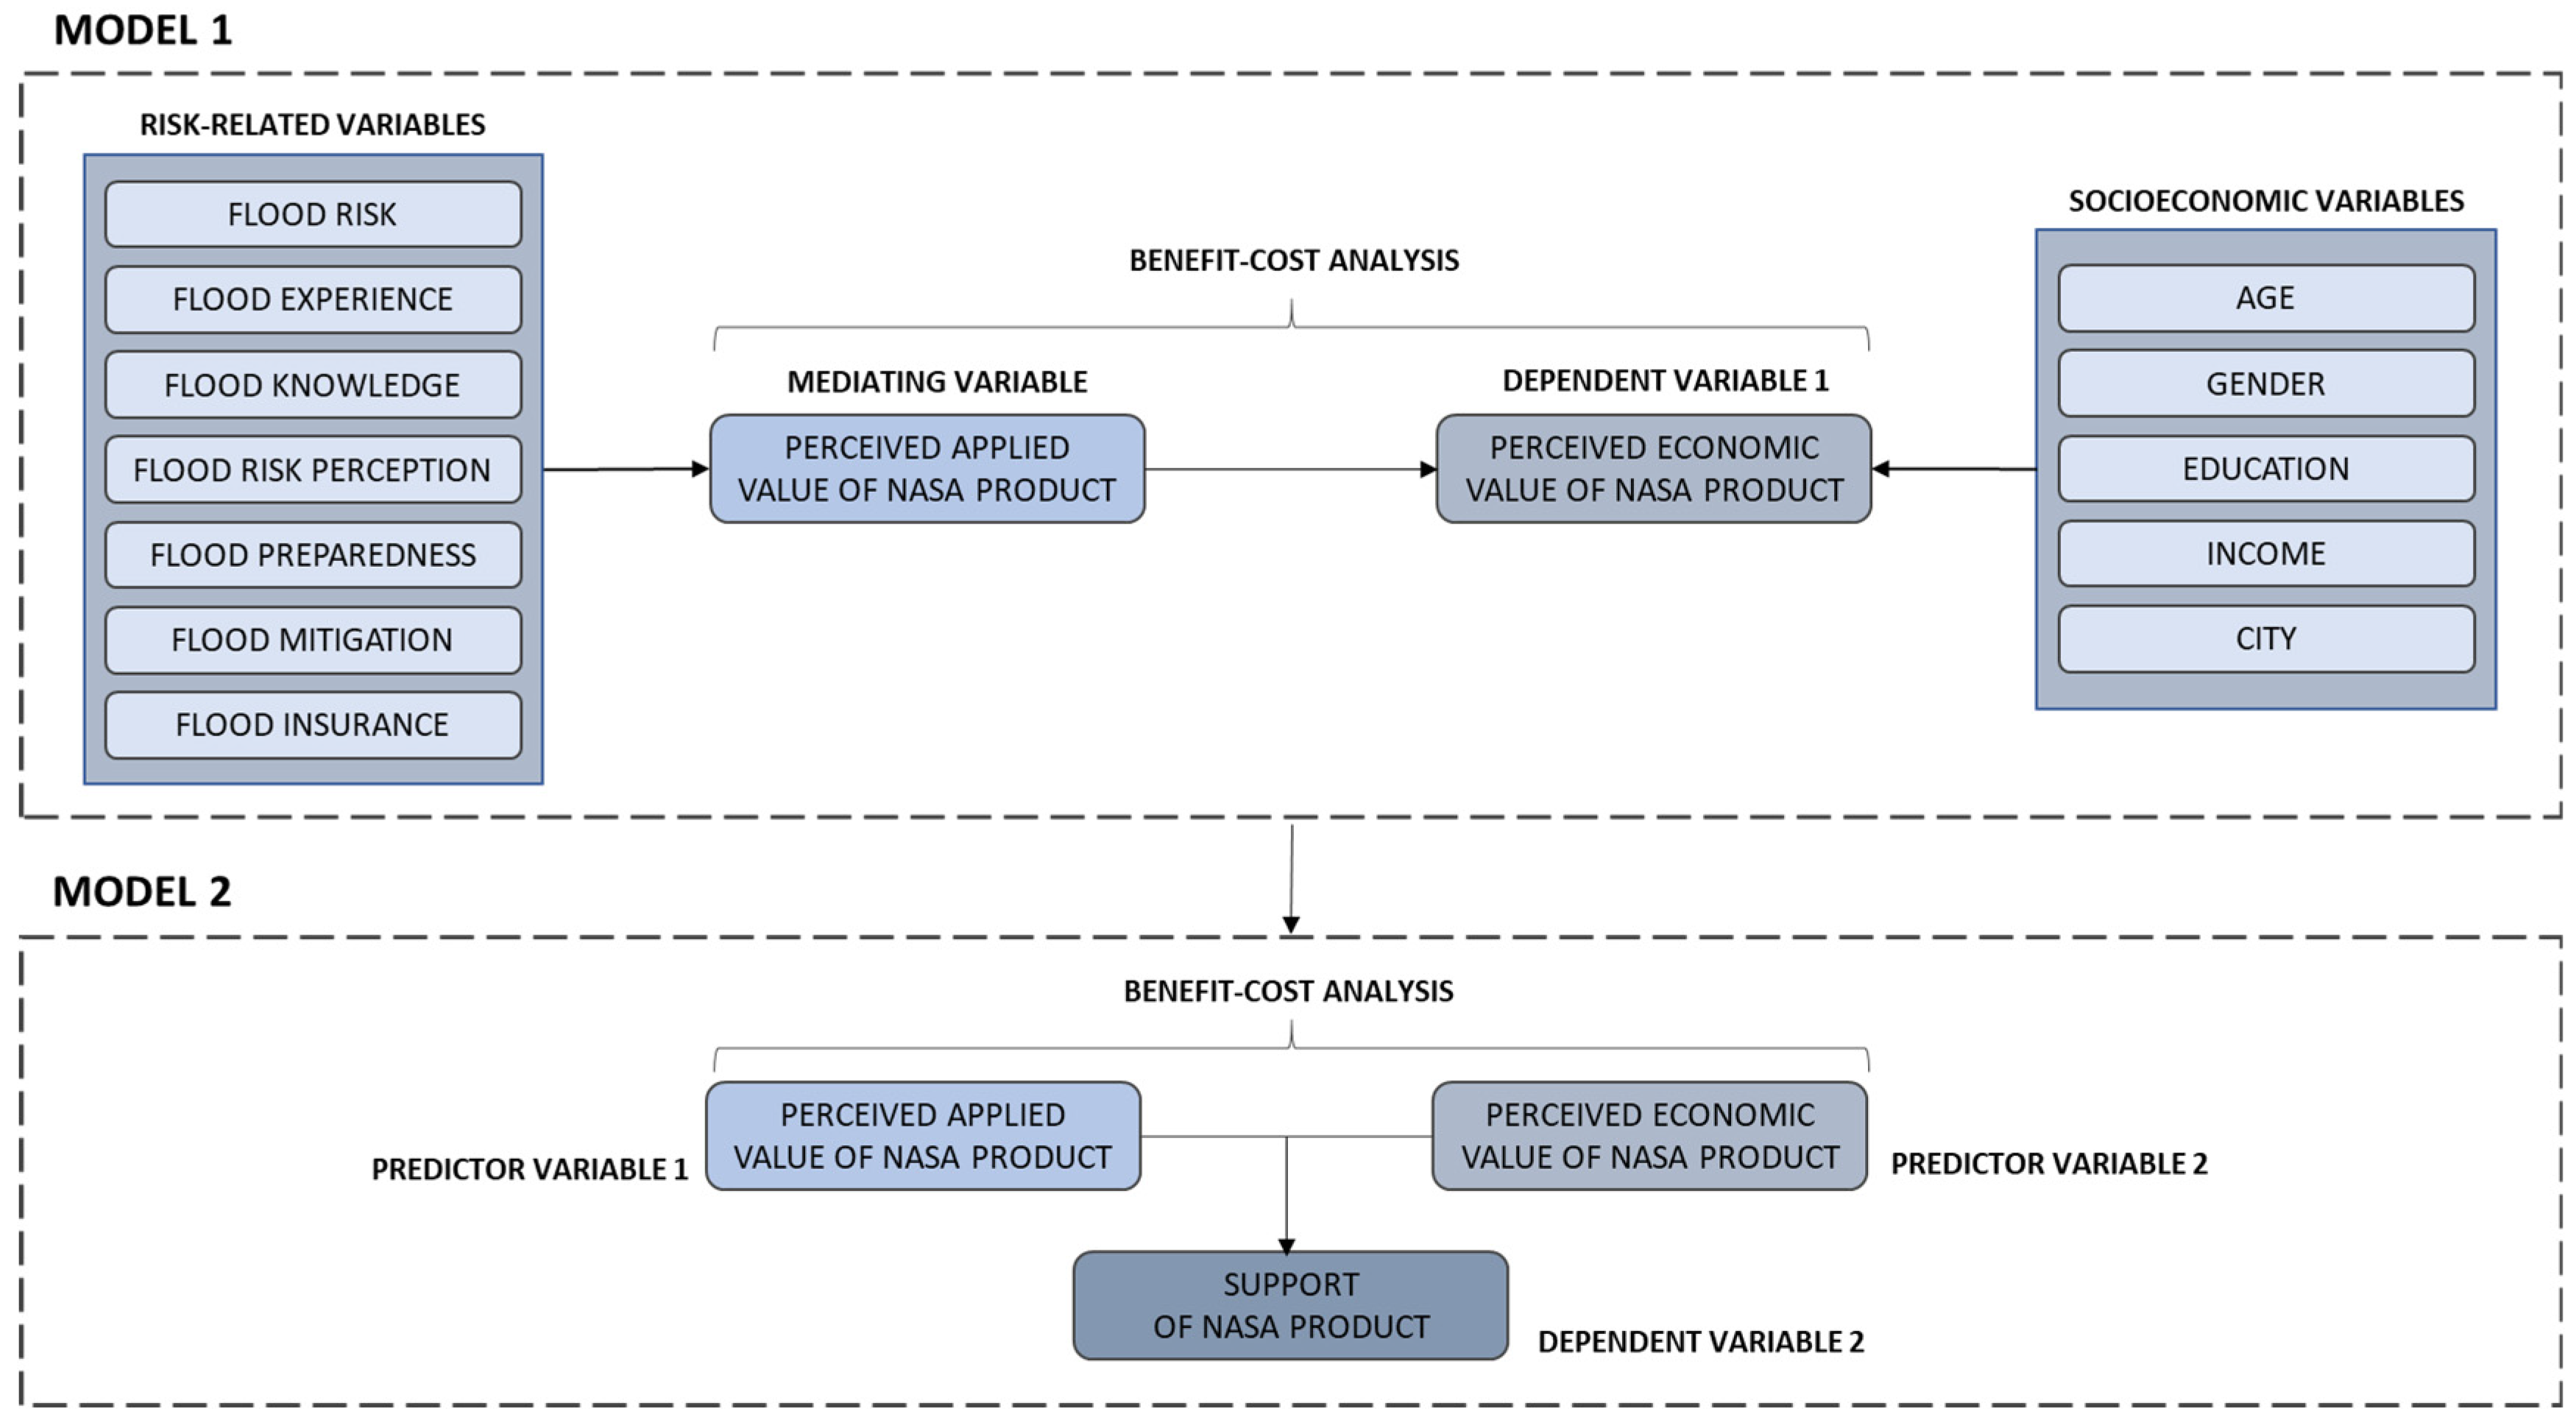
1.3. Empirical Models
2. Methodology
2.1. Dependent Variables
2.2. Independent Variables
3. Analyses and Results
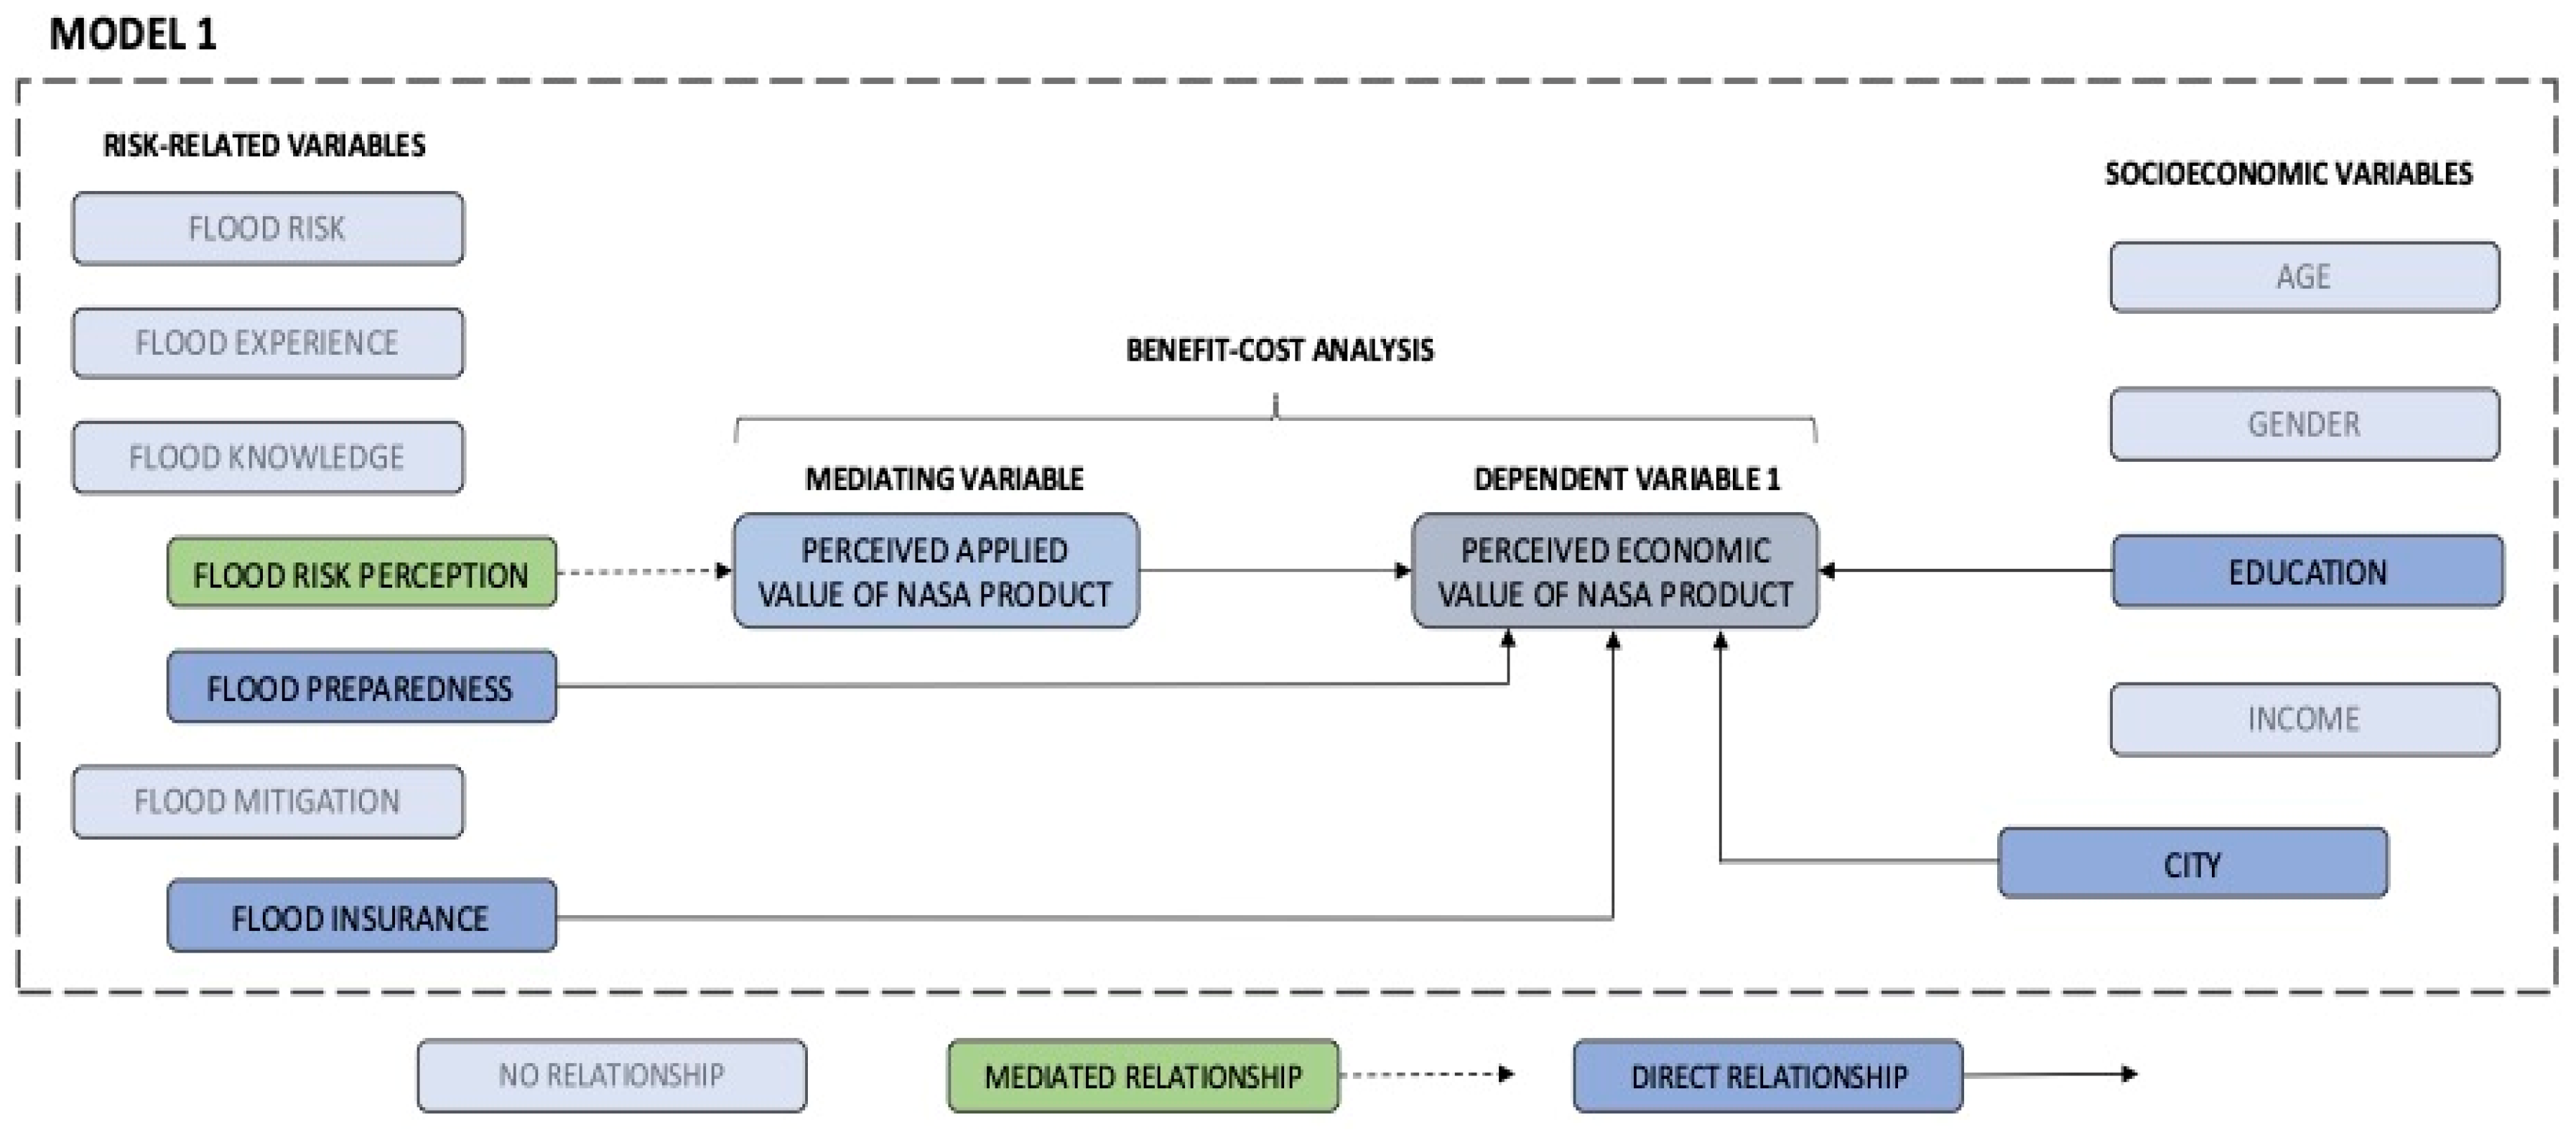
3.1. Model 1: Mediation Model Between Risk-Related Variables and PEV
3.2. Model 2: Support of NASA Product
4. Discussion
Author Contributions
Funding
Institutional Review Board Statement
Informed Consent Statement
Data Availability Statement
Acknowledgments
Conflicts of Interest
References
- Kousky, C.; Kunreuther, H.; LaCour-Little, M.; Wachter, S. Flood risk and the US housing market. J. Hous. Res. 2020, 29 (Suppl. S1), S3–S24. [Google Scholar] [CrossRef]
- Cigler, B.A. US floods: The necessity of mitigation. State Local Gov. Rev. 2017, 49, 127–139. [Google Scholar] [CrossRef]
- Schwab Sandler, D.; Brower, D.J. Hazard Mitigation and Preparedness: An Introductory Text for Emergency Management and Planning Professionals, 2nd ed.; CRC Press: Boca Raton, FL, USA, 2017. [Google Scholar] [CrossRef]
- Lim, S.H.; Ge, Y.; Jacobs, J.M.; Jia, X. Measuring the economic benefits of advanced technology use for river flood forecasting. J. Flood Risk Manag. 2022, 15, e12781. [Google Scholar] [CrossRef]
- NASA Earth Observatory. Another Flood on the Red River. 2020. Available online: https://earthobservatory.nasa.gov/images/146616/another-flood-on-the-red-river (accessed on 1 June 2022).
- Red River Basin Commission (RRBC). Long Term Flood Solutions for the Red River Basin. 2011. Available online: https://www.redriverbasincommission.org/resources (accessed on 1 June 2022).
- United States Geological Survey (USGS). Red River of the North at Grand Forks, North Dakota—129 Years. Available online: https://www.usgs.gov/centers/dakota-water-science-center/red-river-north-grand-forks-north-dakota-129-years (accessed on 1 June 2022).
- Minnesota Pollution Control Agency. Upper Red River of the North Watershed Monitoring and Assessment Report. 2013. Available online: https://www.pca.state.mn.us/sites/default/files/wq-ws3-09020104b.pdf (accessed on 1 June 2022).
- National Operational Hydrologic Remote Sensing Center (2004) Snow Data Assimilation System (SNODAS) Data Products at, N.S.I.D.C.; Version 1 [2003–2016] Boulder Colorado, U.S.A. NSIDC: National Snow and Ice Data Center. Available online: https://nsidc.org/data/g02158 (accessed on 15 July 2017).
- Carroll, T.; Cline, D.; Fall, G.; Nilsson, A.; Li, L.; Rost, A. NOHRSC Operations and the Simulation of Snow Cover Properties for the Coterminous U.S. In Proceedings of the 69th Annual Meeting of the Western Snow Conference, Sun Valley, ID, USA, 17–19 April 2001; pp. 1–14. [Google Scholar]
- Pielke, R.A. Who decides? Forecasts and responsibilities in the 1997 Red River flood. Appl. Behav. Sci. Review. 1999, 7, 83–101. [Google Scholar] [CrossRef]
- Tuttle, S.E.; Jacobs, J.M.; Vuyovich, C.M.; Olheiser, C.; Cho, E. Intercomparison of snow water equivalent observations in the Northern Great Plains. Hydrol. Process. 2018, 32, 817–829. [Google Scholar] [CrossRef]
- Schroeder, R.; Jacobs, J.M.; Cho, E.; Olheiser, C.M.; DeWeese, M.M.; Connelly, B.A.; Cosh, M.H.; Jia, X.; Vuyovich, C.M.; Tuttle, S.E. Comparison of satellite passive microwave with modeled snow water equivalent estimates in the Red River of the North Basin. IEEE J. Sel. Top. Appl. Earth Obs. Remote Sens. 2019, 12, 3233–3246. [Google Scholar] [CrossRef]
- NASA Earth Science, Applied Science Program. NASA Measuring Socioeconomic Impacts of Earth Observations: A Primer. 2012. Available online: https://ccmc.gsfc.nasa.gov/publicData/workshops/ICCMC-LWS-2017/_04-03-MONDAY-plenaries/Friedl_recommended_ESD%20-%20Primer%20on%20Socioeconomic%20Impacts.pdf (accessed on 1 June 2022).
- Rollins, K.S.; Shaykewich, J. Using willingness-to-pay to assess the economic value of weather forecasts for multiple commercial sectors. Meteorol. Appl. A J. Forecast. Pract. Appl. Train. Tech. Model. 2003, 10, 31–38. [Google Scholar] [CrossRef]
- Slovic, P. Perception of risk. Science 1987, 236, 280–285. [Google Scholar] [CrossRef]
- Mileti, D.S.; Sorensen, J.H. Natural hazards and precautionary behavior. In Taking Care: Understanding and Encouraging Self-Protective Behavior; Weinstein, N.D., Ed.; Cambridge University Press: Cambridge, UK, 1987; pp. 189–207. [Google Scholar] [CrossRef]
- Lindell, M.K.; Perry, R.W. The protective action decision model: Theoretical modifications and additional evidence. Risk Anal. Int. J. 2012, 32, 616–632. [Google Scholar] [CrossRef]
- Douthat, T.H.; Akhter, F.; Sanderson, R.; Penn, J. Stakeholder perceptions about incorporating externalities and vulnerability into benefit-cost analysis tools for watershed flood risk mitigation. Sustainability 2023, 15, 7473. [Google Scholar] [CrossRef]
- Federal Emergency Management Agency (FEMA). Benefit-Cost Analysis. 2024. Available online: https://www.fema.gov/grants/tools/benefit-cost-analysis (accessed on 5 March 2025).
- Martin, W.E.; Martin, I.M.; Kent, B. The role of risk perceptions in the risk mitigation process: The case of wildfire in high risk communities. J. Environ. Manag. 2009, 91, 489–498. [Google Scholar] [CrossRef] [PubMed]
- Baron, R.M.; Kenny, D.A. The moderator–mediator variable distinction in social psychological research: Conceptual, strategic, and statistical considerations. J. Personal. Soc. Psychol. 1986, 51, 1173. [Google Scholar] [CrossRef] [PubMed]
- MacKinnon, D.P.; Fairchild, A.J.; Fritz, M.S. Mediation analysis. Annu. Rev. Psychol. 2007, 58, 593–614. [Google Scholar] [CrossRef] [PubMed]
- Letson, D.; Sutter, D.S.; Lazo, J.K. Economic value of hurricane forecasts: An overview and research needs. Nat. Hazards Rev. 2007, 8, 78–86. [Google Scholar] [CrossRef]
- Grover, H.; Lindell, M.K.; Brody, S.D.; Highfield, W.E. Correlates of flood hazard adjustment adoption in four coastal communities. Int. J. Disaster Risk Reduct. 2022, 68, 102728. [Google Scholar] [CrossRef]
- Highfield, W.E.; Norman, S.A.; Brody, S.D. Examining the 100-year floodplain as a metric of risk, loss, and household adjustment. Risk Anal. Int. J. 2013, 33, 186–191. [Google Scholar] [CrossRef]
- Kousky, C.; Kunreuther, H.; Xian, S.; Lin, N. Adapting our flood risk policies to changing conditions. Risk Anal. Int. J. 2021, 41, 1739–1743. [Google Scholar] [CrossRef]
- Faruk, M.O.; Maharjan, K.L. The determinants of farmers’ perceived flood risk and their flood adaptation assessments: A study in a char-land area of Bangladesh. Sustainability 2023, 15, 13727. [Google Scholar] [CrossRef]
- Diakakis, M.; Skordoulis, M.; Kyriakopoulos, P. Public perceptions of flood and extreme weather early warnings in Greece. Sustainability 2022, 14, 10199. [Google Scholar] [CrossRef]
- Terpstra, T.; Lindell, M.K.; Gutteling, J.M. Does communicating (flood) risk affect (flood) risk perceptions? Results of a quasi-experimental study. Risk Anal. Int. J. 2009, 29, 1141–1155. [Google Scholar] [CrossRef]
- Lazo, J.K.; Waldman, D.M.; Morrow, B.H.; Thacher, J.A. Household evacuation decision making and the benefits of improved hurricane forecasting: Developing a framework for assessment. Weather Forecast. 2010, 25, 207–219. [Google Scholar] [CrossRef]
- Poussin, J.K.; Botzen, W.W.; Aerts, J.C. Factors of influence on flood damage mitigation behaviour by households. Environ. Sci. Policy 2014, 40, 69–77. [Google Scholar] [CrossRef]
- Sayers, P.; Li, Y.; Galloway, G.; Penning-Rowsell, E.; Shen, F.; Kang, W.; Chen, Y.; Le Quesne, T. Flood Risk Management: A Strategic Approach; UNESCO: Paris, France, 2013. [Google Scholar]
- Wang, L.; Cui, S.; Li, Y.; Huang, H.; Manandhar, B.; Nitivattananon, V.; Fang, X.; Huang, W. A review of the flood management: From flood control to flood resilience. Heliyon 2022, 8, e11763. [Google Scholar] [CrossRef]
- Aerts, J.C.; Botzen, W.J.; Clarke, K.C.; Cutter, S.L.; Hall, J.W.; Merz, B.; Michel-Kerjan, E.; Mysiak, J.; Surminski, S.; Kunreuther, H. Integrating human behaviour dynamics into flood disaster risk assessment. Nat. Clim. Change 2018, 8, 193–199. [Google Scholar] [CrossRef]
- Federal Emergency Management Agency (FEMA). Flood Insurance. 2023. Available online: https://www.fema.gov/flood-insurance#:~:text=The%20National%20Flood%20Insurance%20Program%20(NFIP)%20is%20managed%20by%20the,How%20to%20Purchase%20Flood%20Insurance (accessed on 5 March 2025).
- Landry, C.; Turner, D. Risk perceptions and flood insurance: Insights from homeowners on the Georgia coast. Sustainability 2020, 12, 10372. [Google Scholar] [CrossRef]
- Lindell, M.K.; Whitney, D. Correlates of household seismic hazard adjustment adoption. Risk Anal. 2000, 20, 13–25. [Google Scholar] [CrossRef] [PubMed]
- Tierney, K.J.; Lindell, M.K.; Perry, R.W. Facing the unexpected: Disaster preparedness and response in the United States. Disaster Prev. Manag. Int. J. 2002, 11, 222. [Google Scholar] [CrossRef]
- Dillman, D.A.; Smyth, J.D.; Christian, L.M. Internet, Phone, Mail, and Mixed Mode Surveys: The Tailored Design Method, 4th ed.; John Wiley & Sons Inc.: Hoboken, NJ, USA, 2014. [Google Scholar]
- Greene, W. Econometric Analysis, 7th ed.; Prentice Hall/Pearson: Upper Saddle River, NJ, USA, 2012. [Google Scholar]
- Harrison, G.W.; Lau, M.I.; Rutström, E.E. Estimating risk attitudes in Denmark: A field experiment. Scand. J. Econ. 2007, 109, 341–368. [Google Scholar] [CrossRef]
- Shreve, C.M.; Kelman, I. Does mitigation save? Reviewing cost-benefit analyses of disaster risk reduction. Int. J. Disaster Risk Reduct. 2014, 10, 213–235. [Google Scholar] [CrossRef]
- Kind, J.; Botzen, W.W.; Aerts, J.C. Social vulnerability in cost-benefit analysis for flood risk management. Environ. Dev. Econ. 2020, 25, 115–134. [Google Scholar] [CrossRef]
- Dottori, F.; Mentaschi, L.; Bianchi, A.; Alfieri, L.; Feyen, L. Cost-effective adaptation strategies to rising river flood risk in Europe. Nat. Clim. Chang. 2023, 13, 196–202. [Google Scholar] [CrossRef]
- Markanday, A.; Galarraga, I. The cognitive and experiential effects of flood risk framings and experience, and their influence on adaptation investment behaviour. Clim. Risk Manag. 2021, 34, 100359. [Google Scholar] [CrossRef] [PubMed]


| Variables | (1) | (2) | (3) | (4) | (5) | (6) | (7) | (8) | (9) | (10) | (11) | (12) | (13) | (14) | (15) | (16) | (17) | (18) |
|---|---|---|---|---|---|---|---|---|---|---|---|---|---|---|---|---|---|---|
| (1) Support | 1 | |||||||||||||||||
| (2) PEV | 0.31 | 1 | ||||||||||||||||
| (3) PAV | 0.34 | 0.34 | 1 | |||||||||||||||
| (4) Flood Risk | 0.01 | 0.05 | 0.16 | 1 | ||||||||||||||
| (5) Flood Knowledge | 0.08 | −0.01 | −0.05 | −0.11 | 1 | |||||||||||||
| (6) Flood Experience | 0.02 | −0.01 | 0.09 | 0.06 | 0.30 | 1 | ||||||||||||
| (7) Flood Risk Perception | 0.18 | 0.18 | 0.42 | 0.19 | 0.06 | 0.11 | 1 | |||||||||||
| (8) Preparedness | 0.04 | −0.09 | 0.02 | 0.06 | 0.26 | 0.18 | 0.14 | 1 | ||||||||||
| (9) Mitigation | −0.04 | −0.08 | −0.05 | 0.01 | 0.10 | 0.14 | −0.04 | 0.20 | 1 | |||||||||
| (10) Insurance | 0.00 | 0.15 | 0.15 | 0.48 | 0.01 | 0.03 | 0.18 | 0.07 | −0.05 | 1 | ||||||||
| (11) Age | −0.14 | −0.07 | −0.11 | 0.07 | −0.02 | 0.12 | −0.08 | 0.06 | 0.08 | −0.00 | 1 | |||||||
| (12) Gender | 0.01 | 0.08 | 0.06 | −0.07 | −0.03 | 0.01 | 0.04 | −0.01 | 0.00 | −0.01 | −0.07 | 1 | ||||||
| (13) Education | 0.11 | 0.19 | 0.04 | −0.01 | 0.11 | −0.09 | 0.17 | −0.00 | −0.12 | 0.01 | −0.14 | −0.04 | 1 | |||||
| (14) Income | 0.06 | 0.15 | 0.02 | −0.03 | 0.10 | −0.00 | 0.05 | 0.02 | −0.04 | 0.05 | −0.20 | −0.15 | 0.30 | 1 | ||||
| (15) West Fargo | −0.09 | −0.08 | −0.09 | −0.09 | −0.01 | −0.21 | −0.10 | −0.05 | −0.17 | −0.07 | −0.07 | 0.02 | 0.02 | 0.09 | 1 | |||
| (16) Moorhead | 0.14 | 0.06 | −0.04 | −0.12 | 0.03 | −0.02 | −0.03 | 0.03 | 0.04 | −0.07 | 0.00 | −0.03 | −0.09 | 0.01 | 0.16 | 1 | ||
| (17) Grand Forks | −0.00 | −0.13 | 0.10 | 0.01 | 0.10 | 0.39 | 0.04 | 0.08 | 0.06 | −0.00 | 0.14 | 0.02 | −0.09 | −0.11 | −0.16 | −0.21 | 1 | |
| (18) East Grand Forks | −0.03 | −0.14 | 0.03 | −0.02 | −0.03 | 0.04 | 0.00 | −0.17 | −0.00 | 0.01 | −0.08 | −0.08 | −0.10 | −0.05 | −0.05 | −0.07 | −0.07 | 1 |
| Variables | Ordered Logistic Regression | Interval Regression | |||
|---|---|---|---|---|---|
| Coef. | p > z | Coef. | p > z | ||
| Risk-Related Variables | |||||
| Flood Risk | −0.1804854 | 0.586 | −0.1399995 | 0.894 | |
| Flood Knowledge | −0.0630362 | 0.678 | 0.0231417 | 0.962 | |
| Flood Experience | 0.4648496 | 0.407 | 1.101521 | 0.530 | |
| Flood Risk Perception | 0.7786564 | 0.008 *** | 1.361854 | 0.148 | |
| Preparedness | −1.303235 | 0.035 ** | −3.865661 | 0.043 ** | |
| Mitigation | −0.2091166 | 0.666 | −0.816733 | 0.602 | |
| Insurance | 0.8020452 | 0.040 ** | 1.963369 | 0.114 | |
| Socioeconomic Variables | |||||
| Age | −0.078388 | 0.656 | 0.0688766 | 0.901 | |
| Gender | 0.4700356 | 0.130 | 1.06356 | 0.285 | |
| Education | 0.1933892 | 0.220 | 0.8409217 | 0.091 * | |
| Income | 0.1379197 | 0.192 | 0.4861878 | 0.137 | |
| West Fargo | −0.6475869 | 0.140 | −2.010479 | 0.138 | |
| Moorhead | 0.157751 | 0.656 | 0.6928277 | 0.539 | |
| Grand Forks | −0.6699317 | 0.071 * | −2.423807 | 0.043 ** | |
| East Grand Forks | −2.806116 | 0.016 ** | −5.586335 | 0.041 ** | |
| Cons | 0.1388899 | 0.894 | |||
| Ordered Logistic Regression | Interval Regression | ||||
| : 41.42 *** Akaike’s information criterion (AIC): 725.671 | : 30.67 *** | ||||
| Schwarz’s Bayesian information criterion (BIC): 796.060 | Mean predicted PEV: $5.029 | ||||
| Variables | OLS Regression | |||
|---|---|---|---|---|
| Coef. | Std. Err. | p > t | ||
| Risk-Related Variables | ||||
| Flood Risk | 0.1246805 | 0.1329033 | 0.349 | |
| Flood Knowledge | −0.0736689 | 0.0610064 | 0.229 | |
| Flood Experience | 0.1381029 | 0.2221467 | 0.535 | |
| Flood Risk Perception | 0.6767283 | 0.1194154 | 0.000 *** | |
| Preparedness | −0.076446 | 0.2424903 | 0.753 | |
| Mitigation | −0.0862088 | 0.1988598 | 0.665 | |
| Insurance | 0.0926968 | 0.1572196 | 0.556 | |
| Socioeconomic Variables | ||||
| Age | −0.1063598 | 0.0703202 | 0.132 | |
| Gender | 0.0799444 | 0.1261931 | 0.132 | |
| Education | −0.0143187 | 0.0630566 | 0.821 | |
| Income | 0.0090785 | 0.0414207 | 0.827 | |
| West Fargo | −0.104762 | 0.1722813 | 0.544 | |
| Moorhead | −0.0057688 | 0.142905 | 0.968 | |
| Grand Forks | 0.1768769 | 0.1522515 | 0.247 | |
| East Grand Forks | 0.1081676 | 0.3491642 | 0.757 | |
| Cons | 1.248779 | 0.6267125 | 0.048 ** | |
| R2 | 0.2175 | |||
| Adjusted R2 | 0.1573 | |||
| Variables | Ordered Logistic Regression | Interval Regression | ||
|---|---|---|---|---|
| Coef. | p > z | Coef. | p > z | |
| PAV | 0.8926713 | 0.000 *** | 2.171059 | 0.000 *** |
| Cons | −0.0007 | 1.000 | ||
| Ordered Logistic Regression : 31.87 *** Akaike’s information criterion (AIC): 707.213 Schwarz’s Bayesian information criterion (BIC): 730.676 | Interval Regression : 17.02 *** Mean predicted PEV: $5.031 | |||
| Variables | Ordered Logistic Regression | Interval Regression | |||
|---|---|---|---|---|---|
| Coef. | p > z | Coef. | p > z | ||
| PAV | 0.907561 | 0.000 *** | 2.169246 | 0.000 *** | |
| Risk-Related Variables | |||||
| Flood Risk | −0.4038577 | 0.234 | −0.41162 | 0.684 | |
| Flood Knowledge | −0.0128678 | 0.934 | 0.1806315 | 0.697 | |
| Flood Experience | 0.4072686 | 0.479 | 0.8129701 | 0.630 | |
| Flood Risk Perception | 0.2290778 | 0.469 | −0.1098682 | 0.910 | |
| Preparedness | −1.292235 | 0.038 ** | −3.704483 | 0.044 ** | |
| Mitigation | −0.1284437 | 0.793 | −0.6310746 | 0.675 | |
| Insurance | 0.7974848 | 0.044 ** | 1.759469 | 0.142 | |
| Socioeconomic Variables | |||||
| Age | −0.0025225 | 0.989 | 0.3031428 | 0.572 | |
| Gender | 0.3923441 | 0.206 | 0.8906143 | 0.353 | |
| Education | 0.2263433 | 0.156 | 0.8716287 | 0.069 * | |
| Income | 0.1379159 | 0.194 | 0.4634811 | 0.141 | |
| West Fargo | −0.6515055 | 0.148 | −1.778784 | 0.173 | |
| Moorhead | 0.0917734 | 0.799 | 0.6969605 | 0.521 | |
| Grand Forks | −0.9222587 | 0.016 ** | −2.809063 | 0.015 ** | |
| East Grand Forks | −3.223654 | 0.008 *** | −5.826651 | 0.027 ** | |
| Cons | −2.553762 | 0.595 | |||
| Ordered Logistic Regression = 66.39 *** Akaike’s information criterion (AIC): 702.692 Schwarz’s Bayesian information criterion (BIC): 776.433 | Interval Regression : 46.03 *** Mean predicted PEV: $5.029 | ||||
| Variables | Coef. | Std. Err. | p > z |
|---|---|---|---|
| PEV | 0.2842218 | 0.0882719 | 0.001 *** |
| PAV | 0.792018 | 0.1894495 | 0.000 *** |
| Pseudo R2: 0.0791 Akaike’s information criterion (AIC): 515.802 Schwarz’s Bayesian information criterion (BIC): 535.914 | |||
Disclaimer/Publisher’s Note: The statements, opinions and data contained in all publications are solely those of the individual author(s) and contributor(s) and not of MDPI and/or the editor(s). MDPI and/or the editor(s) disclaim responsibility for any injury to people or property resulting from any ideas, methods, instructions or products referred to in the content. |
© 2025 by the authors. Licensee MDPI, Basel, Switzerland. This article is an open access article distributed under the terms and conditions of the Creative Commons Attribution (CC BY) license (https://creativecommons.org/licenses/by/4.0/).
Share and Cite
Ge, Y.; Iman, S.; Martín, Y.; Lim, S.H.; Jacobs, J.M.; Jia, X. Residents’ Perception of Flood Prediction Products: The Study of NASA’s Satellite Enhanced Snowmelt Flood Prediction. Sustainability 2025, 17, 6328. https://doi.org/10.3390/su17146328
Ge Y, Iman S, Martín Y, Lim SH, Jacobs JM, Jia X. Residents’ Perception of Flood Prediction Products: The Study of NASA’s Satellite Enhanced Snowmelt Flood Prediction. Sustainability. 2025; 17(14):6328. https://doi.org/10.3390/su17146328
Chicago/Turabian StyleGe, Yue, Sara Iman, Yago Martín, Siew Hoon Lim, Jennifer M. Jacobs, and Xinhua Jia. 2025. "Residents’ Perception of Flood Prediction Products: The Study of NASA’s Satellite Enhanced Snowmelt Flood Prediction" Sustainability 17, no. 14: 6328. https://doi.org/10.3390/su17146328
APA StyleGe, Y., Iman, S., Martín, Y., Lim, S. H., Jacobs, J. M., & Jia, X. (2025). Residents’ Perception of Flood Prediction Products: The Study of NASA’s Satellite Enhanced Snowmelt Flood Prediction. Sustainability, 17(14), 6328. https://doi.org/10.3390/su17146328