1. Introduction
Sustainable land management and the formulation of effective environmental policies critically depend on a nuanced understanding of human pressure on terrestrial ecosystems. Within the broader ecological footprint (EF) framework, which measures human demand on Earth’s biocapacity [
1], the grazing land footprint (GLF)—the specific focus of this study—emerges as a vital indicator. While the general land footprint quantifies the total terrestrial area necessary for the production of goods and the provision of environmental services [
2], the GLF specifically isolates and quantifies the demand for grazing land required to support livestock for meat, dairy, wool, and other products. This distinction is crucial, as grazing lands constitute a significant portion of global land resources, underpinning global food security, sustaining rural economies and the livelihoods of millions, and supporting immense biodiversity [
3]. However, these ecologically significant areas are increasingly vulnerable to anthropogenic pressures, including overgrazing and land degradation, as well as environmental forces like climate change, which threaten their long-term productivity and ecological integrity [
4].
Conceptually, consumption-based footprints such as the GLF provide insights into a nation’s reliance on global land resources by accounting for the terrestrial area utilized for production to meet domestic demand, regardless of where that land is geographically situated [
2,
4,
5,
6,
7,
8,
9,
10,
11,
12,
13,
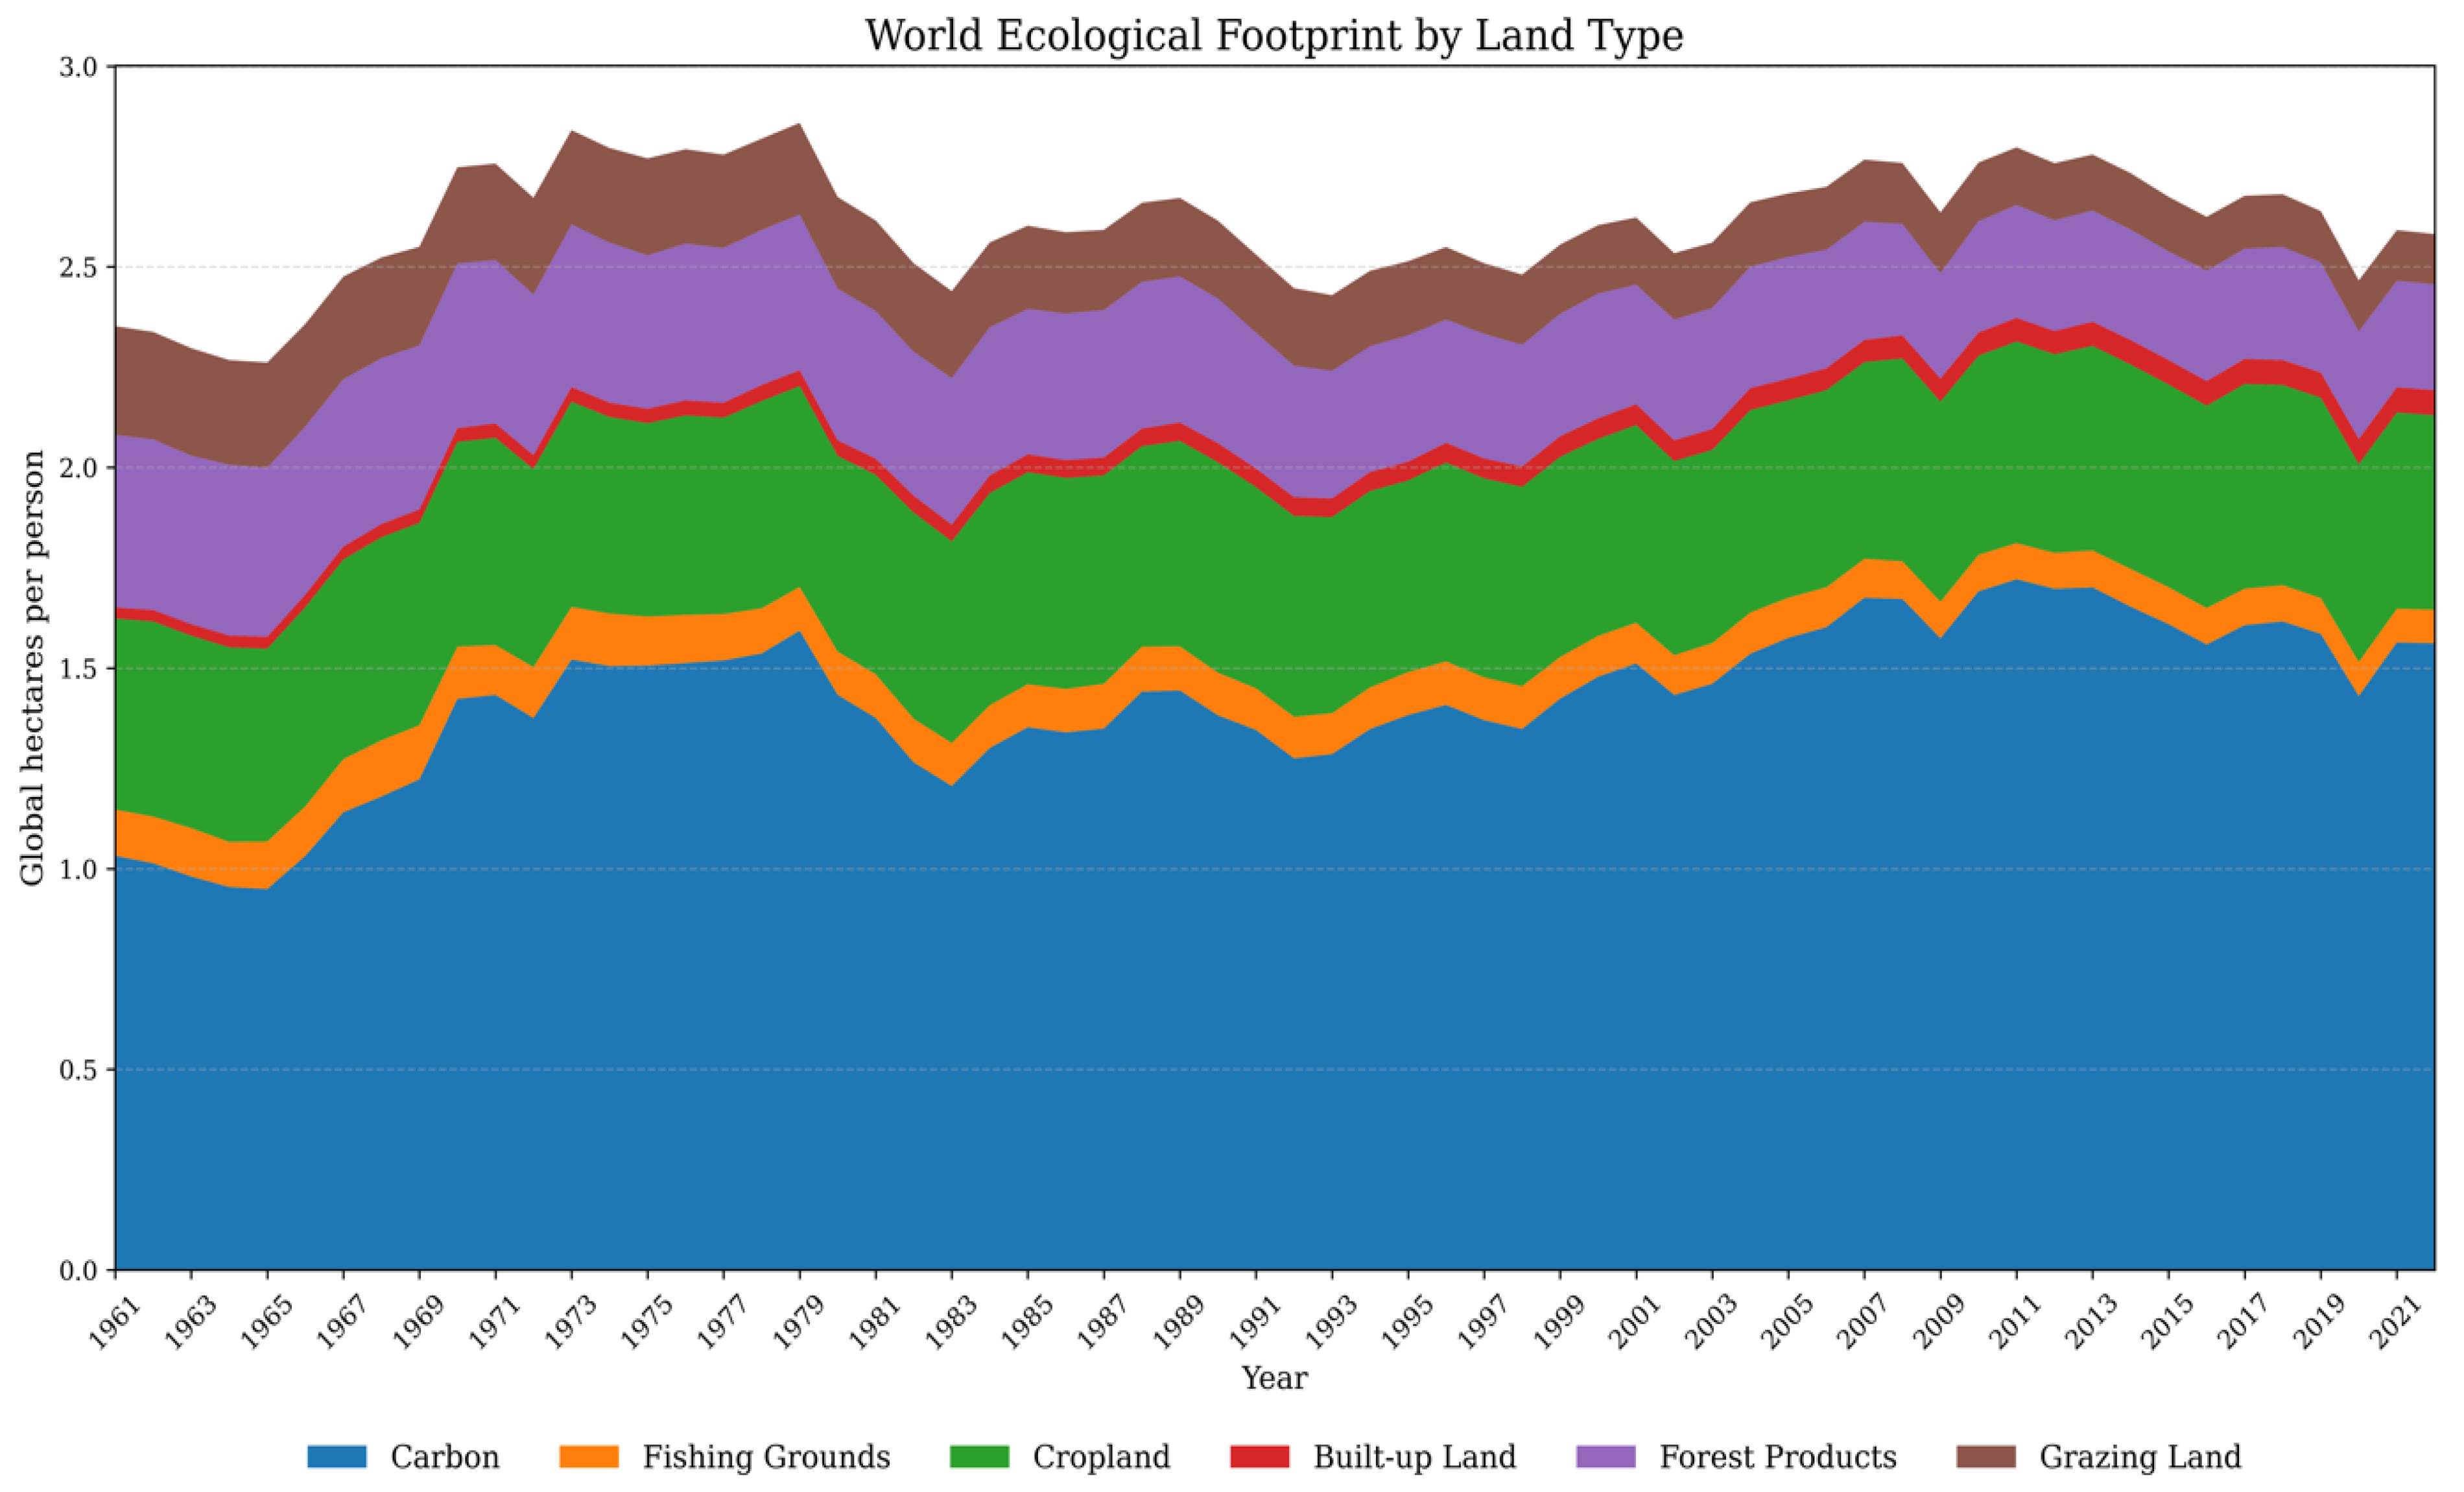
14]. This approach highlights how patterns of production and consumption can lead to resource displacement and potential environmental pressures through international trade. The composition and temporal evolution of the global per capita ecological footprint, disaggregated by its primary land types, including the crucial grazing land component, are illustrated in
Figure 1.
This figure illustrates the temporal evolution of the global average per capita ecological footprint, disaggregated into its six major land-type components from 1961 to 2021. The stacked area chart demonstrates the changing relative contributions of the carbon, fishing grounds, cropland, built-up land, forest products, and grazing land footprints to the total human demand on biocapacity. A prominent trend is the substantial increase in the carbon footprint, which has become the dominant component of the total ecological footprint over the decades. The grazing land footprint (GLF), the specific component analyzed in this study, also displays distinct dynamics over this period, highlighting the importance of understanding the unique temporal behavior of each component.
Understanding the dynamic properties of the GLF, particularly the persistence of shocks affecting it, is therefore of paramount importance not only for assessing territorial resilience but also for informing effective land-use planning. As highlighted by research in spatial planning and soil conservation [
8], strategic land-use planning plays a pivotal role in protecting productive ecosystems like grazing lands. This can be achieved by defining land uses compatible with ecological capacity, regulating urbanization processes that exert pressure on these lands, and incorporating ecological criteria into planning instruments. The persistence characteristics of the GLF—whether shocks are temporary (stationarity) or lead to lasting structural changes (non-stationarity)—directly influence how land-use planning can mitigate pressures, ensure the long-term functionality of grazing lands, and enhance their resilience against threats such as degradation, fragmentation, and climate change. To frame our central research question, it is essential to define the core concepts of stationarity and shock persistence. In time-series analysis, a series is defined as stationary if its statistical properties, such as its mean and variance, remain constant over time. For the GLF, stationarity implies that the ecosystem possesses a degree of resilience; shocks—such as droughts, policy changes, or market volatility—have only transitory effects, and the system tends to revert to its long-run equilibrium path. Conversely, a non-stationary series (specifically, one with a unit root) exhibits shock persistence. This means that shocks have permanent and cumulative effects, fundamentally altering the long-term trajectory of the series without a natural tendency to return to a previous state. The distinction between these two states is therefore not merely a technical exercise; it is fundamental to understanding ecological resilience and designing appropriate policy. This study, therefore, directly investigates a central question that has direct implications for assessing territorial resilience and guiding land-use planning: Are shocks to the GLF—whether arising from climatic events, policy interventions, or market fluctuations—transitory, a characteristic of a stationary series, or do they have permanent, cumulative effects, which is implied by a non-stationary series? The answer to this question places significant weight on territorial planning, particularly given the increasing pressure on productive ecosystems globally. If the GLF is stationary, it would imply that the ecosystem can absorb shocks and that adaptive, short-term planning interventions might be effective. Conversely, if the GLF is non-stationary, it points to lasting impacts and a reduced capacity to absorb disturbances, necessitating profound structural reforms in land-use planning to enhance resilience and steer towards sustainability.
Effective management and sustainable use of global land resources require a deep understanding of the dynamic behavior of their associated ecological footprints. In the context of ecological resource management, the evaluation of the stochastic features of the grazing land footprint offers vital insights into the effectiveness and durability of environmental regulations. The contrast between a stationary and a non-stationary GLF series has significant implications. This suggests that any shock—whether from policy changes, economic cycles, or environmental disruptions—will have a sustained influence on land pressure, which may not self-correct over time, if the GLF series is non-stationary. In this scenario, the trajectory of deterioration or misuse will not be reversed by short or one-time interventions, demanding fundamental, long-term policy frameworks. This argument has been similarly underscored in ecological footprint studies [
1,
3,
15,
16,
17,
18,
19,
20,
21,
22,
23,
24], where the existence of unit roots in EF subcomponents indicated that sustainability initiatives must be persistent and strong to be effective.
In contrast, if the GLF is stationary—such as those resulting from governmental changes, technical developments, climatic disasters, or market volatility—and transient, it would indicate that the ecosystem has a certain level of resilience, as shocks often decrease with time. This would substantiate the implementation of adaptive short- to medium-term interventions rather than permanent structural transformations. Therefore, the evaluation of unit roots is not only a statistical exercise; it also serves as a tool for inferring the temporal behavior of ecological stress and directing the development of suitable sustainability strategies.
Although time-series analyses have examined the broader ecological footprint and its various components, such as the carbon and cropland footprints, the specific dynamic properties of the grazing land footprint—particularly the persistence of shocks—have received little attention across a wide and diverse panel of countries, especially using advanced analytical methodologies. This existing knowledge gap limits our capacity to accurately model future GLF trends and to design robust, evidence-based policies for sustainable grazing land management on a global scale. Consequently, a rigorous examination of GLF stationarity is an essential preliminary step toward developing effective strategies to mitigate human pressure on these vital grazing ecosystems.
This study is the first to employ machine learning (ML)-based unit root tests in the field of grazing land footprint (GLF) stationarity, and its contributions can be summarized as follows. First, it provides what is, to our knowledge, the first comprehensive investigation into shock persistence in the GLF across an extensive panel of 92 countries. Second, it pioneers the application of an advanced, machine learning-based unit root testing framework to this crucial environmental indicator. While machine learning has been applied in broader ecological footprint contexts—for instance, Ref. [
15] used it to conclude that the aggregate ecological footprint generally exhibits mean reversion—its specific use to enhance the power and robustness of unit root tests for GLF analysis is novel. This dual innovation—a unique empirical focus on the GLF combined with a cutting-edge methodological approach—facilitates a more robust and nuanced understanding of GLF dynamics, offering valuable insights for sustainable land management and policy.
The remainder of this paper is structured as follows.
Section 2 reviews the pertinent literature.
Section 3 details the data sources and characteristics.
Section 4 elaborates on the econometric methodology, and
Section 5 presents the empirical findings. Finally,
Section 6 discusses the implications of the results and offers concluding remarks.
2. Literature Review
2.1. Empirical Evidence on Shock Persistence in Ecological Footprint Components
The ecological footprint (EF), a comprehensive metric of human demand on biocapacity [
1], comprises six primary components: cropland, fishing grounds, forest product, built-up land, carbon, and grazing land footprints [
1,
3,
15,
16,
17,
18,
19,
20,
21,
22,
25,
26,
27,
28]. Understanding the dynamic behavior of these components, especially their response to shocks, is crucial for effective environmental management. The grazing land footprint (GLF), reflecting the land area for livestock support, is particularly critical due to livestock production’s significant global land use and its linkage to land degradation and biodiversity loss [
3].
Research on shock persistence within the EF framework reveals a complex and often contradictory landscape. Studies exploring the aggregate EF frequently find non-stationarity. For instance, Ref. [
21] reported non-stationarity for the aggregate EF in the USA, and investigations into the Environmental Kuznets Curve (EKC) often presuppose non-stationarity in EF series [
10]. However, contrasting findings emerge when advanced methods are employed. When using Fourier-based and robust LM tests, refs. [
29,
30] concluded that policy shocks to the aggregate EF were largely temporary in emerging economies and Mediterranean countries. This discrepancy highlights the sensitivity of stationarity conclusions to the chosen methodology. For example, Ref. [
31] found that the stationarity of Qatar’s GLF depended on whether a standard ADF or a more advanced fractional frequency Fourier test was used. While these studies provide valuable insights into aggregate EF and methodological sensitivities, they often do not offer the granular detail needed for specific components like the GLF across a broad range of diverse countries, a gap our study addresses by focusing on the GLF in 92 nations.
Analyses of individual EF components further underscore this heterogeneity. The carbon footprint is frequently reported as non-stationary (I(1)), although accounting for structural breaks can alter this conclusion [
15,
16,
17,
25,
26,
27,
28,
32,
33,
34]. Similarly, the fishing grounds and forest products’ footprints have predominantly been found to be non-stationary, indicating permanent shock effects in most countries studied [
16,
17,
18,
35]. Results for other components, such as the cropland and built-up land footprints, also demonstrate a mixture of stationary and non-stationary behavior depending on the country group and testing framework [
1,
3,
19,
20,
21,
22,
23,
24,
29]. These component-specific studies, while important, often use varied methodologies and country samples, making direct comparisons difficult and underscoring the need for a consistent analytical approach across a large, diverse dataset for a specific component like the GLF, which our study provides.
Research targeting the specific dynamics of the grazing land footprint (GLF) is nascent, yet critically important. A notable contribution in this area comes from [
36], which investigated the stochastic characteristics of the GLF in 13 major dairy and meat-producing nations (1961–2022). Employing unit root tests that accommodate repeated, smooth structural breakdowns, their findings indicated that the GLF series in these key agricultural producer countries includes a unit root, implying that policy shocks would have a long-lasting effect and that policymakers may set targets for the series. While this study provides valuable insights into GLF stability using advanced conventional tests, its focused sample of 13 nations, primarily major agricultural producers, limits the generalizability of its findings across more diverse economic and ecological contexts. Our research differentiates itself by examining GLF shock persistence across a much broader and more heterogeneous panel of 92 countries, encompassing a wide spectrum of development stages, governance structures, and geographical regions. This extensive scope allows for a more comprehensive global assessment and the identification of systemic patterns that might be obscured in a narrower sample. Furthermore, unlike extant studies on EF components that rely on various conventional or second-generation unit root tests, our work, to our knowledge, is the first to specifically apply a machine learning (ML)-based unit root detection framework to assess the stationarity of the GLF. This methodological innovation aims to overcome some limitations of traditional tests and provide more robust insights. The critical importance of such stationarity analysis is clear: it determines whether land-use patterns are resilient or are being permanently altered by shocks, which has profound implications for policy, forecasting, and long-term sustainability.
2.2. Methodological Developments in Unit Root Testing: From Traditional Tests to Machine Learning
The accurate assessment of time-series stationarity is fundamental to econometric analysis, yet conventional unit root tests, such as the Augmented Dickey–Fuller (ADF) and Phillips–Perron (PP) tests, are known to have limitations, including low power in distinguishing near-unit root processes from true-unit root processes and sensitivity to structural breaks [
25,
26,
27,
28,
31,
32,
33,
34,
37,
38,
39]. These limitations can lead to conflicting results and uncertainty in policy formulation. Consequently, a plethora of second-generation unit root tests have been developed to address issues like structural breaks (e.g., Fourier-based tests used by [
1,
3,
15,
16,
17,
18,
19,
20,
21,
22,
23,
24,
25,
26,
27,
28,
29,
31,
32,
33,
34,
38,
39]) and fractional integration [
17,
18], offering more nuanced perspectives on persistence.
Recently, machine learning (ML) techniques have emerged as a promising avenue for enhancing the robustness and power of unit root detection. While ML applications in broader ecological footprint contexts are beginning to appear—for instance, Ref. [
15] utilized ML-based estimates to conclude that the aggregate EF exhibits mean reversion—their specific application to develop more powerful and data-driven unit root tests for EF components, particularly the GLF, remains largely unexplored. ML-based unit root tests, such as the pseudo-composite approach utilizing XGBoost proposed by [
9] and adopted in this study, can synthesize information from a diverse array of conventional tests and time-series characteristics. This data-driven approach has the potential to overcome the misspecification issues and low power often associated with individual traditional tests by learning complex, non-linear relationships within the data. The methodology proposed and applied in our paper differs from existing approaches by not only focusing on the GLF across an extensive panel but also by explicitly employing an ML framework designed to improve the classification accuracy of series as stationary or non-stationary, thereby offering a novel contribution to both the EF literature and the field of applied time-series econometrics.
In summary, the extant literature confirms that while shock persistence in the EF and its various components has been investigated, the results are highly dependent on the component, country, and methodology. A distinct research gap exists for a dedicated, large-scale analysis of shock persistence specifically within the GLF using a consistent and robust methodological framework. Most studies rely on conventional or second-generation unit root tests, each with its own set of assumptions and limitations. Furthermore, despite the recognized potential of machine learning to enhance the power and robustness of unit root tests, its application to EF data, and particularly to the GLF for assessing shock persistence, remains unexplored.
Building upon the identified gap in the literature, this study aims to make a targeted contribution to understanding the dynamics of the grazing land footprint (GLF). This study represents the first application of a machine learning (ML)-based methodology for unit root detection in the specific field of GLF shock persistence across 92 countries. Our primary research question is whether the GLF in these nations is stationary. To answer that, we employ this advanced methodology to enhance the reliability of our assessment and subsequently discuss the profound implications of our findings for sustainable land management policy.
3. Data
This study tests the persistence of shocks to the grazing land footprint (GLF) for 92 countries from 1961 to 2022. The selection of the 92 countries for this study was determined entirely by data availability from the Global Footprint Network’s 2024 Open Data Platform. Countries were included if they possessed a continuous or near-continuous time series for the GLF across the entire 62-year period. Consequently, nations with significant data gaps, often smaller economies or those with historically less developed statistical systems, were excluded from the analysis.
The resulting sample of 92 countries, while constrained by data availability, is notable for its significant breadth and heterogeneity. It encompasses nations from every inhabited continent and represents a wide array of economic development levels—from high-income OECD members to emerging economies and low-income nations. Furthermore, the sample captures substantial ecological and geographical diversity, including countries with arid and semi-arid climates highly dependent on pastoralism, temperate nations with intensive agricultural systems, and those with vast, sparsely populated rangelands. This diversity is crucial, as it allows for a more robust and generalizable analysis of GLF dynamics than would be possible with a more homogenous sample, enabling the identification of patterns linked to specific economic, institutional, and environmental contexts. While the findings may be less generalizable to small island developing states or certain post-conflict nations where consistent data collection remains a challenge, the sample provides a strong basis for global inference. The data, measured in global hectares (Gha) per person, were gathered from the Global Footprint Network’s Open Data Platform. The time period and country selection were determined by data availability. For the analysis, we use the natural logarithm of the GLF series.
Descriptive statistics for the per-capita GLF series are presented in
Table S1 in the Supplementary Material. The analysis reveals profound global disparities, with national averages ranging dramatically. The data for most countries exhibit highly skewed distributions and significant kurtosis, indicating substantial deviations from normality. The Jarque–Bera test confirms this non-normality for nearly all countries.
The substantial cross-country heterogeneity in the GLF is not arbitrary; it is rooted in a complex interplay of structural socioeconomic and governance factors. A nation’s economic structure, technological capacity, and degree of market integration are primary determinants of its land-use patterns. Agrarian economies often exhibit a high per-capita GLF due to extensive pastoralism [
6], whereas industrialization can drive efficiency through intensification [
27]. However, this economic transition, coupled with market integration and shifting dietary preferences, can also amplify aggregate demand [
7]. The adoption of advanced agricultural technologies and sustainable management practices is thus critical for mediating these pressures by improving productivity per unit of land [
23]. Simultaneously, the institutional landscape—encompassing state intervention, land tenure systems, and regulatory quality—governs the sustainability of land use. Effective territorial management, backed by robust national planning and conservation bodies [
3,
4,
12,
13,
14,
15,
16,
17,
18,
19,
20,
25,
26,
27,
28,
31,
32,
33,
34,
37,
38,
39], fosters resilience, whereas weak governance can lead to unregulated resource use and persistent degradation [
33]. Crucially, a secure land tenure, whether individual or well-managed communal systems, provides the necessary incentives for long-term stewardship and investment in sustainable practices [
13]. These factors operate within the fundamental constraint of population density, which exhibits a clear inverse relationship with per-capita GLF [
34]. Sparsely populated nations can support extensive grazing, while high-density countries are compelled toward land-use intensification to meet demands [
38]. Ultimately, it is the complex interaction of these drivers that shapes territorial outcomes [
26]. A nation’s GLF pattern, and its resulting persistence or transience in response to shocks, is thus a reflection of its unique socioeconomic structure, institutional capacity, and demographic context.
The following figure provides an average per-capita GLF for the 92 countries.
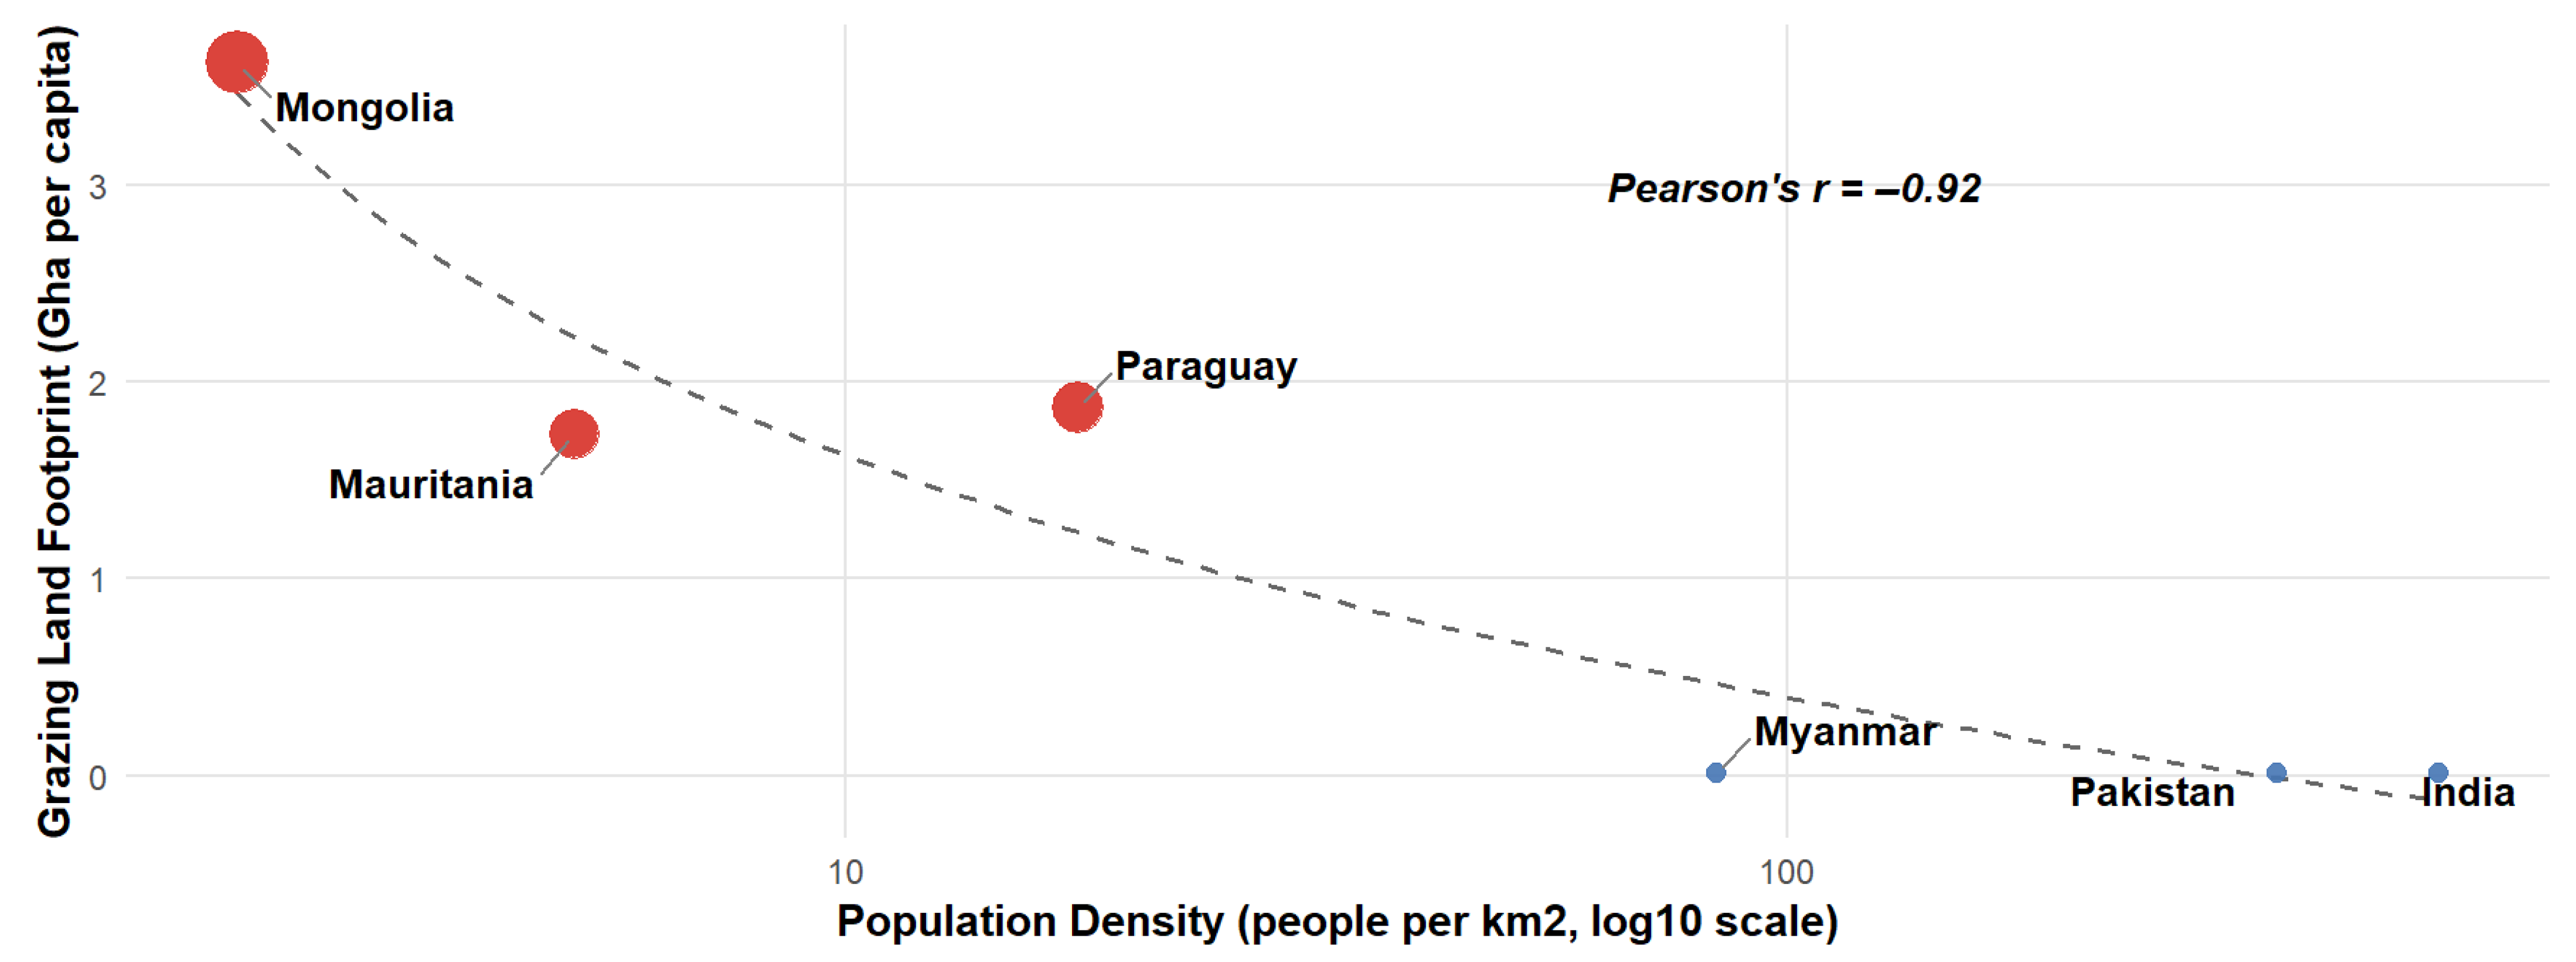
As shown in
Figure 2, countries such as Mongolia, Paraguay, and Mauritania exhibit exceptionally high per-capita land footprints. This phenomenon is largely attributable to a combination of their vast land areas, low population densities, and economies characterized by extensive primary production, including agriculture and resource extraction. For instance, in 2023, the population density was only 2.26 people per km
2 in Mongolia, 17.65 in Paraguay, and 5.16 in Mauritania [
39]. The following figure plots the population density for the countries with the highest and lowest per-capita land footprints to illustrate this relationship.
Figure 3 illustrates a clear inverse relationship between population density and the per-capita land footprint. Countries with low population densities, such as Mongolia, exhibit substantially higher land footprints per person. In contrast, densely populated nations like India demonstrate markedly lower per-capita footprints, suggesting that as the population density rises, the demand for land resources per individual tends to decrease. The Pearson correlation coefficient (r) for the relationship between population density and per-capita land footprint is reported as −0.92. This value indicates a very strong and negative linear association between the two variables. The negative sign signifies an inverse relationship, meaning that as the population density increases, the land footprint per capita systematically tends to decrease.
4. Econometric Methodology
Testing for a unit root is a prerequisite for time-series econometric analysis. Determining whether a series is stationary or contains a unit root is crucial for selecting the appropriate modeling approach and for understanding if the effects of shocks are temporary or persistent. Since the introduction of the Dickey–Fuller (1979) test, the literature has expanded to include numerous unit root tests [
25,
26,
27,
28,
31,
32,
33,
34,
37,
38,
39]. However, because these tests often yield conflicting results, practitioners face uncertainty when assessing a series’ stationarity.
The challenge of accurately identifying unit roots is particularly pronounced in the context of environmental and ecological time series. The grazing land footprint (GLF), for example, is influenced by a confluence of complex, interacting factors, including climatic variability, technological shifts, gradual policy changes, and sudden market shocks. Such ecological systems are often characterized by non-linear dynamics and structural variability, which can severely limit the efficacy of conventional unit root tests. These traditional tests may lack the statistical power to distinguish between a true unit root and a highly persistent stationary process, and they are susceptible to misspecification errors, particularly concerning the correct deterministic trend structure [
9].
To address this challenge, Ref. [
9] introduced a pseudo-composite machine learning (ML)-based methodology for unit root detection. The core of this approach is an Extreme Gradient Boosting (XGBoost) algorithm that synthesizes information from a diverse array of conventional unit root tests and supplementary time-series characteristics. The conceptual justification for this ML-based framework lies in its ability to overcome the inherent limitations of individual tests when applied to complex systems. By learning from a rich feature set, the model can identify the complex, non-linear, and sometimes disjoint relationships between different statistical measures that characterize a time series [
9]. Furthermore, the approach is agnostic towards the deterministic elements that must be pre-specified in traditional tests, thus closing off a common path for researcher-induced error. This data-driven, ensemble method is therefore particularly useful for analyzing the dynamics of complex ecological indicators like the GLF, as it provides a more robust and powerful classification of series according to their degree of stationarity. The framework is designed to improve accuracy and robustness by addressing the known limitations of conventional tests, such as their low power when the autoregressive parameter is close to unity and their sensitivity to the misspecification of deterministic components like drift or trend. The methodology comprises three key components: input features, the classifier model, and the decision framework.
First, the model uses a multifaceted set of input features systematically extracted from each time series. These features include a comprehensive suite of test statistics from nine prominent unit root and stationarity tests: Augmented Dickey–Fuller (ADF), Phillips–Perron (PP), Kwiatkowski–Phillips–Schmidt–Shin (KPSS), Pantula–Gonzalez–Frisch–Flores (PGFF), Breitung, Elliot–Rothenberg–Stock (ERS-d and ERS-p point optimal), Schmidt–Phillips (URSP), and Zivot–Andrews (URZA). This set combines tests with a null of a unit root (e.g., ADF) and a null of stationarity (KPSS), providing a balanced perspective. In addition to the test statistics, an array of supplementary time-series characteristics is integrated, computed from both the original series and its first difference. These encompass statistical moments, measures of autocorrelation, the variance ratio, series length, and more sophisticated metrics like the Hurst exponent or estimates of trend strength. This extensive feature set allows the model to discern complex statistical patterns by leveraging the complementary information inherent in different indicators and the intrinsic properties of the series.
Second, the classification task is performed using the XGBoost algorithm, an efficient and scalable implementation of gradient boosting. XGBoost iteratively constructs an ensemble of decision trees, where each new tree is trained to correct the errors of the preceding ensemble. This sequential refinement progressively minimizes a predefined loss function suitable for binary classification. To optimize predictive performance and mitigate overfitting, key hyperparameters of the XGBoost model—such as the learning rate, maximum tree depth, and subsampling ratios—are meticulously tuned through a rigorous grid search procedure, typically employing k-fold cross-validation on the training data.
Third, once trained, the XGBoost model yields a probabilistic score indicating the likelihood that a given time series contains a unit root. For hypothesis testing, a decision threshold (τ) is calibrated to ensure that the test’s empirical size aligns with a specified nominal Type I error rate (α), thereby equating its specificity to (1 − α). Consequently, a series is classified as having a unit root if its predicted probability exceeds this calibrated threshold. A key advantage of this ML-based approach is its data-driven capacity to discern complex, non-linear relationships between features and to implicitly manage the specification of deterministic components. This capability mitigates a common source of error in traditional unit root testing protocols, often resulting in enhanced statistical power while maintaining nominal size control.
Although machine learning models such as XGBoost are sometimes regarded as “black boxes”, the interpretability of the models may be improved by utilizing feature significance measures. In the original study conducted by [
9], the KPSS test statistic, the ADF test statistic, and the variance ratio were the most influential features for unit root classification. Additionally, summary time-series characteristics, including autocorrelation coefficients and skewness of the first-differenced series, were considered. Thus, the XGBoost model prioritized characteristics that reflected the series’ fundamental statistical traits and the results of conventional unit root tests. The interpretability of the classification findings is improved by the implementation of such a feature ranking, which offers a view of the features that most strongly indicated stationarity or non-stationarity for the GLF time series.
Given the relatively short time series for each country (62 observations), addressing the risk of overfitting and validating the model’s performance is crucial. It is important to clarify that this study applies a pre-trained model from [
9]; we do not train the model on our limited GLF data. The original model was trained and validated on a massive, simulated dataset of 500,000 time series with varying lengths and characteristics. This process ensures that the model learned the generalizable features of stationary versus non-stationary processes, rather than overfitting to the noise of any single, short series. Furthermore, the training of the XGBoost model itself incorporated standard techniques to prevent overfitting, including k-fold cross-validation for hyperparameter tuning, regularization via a low learning rate (shrinkage), and subsampling of both features and observations in each boosting iteration. The performance of this pre-trained model was rigorously validated in its original study. As presented by [
9], the model achieves high accuracy (~85%) and demonstrates a significantly greater statistical power (sensitivity) than any of the nine individual conventional tests it incorporates, all while correctly maintaining the nominal Type I error rate (specificity). These established metrics provide confidence in the model’s robust application to our dataset.
The overall workflow is illustrated in
Figure 4.
5. Empirical Findings
In this study, we employ a machine learning (ML)-based unit root testing technique to evaluate the persistence of shocks to the grazing land footprint (GLF). This provides a rigorous examination of the stochastic characteristics of the GLF for a global sample of 92 nations from 1961 to 2022. The empirical findings, which reveal a mix of stationarity and non-stationarity across countries, offer critical insights for sustainability policy, the study of ecological footprint dynamics, and methodological advancement.
As discussed previously, conventional unit root tests often produce conflicting outcomes for the same series due to issues such as low statistical power. To illustrate this, we present the results from the nine conventional tests that form the basis of our ML model in
Table S2 in the Supplementary Material. The time-series properties of the per-capita GLF are complex and vary significantly. For example, for Colombia, most tests indicate stationarity, yet for Denmark, the results are split. These conflicting outcomes highlight the difficulty researchers face in reaching a definitive conclusion about stationarity using these methods alone.
The definitive results from our ML-based unit root test are presented in
Figure 5 (
Table S2 in the Supplementary Material provides a classification list of all 92 countries in our sample along with their final classification (“stationary” or “non-stationary”) based on the 5% significance level).
The machine learning-based unit root test reveals that the GLF is stationary in nations such as Norway, Germany, and Canada. This stationarity suggests that shocks to grazing pressure have primarily transitory effects, with the system being likely to revert to a long-term equilibrium. This implies that the ecological systems in these nations are resilient, which is likely the result of strong institutional frameworks, rigorous environmental management, and a moderate grazing intensity. In such circumstances, oscillations can be efficiently managed without the need for permanent structural changes by short- to medium-term interventions, such as seasonal grazing limitations, rotational pasture usage, or subsidies for sustainable livestock feed. Additionally, these nations may capitalize on ongoing investments in environmental monitoring technology and market-based incentives to encourage sustainable behaviors. This pattern is consistent with prior findings for certain EF sub-components in other contexts [
1,
3,
4,
11,
12,
13,
14,
15,
16,
17,
18,
19,
20,
21,
22,
23,
24,
25,
26,
27,
28,
29,
31,
32,
33,
34,
37,
38,
39] and suggests that short-term interventions may be effective for sustainable land management in these countries.
Conversely, the finding that the GLF is non-stationary in most other nations underscores a concerning trend. This non-stationarity indicates that shock persistence is the dominant feature; shocks have permanent and cumulative consequences, potentially leading to a persistent increase in the demand for land resources. This aligns with broader findings in the literature regarding the non-stationary nature of other EF components, such as the carbon, forest product, and built-up land footprints [
1,
3,
15,
16,
17,
18,
19,
20,
21,
22,
23,
24,
25,
26,
27,
28,
32,
33,
34]. This highlights the essential need for profound structural reforms and long-term sustainability measures in nations with a non-stationary GLF characterized by high shock persistence.
The findings on GLF persistence present an interesting contrast when compared to other major ecological footprint components documented in the literature. Whilst components such as the carbon and forest product footprints are frequently observed to be predominantly non-stationary across numerous nations [
15,
16,
17,
25,
26,
27,
28,
32,
33,
34], our findings suggest a subset of (primarily OECD) countries where the GLF demonstrates stationarity and thus enhanced resilience. Conversely, the widespread non-stationarity of the GLF in many developing countries in our sample mirrors the persistent challenges observed with the carbon footprint globally, and it diverges somewhat from the more mixed stationarity findings often reported for cropland footprints [
29], suggesting unique vulnerabilities in grazing land management for these nations.
Our findings can be interpreted in a variety of ways. Initially, the rich heterogeneity of our 92-country sample allows for a nuanced interpretation of the findings, revealing clear patterns linked to distinct regional, economic, and ecological profiles. GLF stationarity appears more prevalent in countries with modest population pressures and robust environmental control. For instance, Norway and Finland, which are acknowledged for their environmental sustainability [
15], have a stationary GLF, which implies that resilience may be enhanced by sustainable land management methods and good environmental regulations. Conversely, non-stationarity is predominant in nations facing a confluence of challenges, including those with substantial natural resource constraints, weaker regulatory enforcement, or economies heavily reliant on extensive grazing. This highlights how the broad scope of our sample—capturing this full spectrum from well-resourced, stable economies to those under significant environmental and institutional stress—is critical for understanding the underlying drivers of GLF persistence. In addition, the findings that sparsely populated nations with land-intensive economies (e.g., Mongolia) have particularly high per-capita footprints are corroborated by the negative link between population density and the GLF. This outcome is consistent with [
36], which emphasizes the continuous demand for grazing resources that is generated by the widespread presence of livestock-based economies. It also emphasizes the necessity of a variety of policy approaches that address the underlying structural economic factors.
Our findings offer unambiguous patterns that may be used to guide typological classifications of GLF dynamics in addition to a regional synthesis of the unit root test results. The majority of OECD nations, including Norway, Germany, France, Japan, and Canada, demonstrate stationary GLF behavior, which implies a potential for self-correction in response to ecological shocks. This is most likely the consequence of balanced livestock demands, efficient enforcement measures, and modern grazing infrastructure.
Conversely, several developing economies in Sub-Saharan Africa and Central Asia—including Ethiopia, Sudan, Pakistan, Afghanistan, and Mongolia—display a non-stationary GLF. This persistence may be attributed to underlying structural weaknesses, such as conflict-related resource mismanagement, high livestock numbers, inadequate institutional capability, and dry and semi-arid climates. In such environments, ecological deterioration caused by overgrazing is not self-correcting, necessitating long-term, structural policy interventions. In Mongolia, for instance, the necessity of institutional reform in the context of land tenure systems and the encouragement of rotational grazing through community-based cooperatives is indicated by the recurring grazing pressure, which is further exacerbated by climate variability and desertification. In order to stabilize the GLF trajectory in Sudan and Afghanistan, it is imperative to implement post-conflict resource governance reforms, integrated water management, and ongoing land restoration.
A mixed trend is evident in resource-intensive rising economies. Non-stationarity is evident in countries such as Brazil, China, and India, which are characterized by intensive land usage, evolving food choices, and fast agricultural expansion. The Amazon Basin’s deforestation and pasture growth in Brazil have led to recurring ecological shocks. Grazing land management must be aligned with climate-smart agriculture and forest conservation in order to ensure that policy responses are integrated with larger land-use and deforestation plans. In China, the increased protein demand has resulted in long-term alterations in grazing land usage due to livestock intensification and land conversion. This has necessitated the implementation of national-level pasture conservation rules and integrated land monitoring systems. On the other hand, the Middle Eastern and North African (MENA) nations exhibit non-stationarity, which is likely a result of their limited arable land and climatic susceptibility. This geographical heterogeneity implies that the temporal responses of GLFs to shocks are influenced by both spatial ecology and socioeconomic development levels.
These results substantiate a classification of nation groups based on their persistence profiles. (1) Stable and responsive systems (stationary GLF, e.g., OECD nations), (2) vulnerable and persistent systems (non-stationary GLF, e.g., low-income desert countries), and (3) transitional systems (mixed dynamics, e.g., emerging economies with ecological pressures) are broad categories into which countries can be classified. This typology is further elaborated upon in the succeeding policy section to provide customized sustainability routes.
In order to improve the relevance of policies, transitional systems might be further subdivided into two main groups. The initial subgroup comprises emerging economies that have made strides in environmental governance and institutional capacity, including Brazil, China, and India. Recent land-use regulations, afforestation initiatives, and investments in sustainable agriculture suggest a potential transition to ecological resilience. The second subgroup is composed of emerging economies that are confronted with persistent structural constraints. These constraints are characterized by weak institutional frameworks, a limited environmental enforcement capacity, and ongoing ecological degradation, which are frequently exacerbated by poverty, conflict, or governance challenges. Examples include Afghanistan, Pakistan, and Sudan, where the effective execution of policies is impeded by resource mismanagement and sociopolitical instability. Despite the fact that both groupings now exhibit non-stationary GLF dynamics, this distinction underscores the likelihood of a substantial divergence in their policy demands and future trajectories.
The consequences of these findings extend beyond environmental resilience to the sustainability of economic production systems. Countries that fail to manage land-use demands within regenerative limits risk undermining the natural capital base required for sustained economic development. As [
4,
21] demonstrate, the unbridled expansion of agricultural and grazing activities can lead to ecological debt and long-term productivity losses. Achieving sustainable economic growth therefore requires establishing an environmentally aware production model that harmonizes land-use planning, consumption intensity, and resource regeneration. This is consistent with the ecological modernization literature’s call for decoupling economic activity from resource exploitation [
2,
4,
5,
6,
7,
8,
9,
10,
11,
12,
13,
14,
15,
25,
26,
27,
28,
31,
32,
33,
34,
36,
37,
38,
39,
40].
From a methodological perspective, this paper represents a substantial advancement in EF research by applying the XGBoost-based ML unit root test of [
9] to an environmental indicator. This approach mitigates the disadvantages of traditional unit root tests, such as their limited sensitivity to near-unit-root processes and their susceptibility to misspecification. The stark contrast between the conflicting results of the conventional tests (
Table S2) and the definitive outcome of the ML-based test underscores the value of hybrid statistical–ML approaches in ecological time-series analysis.
6. Conclusions
This study utilizes a machine learning-enhanced unit root framework to examine the stochastic features of the grazing land footprint (GLF) across a diverse array of nations, contributing to the expanding literature on environmental sustainability. The empirical findings reveal a critical dichotomy: the GLF is stationary for a subset of countries, which implies that environmental shocks have only transitory effects and that existing land-use planning and management systems may possess a degree of inherent resilience. For the majority, however, the GLF is non-stationary, a finding that indicates ecological disruptions have permanent and potentially irreversible impacts, underscoring the urgent need for proactive and transformative land-use planning interventions.
A category-based framework is established by converting the economic results into typological policy suggestions. Short-term policy actions, such as rotational grazing plans and seasonal land-use modifications, may be sufficient to manage land resources in the countries that are the subject of the GLF series (primarily OECD countries). Policies should prioritize the preservation of an ecological balance through adaptive regulation, targeted subsidies, and monitoring.
Transformative policy adjustments are necessary for the structurally vulnerable nations that have a non-stationary GLF. These modifications should encompass the revision of agricultural subsidies that promote overgrazing, the reinforcement of land-use restrictions, and the investment in resilient pasture systems. In addition, the integration of land-based indicators such as the GLF into more comprehensive climate policy frameworks can assist in the alignment of ecological sustainability with climate objectives. Lastly, the final group of nations (transitional; Brazil, China, India) must integrate GLF issues into agricultural intensification and climate mitigation policies, therefore aligning ecological stability aims with larger economic modernization. This typology provides a scalable method of policy differentiation that is predicated on the persistence qualities of ecological indicators.
The findings of this study have significant implications for strategic land-use planning. The determination of GLF stationarity provides a crucial diagnostic for tailoring planning interventions: nations with a stationary GLF may leverage adaptive planning and targeted management practices, whereas those with a non-stationary GLF necessitate more fundamental reforms in land-use policies, including stricter regulations on land conversion, incentives for sustainable grazing, and the integration of GLF dynamics into broader climate adaptation and mitigation plans. Effective territorial planning, informed by the persistence characteristics of ecological indicators like the GLF, is therefore indispensable for reconciling development pressures with the imperative of long-term environmental sustainability and resilience.
In the context of transitional systems, policy actions should be reflective of the institutional framework: Capacity-building programs, technical assistance, and green financing may be advantageous for emerging reform-oriented countries to consolidate environmental gains. Conversely, structurally constrained nations necessitate international support, governance reforms, and institution-building as prerequisites for sustainable land management enhancements.
The results also suggest that the sustainability of economic growth is contingent not only on macroeconomic indicators but also on the ecological viability of production systems. This research substantiates the view that current grazing land-use patterns in many nations are unsustainable, posing long-term risks to environmental integrity, rural livelihoods, and food security. As emphasized by [
25,
40], robust environmental accounting frameworks like the GLF are necessary to align production with sustainability targets. By using these frameworks, policymakers can work to reconcile ecological limits with economic objectives, ensuring that growth is both productive and sustainable over the long term.
The global heterogeneity in GLF dynamics, revealed through our analysis of a diverse 92-country sample, underscores that a one-size-fits-all strategy for ecological sustainability is inadequate. By encompassing a wide spectrum of ecological, economic, and institutional contexts, this study provides a more globally representative assessment of GLF persistence, strengthening the case for context-specific policy solutions. Assisting nations that face ongoing ecological deterioration will require international collaboration, capacity building, and technology transfer. Future research could build upon this study by investigating causal mechanisms, integrating regional spillover effects, and forecasting GLF trends under various socioeconomic scenarios. In conclusion, our investigation confirms that achieving sustainable development requires an understanding of the temporal dynamics of ecological footprints—a necessity for both policy and practice.
Finally, these results highlight the importance of methodological innovation in environmental economics. This study demonstrates the superior diagnostic capability of data-driven methods, like the machine learning-based unit root test, in identifying complex patterns in ecological indicators. This underscores the need for greater institutional support to advance the data infrastructure and analytical capacity, particularly in nations with less developed statistical systems.


